
Lightweight Deep Learning Model for Assessment of Substitution Voicing and Speech after Laryngeal Carcinoma Surgery

 , ,
, ,
Abstract
:Simple Summary
Abstract
1. Introduction
2. State of the Art Analysis
3. Materials and Methods
3.1. Clinical Evaluation and Equipment
3.2. Dataset
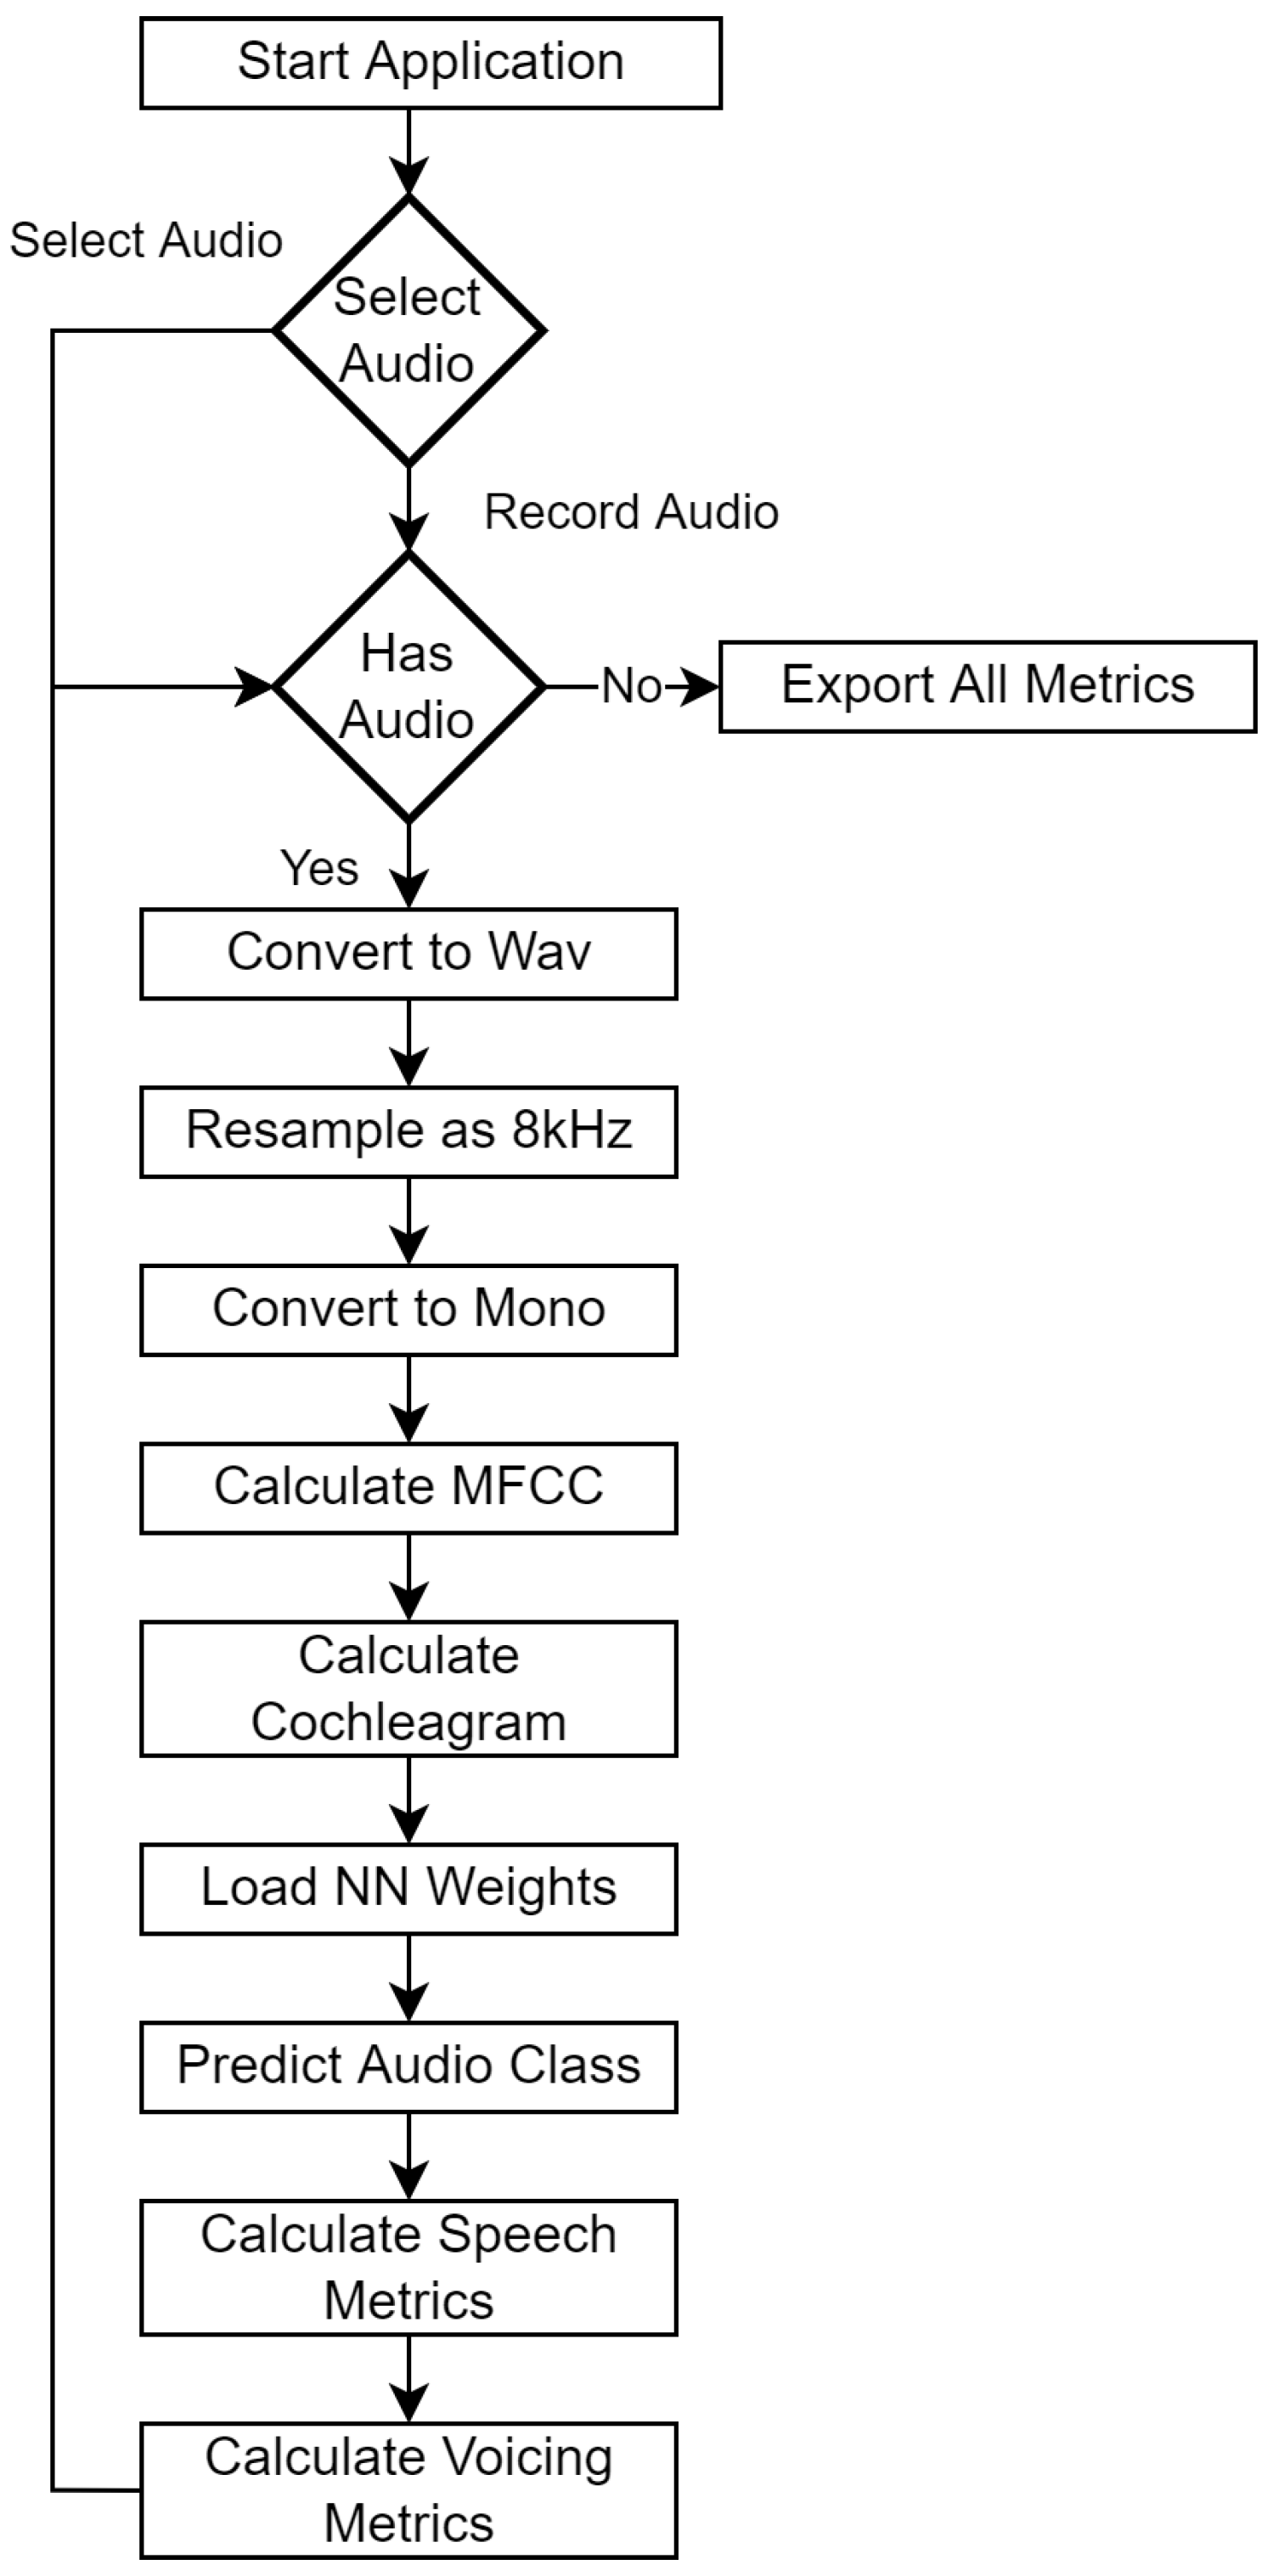
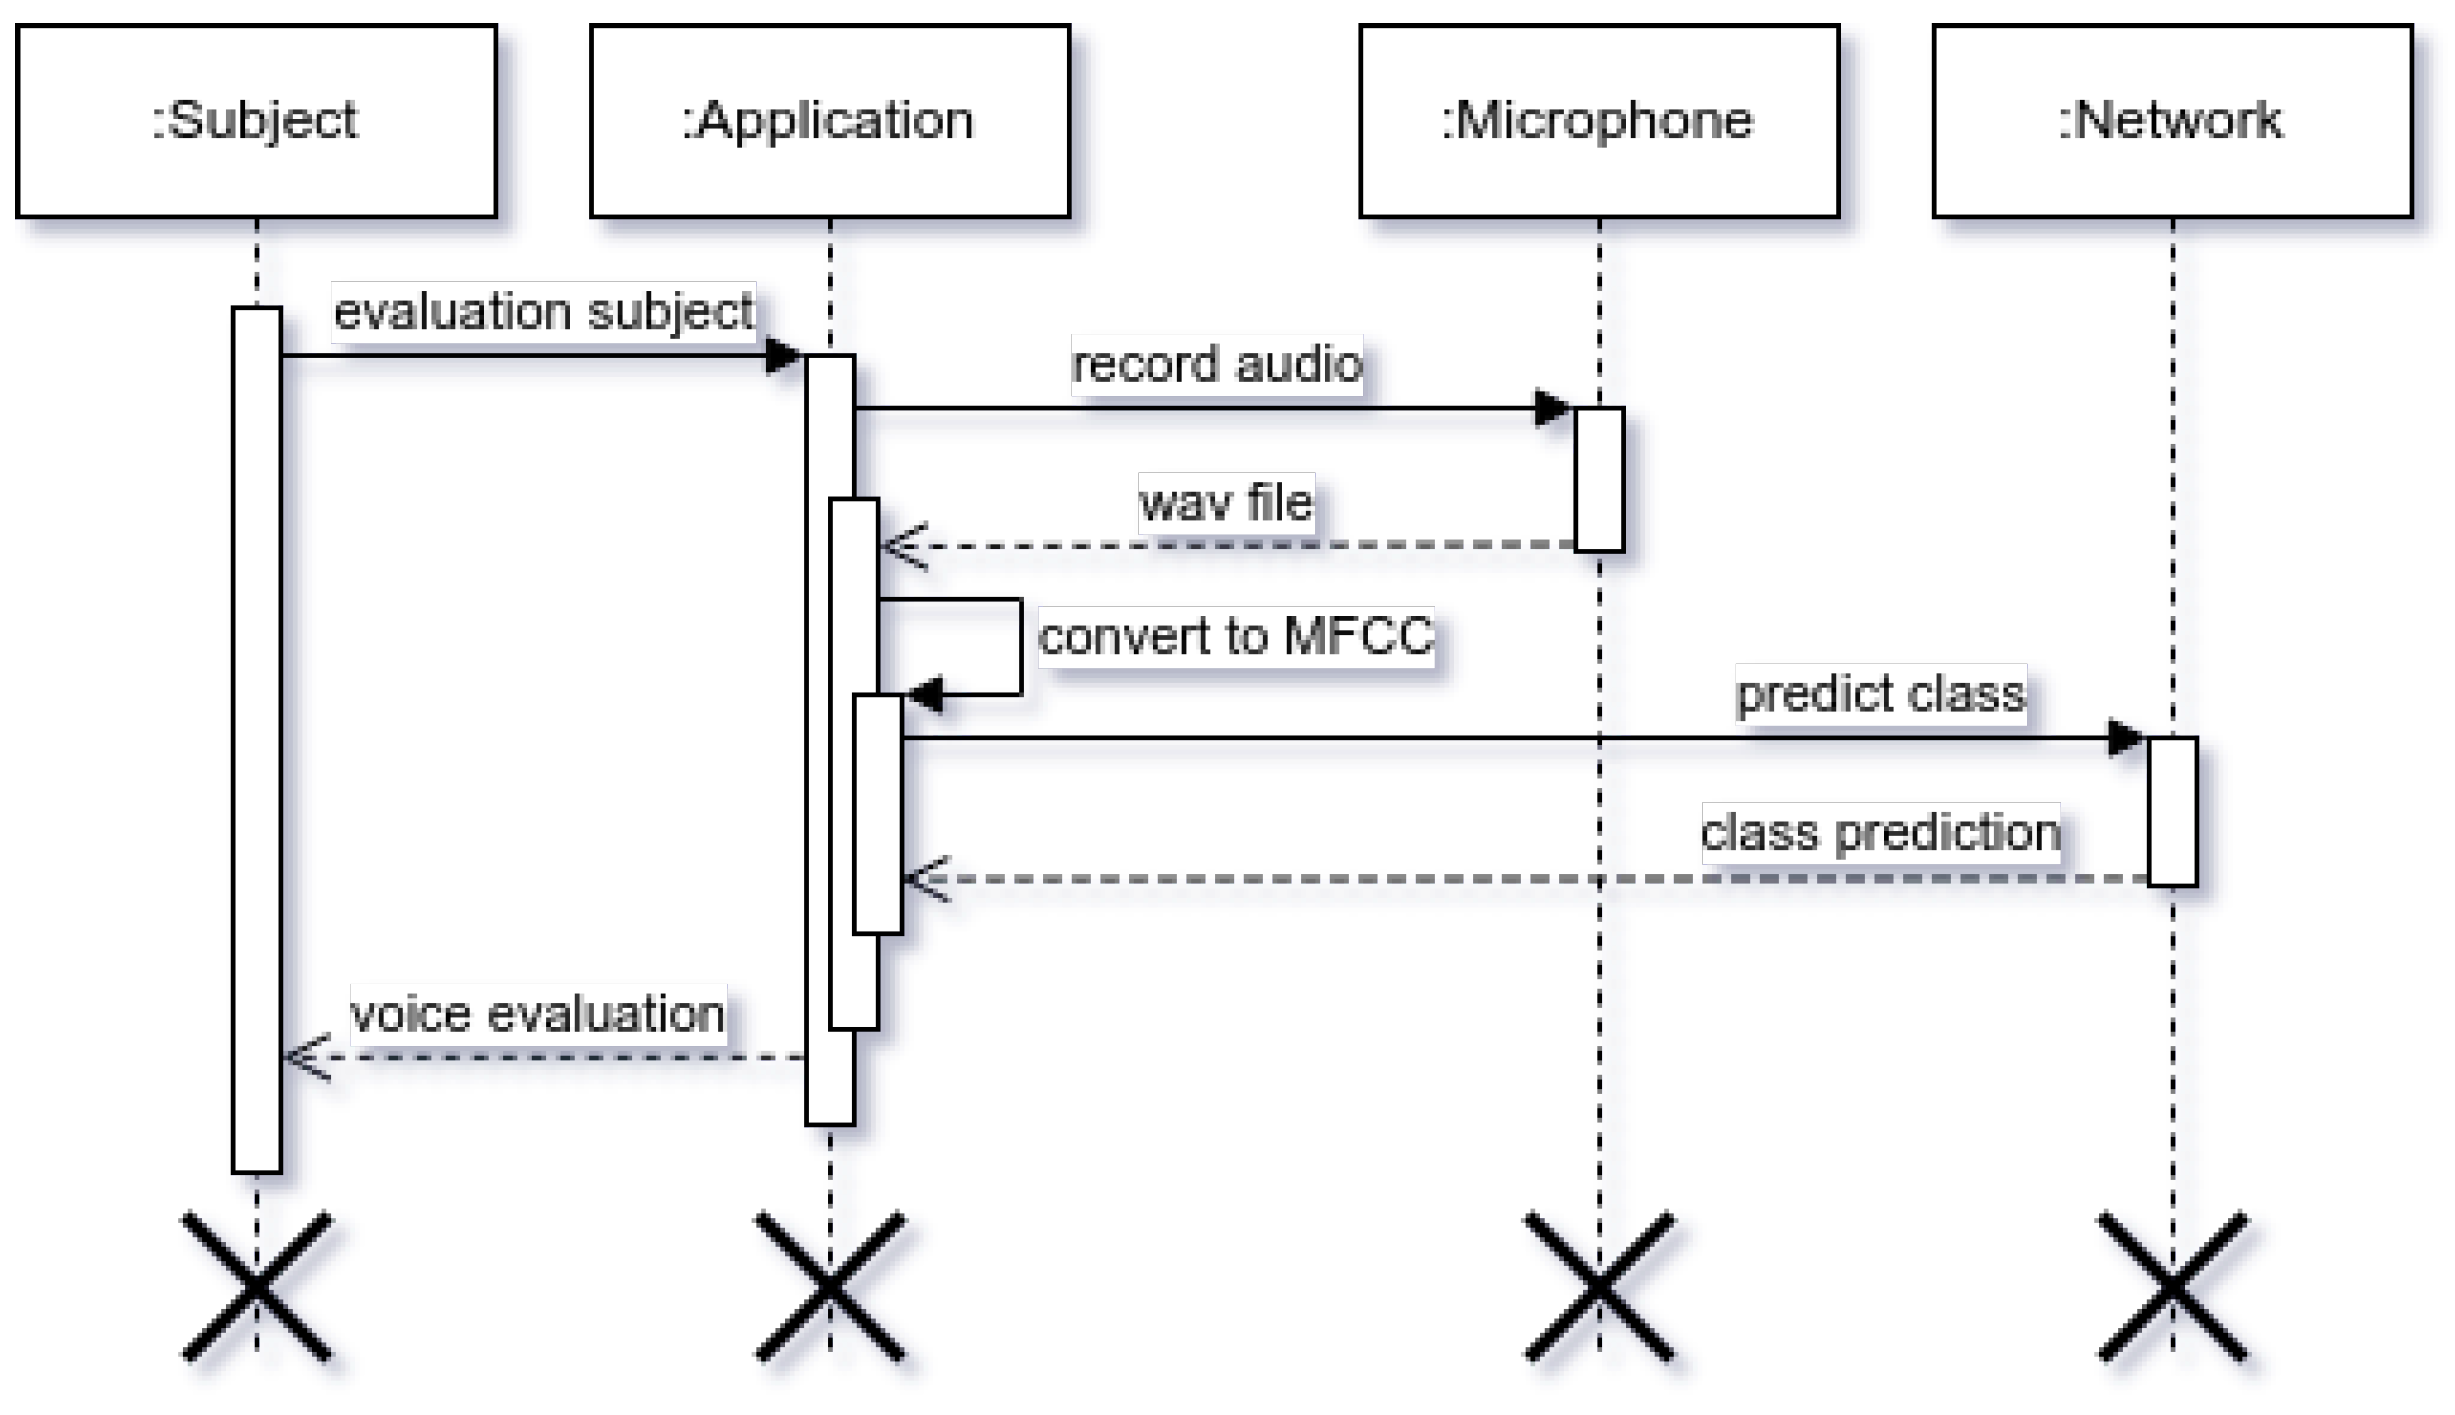
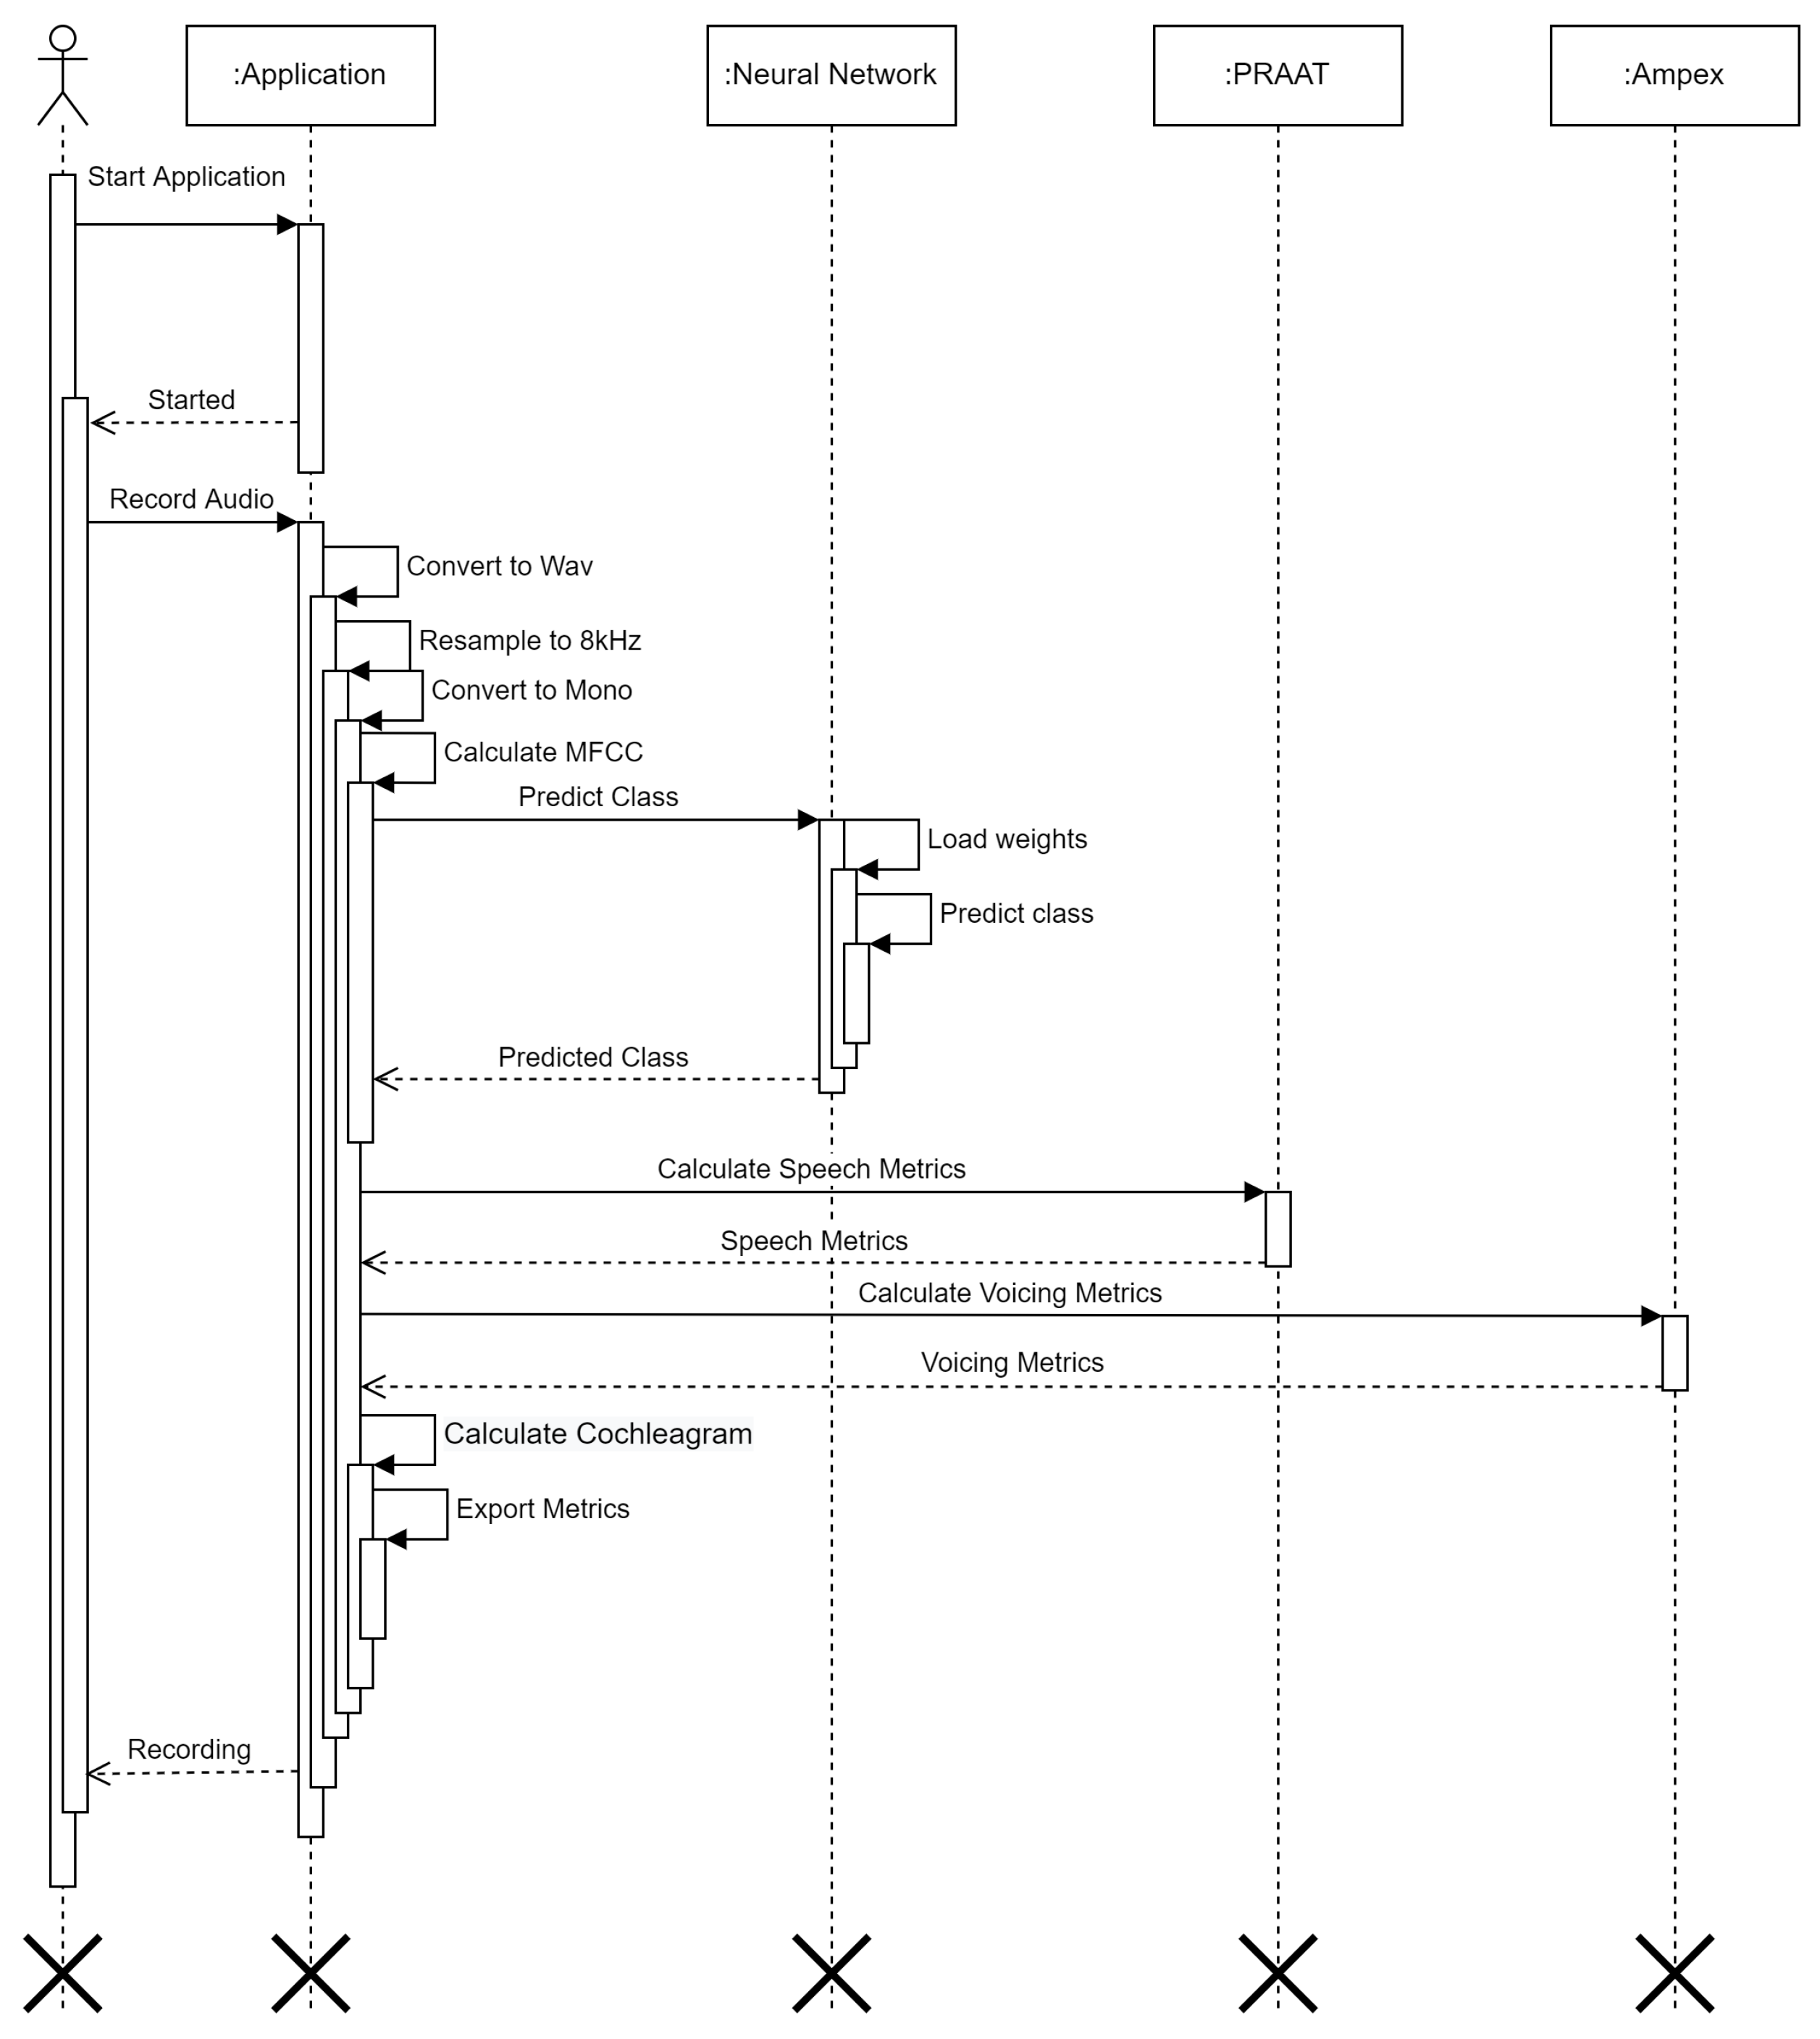
3.3. Data Analysis
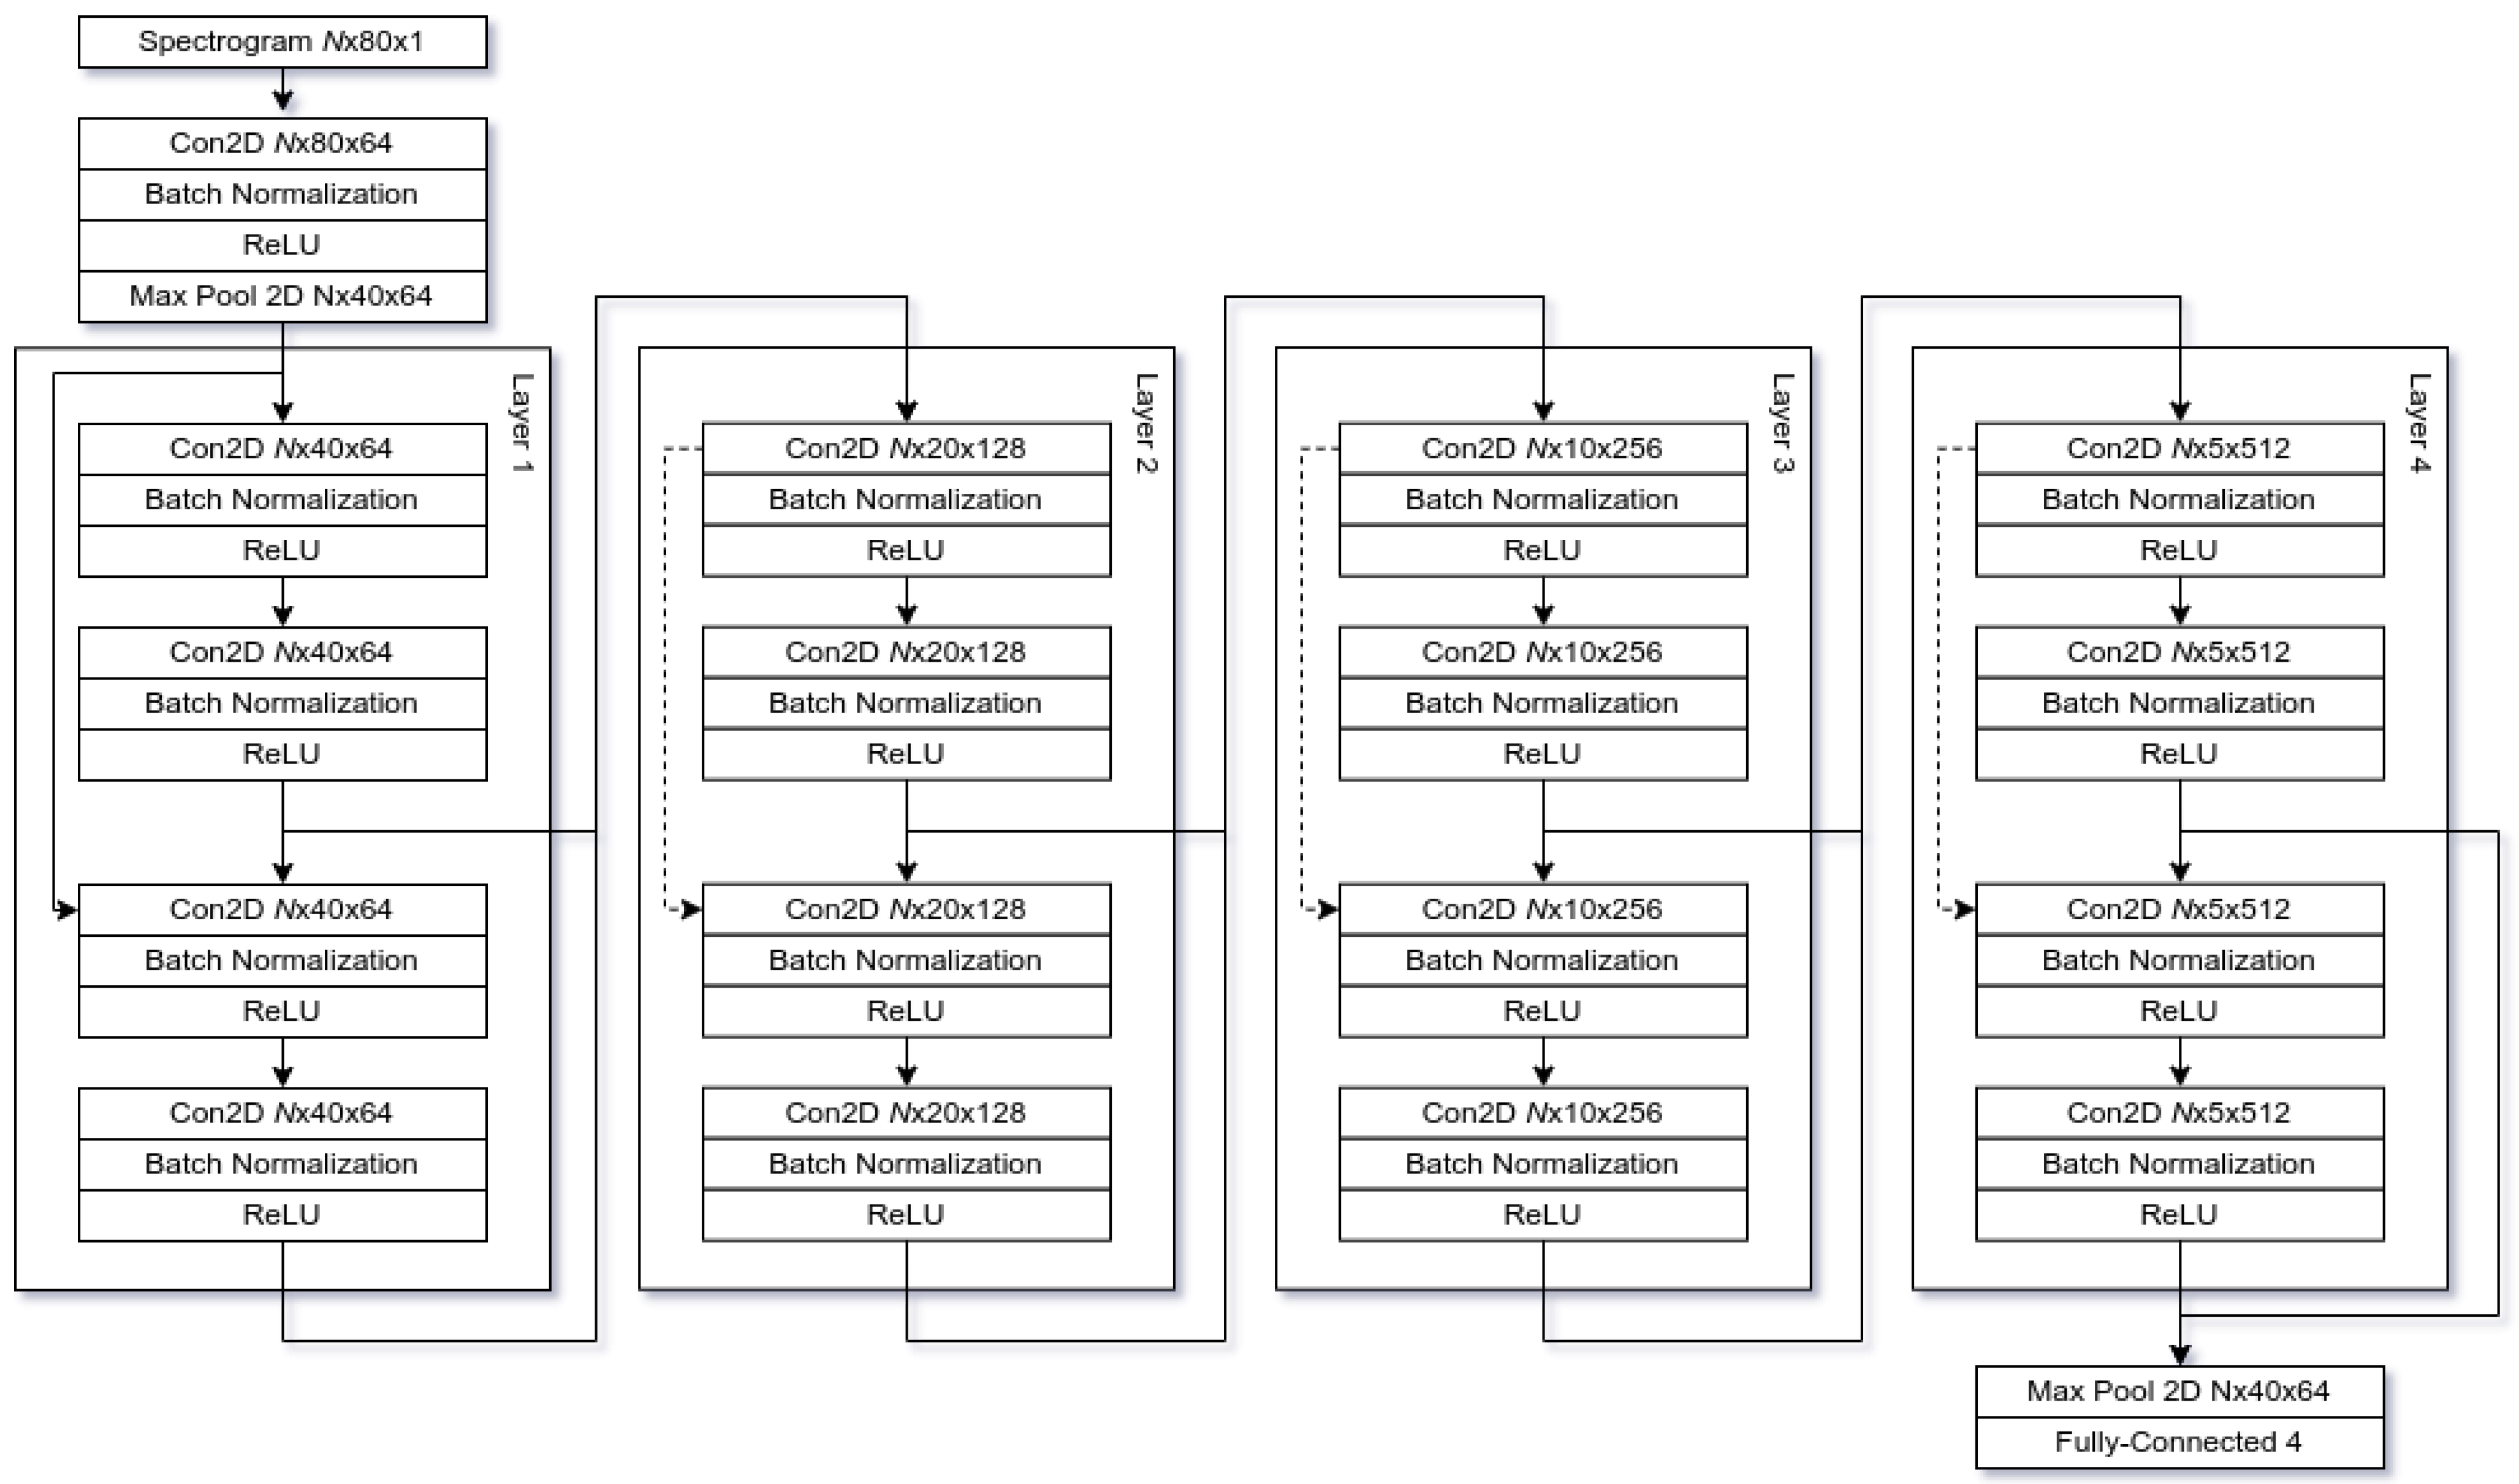
3.4. Architecture
3.5. Implementation
4. Experimental Evaluation and Results
4.1. Setup
4.2. Metrics
4.3. Results
5. Discussion
6. Conclusions
Author Contributions
Funding
Institutional Review Board Statement
Informed Consent Statement
Data Availability Statement
Conflicts of Interest
References
- Steuer, C.E.; El-Deiry, M.; Parks, J.R.; Higgins, K.A.; Saba, N.F. An update on larynx cancer. CA A Cancer J. Clin. 2017, 67, 31–50. [Google Scholar] [CrossRef] [PubMed] [Green Version]
- Sass, V.; Gadeyne, S. Social Disparities in Survival from Head and Neck Cancers in Europe. In Social Environment and Cancer in Europe; Launoy, G., Zadnik, V., Coleman, M.P., Eds.; Springer International Publishing: Berlin/Heidelberg, Germany, 2021; pp. 141–158. [Google Scholar] [CrossRef]
- American Cancer Society. Key Statistics for Laryngeal and Hypopharyngeal Cancers. Cancer.org 2022. Available online: https://www.cancer.org/cancer/laryngeal-and-hypopharyngeal-cancer/about/key-statistics.html (accessed on 20 January 2022).
- Groome, P.A.; O’Sullivan, B.; Irish, J.C.; Rothwell, D.M.; Schulze, K.; Warde, P.R.; Schneider, K.M.; Mackenzie, R.G.; Hodson, D.I.; Hammond, J.A.; et al. Management and Outcome Differences in Supraglottic Cancer Between Ontario, Canada, and the Surveillance, Epidemiology, and End Results Areas of the United States. J. Clin. Oncol. 2003, 21, 496–505. [Google Scholar] [CrossRef] [PubMed] [Green Version]
- Anthony Jnr, B. Implications of telehealth and digital care solutions during COVID-19 pandemic: A qualitative literature review. Inf. Health Soc. Care 2021, 46, 68–83. [Google Scholar] [CrossRef] [PubMed]
- Sharifi, M.; Asadi-Pooya, A.A.; Mousavi-Roknabadi, R.S. Burnout among Healthcare Providers of COVID-19; a Systematic Review of Epidemiology and Recommendations. Arch. Acad. Emerg. Med. 2021, 9, e7. [Google Scholar] [CrossRef]
- Moerman, M.; Martens, J.P.; Dejonckere, P. Multidimensional assessment of strongly irregular voices such as in substitution voicing and spasmodic dysphonia: A compilation of own research. Logop. Phoniatr. Vocol. 2015, 40, 24–29. [Google Scholar] [CrossRef]
- Semple, C.; Parahoo, K.; Norman, A.; McCaughan, E.; Humphris, G.; Mills, M. Psychosocial interventions for patients with head and neck cancer. Cochrane Database Syst. Rev. 2013. [Google Scholar] [CrossRef] [Green Version]
- Kumar, V.; Singh, D.; Kaur, M.; Damaševičius, R. Overview of Current State of Research on the Application of Artificial Intelligence Techniques for COVID-19. PeerJ Comput. Sci. 2021, 7, 1–34. [Google Scholar] [CrossRef]
- Thomas, A.; Manchella, S.; Koo, K.; Tiong, A.; Nastri, A.; Wiesenfeld, D. The impact of delayed diagnosis on the outcomes of oral cancer patients: A retrospective cohort study. Int. J. Oral Maxillofac. Surg. 2021, 50, 585–590. [Google Scholar] [CrossRef]
- Noel, C.W.; Li, Q.; Sutradhar, R.; Eskander, A. Total Laryngectomy Volume During the COVID-19 Pandemic: Looking for Evidence of Stage Migration. JAMA Otolaryngol. Neck Surg. 2021, 147, 909. [Google Scholar] [CrossRef]
- Singh, A.; Bhardwaj, A.; Ravichandran, N.; Malhotra, M. Surviving COVID-19 and multiple complications post total laryngectomy. BMJ Case Rep. CP 2021, 14, e244277. [Google Scholar] [CrossRef]
- Pereira da Silva, A.; Feliciano, T.; Vaz Freitas, S.; Esteves, S.; Almeida e Sousa, C. Quality of Life in Patients Submitted to Total Laryngectomy. J. Voice 2015, 29, 382–388. [Google Scholar] [CrossRef] [PubMed]
- Zilcha-Mano, S.; Goldstein, P.; Dolev-Amit, T.; Ben David-Sela, T.; Barber, J.P. A randomized controlled trial for identifying the most suitable treatment for depression based on patients’ attachment orientation. J. Consult. Clin. Psychol. 2021, 89, 985–994. [Google Scholar] [CrossRef] [PubMed]
- Brook, I.; Goodman, J.F. Tracheoesophageal Voice Prosthesis Use and Maintenance in Laryngectomees. Int. Arch. Otorhinolaryngol. 2020, 24, e535–e538. [Google Scholar] [CrossRef] [PubMed] [Green Version]
- Mattys, S.L.; Davis, M.H.; Bradlow, A.R.; Scott, S.K. Speech recognition in adverse conditions: A review. Lang. Cogn. Process. 2012, 27, 953–978. [Google Scholar] [CrossRef]
- Uscher-Pines, L.; Sousa, J.; Raja, P.; Mehrotra, A.; Barnett, M.L.; Huskamp, H.A. Suddenly Becoming a “Virtual Doctor”: Experiences of Psychiatrists Transitioning to Telemedicine During the COVID-19 Pandemic. Psychiatr. Serv. 2020, 71, 1143–1150. [Google Scholar] [CrossRef] [PubMed]
- Hossain, M.S.; Muhammad, G.; Alamri, A. Smart healthcare monitoring: A voice pathology detection paradigm for smart cities. Multimed. Syst. 2019, 25, 565–575. [Google Scholar] [CrossRef]
- Cummins, N.; Baird, A.; Schuller, B.W. Speech analysis for health: Current state-of-the-art and the increasing impact of deep learning. Methods 2018, 151, 41–54. [Google Scholar] [CrossRef]
- Lee, J.Y. Experimental Evaluation of Deep Learning Methods for an Intelligent Pathological Voice Detection System Using the Saarbruecken Voice Database. Appl. Sci. 2021, 11, 7149. [Google Scholar] [CrossRef]
- Al-Dhief, F.T.; Latiff, N.M.A.; Malik, N.N.N.A.; Salim, N.S.; Baki, M.M.; Albadr, M.A.A.; Mohammed, M.A. A Survey of Voice Pathology Surveillance Systems Based on Internet of Things and Machine Learning Algorithms. IEEE Access 2020, 8, 64514–64533. [Google Scholar] [CrossRef]
- Barsties, B.; De Bodt, M. Assessment of voice quality: Current state-of-the-art. Auris Nasus Larynx 2015, 42, 183–188. [Google Scholar] [CrossRef]
- Awan, S.N.; Roy, N.; Dromey, C. Estimating dysphonia severity in continuous speech: Application of a multi-parameter spectral/cepstral model. Clin. Linguist. Phon. 2009, 23, 825–841. [Google Scholar] [CrossRef] [PubMed]
- Maryn, Y.; De Bodt, M.; Roy, N. The Acoustic Voice Quality Index: Toward improved treatment outcomes assessment in voice disorders. J. Commun. Disord. 2010, 43, 161–174. [Google Scholar] [CrossRef] [PubMed]
- Barsties v. Latoszek, B.; Mathmann, P.; Neumann, K. The cepstral spectral index of dysphonia, the acoustic voice quality index and the acoustic breathiness index as novel multiparametric indices for acoustic assessment of voice quality. Curr. Opin. Otolaryngol. Head Neck Surg. 2021, 29, 451–457. [Google Scholar] [CrossRef]
- Lee, J.M.; Roy, N.; Peterson, E.; Merrill, R.M. Comparison of Two Multiparameter Acoustic Indices of Dysphonia Severity: The Acoustic Voice Quality Index and Cepstral Spectral Index of Dysphonia. J. Voice 2018, 32, 515-e1. [Google Scholar] [CrossRef] [PubMed]
- van Sluis, K.E.; van Son, R.J.J.H.; van der Molen, L.; MCGuinness, A.J.; Palme, C.E.; Novakovic, D.; Stone, D.; Natsis, L.; Charters, E.; Jones, K.; et al. Multidimensional evaluation of voice outcomes following total laryngectomy: A prospective multicenter cohort study. Eur. Arch.-Oto-Rhino-Laryngol. 2020, 278, 1209–1222. [Google Scholar] [CrossRef]
- Manfredi, C.; Giordano, A.; Schoentgen, J.; Fraj, S.; Bocchi, L.; Dejonckere, P. Validity of jitter measures in non-quasi-periodic voices. Part II: The effect of noise. Logop. Phoniatr. Vocol. 2011, 36, 78–89. [Google Scholar] [CrossRef]
- Dejonckere, P.H.; Moerman, M.B.J.; Martens, J.P.; Schoentgen, J.; Manfredi, C. Voicing quantification is more relevant than period perturbation in substitution voices: An advanced acoustical study. Eur. Arch.-Oto-Rhino-Laryngol. 2012, 269, 1205–1212. [Google Scholar] [CrossRef] [Green Version]
- Muhammad, G.; Alhamid, M.; Hossain, M.; Almogren, A.; Vasilakos, A. Enhanced Living by Assessing Voice Pathology Using a Co-Occurrence Matrix. Sensors 2017, 17, 267. [Google Scholar] [CrossRef]
- Jiang, J.; Li, Y. Review of active noise control techniques with emphasis on sound quality enhancement. Appl. Acoust. 2018, 136, 139–148. [Google Scholar] [CrossRef] [Green Version]
- Avila, A.R.; Gamper, H.; Reddy, C.; Cutler, R.; Tashev, I.; Gehrke, J. Non-intrusive Speech Quality Assessment Using Neural Networks. In Proceedings of the ICASSP 2019–2019 IEEE International Conference on Acoustics, Speech and Signal Processing (ICASSP), Brighton, UK, 12–17 May 2019; pp. 631–635. [Google Scholar] [CrossRef] [Green Version]
- Gamper, H.; Reddy, C.K.A.; Cutler, R.; Tashev, I.J.; Gehrke, J. Intrusive and Non-Intrusive Perceptual Speech Quality Assessment Using a Convolutional Neural Network. In Proceedings of the 2019 IEEE Workshop on Applications of Signal Processing to Audio and Acoustics (WASPAA), New Paltz, NY, USA, 20–23 October 2019; pp. 85–89. [Google Scholar] [CrossRef]
- v. Latoszek, B.B.; Maryn, Y.; Gerrits, E.; Bodt, M.D. A Meta-Analysis: Acoustic Measurement of Roughness and Breathiness. J. Speech Lang. Hear. Res. 2018, 61, 298–323. [Google Scholar] [CrossRef]
- Muhammad, G.; Melhem, M. Pathological voice detection and binary classification using MPEG-7 audio features. Biomed. Signal Process. Control 2014, 11, 1–9. [Google Scholar] [CrossRef]
- Yin, D.; Luo, C.; Xiong, Z.; Zeng, W. PHASEN: A Phase-and-Harmonics-Aware Speech Enhancement Network. AAAI Conf. Artif. Intell. 2020, 34, 9458–9465. [Google Scholar] [CrossRef]
- Yuanbo, W.; Changwei, Z.; Ziqi, F.; Yihua, Z.; Xiaojun, Z.; Zhi, T. Voice Pathology Detection and Multi-classification Using Machine Learning Classifiers. In Proceedings of the 2020 International Conference on Sensing, Measurement Data Analytics in the Era of Artificial Intelligence (ICSMD), Xi’an, China, 15–17 October 2020; pp. 319–324. [Google Scholar] [CrossRef]
- Fang, S.H.; Tsao, Y.; Hsiao, M.J.; Chen, J.Y.; Lai, Y.H.; Lin, F.C.; Wang, C.T. Detection of Pathological Voice Using Cepstrum Vectors: A Deep Learning Approach. J. Voice 2019, 33, 634–641. [Google Scholar] [CrossRef] [PubMed]
- Guimaraes, M.T.; Medeiros, A.G.; Almeida, J.S.; Falcao Y Martin, M.; Damasevicius, R.; Maskeliunas, R.; Cavalcante Mattos, C.L.; Reboucas Filho, P.P. An Optimized Approach to Huntington’s Disease Detecting via Audio Signals Processing with Dimensionality Reduction. In Proceedings of the International Joint Conference on Neural Networks, Glasgow, UK, 3 October 2020. [Google Scholar]
- Narendra, N.; Alku, P. Automatic assessment of intelligibility in speakers with dysarthria from coded telephone speech using glottal features. Comput. Speech Lang. 2021, 65, 101117. [Google Scholar] [CrossRef]
- Arora, S.; Tsanas, A. Assessing Parkinson’s Disease at Scale Using Telephone-Recorded Speech: Insights from the Parkinson’s Voice Initiative. Diagnostics 2021, 11, 1892. [Google Scholar] [CrossRef]
- Lauraitis, A.; Maskeliunas, R.; Damaševičius, R.; Krilavičius, T. Detection of Speech Impairments Using Cepstrum, Auditory Spectrogram and Wavelet Time Scattering Domain Features. IEEE Access 2020, 8, 96162–96172. [Google Scholar] [CrossRef]
- Braga, D.; Madureira, A.M.; Coelho, L.; Ajith, R. Automatic detection of Parkinson’s disease based on acoustic analysis of speech. Eng. Appl. Artif. Intell. 2019, 77, 148–158. [Google Scholar] [CrossRef]
- Qian, Y.; Chen, Z.; Wang, S. Audio-Visual Deep Neural Network for Robust Person Verification. IEEE/ACM Trans. Audio Speech Lang. Process. 2021, 29, 1079–1092. [Google Scholar] [CrossRef]
- Patil, A.T.; Patil, H.A.; Khoria, K. Effectiveness of energy separation-based instantaneous frequency estimation for cochlear cepstral features for synthetic and voice-converted spoofed speech detection. Comput. Speech Lang. 2022, 72, 101301. [Google Scholar] [CrossRef]
- Jalali-najafabadi, F.; Gadepalli, C.; Jarchi, D.; Cheetham, B.M. Acoustic analysis and digital signal processing for the assessment of voice quality. Biomed. Signal Process. Control 2021, 70, 103018. [Google Scholar] [CrossRef]
- Jothi, K.R.; Sivaraju, S.S.; Yawalkar, P.J. AI based Speech Language Therapy using Speech Quality Parameters for Aphasia Person: A Comprehensive Review. In Proceedings of the 2020 4th International Conference on Electronics, Communication and Aerospace Technology (ICECA), Coimbatore, India, 5–7 November 2020; pp. 1263–1271. [Google Scholar] [CrossRef]
- Aicha, A.B. Noninvasive Detection of Potentially Precancerous Lesions of Vocal Fold Based on Glottal Wave signal and sVM Approaches. Procedia Comput. Sci. 2018, 126, 586–595. [Google Scholar] [CrossRef]
- Fontes, A.I.R.; Souza, P.T.V.; Neto, A.D.D.; Martins, A.d.M.; Silveira, L.F.Q. Classification System of Pathological Voices Using Correntropy. Math. Probl. Eng. 2014, 2014, 1–7. [Google Scholar] [CrossRef] [Green Version]
- Alías, F.; Socoro, J.; Sevillano, X. A Review of Physical and Perceptual Feature Extraction Techniques for Speech, Music and Environmental Sounds. Appl. Sci. 2016, 6, 143. [Google Scholar] [CrossRef] [Green Version]
- Hossain, M.S.; Muhammad, G. Healthcare Big Data Voice Pathology Assessment Framework. IEEE Access 2016, 4, 7806–7815. [Google Scholar] [CrossRef]
- Vaziri, G.; Giguère, C.; Dajani, H.R. Evaluating noise suppression methods for recovering the Lombard speech from vocal output in an external noise field. Int. J. Speech Technol. 2019, 22, 31–46. [Google Scholar] [CrossRef]
- Hegde, S.; Shetty, S.; Rai, S.; Dodderi, T. A Survey on Machine Learning Approaches for Automatic Detection of Voice Disorders. J. Voice 2019, 33, 947.e11–947.e33. [Google Scholar] [CrossRef]
- Zhang, D.; Wu, K. Pathological Voice Analysis; Springer: Singapore, 2020. [Google Scholar] [CrossRef]
- Chen, L.; Wang, C.; Chen, J.; Xiang, Z.; Hu, X. Voice Disorder Identification by using Hilbert-Huang Transform (HHT) and K Nearest Neighbor (KNN). J. Voice 2021, 35, 932.e1–932.e11. [Google Scholar] [CrossRef]
- Uloza, V.; Padervinskis, E.; Vegiene, A.; Pribuisiene, R.; Saferis, V.; Vaiciukynas, E.; Gelzinis, A.; Verikas, A. Exploring the feasibility of smart phone microphone for measurement of acoustic voice parameters and voice pathology screening. Eur. Arch. Oto-Rhino 2015, 272, 3391–3399. [Google Scholar] [CrossRef]
- Amami, R.; Smiti, A. An incremental method combining density clustering and support vector machines for voice pathology detection. Comput. Electr. Eng. 2017, 57, 257–265. [Google Scholar] [CrossRef]
- Lee, J.Y. A two-stage approach using Gaussian mixture models and higher-order statistics for a classification of normal and pathological voices. EURASIP J. Adv. Signal Process. 2012, 2012, 252. [Google Scholar] [CrossRef] [Green Version]
- Pham, M.; Lin, J.; Zhang, Y. Diagnosing Voice Disorder with Machine Learning. In Proceedings of the 2018 IEEE International Conference on Big Data (Big Data), Seattle, WA, USA, 10–13 December 2018; pp. 5263–5266. [Google Scholar] [CrossRef]
- Hammami, I.; Salhi, L.; Labidi, S. Voice Pathologies Classification and Detection Using EMD-DWT Analysis Based on Higher Order Statistic Features. IRBM 2020, 41, 161–171. [Google Scholar] [CrossRef]
- Fonseca, E.S.; Guido, R.C.; Junior, S.B.; Dezani, H.; Gati, R.R.; Mosconi Pereira, D.C. Acoustic investigation of speech pathologies based on the discriminative paraconsistent machine (DPM). Biomed. Signal Process. Control 2020, 55, 101615. [Google Scholar] [CrossRef]
- Muhammad, G.; Alhussein, M. Convergence of Artificial Intelligence and Internet of Things in Smart Healthcare: A Case Study of Voice Pathology Detection. IEEE Access 2021, 9, 89198–89209. [Google Scholar] [CrossRef]
- Cordeiro, H.T.; Ribeiro, C.M. Spectral envelope first peak and periodic component in pathological voices: A spectral analysis. Procedia Comput. Sci. 2018, 138, 64–71. [Google Scholar] [CrossRef]
- Erfanian Saeedi, N.; Almasganj, F.; Torabinejad, F. Support vector wavelet adaptation for pathological voice assessment. Comput. Biol. Med. 2011, 41, 822–828. [Google Scholar] [CrossRef]
- Vásquez-Correa, J.; Klumpp, P.; Orozco-Arroyave, J.R.; Nöth, E. Phonet: A Tool Based on Gated Recurrent Neural Networks to Extract Phonological Posteriors from Speech. In Proceedings of the Interspeech 2019, ISCA, Graz, Austria, 15–19 September 2019; pp. 549–553. [Google Scholar] [CrossRef] [Green Version]
- Wu, H.; Soraghan, J.; Lowit, A.; Di Caterina, G. Convolutional Neural Networks for Pathological Voice Detection. In Proceedings of the 2018 40th Annual International Conference of the IEEE Engineering in Medicine and Biology Society (EMBC), Honolulu, HI, USA, 18–21 July 2018; pp. 1–4. [Google Scholar] [CrossRef] [Green Version]
- Areiza-Laverde, H.J.; Castro-Ospina, A.E.; Peluffo-Ordóñez, D.H. Voice Pathology Detection Using Artificial Neural Networks and Support Vector Machines Powered by a Multicriteria Optimization Algorithm. In Applied Computer Sciences in Engineering; Figueroa-García, J.C., López-Santana, E.R., Rodriguez-Molano, J.I., Eds.; Springer International Publishing: Berlin/Heidelberg, Germany, 2018; Volume 915, pp. 148–159. [Google Scholar] [CrossRef]
- Chen, L.; Chen, J. Deep Neural Network for Automatic Classification of Pathological Voice Signals. J. Voice 2020, 36, 288.E15–288.E24. [Google Scholar] [CrossRef]
- Miliaresi, I.; Poutos, K.; Pikrakis, A. Combining acoustic features and medical data in deep learning networks for voice pathology classification. In Proceedings of the 2020 28th European Signal Processing Conference (EUSIPCO), Amsterdam, The Netherlands, 18–21 January 2021; pp. 1190–1194. [Google Scholar] [CrossRef]
- Gómez García, J.A. Contributions to the Design of Automatic Voice Quality Analysis Systems Using Speech Technologies. Ph.D. Thesis, Universidad Politécnica de Madrid, Madrid, Spain, 2018. [Google Scholar] [CrossRef]
- Syed, S.A.; Rashid, M.; Hussain, S.; Zahid, H. Comparative Analysis of CNN and RNN for Voice Pathology Detection. BioMed Res. Int. 2021, 2021, 1–8. [Google Scholar] [CrossRef]
- Kim, H.; Jeon, J.; Han, Y.J.; Joo, Y.; Lee, J.; Lee, S.; Im, S. Convolutional Neural Network Classifies Pathological Voice Change in Laryngeal Cancer with High Accuracy. J. Clin. Med. 2020, 9, 3415. [Google Scholar] [CrossRef]
- Wahengbam, K.; Singh, M.P.; Nongmeikapam, K.; Singh, A.D. A Group Decision Optimization Analogy-Based Deep Learning Architecture for Multiclass Pathology Classification in a Voice Signal. IEEE Sens. J. 2021, 21, 8100–8116. [Google Scholar] [CrossRef]
- Raj, J.R.; Jabez, J.; Srinivasulu, S.S.; Gowri, S.; Vimali, J.S. Voice Pathology Detection Based on Deep Neural Network Approach. IOP Conf. Ser. Mater. Sci. Eng. 2021, 1020, 012001. [Google Scholar] [CrossRef]
- Fan, Z.; Wu, Y.; Zhou, C.; Zhang, X.; Tao, Z. Class-Imbalanced Voice Pathology Detection and Classification Using Fuzzy Cluster Oversampling Method. Appl. Sci. 2021, 11, 3450. [Google Scholar] [CrossRef]
- Toloşi, L.; Lengauer, T. Classification with correlated features: Unreliability of feature ranking and solutions. Bioinformatics 2011, 27, 1986–1994. [Google Scholar] [CrossRef] [PubMed]
- Kingma, D.P.; Ba, J. Adam: A Method for Stochastic Optimization. 2017. Available online: http://xxx.lanl.gov/abs/1412.6980 (accessed on 20 January 2022).
- Loshchilov, I.; Hutter, F. SGDR: Stochastic Gradient Descent with Warm Restarts. 2017. Available online: http://xxx.lanl.gov/abs/1608.03983 (accessed on 20 January 2022).
- He, K.; Zhang, X.; Ren, S.; Sun, J. Deep Residual Learning for Image Recognition. 2015. Available online: http://xxx.lanl.gov/abs/1512.03385 (accessed on 20 January 2022).
- Collobert, R.; Puhrsch, C.; Synnaeve, G. Wav2Letter: An End-to-End ConvNet-Based Speech Recognition System. 2016. Available online: http://xxx.lanl.gov/abs/1609.03193 (accessed on 20 January 2022).
- Dai, W.; Dai, C.; Qu, S.; Li, J.; Das, S. Very Deep Convolutional Neural Networks for Raw Waveforms. 2016. Available online: http://xxx.lanl.gov/abs/1610.00087 (accessed on 20 January 2022).
- Vanagas, G.; Engelbrecht, R.; Damaševičius, R.; Suomi, R.; Solanas, A. EHealth Solutions for the Integrated Healthcare. J. Healthc. Eng. 2018, 2018, 3846892. [Google Scholar] [CrossRef] [PubMed] [Green Version]
- Payten, C.L.; Nguyen, D.D.; Novakovic, D.; O’Neill, J.; Chacon, A.M.; Weir, K.A.; Madill, C.J. Telehealth voice assessment by speech language pathologists during a global pandemic using principles of a primary contact model: An observational cohort study protocol. BMJ Open 2022, 12, e052518. [Google Scholar] [CrossRef]


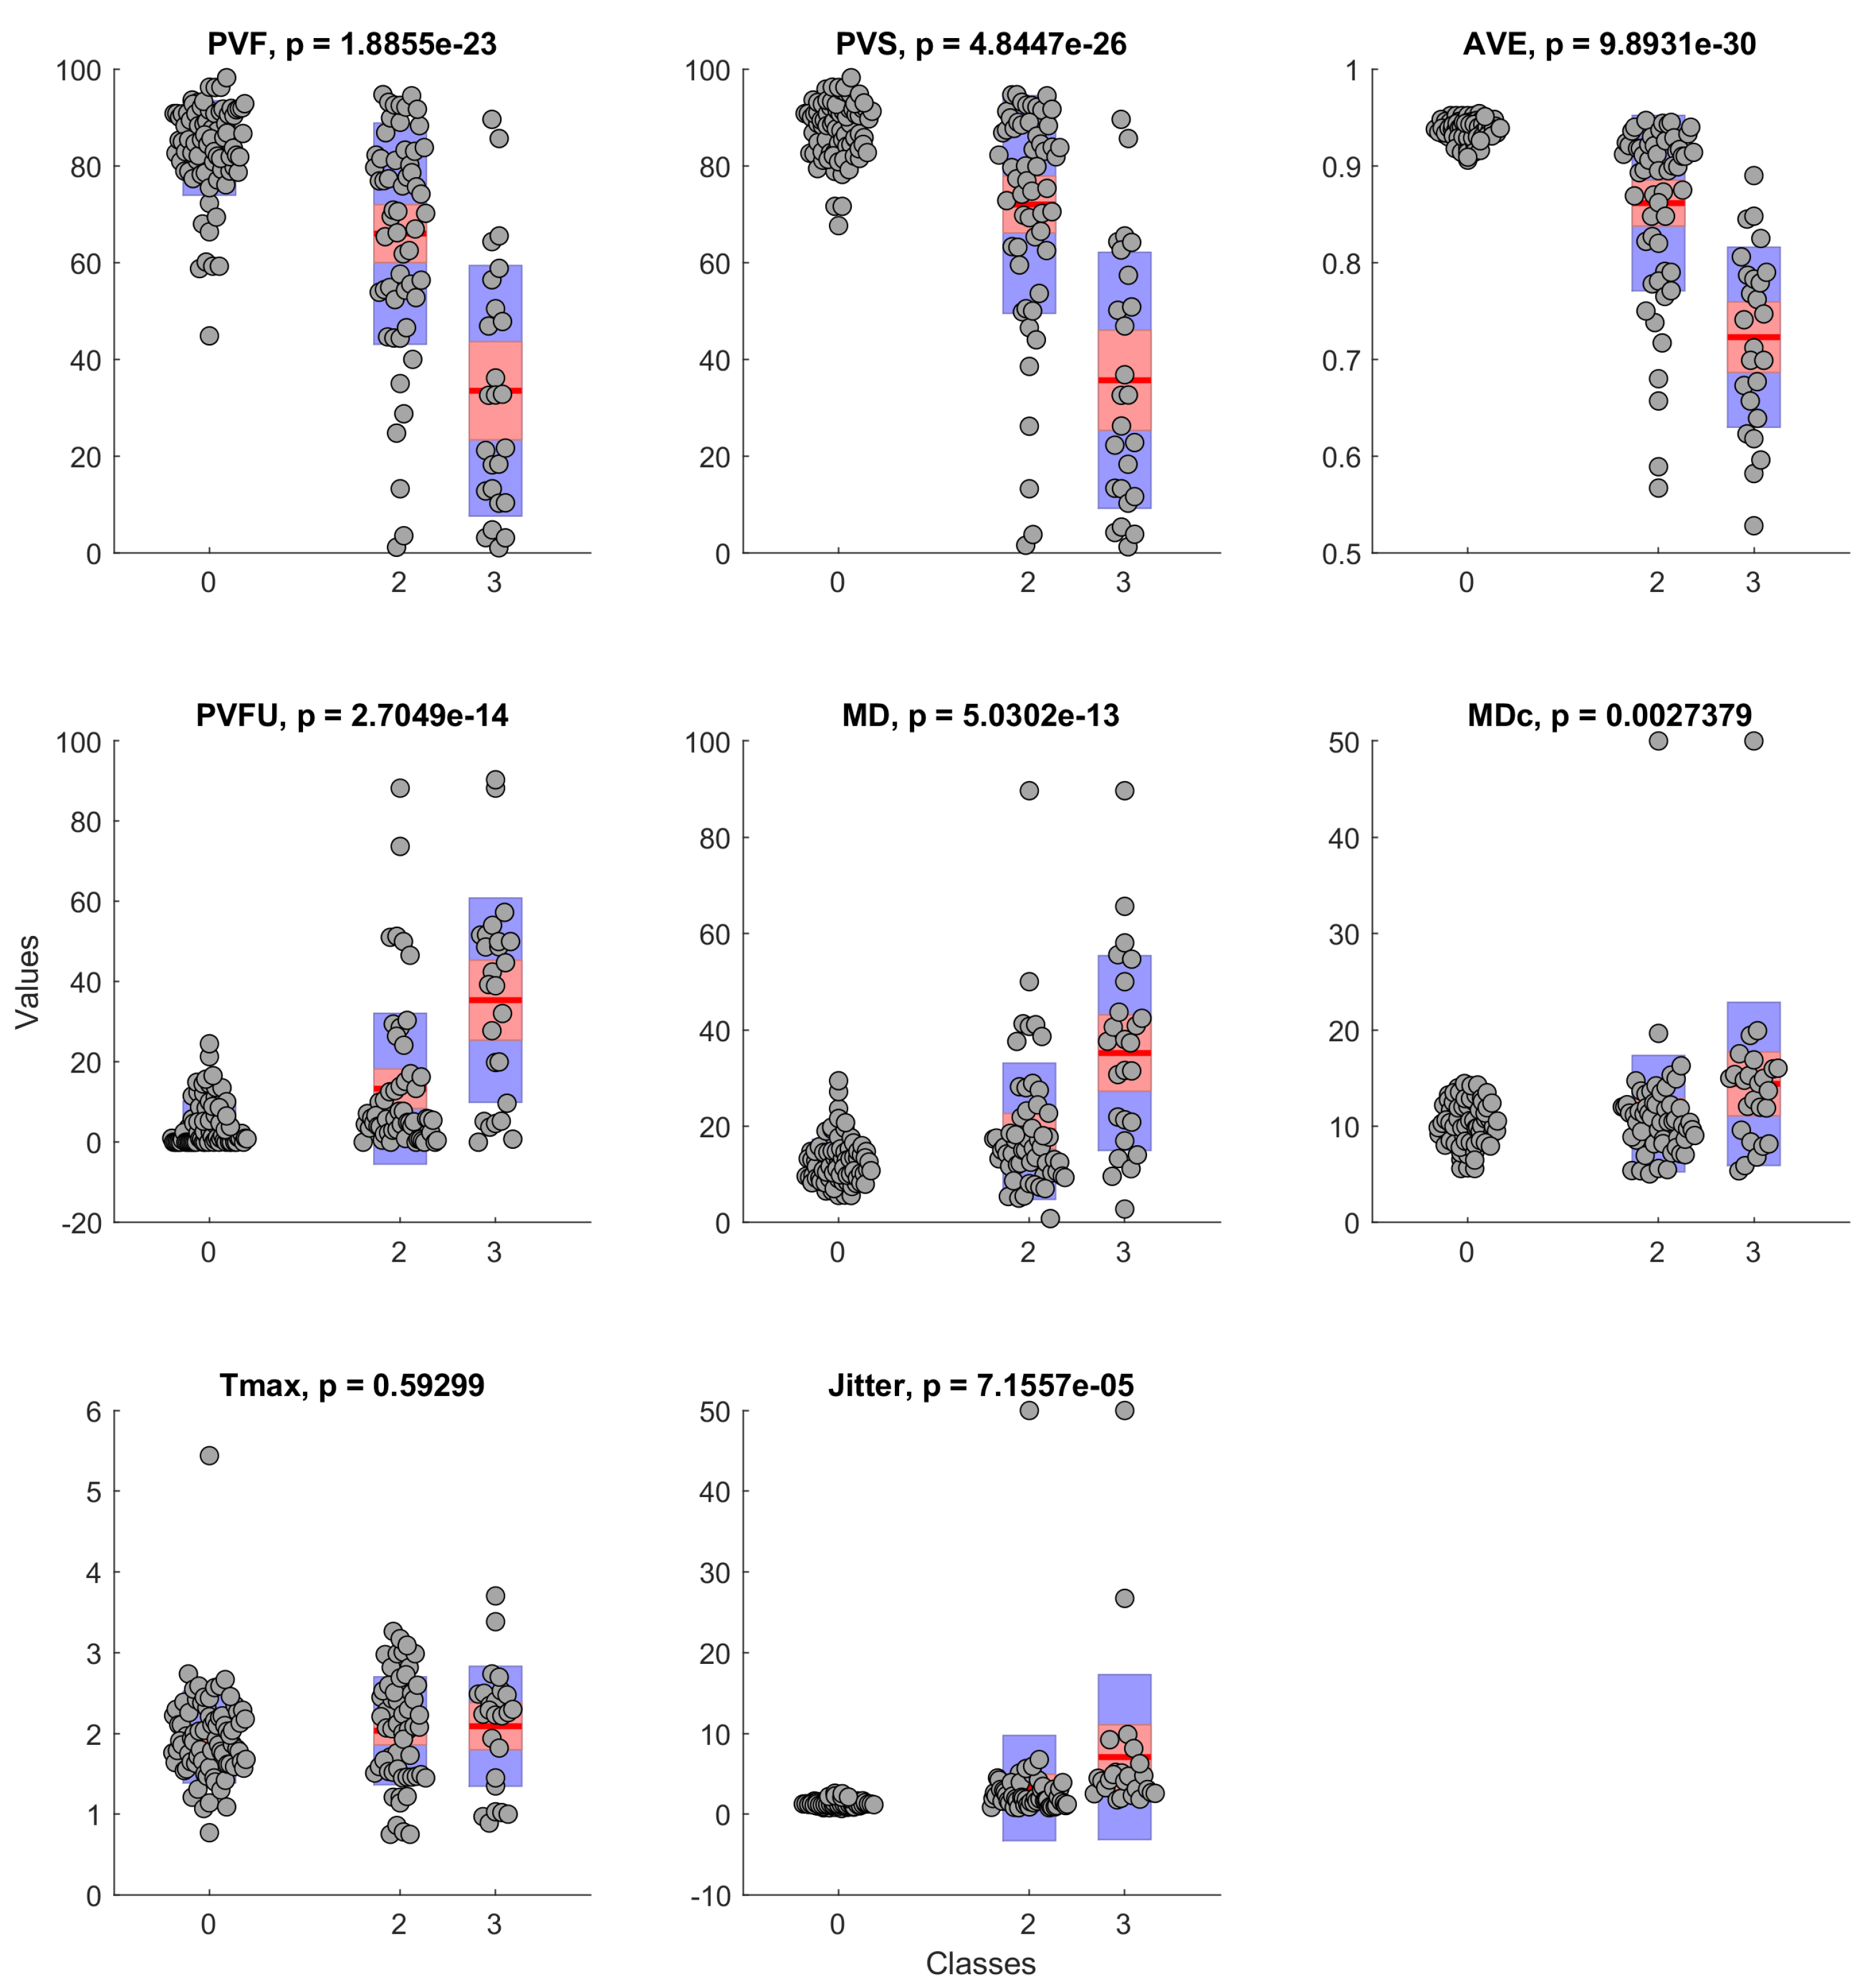
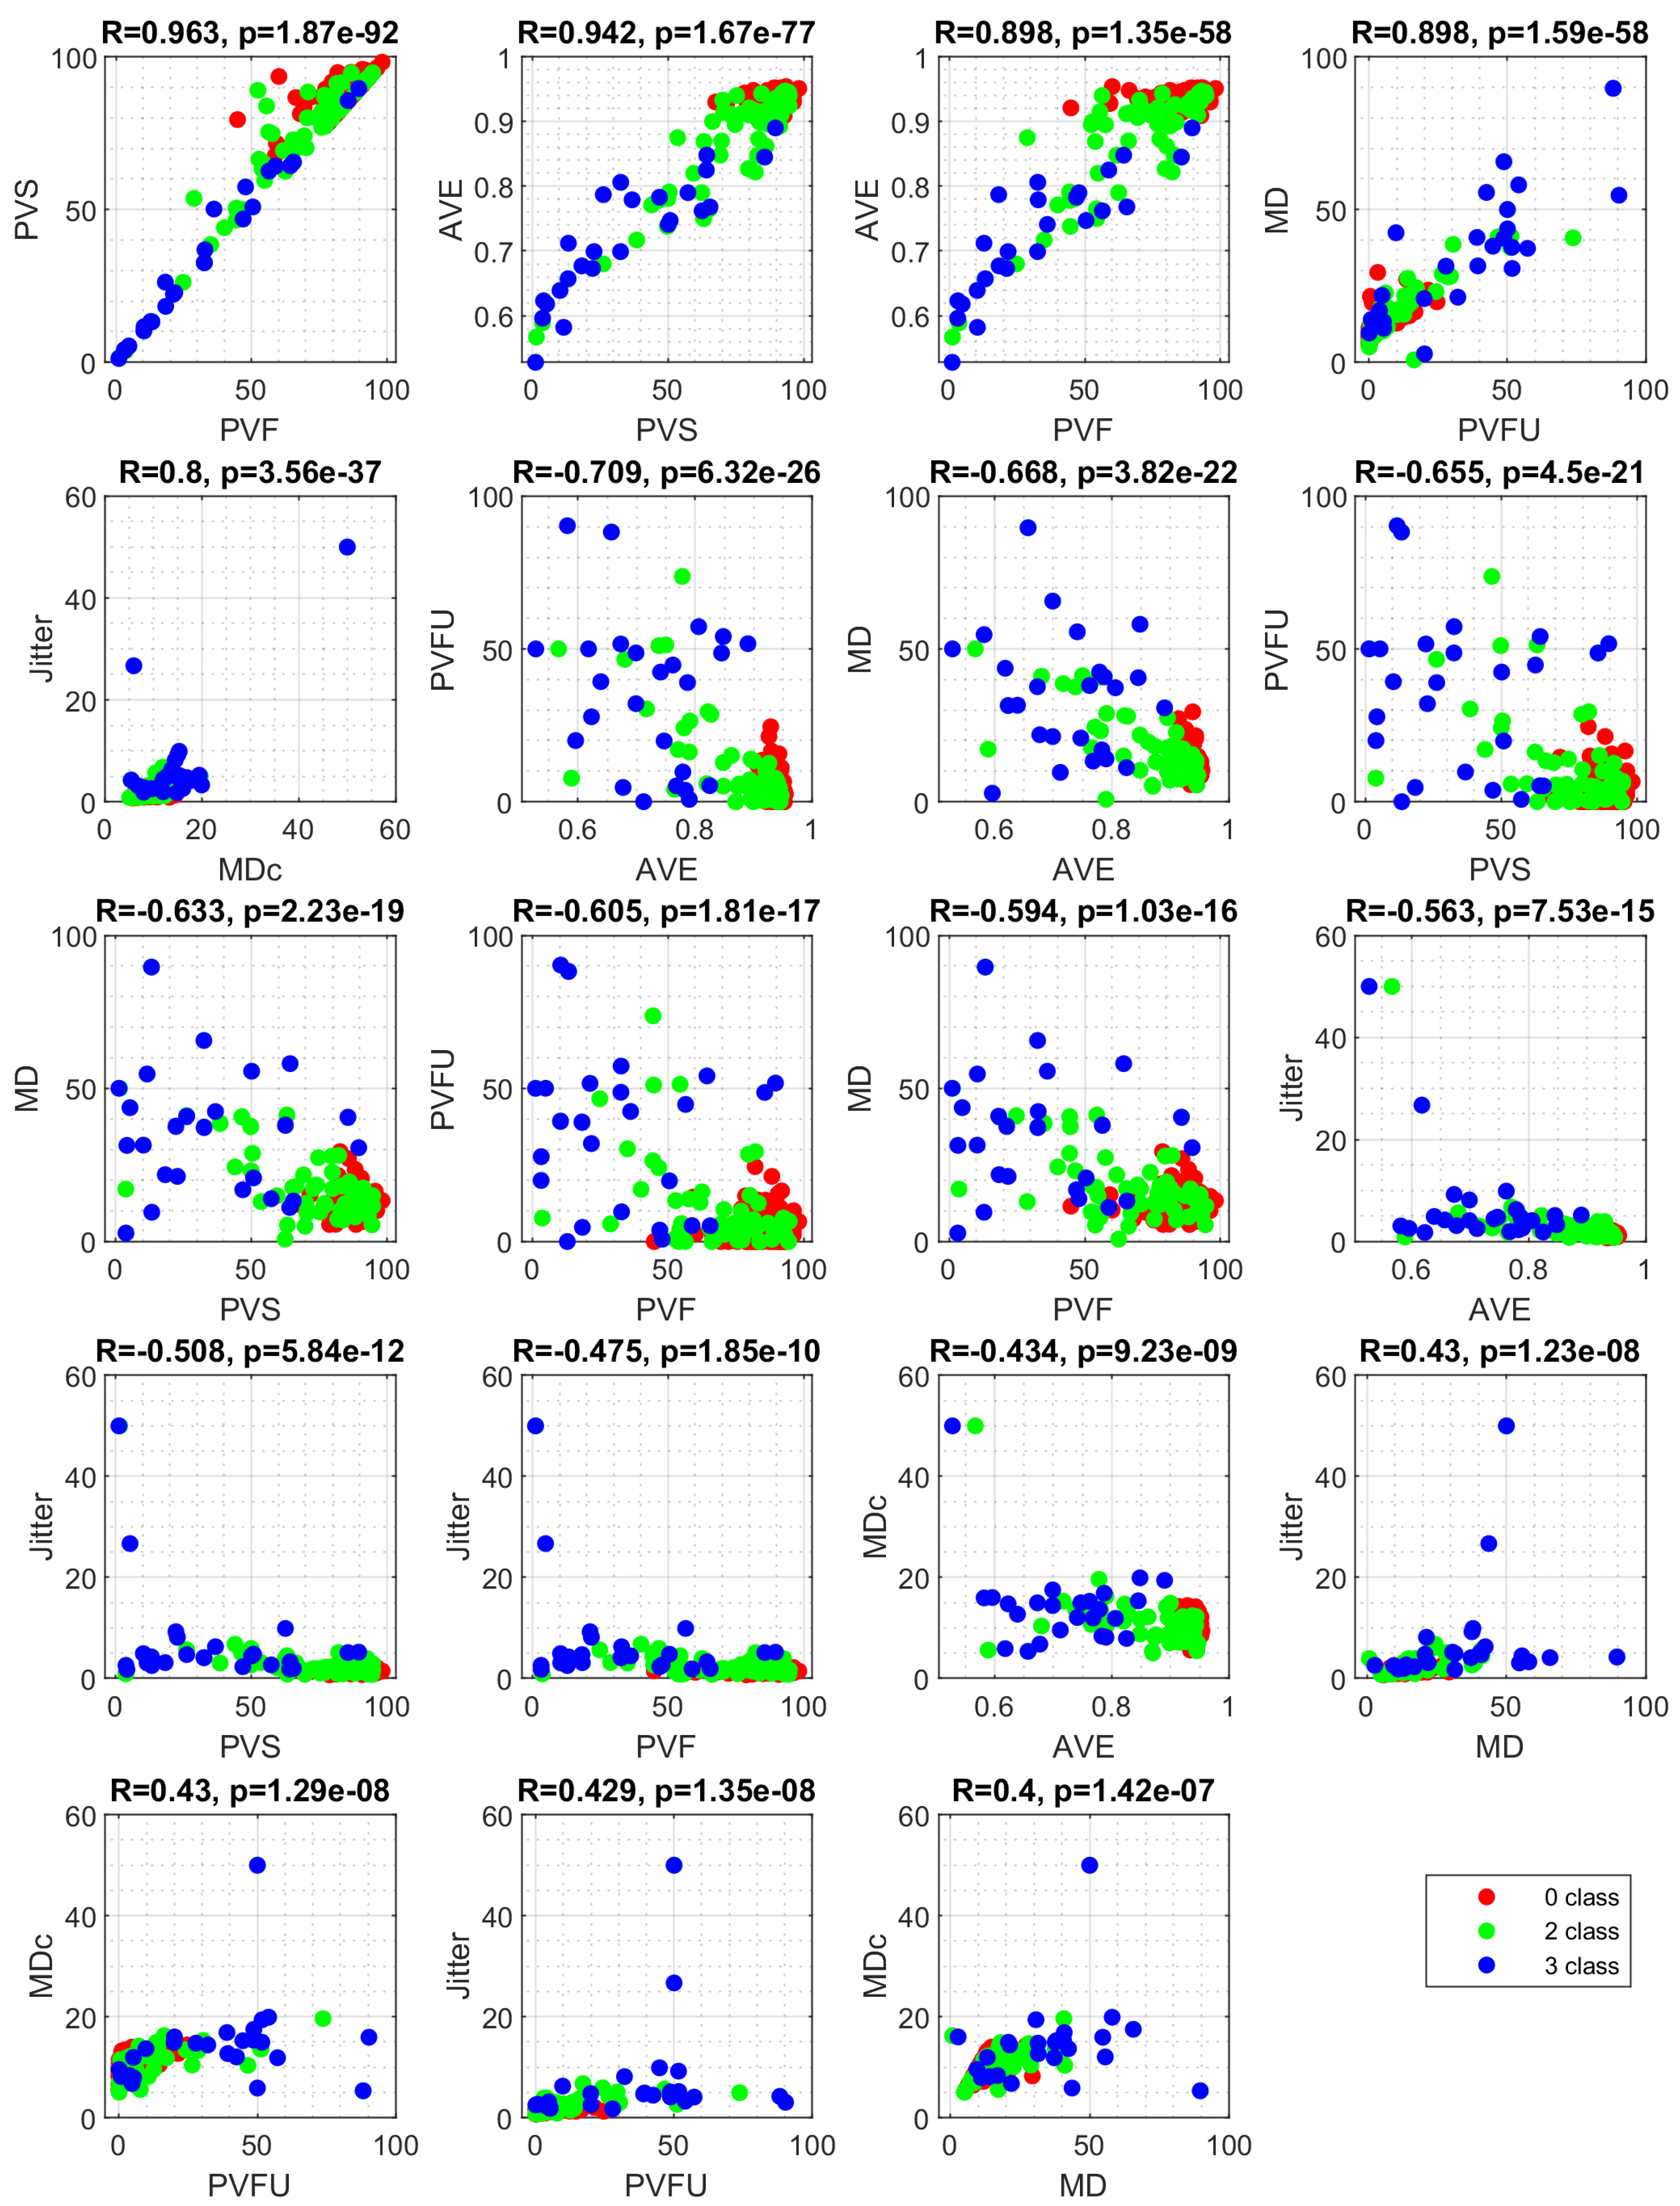
| Feature | Description |
|---|---|
| PVF | Percentage of voiced frames |
| PVS | Percentage of voiced speech frames |
| AVE | Mean voicing evidence of voiced frames |
| PVFU | Percentage of unreliable voiced frames |
| MD | Average F0 modulation |
| MDc | MD only in frames with a “reliable” F0 estimate. Vocal frequency estimate F0 is considered reliable if it deviates less than 25% from the average over all voiced frames. |
| Jitter | F0-jitter in all voiced frame pairs (=2 consecutive frames) |
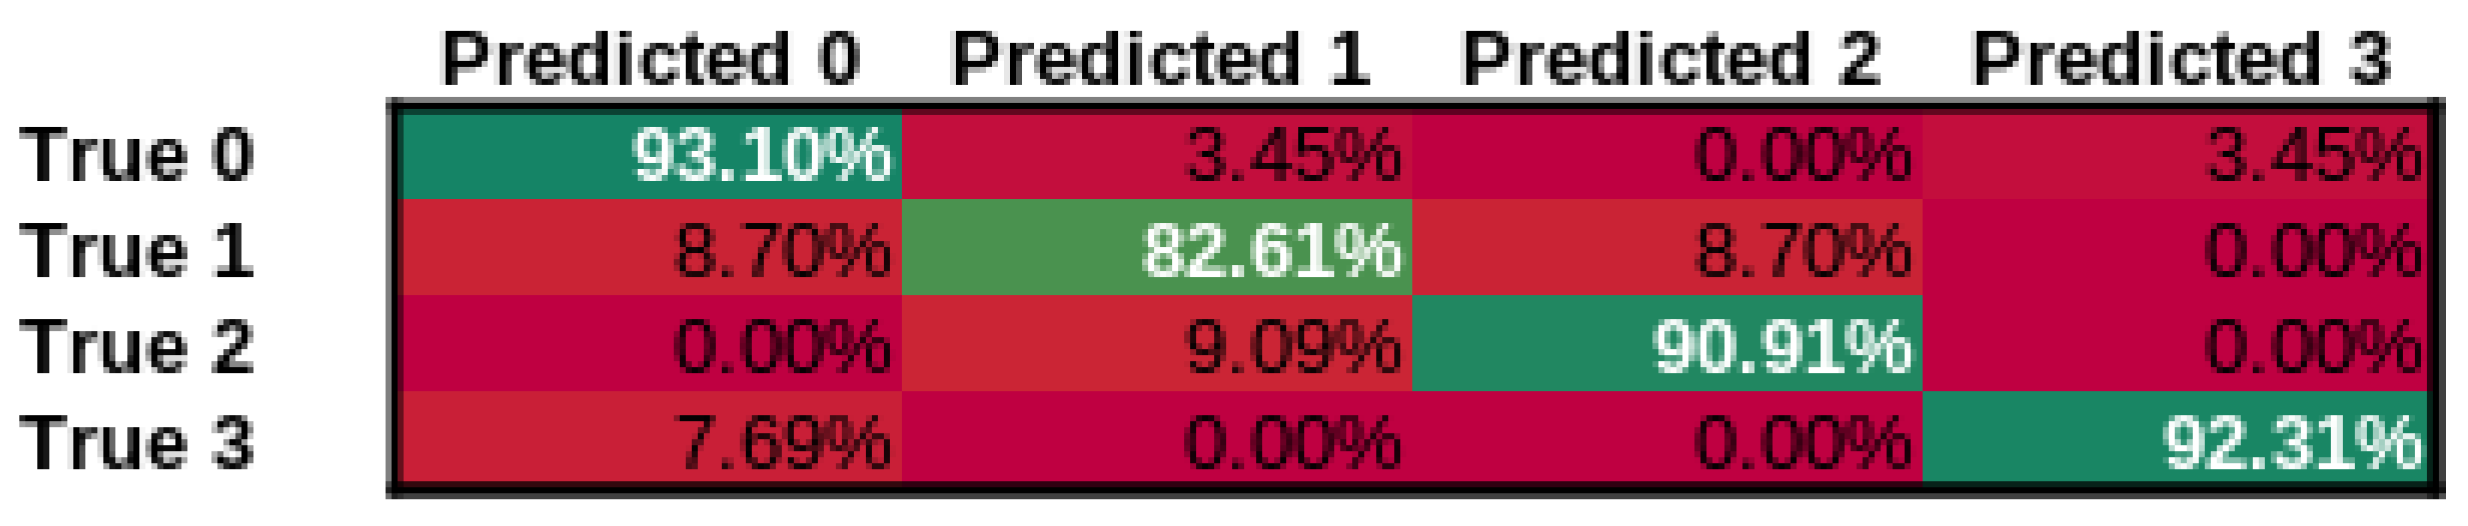
| Class | n (Truth) | n (Classified) | Accuracy | Precision | Recall | F1 Score |
|---|---|---|---|---|---|---|
| 0—normal voice | 30 | 29 | 93.42% | 0.93 | 0.9 | 0.92 |
| 1—SV after cordectom | 21 | 23 | 92.11% | 0.83 | 0.9 | 0.86 |
| 2—SV after partial laryngectomy | 12 | 11 | 96.05% | 0.91 | 0.83 | 0.87 |
| 3—SV using TEP | 13 | 13 | 97.37% | 0.92 | 0.92 | 0.92 |
Publisher’s Note: MDPI stays neutral with regard to jurisdictional claims in published maps and institutional affiliations. |
© 2022 by the authors. Licensee MDPI, Basel, Switzerland. This article is an open access article distributed under the terms and conditions of the Creative Commons Attribution (CC BY) license (https://creativecommons.org/licenses/by/4.0/).
Share and Cite
Maskeliūnas, R.; Kulikajevas, A.; Damaševičius, R.; Pribuišis, K.; Ulozaitė-Stanienė, N.; Uloza, V. Lightweight Deep Learning Model for Assessment of Substitution Voicing and Speech after Laryngeal Carcinoma Surgery. Cancers 2022, 14, 2366. https://doi.org/10.3390/cancers14102366
Maskeliūnas R, Kulikajevas A, Damaševičius R, Pribuišis K, Ulozaitė-Stanienė N, Uloza V. Lightweight Deep Learning Model for Assessment of Substitution Voicing and Speech after Laryngeal Carcinoma Surgery. Cancers. 2022; 14(10):2366. https://doi.org/10.3390/cancers14102366
Chicago/Turabian StyleMaskeliūnas, Rytis, Audrius Kulikajevas, Robertas Damaševičius, Kipras Pribuišis, Nora Ulozaitė-Stanienė, and Virgilijus Uloza. 2022. "Lightweight Deep Learning Model for Assessment of Substitution Voicing and Speech after Laryngeal Carcinoma Surgery" Cancers 14, no. 10: 2366. https://doi.org/10.3390/cancers14102366