
Fallopian Tube-Derived Tumor Cells Induce Testosterone Secretion from the Ovary, Increasing Epithelial Proliferation and Invasion

 , , , and
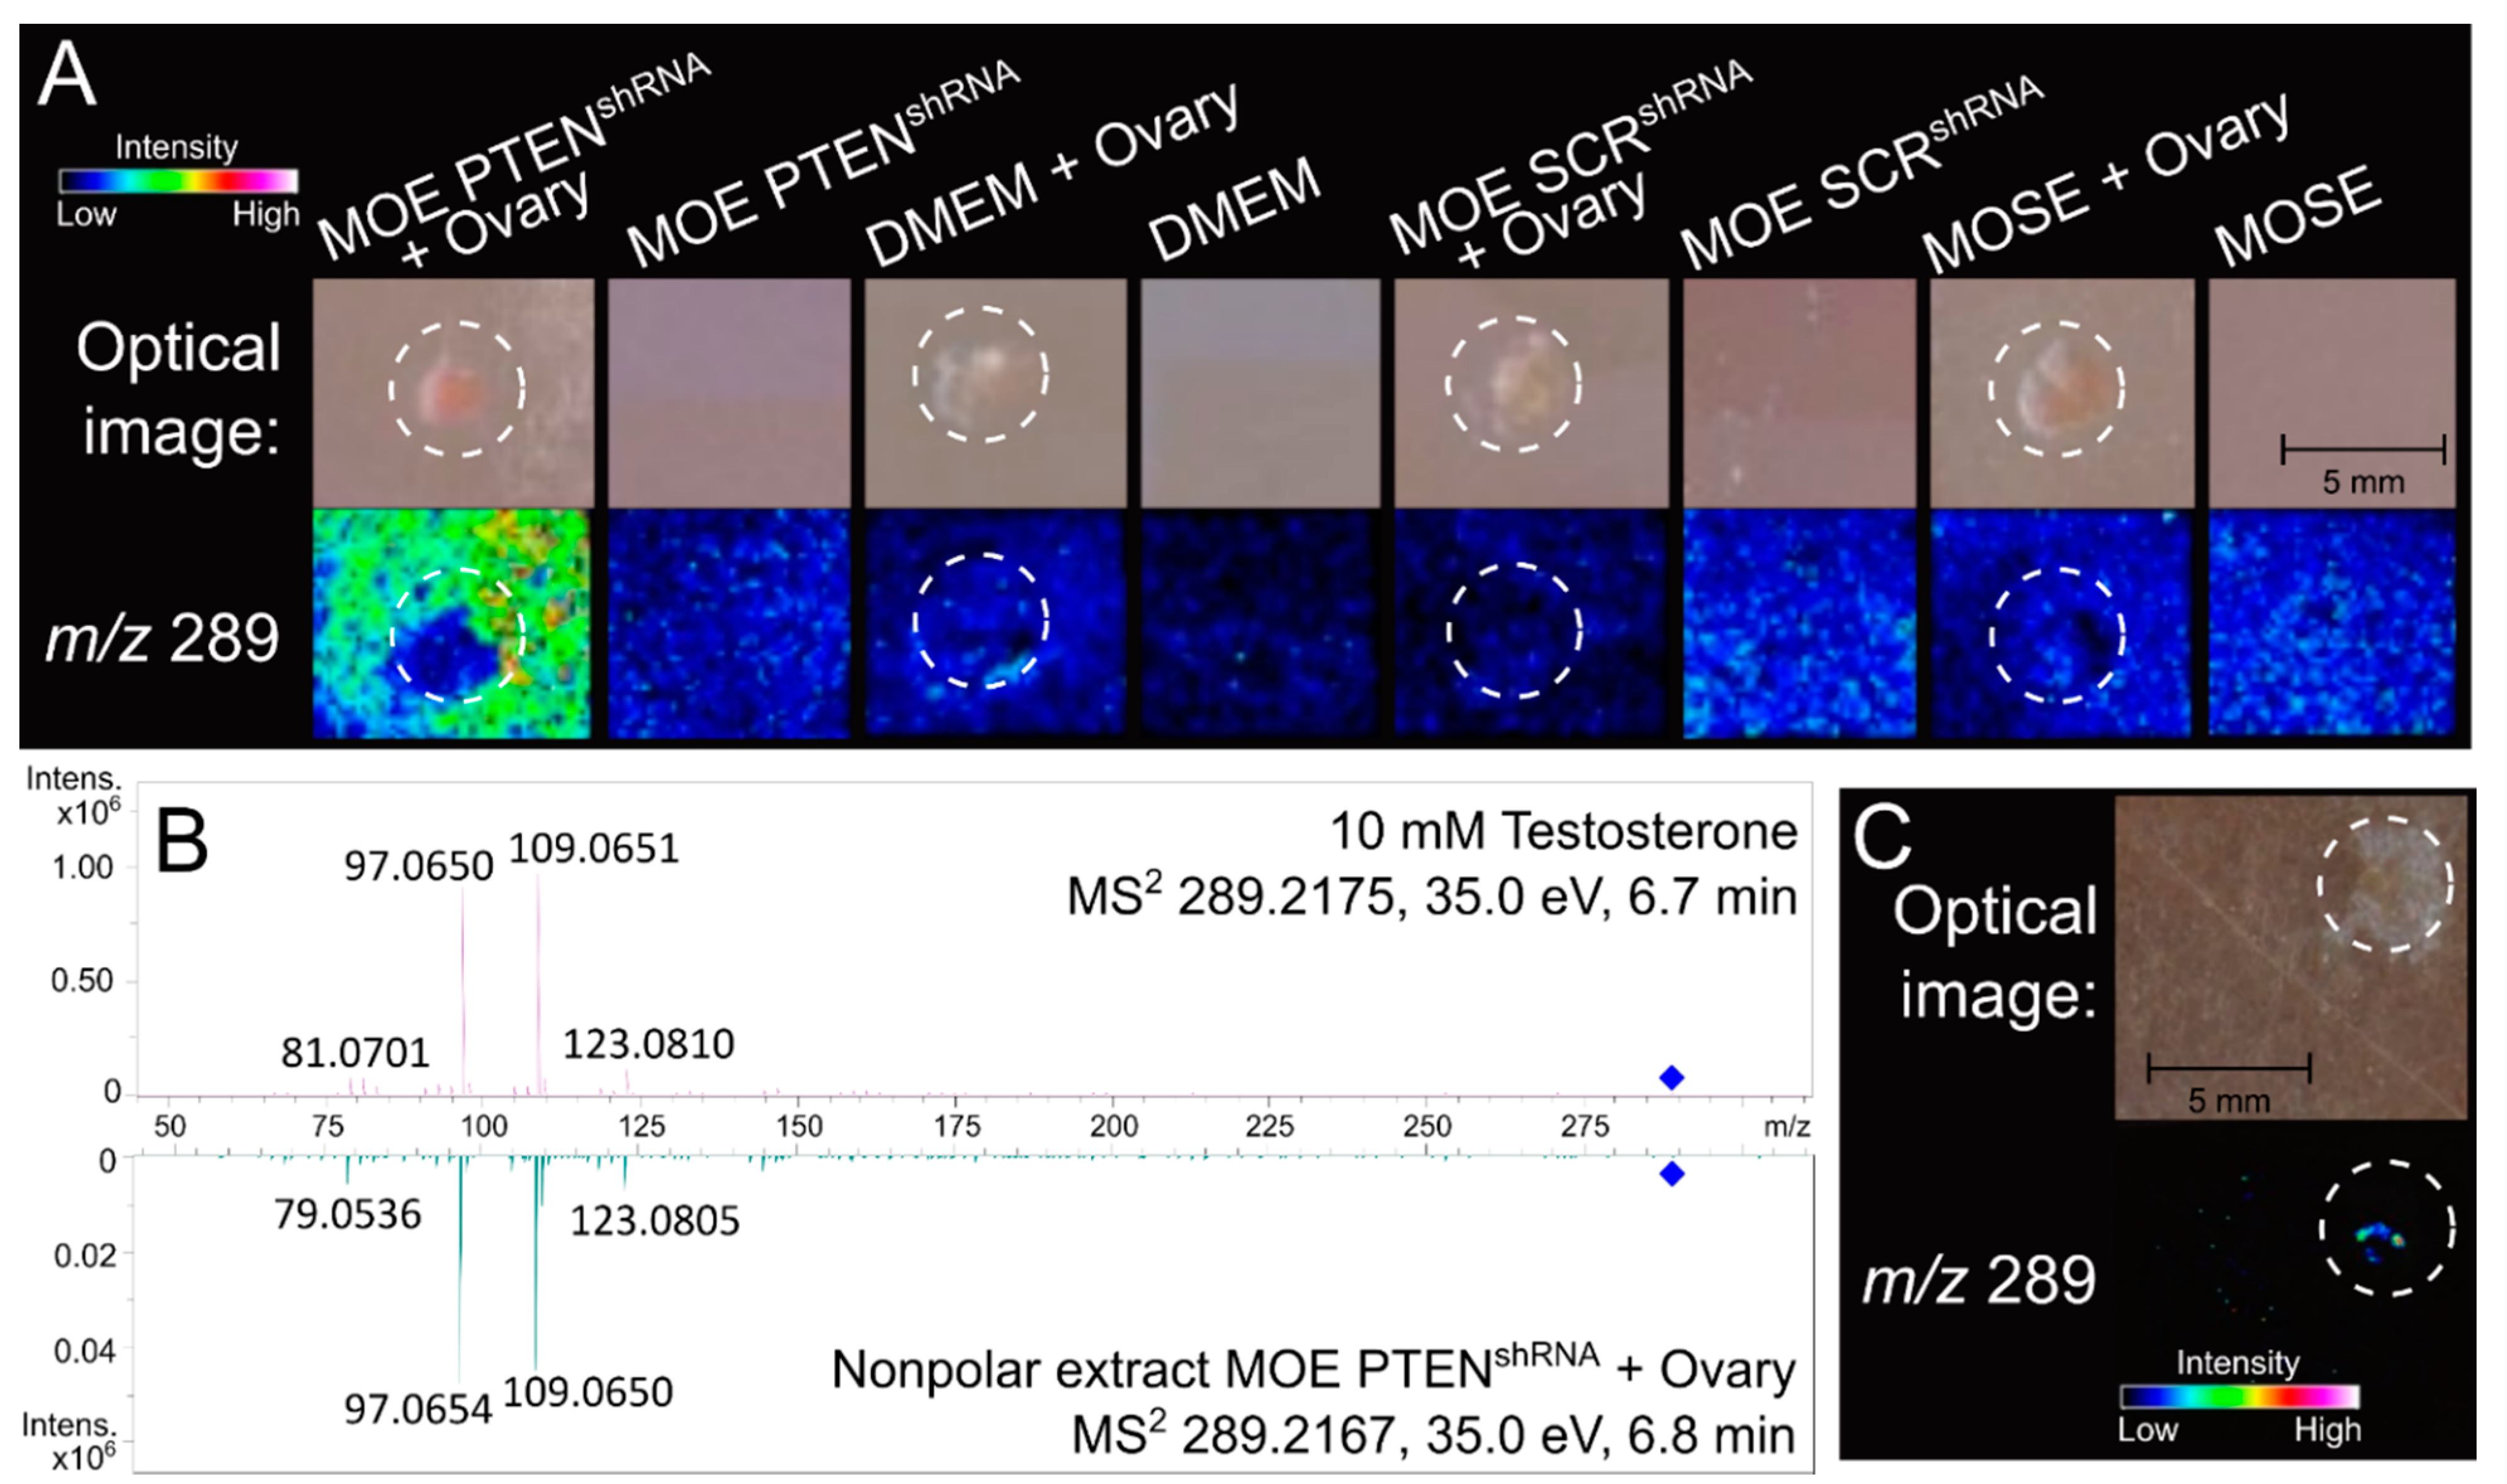
Abstract
:Simple Summary
Abstract
1. Introduction
2. Materials and Methods
2.1. Cell Culture
2.2. Mouse Colony and Ovary Removal for Imaging Mass Spectrometry
2.3. Imaging Mass Spectrometry
2.4. Testosterone Extraction
2.5. MS/MS Analysis
2.6. Cell Proliferation and Viability
2.7. Western Blot
2.8. RNA Isolation, cDNA Synthesis and RT-PCR
2.9. Invasion Assay
2.10. Dihydrotestosterone (DHT) Treated Rat Model of PCOS
2.11. Dehydroepiandrosterone (DHEA) Treated Mouse Model of PCOS
2.12. Statistical Analysis
3. Results
3.1. Ovarian Explant/MOE:PTENshRNA Co-Culture Significantly Upregulates Ovarian Production of Testosterone
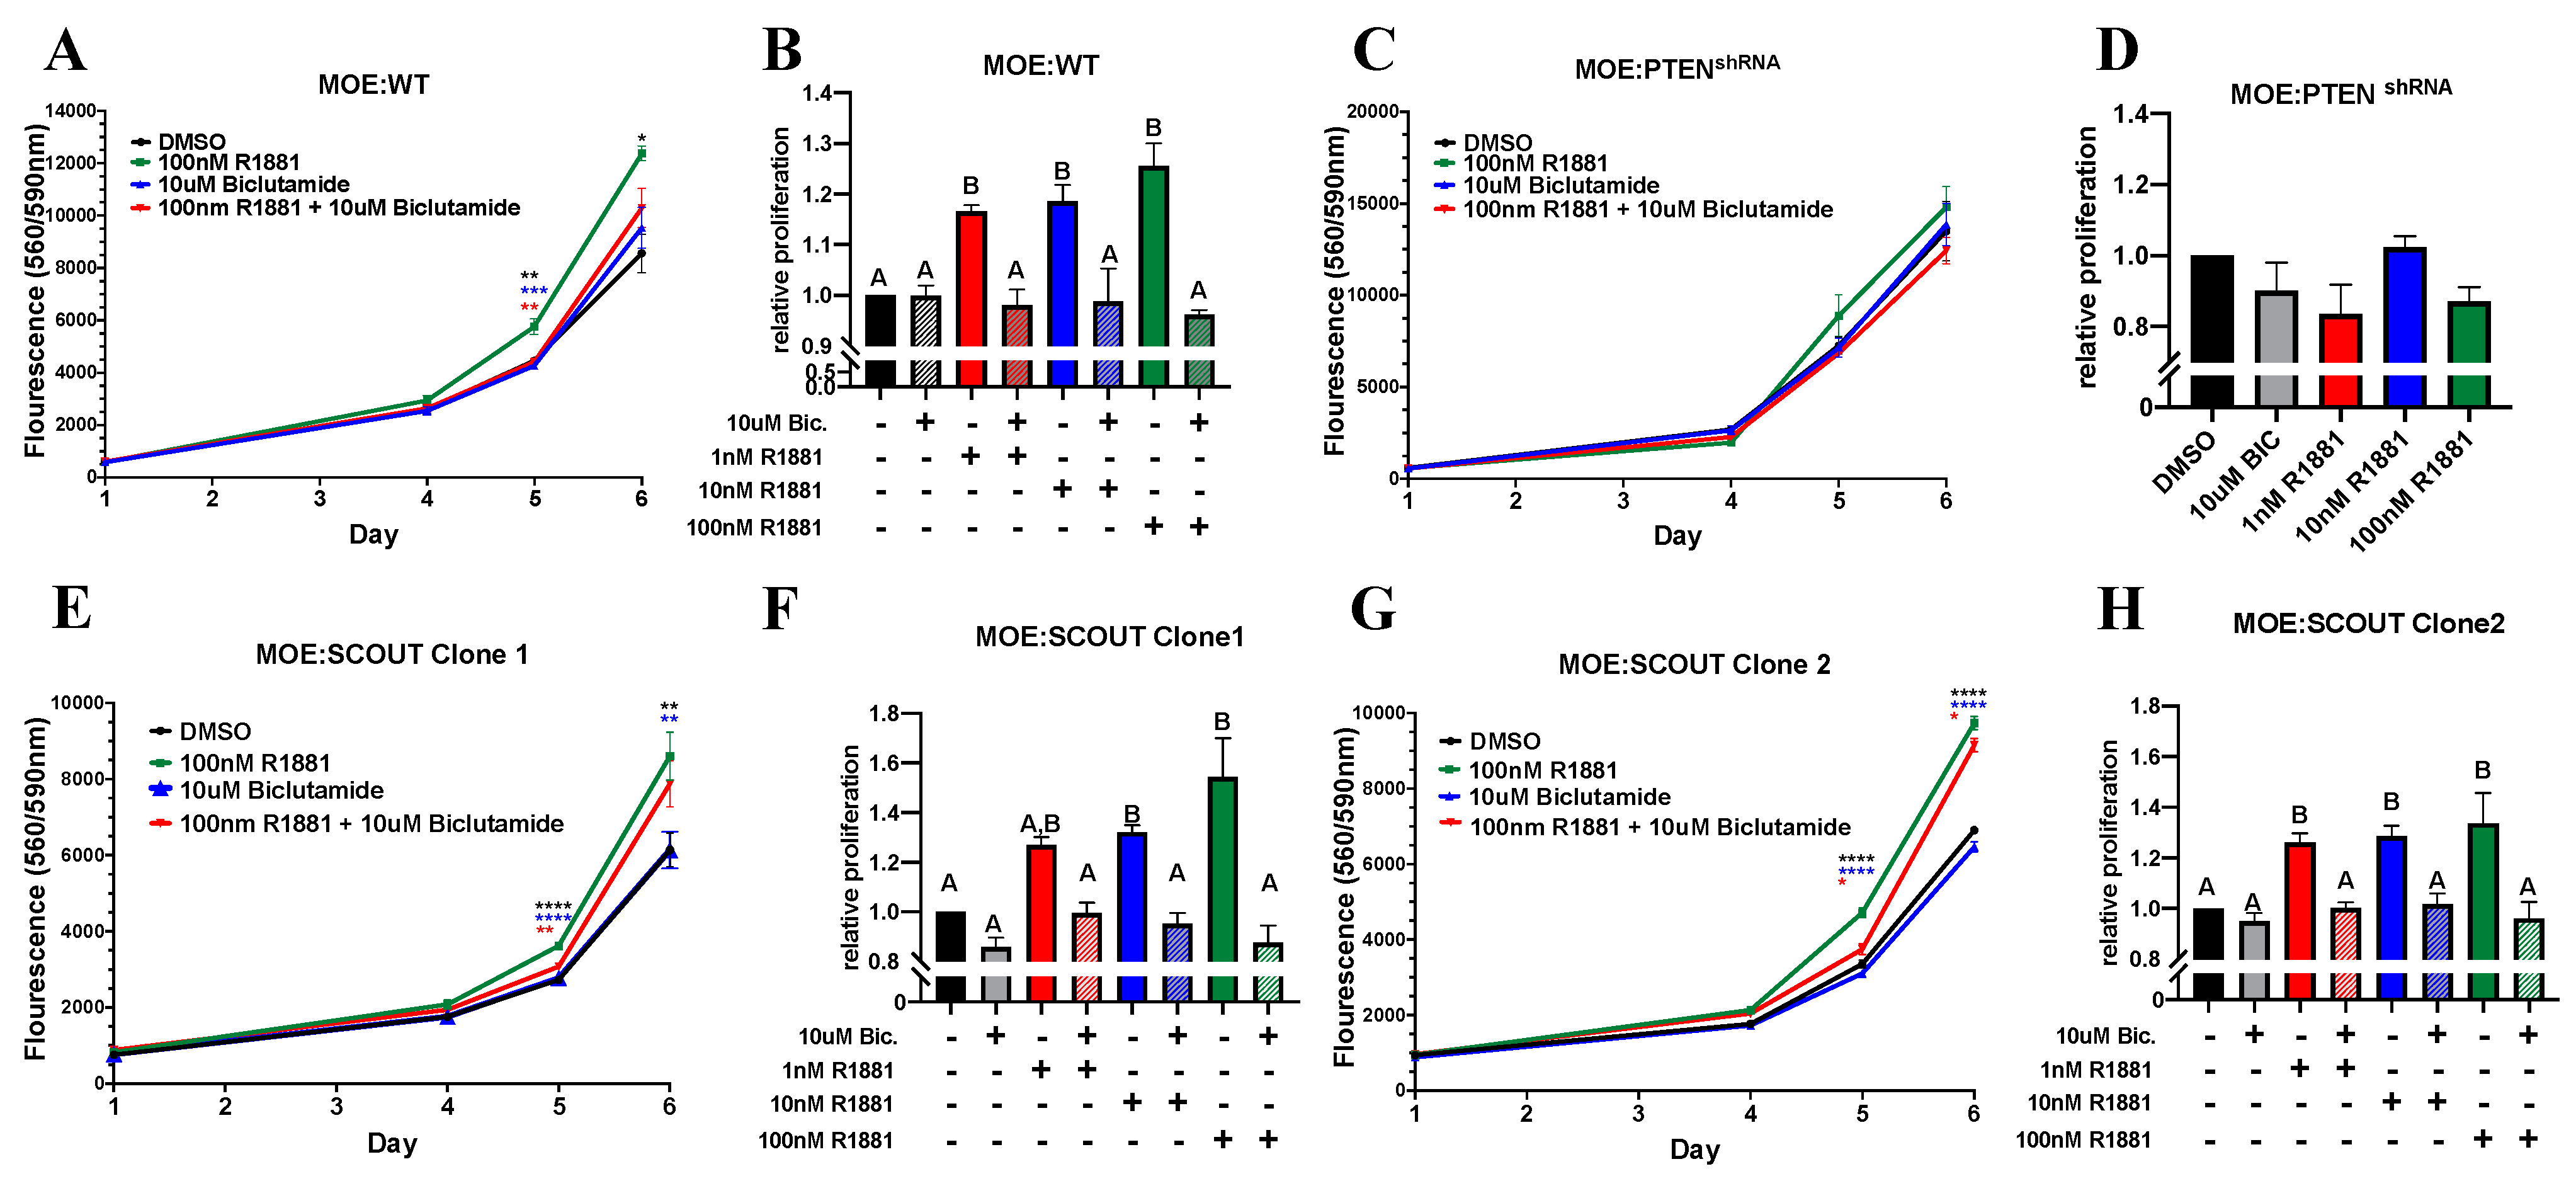
3.2. Androgen Increases In Vitro Proliferation of Murine Oviductal Epithelial Cells
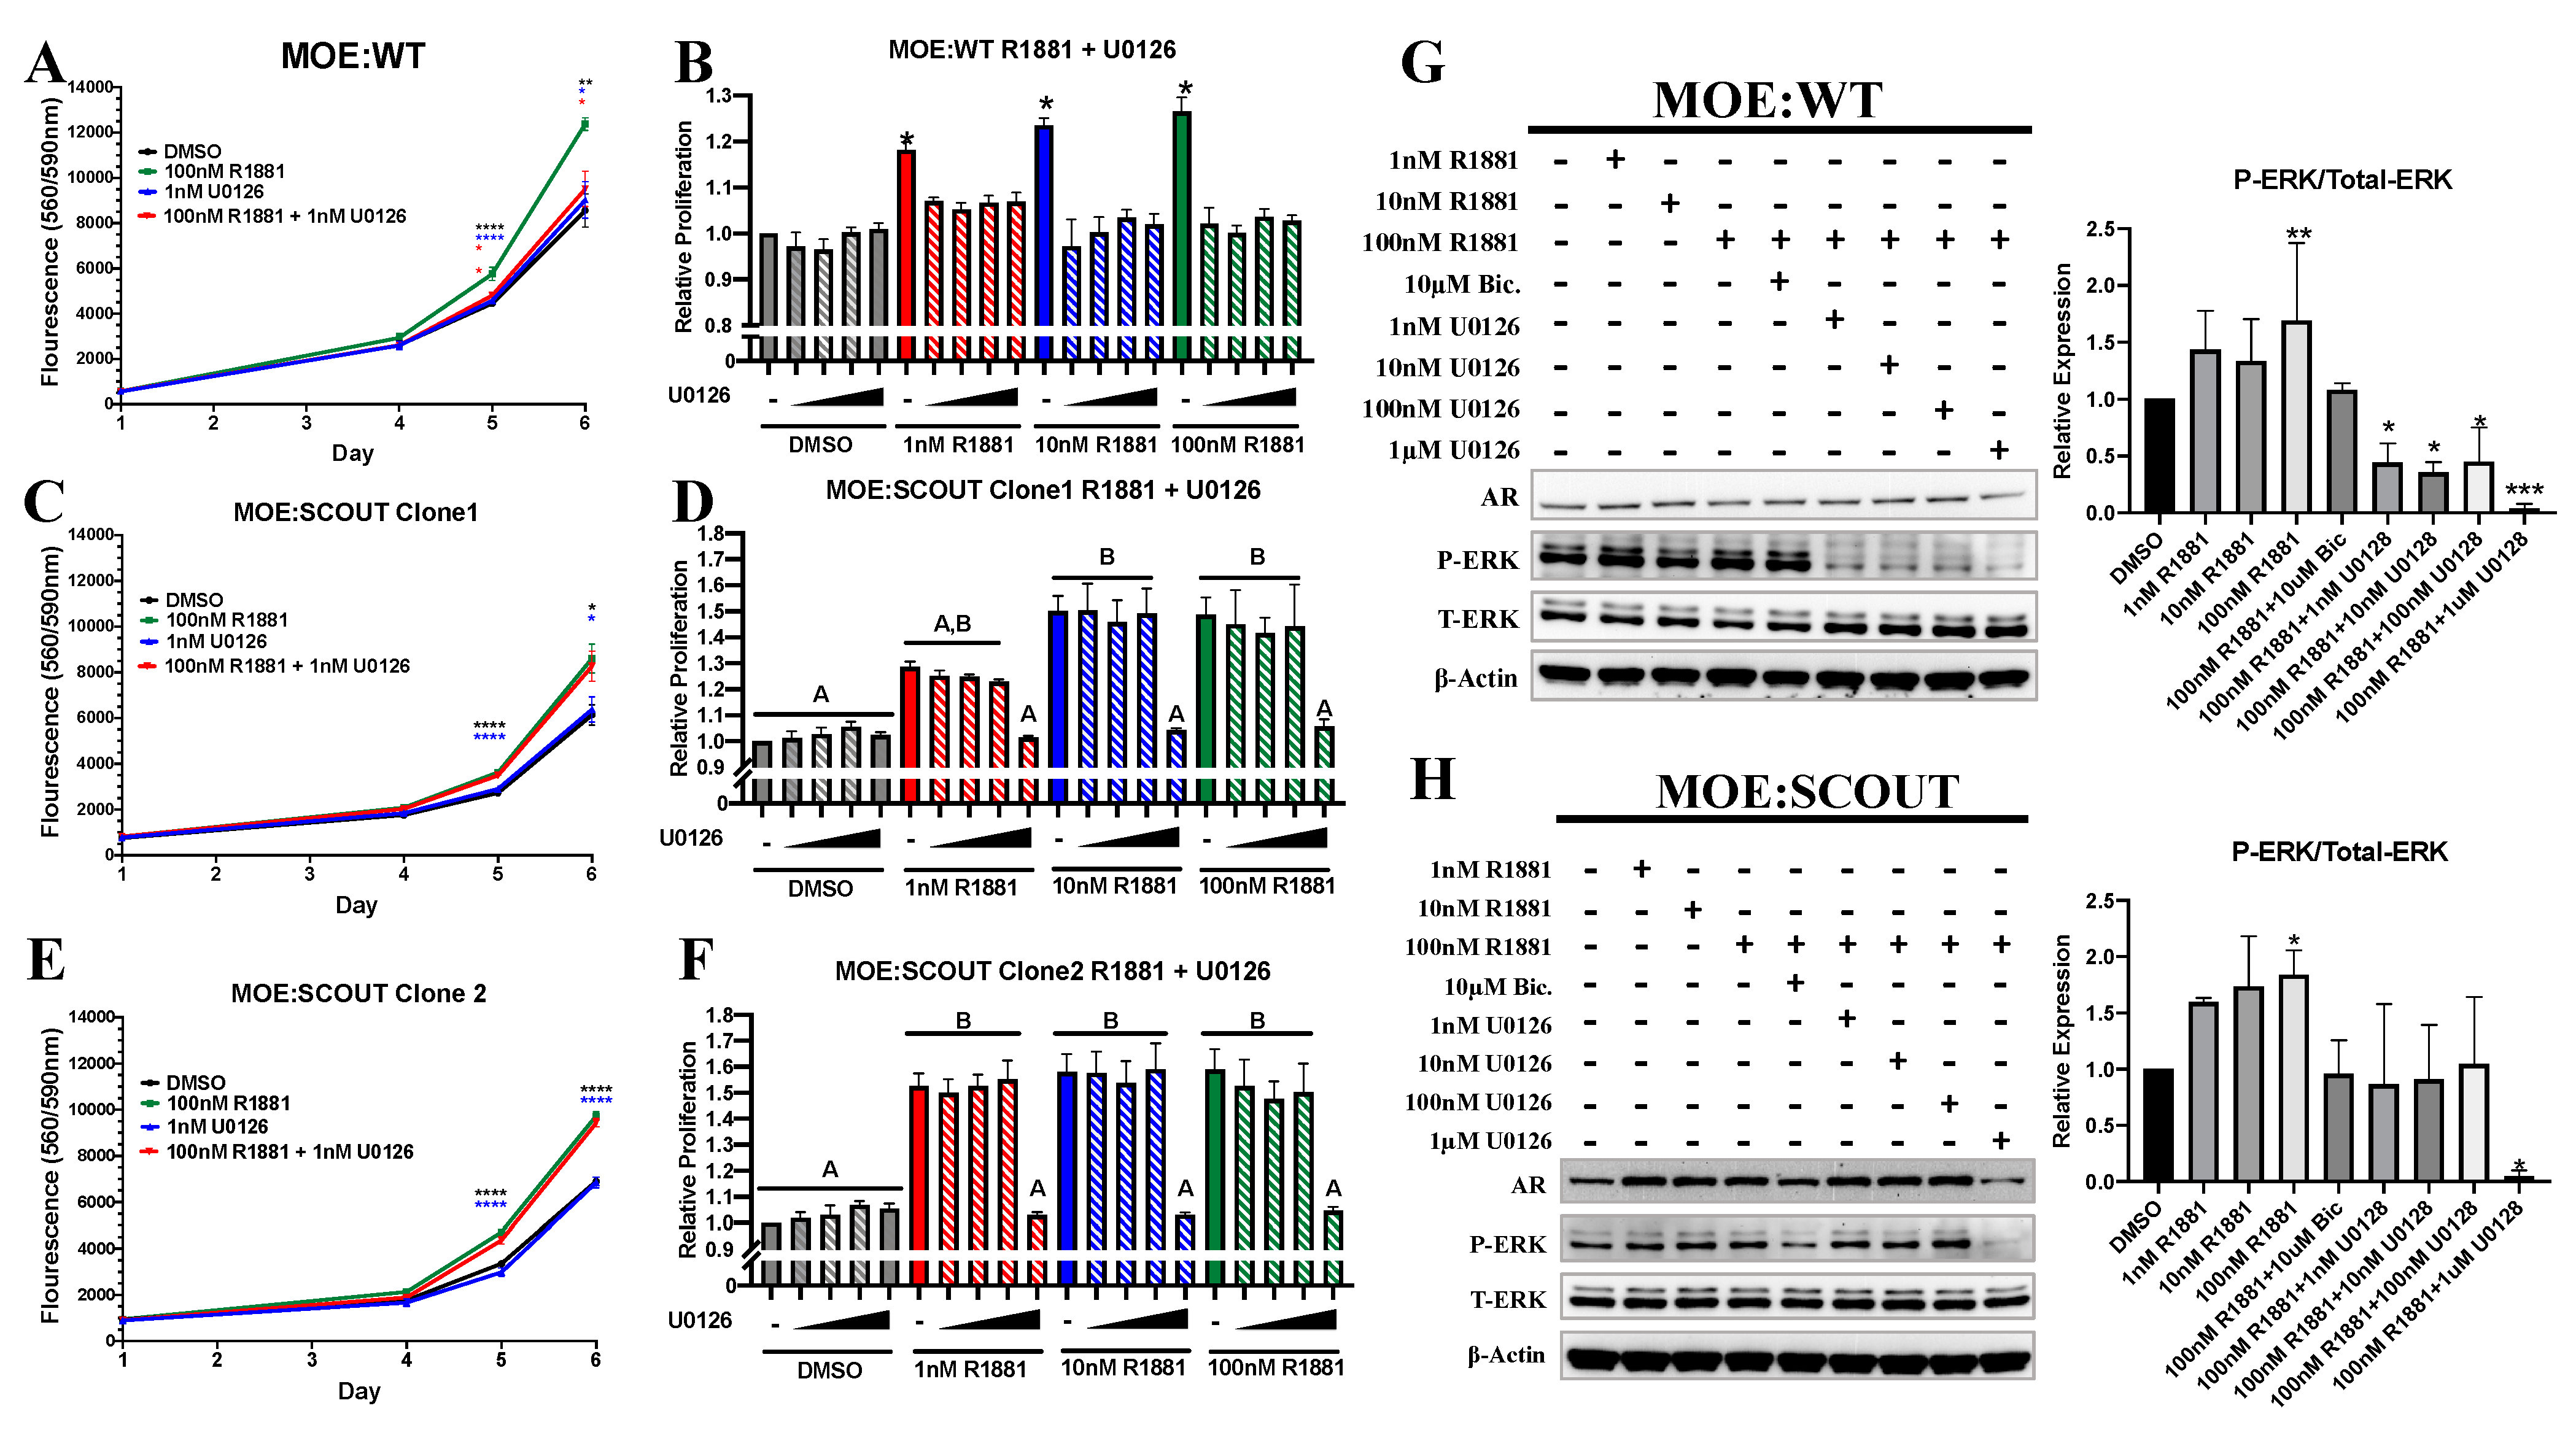
3.3. Androgens Mediated Proliferation Is Dependent on Presence of Phosphorylated ERK (pERK)
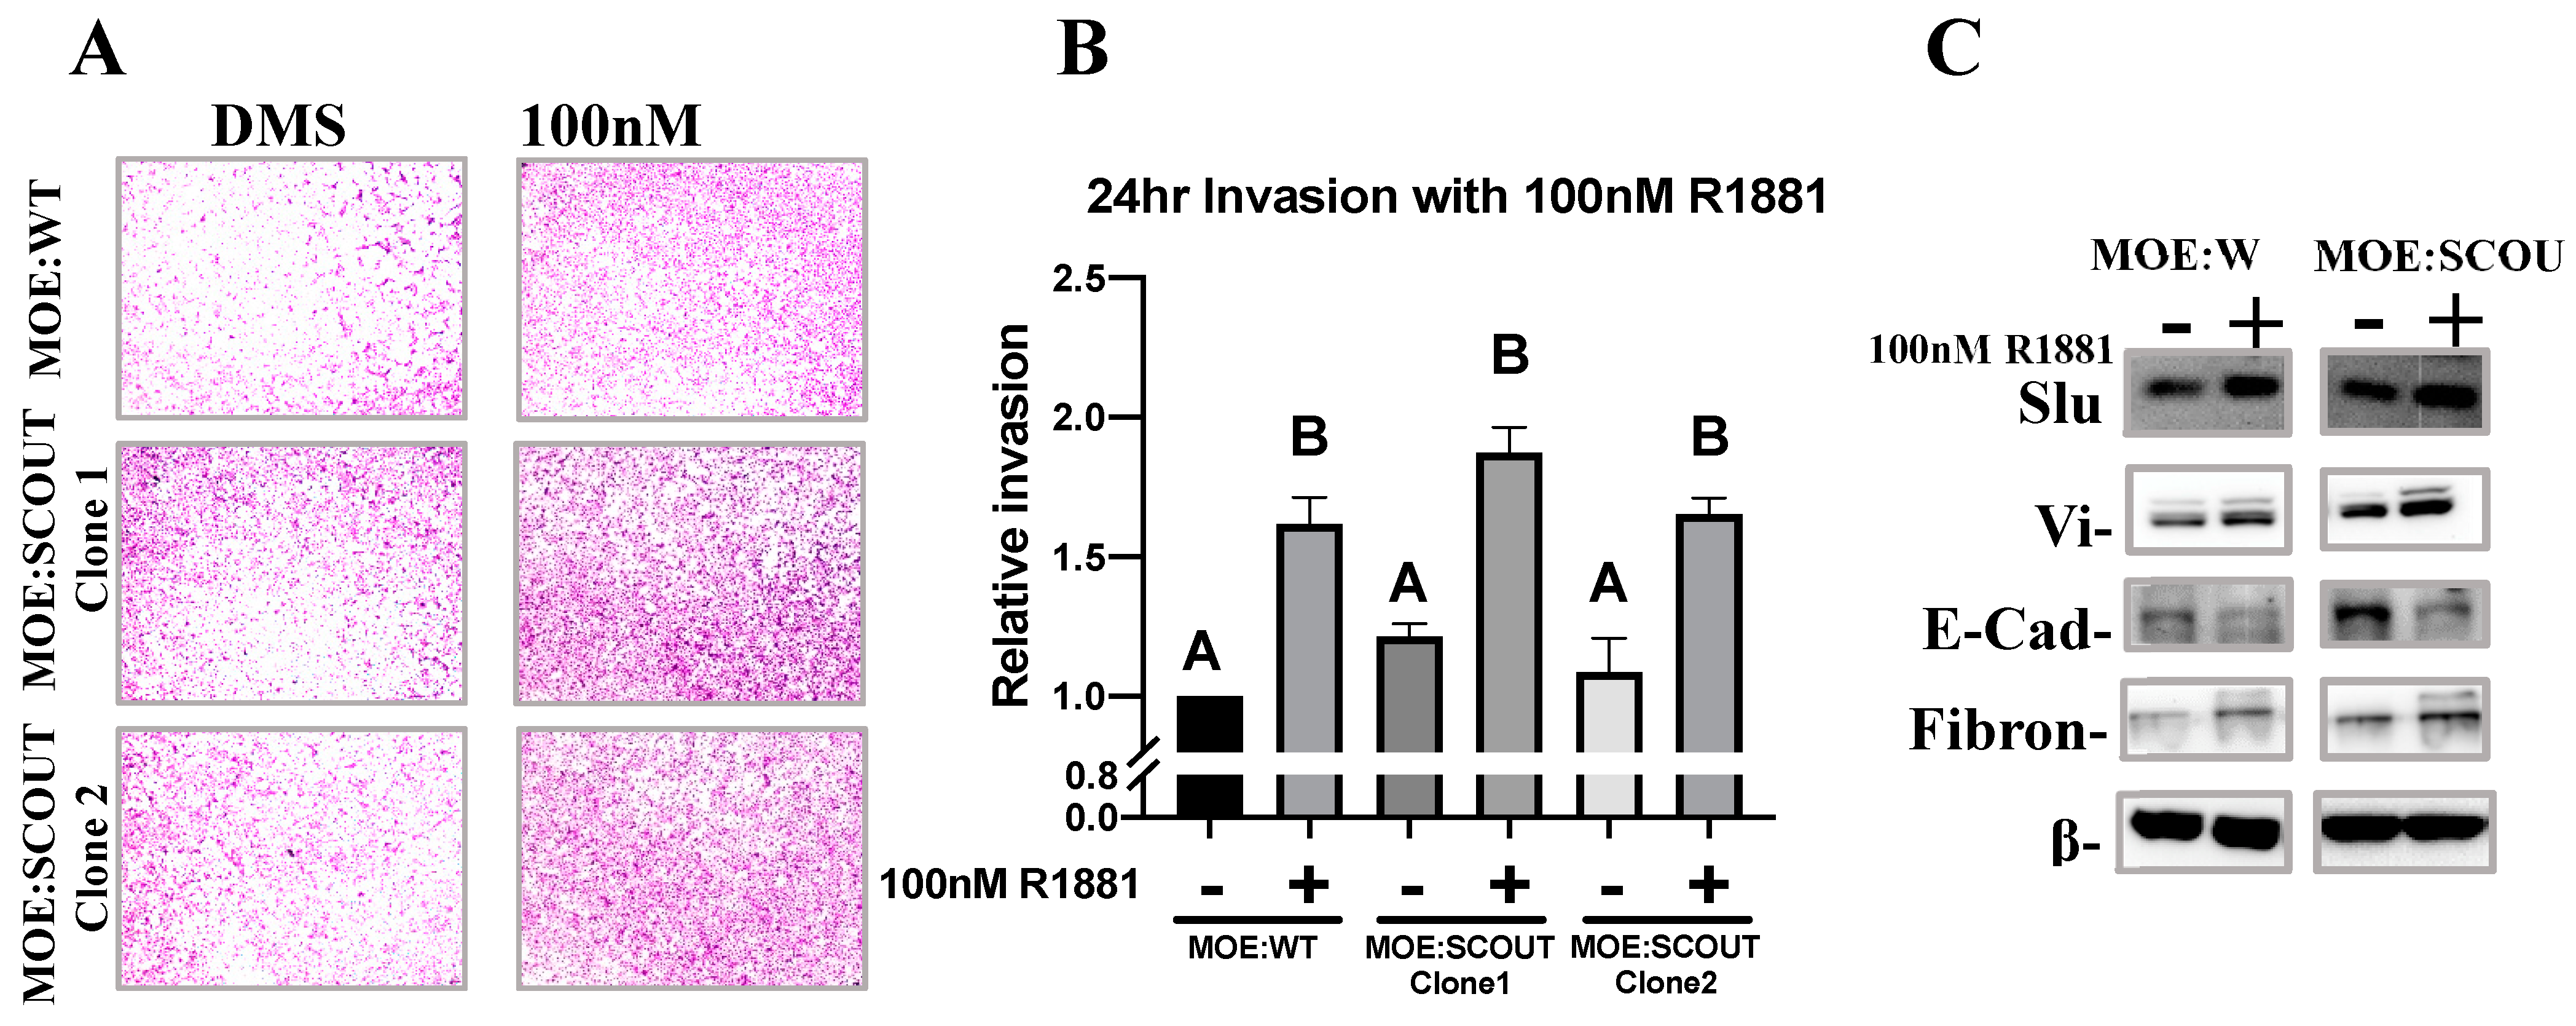
3.4. Androgens Increase Invasion and Mesenchymal Markers of Murine Oviductal Epithelial Cells
3.5. Ablation of pERK Partially Reduces Expression of AR Target Genes
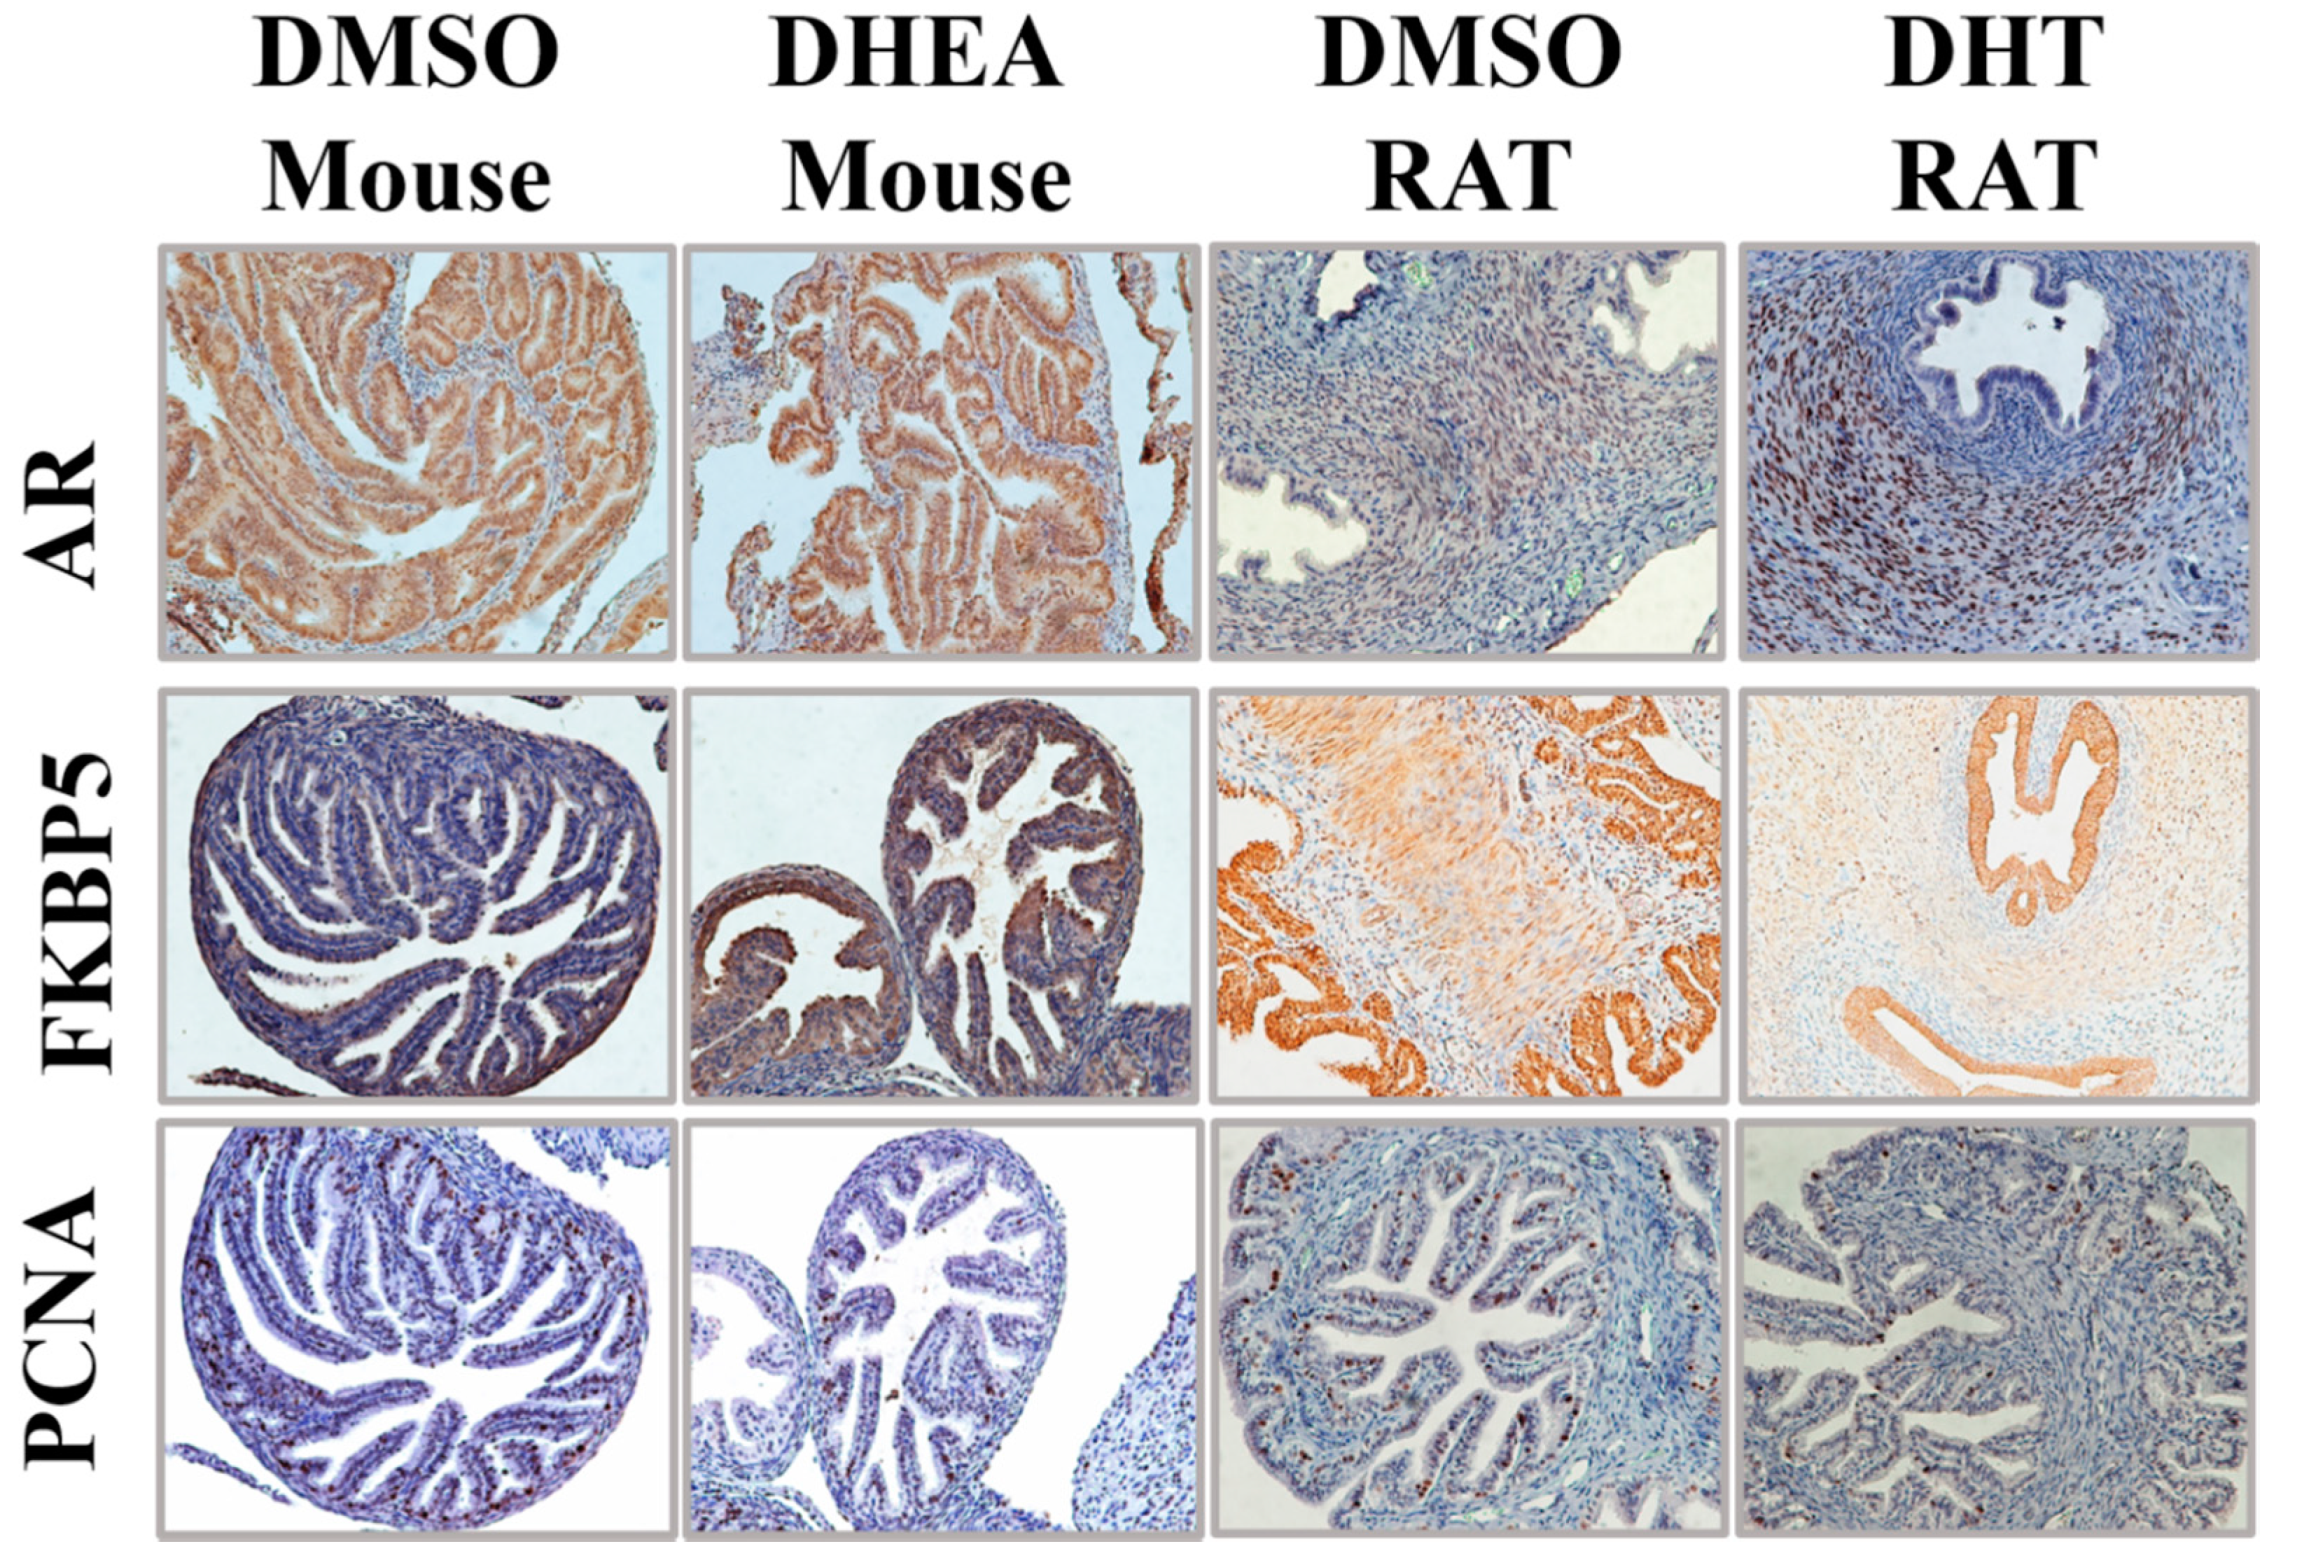
3.6. Rodent Models of PCOS Do Not Exhibit Epithelial Proliferation in the Oviducts
4. Discussion
5. Conclusions
Supplementary Materials
Author Contributions
Funding
Institutional Review Board Statement
Informed Consent Statement
Data Availability Statement
Acknowledgments
Conflicts of Interest
References
- Siegel, R.L.; Miller, K.D.; Jemal, A. Cancer statistics, 2020. CA Cancer J. Clin. 2020, 70, 7–30. [Google Scholar] [CrossRef]
- Torre, L.A.; Trabert, B.; DeSantis, C.E.; Miller, K.D.; Samimi, G.; Runowicz, C.D.; Gaudet, M.M.; Jemal, A.; Siegel, R.L. Ovarian Cancer Statistics, 2018. CA Cancer J. Clin. 2018, 68, 284–296. [Google Scholar] [CrossRef] [PubMed]
- Kim, J.; Park, E.Y.; Kim, O.; Schilder, J.M.; Coffey, D.M.; Cho, C.-H.; Bast, R.C. Cell origins of high-grade serous ovarian cancer. Cancers 2018, 10, 433. [Google Scholar] [CrossRef] [PubMed] [Green Version]
- Roh, M.H.; Yassin, Y.; Miron, A.; Mehra, K.K.; Mehrad, M.; Monte, N.M.; Mutter, G.L.; Nucci, M.R.; Ning, G.; Mckeon, F.D.; et al. High-grade fimbrial-ovarian carcinomas are unified by altered P53, PTEN and PAX2 expression. Mod. Pathol. 2010, 23, 1316–1324. [Google Scholar] [CrossRef] [PubMed] [Green Version]
- McDaniel, A.S.; Stall, J.N.; Hovelson, D.H.; Cani, A.K.; Liu, C.-J.; Tomlins, S.A.; Cho, K.R. Next generation sequencing of tubal intraepithelial carcinomas. JAMA Oncol. 2015, 1, 1128–1132. [Google Scholar] [CrossRef] [PubMed]
- Eddie, S.L.; Quartuccio, S.M.; Ó hAinmhire, E.; Moyle-Heyrman, G.; Lantvit, D.D.; Wei, J.-J.; Vanderhyden, B.C.; Burdette, J.E. Tumorigenesis and peritoneal colonization from fallopian tube epithelium. Oncotarget 2015, 6, 20500–20512. [Google Scholar] [CrossRef] [PubMed] [Green Version]
- Russo, A.; Czarnecki, A.A.; Dean, M.; Modi, D.A.; Lantvit, D.D.; Hardy, L.; Baligod, S.; Davis, D.A.; Wei, J.-J.; Burdette, J.E. PTEN loss in the fallopian tube induces hyperplasia and ovarian tumor formation. Oncogene 2018, 37, 1976–1990. [Google Scholar] [CrossRef] [PubMed]
- Crum, C.P.; Nucci, M.R.; Howitt, B.E.; Granter, S.R.; Parast, M.M.; Boyd, T.K. Diagnostic Gynecologic and Obstetric Pathology, 3rd ed.; Elsevier, Inc.: Philadelphia, PA, USA, 2018. [Google Scholar]
- Chen, E.Y.; Mehra, K.; Mehrad, M.; Ning, G.; Miron, A.; Mutter, G.L.; Monte, N.; Quade, B.J.; McKeon, F.D.; Yassin, Y.; et al. Secretory cell outgrowth, PAX2 and serous carcinogenesis in the fallopian tube. J. Pathol. 2010, 222, 110–116. [Google Scholar] [CrossRef] [PubMed] [Green Version]
- Ning, G.; Bijron, J.G.; Yamamoto, Y.; Wang, X.; Howitt, B.E.; Herfs, M.; Yang, E.; Hong, Y.; Cornille, M.; Wu, L.; et al. The PAX2-null immunophenotype defines multiple lineages with common expression signatures in benign and neoplastic oviductal epithelium. J. Pathol. 2014, 234, 478–487. [Google Scholar] [CrossRef] [PubMed]
- Colina, J.A.; Varughese, P.; Karthikeyan, S.; Salvi, A.; Modi, D.A.; Burdette, J.E. Reduced PAX2 expression in murine fallopian tube cells enhances estrogen receptor signaling. Carcinogenesis 2020, 41, 646–655. [Google Scholar] [CrossRef]
- Zhu, H.; Zhu, X.; Zheng, L.; Hu, X.; Sun, L.; Zhu, X. The role of the androgen receptor in ovarian cancer carcinogenesis and its clinical implications. Oncotarget 2016, 8, 29395–29405. [Google Scholar] [CrossRef] [PubMed] [Green Version]
- Kühnel, R.; de Graaff, J.; Rao, B.R.; Stolk, J.G. Androgen receptor predominance in human ovarian carcinoma. J. Steroid Biochem. 1987, 26, 393–397. [Google Scholar] [CrossRef]
- Lee, P.; Rosen, D.G.; Zhu, C.; Silva, E.G.; Liu, J. Expression of progesterone receptor is a favorable prognostic marker in ovarian cancer. Gynecol. Oncol. 2005, 96, 671–677. [Google Scholar] [CrossRef] [PubMed]
- De Toledo, M.C.S.; Sarian, L.O.; Sallum, L.F.; Andrade, L.L.A.; Vassallo, J.; de Paiva Silva, G.R.; Pinto, G.A.; Soares, F.A.; Fonseca, C.D.P.P.; Derchain, S.F.M. Analysis of the contribution of immunologically-detectable HER2, steroid receptors and of the “triple-negative” tumor status to disease-free and overall survival of women with epithelial ovarian cancer. Acta Histochem. 2014, 116, 440–447. [Google Scholar] [CrossRef] [PubMed]
- Helzlsouer, K.J.; Alberg, A.J.; Gordon, G.B.; Longcope, C.; Bush, T.L.; Hoffman, S.C.; Comstock, G.W. Serum gonadotropins and steroid hormones and the development of ovarian cancer. JAMA 1995, 274, 1926–1930. [Google Scholar] [CrossRef] [PubMed]
- Olsen, C.M.; Green, A.C.; Nagle, C.M.; Jordan, S.J.; Whiteman, D.C.; Bain, C.J.; Webb, P.M.; on behalf of the Australian Cancer Study Group (Ovarian Cancer); The Australian Ovarian Cancer Study Group. Epithelial ovarian cancer: Testing the ‘androgens hypothesis’. Endocr. Relat. Cancer 2008, 15, 1061–1068. [Google Scholar] [CrossRef] [Green Version]
- Hage, J.J.; Dekker, J.J.M.L.; Karim, R.B.; Verheijen, R.H.M.; Bloemena, E. Ovarian cancer in female-to-male transsexuals: Report of two cases. Gynecol. Oncol. 2000, 76, 413–415. [Google Scholar] [CrossRef] [PubMed]
- Dizon, D.S.; Tejada-Berges, T.; Koelliker, S.; Steinhoff, M.; Granai, C.O. Ovarian cancer associated with testosterone supplementation in a female-to-male transsexual patient. Gynecol. Obstet. Investig. 2006, 62, 226–228. [Google Scholar] [CrossRef] [PubMed]
- Barthelmess, E.K.; Naz, R.K. Polycystic ovary syndrome: Current status and future perspective. Front Biosci. 2014, 6, 104–119. [Google Scholar]
- Schildkraut, J. Epithelial ovarian cancer risk among women with polycystic ovary syndrome. Obstet. Gynecol. 1996, 88, 554–559. [Google Scholar] [CrossRef]
- Silva, E.G.; Tornos, C.; Fritsche, H.A.; El-Naggar, A.; Gray, K.; Ordonez, N.G.; Luna, M.; Gershenson, D. The induction of benign epithelial neoplasms of the ovaries of guinea pigs by testosterone stimulation: A potential animal model. Mod. Pathol. 1997, 10, 879–883. [Google Scholar]
- Sawada, M.; Terada, N.; Wada, A.; Mori, Y.; Yamasaki, M.; Saga, T.; Endo, K. Estrogen- and androgen-responsive growth of human ovarian adenocarcinoma heterotransplanted into nude mice. Int. J. Cancer 1990, 45, 359–363. [Google Scholar] [CrossRef]
- Edmondson, R.J.; Monaghan, J.M.; Davies, B.R. The human ovarian surface epithelium is an androgen responsive tissue. Br. J. Cancer 2002, 86, 879–885. [Google Scholar] [CrossRef] [Green Version]
- Stewart, S.L.; Querec, T.D.; Gruver, B.N.; O’Hare, B.; Babb, J.S.; Patriotis, C. Gonadotropin and steroid hormones stimulate proliferation of the rat ovarian surface epithelium. J. Cell. Physiol. 2004, 198, 119–124. [Google Scholar] [CrossRef]
- Ligr, M.; Patwa, R.R.; Daniels, G.; Pan, L.; Wu, X.; Li, Y.; Tian, L.; Wang, Z.; Xu, R.; Wu, J.; et al. Expression and function of androgen receptor coactivator P44/Mep50/WDR77 in ovarian cancer. PLoS ONE 2011, 6. [Google Scholar] [CrossRef]
- Du, F.; Li, Y.; Zhang, W.; Kale, S.P.; McFerrin, H.; Davenport, I.; Wang, G.; Skripnikova, E.; Li, X.-L.; Bowen, N.J.; et al. Highly and moderately aggressive mouse ovarian cancer cell lines exhibit differential gene expression. Tumor Biol. 2016, 37, 11147–11162. [Google Scholar] [CrossRef] [PubMed] [Green Version]
- Carey, A.-M.; Pramanik, R.; Nicholson, L.J.; Dew, T.K.; Martin, F.L.; Muir, G.H.; Morris, J.D.H. Ras-MEK-ERK signaling cascade regulates androgen receptor element-inducible gene transcription and DNA synthesis in prostate cancer cells. Int. J. Cancer 2007, 121, 520–527. [Google Scholar] [CrossRef] [PubMed]
- Huo, Y.-N.; Yeh, S.-D.; Lee, W.-S. Androgen receptor activation reduces the endothelial cell proliferation through activating the CSrc/AKT/P38/ERK/NFκB-mediated pathway. J. Steroid Biochem. Mol. Biol. 2019, 194, 105459. [Google Scholar] [CrossRef] [PubMed]
- Hardy, L.R.; Salvi, A.; Burdette, J.E. UnPAXing the divergent roles of PAX2 and PAX8 in high-grade serous ovarian cancer. Cancers 2018, 10, 262. [Google Scholar] [CrossRef] [PubMed] [Green Version]
- Maclean, A.; Bunni, E.; Makrydima, S.; Withington, A.; Kamal, A.M.; Valentijn, A.J.; Hapangama, D.K. Fallopian tube epithelial cells express androgen receptor and have a distinct hormonal responsiveness when compared with endometrial epithelium. Hum. Reprod. 2020, 35, 2097–2106. [Google Scholar] [CrossRef]
- Zink, K.E.; Dean, M.; Burdette, J.E.; Sanchez, L.M. Imaging mass spectrometry reveals crosstalk between the fallopian tube and the ovary that drives primary metastasis of ovarian cancer. ACS Cent. Sci. 2018, 4, 1360–1370. [Google Scholar] [CrossRef]
- Quartuccio, S.M.; Lantvit, D.D.; Bosland, M.C.; Burdette, J.E. Conditional inactivation of P53 in mouse ovarian surface epithelium does not alter MIS driven Smad2-dominant negative epithelium-lined inclusion cysts or teratomas. PLoS ONE 2013, 8. [Google Scholar] [CrossRef] [Green Version]
- Zink, K.E.; Dean, M.; Burdette, J.E.; Sanchez, L.M. A newly developed method for capturing small molecule communication between tissues and cells using imaging mass spectrometry. J. Vis. Exp. 2019. [Google Scholar] [CrossRef]
- Skehan, P.; Storeng, R.; Scudiero, D.; Monks, A.; McMahon, J.; Vistica, D.; Warren, J.T.; Bokesch, H.; Kenney, S.; Boyd, M.R. New colorimetric cytotoxicity assay for anticancer-drug screening. J. Natl. Cancer Inst. 1990, 82, 1107–1112. [Google Scholar] [CrossRef] [PubMed]
- Modi, D.A.; Tagare, R.D.; Karthikeyan, S.; Russo, A.; Dean, M.; Davis, D.A.; Lantvit, D.D.; Burdette, J.E. PAX2 function, regulation and targeting in fallopian tube-derived high grade serous ovarian cancer. Oncogene 2017, 36, 3015–3024. [Google Scholar] [CrossRef] [PubMed] [Green Version]
- Wang, Q.; Kim, J.Y.; Xue, K.; Liu, J.; Leader, A.; Tsang, B.K. Chemerin, a novel regulator of follicular steroidogenesis and its potential involvement in polycystic ovarian syndrome. Endocrinology 2012, 153, 5600–5611. [Google Scholar] [CrossRef] [PubMed] [Green Version]
- Lima, P.D.A.; Nivet, A.-L.; Wang, Q.; Chen, Y.-A.; Leader, A.; Cheung, A.; Tzeng, C.-R.; Tsang, B.K. Polycystic ovary syndrome: Possible involvement of androgen-induced, chemerin-mediated ovarian recruitment of monocytes/macrophages. Biol. Reprod. 2018, 99, 838–852. [Google Scholar] [CrossRef] [PubMed] [Green Version]
- Huang, Y.; Yu, Y.; Gao, J.; Li, R.; Zhang, C.; Zhao, H.; Zhao, Y.; Qiao, J. Impaired oocyte quality induced by dehydroepiandrosterone is partially rescued by metformin treatment. PLoS ONE 2015, 10, e0122370. [Google Scholar] [CrossRef] [PubMed]
- Jackson-Bey, T.; Colina, J.; Isenberg, B.C.; Coppeta, J.; Urbanek, M.; Kim, J.J.; Woodruff, T.K.; Burdette, J.E.; Russo, A. Exposure of human fallopian tube epithelium to elevated testosterone results in alteration of cilia gene expression and beating. Hum. Reprod. 2020, 35, 2086–2096. [Google Scholar] [CrossRef] [PubMed]
- Buhi, W.C.; Alvarez, I.M.; Kouba, A.J. Secreted proteins of the oviduct. Cells Tissues Organs 2000, 166, 165–179. [Google Scholar] [CrossRef]
- Hunter, R.H.F.; Einer-Jensen, N.; Greve, T. Somatic cell amplification of early pregnancy factors in the fallopian tube. Ital. J. Anat. Embryol. 2005, 110, 195–203. [Google Scholar] [PubMed]
- Lyons, R.A.; Saridogan, E.; Djahanbakhch, O. The effect of ovarian follicular fluid and peritoneal fluid on fallopian tube ciliary beat frequency. Hum. Reprod. 2006, 21, 52–56. [Google Scholar] [CrossRef] [PubMed] [Green Version]
- Wishart, D.S.; Feunang, Y.D.; Marcu, A.; Guo, A.C.; Liang, K.; Vázquez-Fresno, R.; Sajed, T.; Johnson, D.; Li, C.; Karu, N.; et al. HMDB 4.0: The human metabolome database for 2018. Nucleic Acids Res. 2018, 46, D608–D617. [Google Scholar] [CrossRef]
- Sumner, L.W.; Amberg, A.; Barrett, D.; Beale, M.H.; Beger, R.; Daykin, C.A.; Fan, T.W.-M.; Fiehn, O.; Goodacre, R.; Griffin, J.L.; et al. Proposed minimum reporting standards for chemical analysis. Metabolomics 2007, 3, 211–221. [Google Scholar] [CrossRef] [PubMed] [Green Version]
- Hosohata, K.; Li, P.; Hosohata, Y.; Qin, J.; Roeder, R.G.; Wang, Z. Purification and identification of a novel complex which is involved in androgen receptor-dependent transcription. Mol. Cell. Biol. 2003, 23, 7019–7029. [Google Scholar] [CrossRef] [Green Version]
- Migliaccio, A.; Castoria, G.; Di Domenico, M.; de Falco, A.; Bilancio, A.; Lombardi, M.; Barone, M.V.; Ametrano, D.; Zannini, M.S.; Abbondanza, C.; et al. Steroid-induced androgen receptor–oestradiol receptor β–src complex triggers prostate cancer cell proliferation. EMBO J. 2000, 19, 5406–5417. [Google Scholar] [CrossRef] [Green Version]
- Hara, T.; Miyazaki, H.; Lee, A.; Tran, C.P.; Reiter, R.E. Androgen receptor and invasion in prostate cancer. Cancer Res. 2008, 68, 1128–1135. [Google Scholar] [CrossRef] [Green Version]
- Rosenfield, R.L.; Ehrmann, D.A. The pathogenesis of Polycystic Ovary Syndrome (PCOS): The hypothesis of PCOS as functional ovarian hyperandrogenism revisited. Endocr. Rev. 2016, 37, 467–520. [Google Scholar] [CrossRef] [PubMed]
- Michmerhuizen, A.R.; Spratt, D.E.; Pierce, L.J.; Speers, C.W. Are we there yet? Understanding androgen receptor signaling in breast cancer. NPJ Breast Cancer 2020, 6. [Google Scholar] [CrossRef] [PubMed]
- Lin, H.-K.; Hu, Y.-C.; Lee, D.K.; Chang, C. Regulation of androgen receptor signaling by PTEN (phosphatase and tensin homolog deleted on chromosome 10) tumor suppressor through distinct mechanisms in prostate cancer cells. Mol. Endocrinol. 2004, 18, 2409–2423. [Google Scholar] [CrossRef]
- Carver, B.S.; Chapinski, C.; Wongvipat, J.; Hieronymus, H.; Chen, Y.; Chandarlapaty, S.; Arora, V.K.; Le, C.; Koutcher, J.; Scher, H.; et al. Reciprocal feedback regulation of PI3K and androgen receptor signaling in PTEN-deficient prostate cancer. Cancer Cell 2011, 19, 575–586. [Google Scholar] [CrossRef] [PubMed] [Green Version]
- Kohno, M.; Pouyssegur, J. Targeting the ERK signaling pathway in cancer therapy. Ann. Med. 2006, 38, 200–211. [Google Scholar] [CrossRef] [PubMed]
- Russo, A.; Colina, J.A.; Baligod, S.; Moy, J.; Czarnecki, A.; Lantvit, D.D.; Dean, M.; Burdette, J.E. Silencing PTEN in the fallopian tube promotes enrichment of cancer stem cell-like function through loss of PAX2. Cell Death Dis. 2021. [Google Scholar] [CrossRef] [PubMed]
- Lehman, J.A.; Gomez-Cambronero, J. Molecular crosstalk between p70s6k and MAPK cell signaling pathways. Biochem. Biophys. Res. Commun. 2002, 293, 463–469. [Google Scholar] [CrossRef] [Green Version]
- Rice, M.A.; Malhotra, S.V.; Stoyanova, T. Second-generation antiandrogens: From discovery to standard of care in castration resistant prostate cancer. Front. Oncol. 2019, 9. [Google Scholar] [CrossRef]
- Hird, A.E.; Magee, D.E.; Bhindi, B.; Ye, X.Y.; Chandrasekar, T.; Goldberg, H.; Klotz, L.; Fleshner, N.; Satkunasivam, R.; Klaassen, Z.; et al. A systematic review and network meta-analysis of novel androgen receptor inhibitors in non-metastatic castration-resistant prostate cancer. Clin. Genitourin. Cancer 2020, 18, 343–350. [Google Scholar] [CrossRef] [PubMed]
- Gucalp, A.; Traina, T.A. Targeting the androgen receptor in triple negative breast cancer. Curr. Probl. Cancer 2016, 40, 141–150. [Google Scholar] [CrossRef] [PubMed] [Green Version]
- Gucalp, A.; Tolaney, S.; Isakoff, S.J.; Ingle, J.N.; Liu, M.C.; Carey, L.A.; Blackwell, K.; Rugo, H.; Nabell, L.; Forero, A.; et al. Phase II trial of bicalutamide in patients with androgen receptor–positive, estrogen receptor–negative metastatic breast cancer. Clin. Cancer Res. 2013, 19, 5505–5512. [Google Scholar] [CrossRef] [Green Version]
- Traina, T.A.; Miller, K.; Yardley, D.A.; Eakle, J.; Schwartzberg, L.S.; O’Shaughnessy, J.; Gradishar, W.; Schmid, P.; Winer, E.; Kelly, C.; et al. Enzalutamide for the treatment of androgen receptor–expressing triple-negative breast cancer. J. Clin. Oncol. 2018, 36, 884–890. [Google Scholar] [CrossRef] [PubMed]
- Syed, V.; Ulinski, G.; Mok, S.C.; Yiu, G.K.; Ho, S.-M. Expression of gonadotropin receptor and growth responses to key reproductive hormones in normal and malignant human ovarian surface epithelial cells. Cancer Res. 2001, 61, 6768–6776. [Google Scholar]
- Elattar, A.; Warburton, K.G.; Mukhopadhyay, A.; Freer, R.M.; Shaheen, F.; Cross, P.; Plummer, E.R.; Robson, C.N.; Edmondson, R.J. Androgen receptor expression is a biological marker for androgen sensitivity in high grade serous epithelial ovarian cancer. Gynecol. Oncol. 2012, 124, 142–147. [Google Scholar] [CrossRef] [PubMed]
- Gibson, D.A.; Simitsidellis, I.; Collins, F.; Saunders, P.T.K. Evidence of androgen action in endometrial and ovarian cancers. Endocr.-Relat. Cancer 2014, 21, T203–T218. [Google Scholar] [CrossRef] [PubMed]
- Park, B.Y.; Grisham, R.N.; den Hollander, B.; Thapi, D.; Berman, T.; de Stanchina, E.; Zhou, Q.; Iyer, G.; Aghajanian, C.; Spriggs, D.R. Tumor inhibition by enzalutamide in a xenograft model of ovarian cancer. Cancer Investig. 2016, 34, 517–520. [Google Scholar] [CrossRef] [PubMed]
- Vassilomanolakis, M.; Koumakis, G.; Barbounis, V.; Hajichristou, H.; Tsousis, S.; Efremidis, A. A Phase II study of flutamide in ovarian cancer. Oncology 1997, 54, 199–202. [Google Scholar] [CrossRef] [PubMed]
- Tumolo, S.; Ramanath Rao, B.; van der Burg, M.E.; Guastalla, J.P.; Renard, J.; Vermorken, J.B. Phase II trial of flutamide in advanced ovarian cancer: An EORTC gynaecological cancer cooperative group study. Eur. J. Cancer 1994, 30, 911–914. [Google Scholar] [CrossRef]
- Levine, D.; Park, K.; Juretzka, M.; Esch, J.; Hensley, M.; Aghajanian, C.; Lewin, S.; Konner, J.; Derosa, F.; Spriggs, D.; et al. A Phase II evaluation of goserelin and bicalutamide in patients with ovarian cancer in second or higher complete clinical disease remission. Cancer 2007, 110, 2458–2466. [Google Scholar] [CrossRef] [PubMed]


Publisher’s Note: MDPI stays neutral with regard to jurisdictional claims in published maps and institutional affiliations. |
© 2021 by the authors. Licensee MDPI, Basel, Switzerland. This article is an open access article distributed under the terms and conditions of the Creative Commons Attribution (CC BY) license (https://creativecommons.org/licenses/by/4.0/).
Share and Cite
Colina, J.A.; Zink, K.E.; Eliadis, K.; Salehi, R.; Gargus, E.S.; Wagner, S.R.; Moss, K.J.; Baligod, S.; Li, K.; Kirkpatrick, B.J.; et al. Fallopian Tube-Derived Tumor Cells Induce Testosterone Secretion from the Ovary, Increasing Epithelial Proliferation and Invasion. Cancers 2021, 13, 1925. https://doi.org/10.3390/cancers13081925
Colina JA, Zink KE, Eliadis K, Salehi R, Gargus ES, Wagner SR, Moss KJ, Baligod S, Li K, Kirkpatrick BJ, et al. Fallopian Tube-Derived Tumor Cells Induce Testosterone Secretion from the Ovary, Increasing Epithelial Proliferation and Invasion. Cancers. 2021; 13(8):1925. https://doi.org/10.3390/cancers13081925
Chicago/Turabian StyleColina, Jose A., Katherine E. Zink, Kanella Eliadis, Reza Salehi, Emma S. Gargus, Sarah R. Wagner, Kristine J. Moss, Seth Baligod, Kailiang Li, Brenna J. Kirkpatrick, and et al. 2021. "Fallopian Tube-Derived Tumor Cells Induce Testosterone Secretion from the Ovary, Increasing Epithelial Proliferation and Invasion" Cancers 13, no. 8: 1925. https://doi.org/10.3390/cancers13081925