
First-Line Pembrolizumab Mono- or Combination Therapy of Non-Small Cell Lung Cancer: Baseline Metabolic Biomarkers Predict Outcomes

 , ,
, ,
Abstract
:Simple Summary
Abstract
1. Introduction
2. Materials and Methods
2.1. Patients
2.2. Image Acquisition Protocol and Analysis
2.3. Laboratory Analyses
2.4. Response Assessment
2.5. Statistics
3. Results
4. Discussion
5. Conclusions
Author Contributions
Funding
Institutional Review Board Statement
Informed Consent Statement
Data Availability Statement
Acknowledgments
Conflicts of Interest
References
- National Comprehensive Cancer Network Non-Small Cell Lung Cancer (Version 5.2021). Available online: https://www.nccn.org/guidelines/guidelines-detail?category=1&id=1450 (accessed on 3 July 2021).
- Planchard, D.; Popat, S.; Kerr, K.; Novello, S.; Smit, E.F.; Faivre-Finn, C.; Mok, T.S.; Reck, M.; Van Schil, P.E.; Hellmann, M.D.; et al. Metastatic non-small cell lung cancer: ESMO Clinical Practice Guidelines for diagnosis, treatment and follow-up. Ann. Oncol. 2018, 29, iv192–iv237. [Google Scholar] [CrossRef]
- Postmus, P.E.; Kerr, K.M.; Oudkerk, M.; Senan, S.; Waller, D.A.; Vansteenkiste, J.; Escriu, C.; Peters, S. Early and locally advanced non-small-cell lung cancer (NSCLC): ESMO Clinical Practice Guidelines for diagnosis, treatment and follow-up. Ann. Oncol. 2017, 28, iv1–iv21. [Google Scholar] [CrossRef]
- Eze, C.; Schmidt-Hegemann, N.-S.; Sawicki, L.M.; Kirchner, J.; Roengvoraphoj, O.; Käsmann, L.; Mittlmeier, L.M.; Kunz, W.G.; Tufman, A.; Dinkel, J.; et al. PET/CT imaging for evaluation of multimodal treatment efficacy and toxicity in advanced NSCLC—Current state and future directions. Eur. J. Nucl. Med. Mol. Imaging 2021, 48, 3975–3989. [Google Scholar] [CrossRef]
- Borghaei, H.; Paz-Ares, L.; Horn, L.; Spigel, D.R.; Steins, M.; Ready, N.E.; Chow, L.Q.; Vokes, E.E.; Felip, E.; Holgado, E.; et al. Nivolumab versus Docetaxel in Advanced Nonsquamous Non–Small-Cell Lung Cancer. N. Engl. J. Med. 2015, 373, 1627–1639. [Google Scholar] [CrossRef] [PubMed]
- Brahmer, J.; Reckamp, K.L.; Baas, P.; Crinò, L.; Eberhardt, W.E.E.; Poddubskaya, E.; Antonia, S.; Pluzanski, A.; Vokes, E.E.; Holgado, E.; et al. Nivolumab versus Docetaxel in Advanced Squamous-Cell Non–Small-Cell Lung Cancer. N. Engl. J. Med. 2015, 373, 123–135. [Google Scholar] [CrossRef] [Green Version]
- Herbst, R.S.; Baas, P.; Kim, D.-W.; Felip, E.; Pérez-Gracia, J.L.; Han, J.-Y.; Molina, J.; Kim, J.-H.; Arvis, C.D.; Ahn, M.-J.; et al. Pembrolizumab versus docetaxel for previously treated, PD-L1-positive, advanced non-small-cell lung cancer (KEYNOTE-010): A randomised controlled trial. Lancet 2016, 387, 1540–1550. [Google Scholar] [CrossRef]
- Rittmeyer, A.; Barlesi, F.; Waterkamp, D.; Park, K.; Ciardiello, F.; von Pawel, J.; Gadgeel, S.M.; Hida, T.; Kowalski, D.M.; Dols, M.C.; et al. Atezolizumab versus docetaxel in patients with previously treated non-small-cell lung cancer (OAK): A phase 3, open-label, multicentre randomised controlled trial. Lancet 2017, 389, 255–265. [Google Scholar] [CrossRef]
- Ferrara, R.; Imbimbo, M.; Malouf, R.; Paget-Bailly, S.; Calais, F.; Marchal, C.; Westeel, V. Single or combined immune checkpoint inhibitors compared to first-line platinum-based chemotherapy with or without bevacizumab for people with advanced non-small cell lung cancer. Cochrane Database Syst. Rev. 2021, 4, 1465–1858. [Google Scholar] [CrossRef]
- Paz-Ares, L.; Luft, A.; Vicente, D.; Tafreshi, A.; Gümüş, M.; Mazières, J.; Hermes, B.; Çay Şenler, F.; Csőszi, T.; Fülöp, A.; et al. Pembrolizumab plus Chemotherapy for Squamous Non–Small-Cell Lung Cancer. N. Engl. J. Med. 2018, 379, 2040–2051. [Google Scholar] [CrossRef] [PubMed]
- Gandhi, L.; Rodríguez-Abreu, D.; Gadgeel, S.; Esteban, E.; Felip, E.; De Angelis, F.; Domine, M.; Clingan, P.; Hochmair, M.J.; Powell, S.F.; et al. Pembrolizumab plus Chemotherapy in Metastatic Non–Small-Cell Lung Cancer. N. Engl. J. Med. 2018, 378, 2078–2092. [Google Scholar] [CrossRef] [PubMed]
- Reck, M.; Rodríguez-Abreu, D.; Robinson, A.G.; Hui, R.; Csőszi, T.; Fülöp, A.; Gottfried, M.; Peled, N.; Tafreshi, A.; Cuffe, S.; et al. Five-Year Outcomes with Pembrolizumab Versus Chemotherapy for Metastatic Non–Small-Cell Lung Cancer with PD-L1 Tumor Proportion Score ≥ 50%. J. Clin. Oncol. 2021, 39, 2339–2349. [Google Scholar] [CrossRef] [PubMed]
- Gadgeel, S.; Rodríguez-Abreu, D.; Speranza, G.; Esteban, E.; Felip, E.; Dómine, M.; Hui, R.; Hochmair, M.J.; Clingan, P.; Powell, S.F.; et al. Updated Analysis from KEYNOTE-189: Pembrolizumab or Placebo Plus Pemetrexed and Platinum for Previously Untreated Metastatic Nonsquamous Non–Small-Cell Lung Cancer. J. Clin. Oncol. 2020, 38, 1505–1517. [Google Scholar] [CrossRef]
- Bodor, J.N.; Boumber, Y.; Borghaei, H. Biomarkers for immune checkpoint inhibition in non–small cell lung cancer (NSCLC). Cancer 2020, 126, 260–270. [Google Scholar] [CrossRef]
- Huemer, F.; Lang, D.; Westphal, T.; Gampenrieder, S.P.; Hutarew, G.; Weiss, L.; Hackl, H.; Lamprecht, B.; Rinnerthaler, G.; Greil, R. Baseline Absolute Lymphocyte Count and ECOG Performance Score Are Associated with Survival in Advanced Non-Small Cell Lung Cancer Undergoing PD-1/PD-L1 Blockade. J. Clin. Med. 2019, 8, 1014. [Google Scholar] [CrossRef] [Green Version]
- Riedl, J.M.; Barth, D.A.; Brueckl, W.M.; Zeitler, G.; Foris, V.; Mollnar, S.; Stotz, M.; Rossmann, C.H.; Terbuch, A.; Balic, M.; et al. C-Reactive Protein (CRP) Levels in Immune Checkpoint Inhibitor Response and Progression in Advanced Non-Small Cell Lung Cancer: A Bi-Center Study. Cancers 2020, 12, 2319. [Google Scholar] [CrossRef]
- Lang, D.; Wahl, G.; Poier, N.; Graf, S.; Kiesl, D.; Lamprecht, B.; Gabriel, M. Impact of PET/CT for Assessing Response to Immunotherapy—A Clinical Perspective. J. Clin. Med. 2020, 9, 3483. [Google Scholar] [CrossRef] [PubMed]
- Aide, N.; De Pontdeville, M.; Lopci, E. Evaluating response to immunotherapy with 18F-FDG PET/CT: Where do we stand? Eur. J. Nucl. Med. Mol. Imaging 2020, 47, 1019–1021. [Google Scholar] [CrossRef] [PubMed] [Green Version]
- Evangelista, L.; Cuppari, L.; Menis, J.; Bonanno, L.; Reccia, P.; Frega, S.; Pasello, G. 18F-FDG PET/CT in non-small-cell lung cancer patients. Nucl. Med. Commun. 2019, 40, 802–807. [Google Scholar] [CrossRef]
- Sharma, A.; Mohan, A.; Bhalla, A.S.; Sharma, M.C.; Vishnubhatla, S.; Das, C.J.; Pandey, A.K.; Sekhar Bal, C.; Patel, C.D.; Sharma, P.; et al. Role of Various Metabolic Parameters Derived from Baseline 18F-FDG PET/CT as Prognostic Markers in Non–Small Cell Lung Cancer Patients Undergoing Platinum-Based Chemotherapy. Clin. Nucl. Med. 2018, 43, e8–e17. [Google Scholar] [CrossRef]
- Hashimoto, K.; Kaira, K.; Yamaguchi, O.; Mouri, A.; Shiono, A.; Miura, Y.; Murayama, Y.; Kobayashi, K.; Kagamu, H.; Kuji, I. Potential of FDG-PET as Prognostic Significance after anti-PD-1 Antibody against Patients with Previously Treated Non-Small Cell Lung Cancer. J. Clin. Med. 2020, 9, 725. [Google Scholar] [CrossRef] [Green Version]
- Dall’Olio, F.G.; Calabrò, D.; Conci, N.; Argalia, G.; Marchese, P.V.; Fabbri, F.; Fragomeno, B.; Ricci, D.; Fanti, S.; Ambrosini, V.; et al. Baseline total metabolic tumour volume on 2-deoxy-2-[18F]fluoro-d-glucose positron emission tomography-computed tomography as a promising biomarker in patients with advanced non–small cell lung cancer treated with first-line pembrolizumab. Eur. J. Cancer 2021, 150, 99–107. [Google Scholar] [CrossRef]
- Monaco, L.; Gemelli, M.; Gotuzzo, I.; Bauckneht, M.; Crivellaro, C.; Genova, C.; Cortinovis, D.; Zullo, L.; Ammoni, L.C.; Bernasconi, D.P.; et al. Metabolic Parameters as Biomarkers of Response to Immunotherapy and Prognosis in Non-Small Cell Lung Cancer (NSCLC): A Real World Experience. Cancers 2021, 13, 1634. [Google Scholar] [CrossRef]
- Polverari, G.; Ceci, F.; Bertaglia, V.; Reale, M.L.; Rampado, O.; Gallio, E.; Passera, R.; Liberini, V.; Scapoli, P.; Arena, V.; et al. 18F-FDG Pet Parameters and Radiomics Features Analysis in Advanced Nsclc Treated with Immunotherapy as Predictors of Therapy Response and Survival. Cancers 2020, 12, 1163. [Google Scholar] [CrossRef]
- Seban, R.-D.; Assie, J.-B.; Giroux-Leprieur, E.; Massiani, M.-A.; Soussan, M.; Bonardel, G.; Chouaid, C.; Playe, M.; Goldfarb, L.; Duchemann, B.; et al. FDG-PET biomarkers associated with long-term benefit from first-line immunotherapy in patients with advanced non-small cell lung cancer. Ann. Nucl. Med. 2020, 34, 968–974. [Google Scholar] [CrossRef]
- Yamaguchi, O.; Kaira, K.; Hashimoto, K.; Mouri, A.; Shiono, A.; Miura, Y.; Murayama, Y.; Kobayashi, K.; Kagamu, H.; Kuji, I. Tumor metabolic volume by 18F-FDG-PET as a prognostic predictor of first-line pembrolizumab for NSCLC patients with PD-L1 ≥ 50%. Sci. Rep. 2020, 10, 14990. [Google Scholar] [CrossRef] [PubMed]
- Castello, A.; Toschi, L.; Rossi, S.; Mazziotti, E.; Lopci, E. The immune-metabolic-prognostic index and clinical outcomes in patients with non-small cell lung carcinoma under checkpoint inhibitors. J. Cancer Res. Clin. Oncol. 2020, 146, 1235–1243. [Google Scholar] [CrossRef] [PubMed]
- Tan, Z.; Xue, H.; Sun, Y.; Zhang, C.; Song, Y.; Qi, Y. The Role of Tumor Inflammatory Microenvironment in Lung Cancer. Front. Pharmacol. 2021, 12, 1168. [Google Scholar] [CrossRef] [PubMed]
- Zhang, Y.; Chen, B.; Wang, L.; Wang, R.; Yang, X. Systemic immune-inflammation index is a promising noninvasive marker to predict survival of lung cancer. Medicine 2019, 98, e13788. [Google Scholar] [CrossRef]
- Seban, R.-D.; Mezquita, L.; Berenbaum, A.; Dercle, L.; Botticella, A.; Le Pechoux, C.; Caramella, C.; Deutsch, E.; Grimaldi, S.; Adam, J.; et al. Baseline metabolic tumor burden on FDG PET/CT scans predicts outcome in advanced NSCLC patients treated with immune checkpoint inhibitors. Eur. J. Nucl. Med. Mol. Imaging 2020, 47, 1147–1157. [Google Scholar] [CrossRef] [PubMed]
- Castello, A.; Rossi, S.; Mazziotti, E.; Toschi, L.; Lopci, E. Hyperprogressive Disease in Patients with Non–Small Cell Lung Cancer Treated with Checkpoint Inhibitors: The Role of 18 F-FDG PET/CT. J. Nucl. Med. 2020, 61, 821–826. [Google Scholar] [CrossRef]
- Seban, R.-D.; Assié, J.-B.; Giroux-Leprieur, E.; Massiani, M.-A.; Soussan, M.; Bonardel, G.; Chouaid, C.; Playe, M.; Goldfarb, L.; Duchemann, B.; et al. Association of the Metabolic Score Using Baseline FDG-PET/CT and dNLR with Immunotherapy Outcomes in Advanced NSCLC Patients Treated with First-Line Pembrolizumab. Cancers 2020, 12, 2234. [Google Scholar] [CrossRef] [PubMed]
- Fu, Y. Facilitative glucose transporter gene expression in human lymphocytes, monocytes, and macrophages: A role for GLUT isoforms 1, 3, and 5 in the immune response and foam cell formation. Blood Cells Mol. Dis. 2004, 32, 182–190. [Google Scholar] [CrossRef] [PubMed]
- Giraudo, C.; Evangelista, L.; Fraia, A.S.; Lupi, A.; Quaia, E.; Cecchin, D.; Casali, M. Molecular Imaging of Pulmonary Inflammation and Infection. Int. J. Mol. Sci. 2020, 21, 894. [Google Scholar] [CrossRef] [PubMed] [Green Version]
- Iravani, A.; Hicks, R.J. Imaging the Cancer Immune Environment and Its Response to Pharmacologic Intervention, Part 1: The Role of 18 F-FDG PET/CT. J. Nucl. Med. 2020, 61, 943–950. [Google Scholar] [CrossRef] [PubMed]
- Schwenck, J.; Schörg, B.; Fiz, F.; Sonanini, D.; Forschner, A.; Eigentler, T.; Weide, B.; Martella, M.; Gonzalez-Menendez, I.; Campi, C.; et al. Cancer immunotherapy is accompanied by distinct metabolic patterns in primary and secondary lymphoid organs observed by non-invasive in vivo 18 F-FDG-PET. Theranostics 2020, 10, 925–937. [Google Scholar] [CrossRef]
- Seban, R.-D.; Moya-Plana, A.; Antonios, L.; Yeh, R.; Marabelle, A.; Deutsch, E.; Schwartz, L.H.; Gómez, R.G.H.; Saenger, Y.; Robert, C.; et al. Prognostic 18F-FDG PET biomarkers in metastatic mucosal and cutaneous melanoma treated with immune checkpoint inhibitors targeting PD-1 and CTLA-4. Eur. J. Nucl. Med. Mol. Imaging 2020, 47, 2301–2312. [Google Scholar] [CrossRef]
- Wong, A.; Callahan, J.; Keyaerts, M.; Neyns, B.; Mangana, J.; Aberle, S.; Herschtal, A.; Fullerton, S.; Milne, D.; Iravani, A.; et al. 18F-FDG PET/CT based spleen to liver ratio associates with clinical outcome to ipilimumab in patients with metastatic melanoma. Cancer Imaging 2020, 20, 36. [Google Scholar] [CrossRef]
- Seban, R.-D.; Robert, C.; Dercle, L.; Yeh, R.; Dunant, A.; Reuze, S.; Schernberg, A.; Sun, R.; Mignot, F.; Terroir, M.; et al. Increased bone marrow SUVmax on 18F-FDG PET is associated with higher pelvic treatment failure in patients with cervical cancer treated by chemoradiotherapy and brachytherapy. Oncoimmunology 2019, 8, e1574197. [Google Scholar] [CrossRef] [Green Version]
- Shimura, K.; Mabuchi, S.; Komura, N.; Yokoi, E.; Kozasa, K.; Sasano, T.; Kawano, M.; Matsumoto, Y.; Watabe, T.; Kodama, M.; et al. Prognostic significance of bone marrow FDG uptake in patients with gynecological cancer. Sci. Rep. 2021, 11, 2257. [Google Scholar] [CrossRef]
- Kim, S.Y.; Moon, C.M.; Yoon, H.-J.; Kim, B.S.; Lim, J.Y.; Kim, T.O.; Choe, A.R.; Tae, C.H.; Kim, S.-E.; Jung, H.-K.; et al. Diffuse splenic FDG uptake is predictive of clinical outcomes in patients with rectal cancer. Sci. Rep. 2019, 9, 1313. [Google Scholar] [CrossRef] [PubMed] [Green Version]
- Seban, R.-D.; Rouzier, R.; Latouche, A.; Deleval, N.; Guinebretiere, J.-M.; Buvat, I.; Bidard, F.-C.; Champion, L. Total metabolic tumor volume and spleen metabolism on baseline [18F]-FDG PET/CT as independent prognostic biomarkers of recurrence in resected breast cancer. Eur. J. Nucl. Med. Mol. Imaging 2021, 48, 3560–3570. [Google Scholar] [CrossRef]
- Lee, J.W.; Na, J.O.; Kang, D.-Y.; Lee, S.Y.; Lee, S.M. Prognostic Significance of FDG Uptake of Bone Marrow on PET/CT in Patients with Non–Small-Cell Lung Cancer After Curative Surgical Resection. Clin. Lung Cancer 2017, 18, 198–206. [Google Scholar] [CrossRef] [PubMed]
- Lee, J.W.; Seo, K.H.; Kim, E.-S.; Lee, S.M. The role of 18F-fluorodeoxyglucose uptake of bone marrow on PET/CT in predicting clinical outcomes in non-small cell lung cancer patients treated with chemoradiotherapy. Eur. Radiol. 2017, 27, 1912–1921. [Google Scholar] [CrossRef] [PubMed]
- Prévost, S.; Boucher, L.; Larivée, P.; Boileau, R.; Bénard, F. Bone marrow hypermetabolism on 18F-FDG PET as a survival prognostic factor in non-small cell lung cancer. J. Nucl. Med. 2006, 47, 559–565. [Google Scholar]
- Seban, R.-D.; Assié, J.-B.; Giroux-Leprieur, E.; Massiani, M.-A.; Bonardel, G.; Chouaid, C.; Deleval, N.; Richard, C.; Mezquita, L.; Girard, N.; et al. Prognostic value of inflammatory response biomarkers using peripheral blood and [18F]-FDG PET/CT in advanced NSCLC patients treated with first-line chemo- or immunotherapy. Lung Cancer 2021, 159, 45–55. [Google Scholar] [CrossRef]
- Socinski, M.A.; Jotte, R.M.; Cappuzzo, F.; Orlandi, F.; Stroyakovskiy, D.; Nogami, N.; Rodríguez-Abreu, D.; Moro-Sibilot, D.; Thomas, C.A.; Barlesi, F.; et al. Atezolizumab for First-Line Treatment of Metastatic Nonsquamous NSCLC. N. Engl. J. Med. 2018, 378, 2288–2301. [Google Scholar] [CrossRef]
- Reck, M.; Rodríguez-Abreu, D.; Robinson, A.G.; Hui, R.; Csőszi, T.; Fülöp, A.; Gottfried, M.; Peled, N.; Tafreshi, A.; Cuffe, S.; et al. Pembrolizumab versus Chemotherapy for PD-L1–Positive Non–Small-Cell Lung Cancer. N. Engl. J. Med. 2016, 375, 1823–1833. [Google Scholar] [CrossRef] [Green Version]
- Benchimol, E.I.; Smeeth, L.; Guttmann, A.; Harron, K.; Moher, D.; Petersen, I.; Sørensen, H.T.; von Elm, E.; Langan, S.M. The REporting of studies Conducted using Observational Routinely-collected health Data (RECORD) Statement. PLoS Med. 2015, 12, e1001885. [Google Scholar] [CrossRef]
- Im, H.-J.; Bradshaw, T.; Solaiyappan, M.; Cho, S.Y. Current Methods to Define Metabolic Tumor Volume in Positron Emission Tomography: Which One is Better? Nucl. Med. Mol. Imaging 2018, 52, 5–15. [Google Scholar] [CrossRef] [PubMed]
- Chen, H.H.W.; Chiu, N.-T.; Su, W.-C.; Guo, H.-R.; Lee, B.-F. Prognostic Value of Whole-Body Total Lesion Glycolysis at Pretreatment FDG PET/CT in Non–Small Cell Lung Cancer. Radiology 2012, 264, 559–566. [Google Scholar] [CrossRef]
- Eisenhauer, E.A.; Therasse, P.; Bogaerts, J.; Schwartz, L.H.; Sargent, D.; Ford, R.; Dancey, J.; Arbuck, S.; Gwyther, S.; Mooney, M.; et al. New response evaluation criteria in solid tumours: Revised RECIST guideline (version 1.1). Eur. J. Cancer 2009, 45, 228–247. [Google Scholar] [CrossRef] [PubMed]
- Su, X.-D.; Xie, H.-J.; Liu, Q.-W.; Mo, Y.-X.; Long, H.; Rong, T.-H. The prognostic impact of tumor volume on stage I non-small cell lung cancer. Lung Cancer 2017, 104, 91–97. [Google Scholar] [CrossRef]
- van Laar, M.; van Amsterdam, W.A.C.; van Lindert, A.S.R.; de Jong, P.A.; Verhoeff, J.J.C. Prognostic factors for overall survival of stage III non-small cell lung cancer patients on computed tomography: A systematic review and meta-analysis. Radiother. Oncol. 2020, 151, 152–175. [Google Scholar] [CrossRef]
- Skoulidis, F.; Li, B.T.; Dy, G.K.; Price, T.J.; Falchook, G.S.; Wolf, J.; Italiano, A.; Schuler, M.; Borghaei, H.; Barlesi, F.; et al. Sotorasib for Lung Cancers with KRAS p.G12C Mutation. N. Engl. J. Med. 2021, 384, 2371–2381. [Google Scholar] [CrossRef]
- Patil, N.; Cho, B.C.; Johnson, M.; Caro, R.B.; Spira, A.; Chiu, C.; Molden, N.; Pham, T.; Yang, X.; Choi, Y.; et al. P77.02 Efficacy of Tiragolumab + Atezolizumab in PD-L1 IHC and TIGIT Subgroups in the Phase II CITYSCAPE Study in First-Line NSCLC. J. Thorac. Oncol. 2021, 16, S635–S636. [Google Scholar] [CrossRef]
- Paz-Ares, L.G.; Garon, E.B.; Ardizzoni, A.; Barlesi, F.; Cho, B.C.; Castro, G.; De Marchi, P.; Felip, E.; Goto, Y.; Greystoke, A.; et al. The CANOPY program: Canakinumab in patients (pts) with non-small cell lung cancer (NSCLC). J. Clin. Oncol. 2019, 37, TPS9124. [Google Scholar] [CrossRef]
- Decazes, P.; Bohn, P. Immunotherapy by Immune Checkpoint Inhibitors and Nuclear Medicine Imaging: Current and Future Applications. Cancers 2020, 12, 371. [Google Scholar] [CrossRef] [Green Version]
- Bensch, F.; van der Veen, E.L.; Lub-de Hooge, M.N.; Jorritsma-Smit, A.; Boellaard, R.; Kok, I.C.; Oosting, S.F.; Schröder, C.P.; Hiltermann, T.J.N.; van der Wekken, A.J.; et al. 89Zr-atezolizumab imaging as a non-invasive approach to assess clinical response to PD-L1 blockade in cancer. Nat. Med. 2018, 24, 1852–1858. [Google Scholar] [CrossRef] [PubMed]
- Seifert, R.; Kessel, K.; Schlack, K.; Weber, M.; Herrmann, K.; Spanke, M.; Fendler, W.P.; Hadaschik, B.; Kleesiek, J.; Schäfers, M.; et al. PSMA PET total tumor volume predicts outcome of patients with advanced prostate cancer receiving [177Lu]Lu-PSMA-617 radioligand therapy in a bicentric analysis. Eur. J. Nucl. Med. Mol. Imaging 2021, 48, 1200–1210. [Google Scholar] [CrossRef] [PubMed]
- Kumar, D.; Lisok, A.; Dahmane, E.; McCoy, M.; Shelake, S.; Chatterjee, S.; Allaj, V.; Sysa-Shah, P.; Wharram, B.; Lesniak, W.G.; et al. Peptide-based PET quantifies target engagement of PD-L1 therapeutics. J. Clin. Investig. 2019, 129, 616–630. [Google Scholar] [CrossRef] [Green Version]
- Ballal, S.; Yadav, M.P.; Kramer, V.; Moon, E.S.; Roesch, F.; Tripathi, M.; Mallick, S.; ArunRaj, S.T.; Bal, C. A theranostic approach of [68Ga]Ga-DOTA.SA.FAPi PET/CT-guided [177Lu]Lu-DOTA.SA.FAPi radionuclide therapy in an end-stage breast cancer patient: New frontier in targeted radionuclide therapy. Eur. J. Nucl. Med. Mol. Imaging 2021, 48, 942–944. [Google Scholar] [CrossRef]
- Froelich, J.W.; Salavati, A. Artificial Intelligence in PET/CT Is about to Make Whole-Body Tumor Burden Measurements a Clinical Reality. Radiology 2020, 294, 453–454. [Google Scholar] [CrossRef] [PubMed]
- Yang, F.; Simpson, G.; Young, L.; Ford, J.; Dogan, N.; Wang, L. Impact of contouring variability on oncological PET radiomics features in the lung. Sci. Rep. 2020, 10, 369. [Google Scholar] [CrossRef] [PubMed]
- Dissaux, G.; Visvikis, D.; Da-ano, R.; Pradier, O.; Chajon, E.; Barillot, I.; Duvergé, L.; Masson, I.; Abgral, R.; Santiago Ribeiro, M.-J.; et al. Pretreatment 18 F-FDG PET/CT Radiomics Predict Local Recurrence in Patients Treated with Stereotactic Body Radiotherapy for Early-Stage Non–Small Cell Lung Cancer: A Multicentric Study. J. Nucl. Med. 2020, 61, 814–820. [Google Scholar] [CrossRef] [PubMed]
- Seymour, L.; Bogaerts, J.; Perrone, A.; Ford, R.; Schwartz, L.H.; Mandrekar, S.; Lin, N.U.; Litière, S.; Dancey, J.; Chen, A.; et al. iRECIST: Guidelines for response criteria for use in trials testing immunotherapeutics. Lancet Oncol. 2017, 18, e143–e152. [Google Scholar] [CrossRef] [Green Version]


| Patient Characteristics | |
|---|---|
| Median age (range; years) | 64 (38–81) |
| Male sex (n, %) | 56 (66) |
| ECOG (n, %) | |
| 0 | 42 (49) |
| 1 | 27 (32) |
| 2+ | 16 (19) |
| Presence of brain metastases (n, %) | 32 (37.6) |
| Smoking history ≥ 5 pack years (n, %) | 79 (89.4) |
| Pack years (mean, SD) | 44.5 (24.3) |
| Therapy Characteristics | |
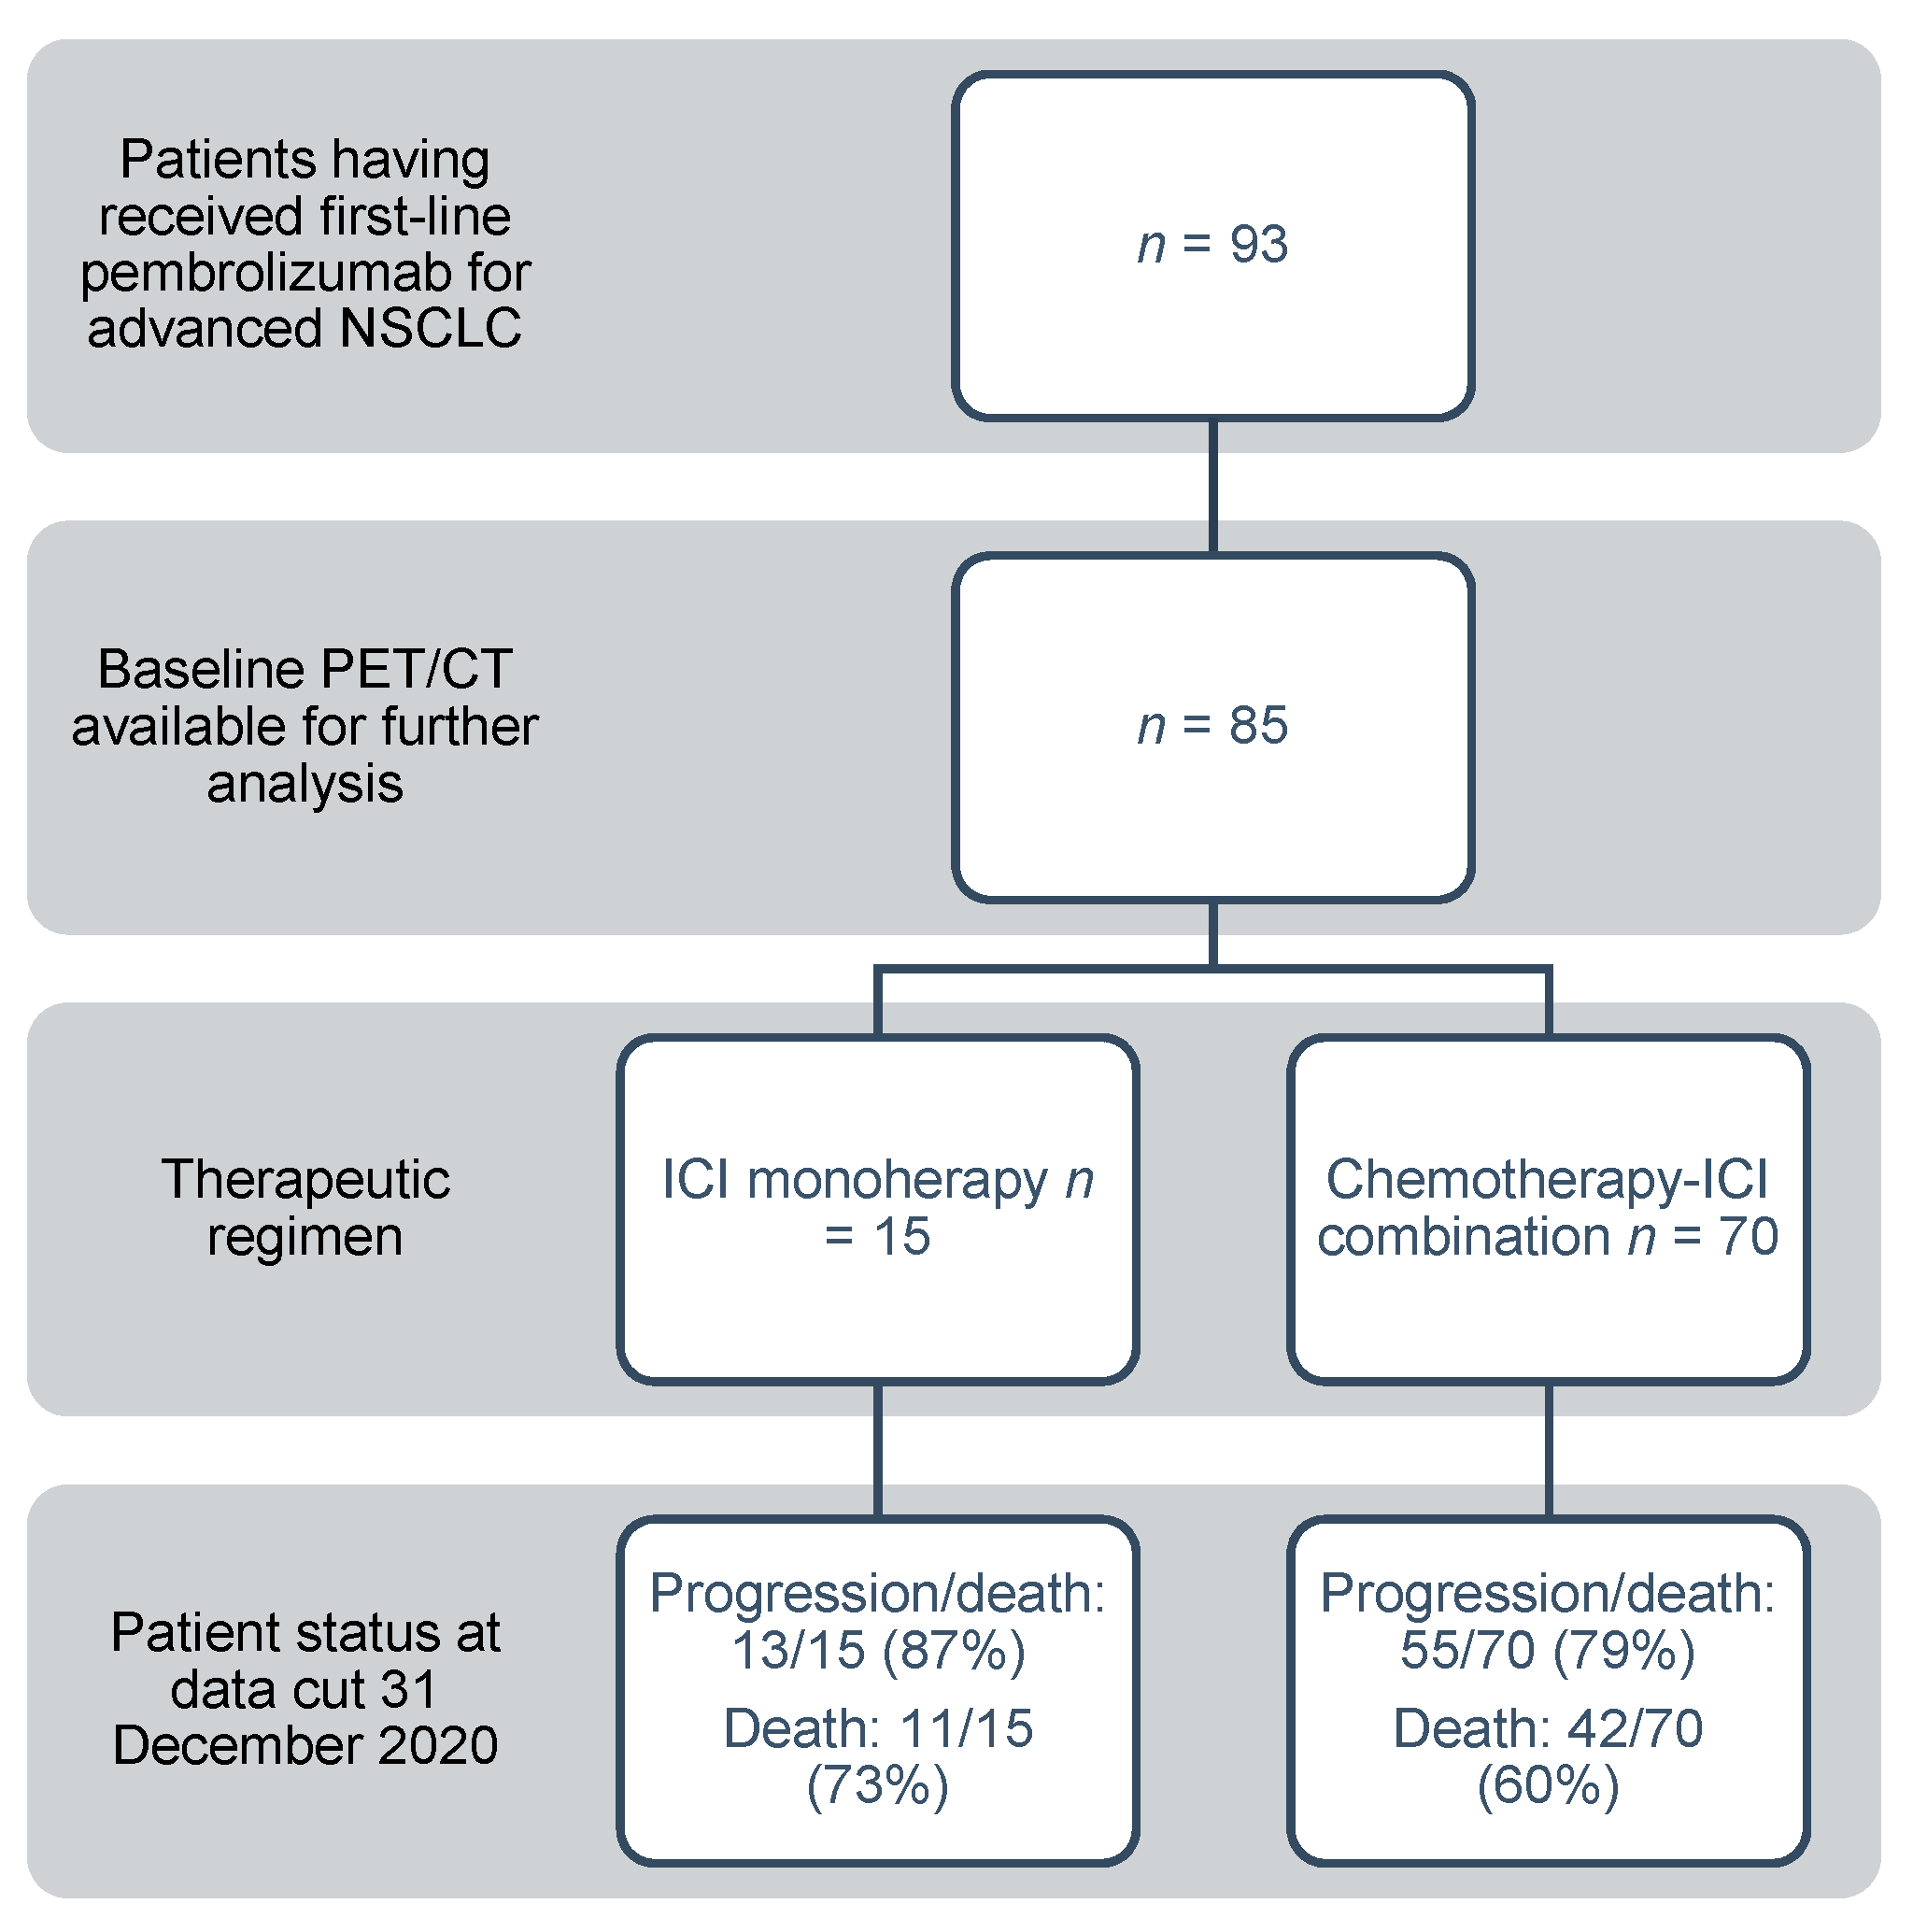
| ICI monotherapy (n, %) | 15 (17.6) |
| Median number of mono-ICI cycles (IQR) | 3 (2.5) |
| Chemotherapy-ICI combination (n, %) | 70 (82.4) |
| Median number of chemotherapy-ICI cycles (IQR) | 4 (2) |
| Median number of mono-ICI maintenance cycles (IQR) | 2.5 (8) |
| Tumor Characteristics | |
| Histological subtype (n, %) | |
| Adenocarcinoma | 62 (73) |
| Squamous-cell carcinoma | 22 (27) |
| NSCLC not otherwise specified | 1 (1) |
| Positive PD-L1 status (n, %) | 49 (58) |
| PD-L1 expression (n, %) | |
| Not available | 5 (6) |
| <1% | 31 (36) |
| 1–49% | 20 (24) |
| ≥50% | 29 (34) |
| Blood Biomarkers (mean, SD) | |
| C-reactive protein (mg/dL) | 3.2 (5.3) |
| Lactate dehydrogenase (U/L) | 331.2 (612) |
| Lymphocyte count (G/L) | 1.3 (0.78) |
| PET/CT Biomarkers (mean, SD) | |
| SUVmax | 16 (6.7) |
| SUVmean | 7 (1.8) |
| Total metabolic tumor volume (mL) | 121.6 (145.9) |
| Total lesion glycolysis | 888.6 (1184.3) |
| Bone marrow to liver ratio | 1.04 (0.27) |
| Spleen to liver ratio | 0.81 (0.12) |
| Progression-Free Survival | Overall Survival | |||||
|---|---|---|---|---|---|---|
| Median | 95% CI | p | Median | 95% CI | p | |
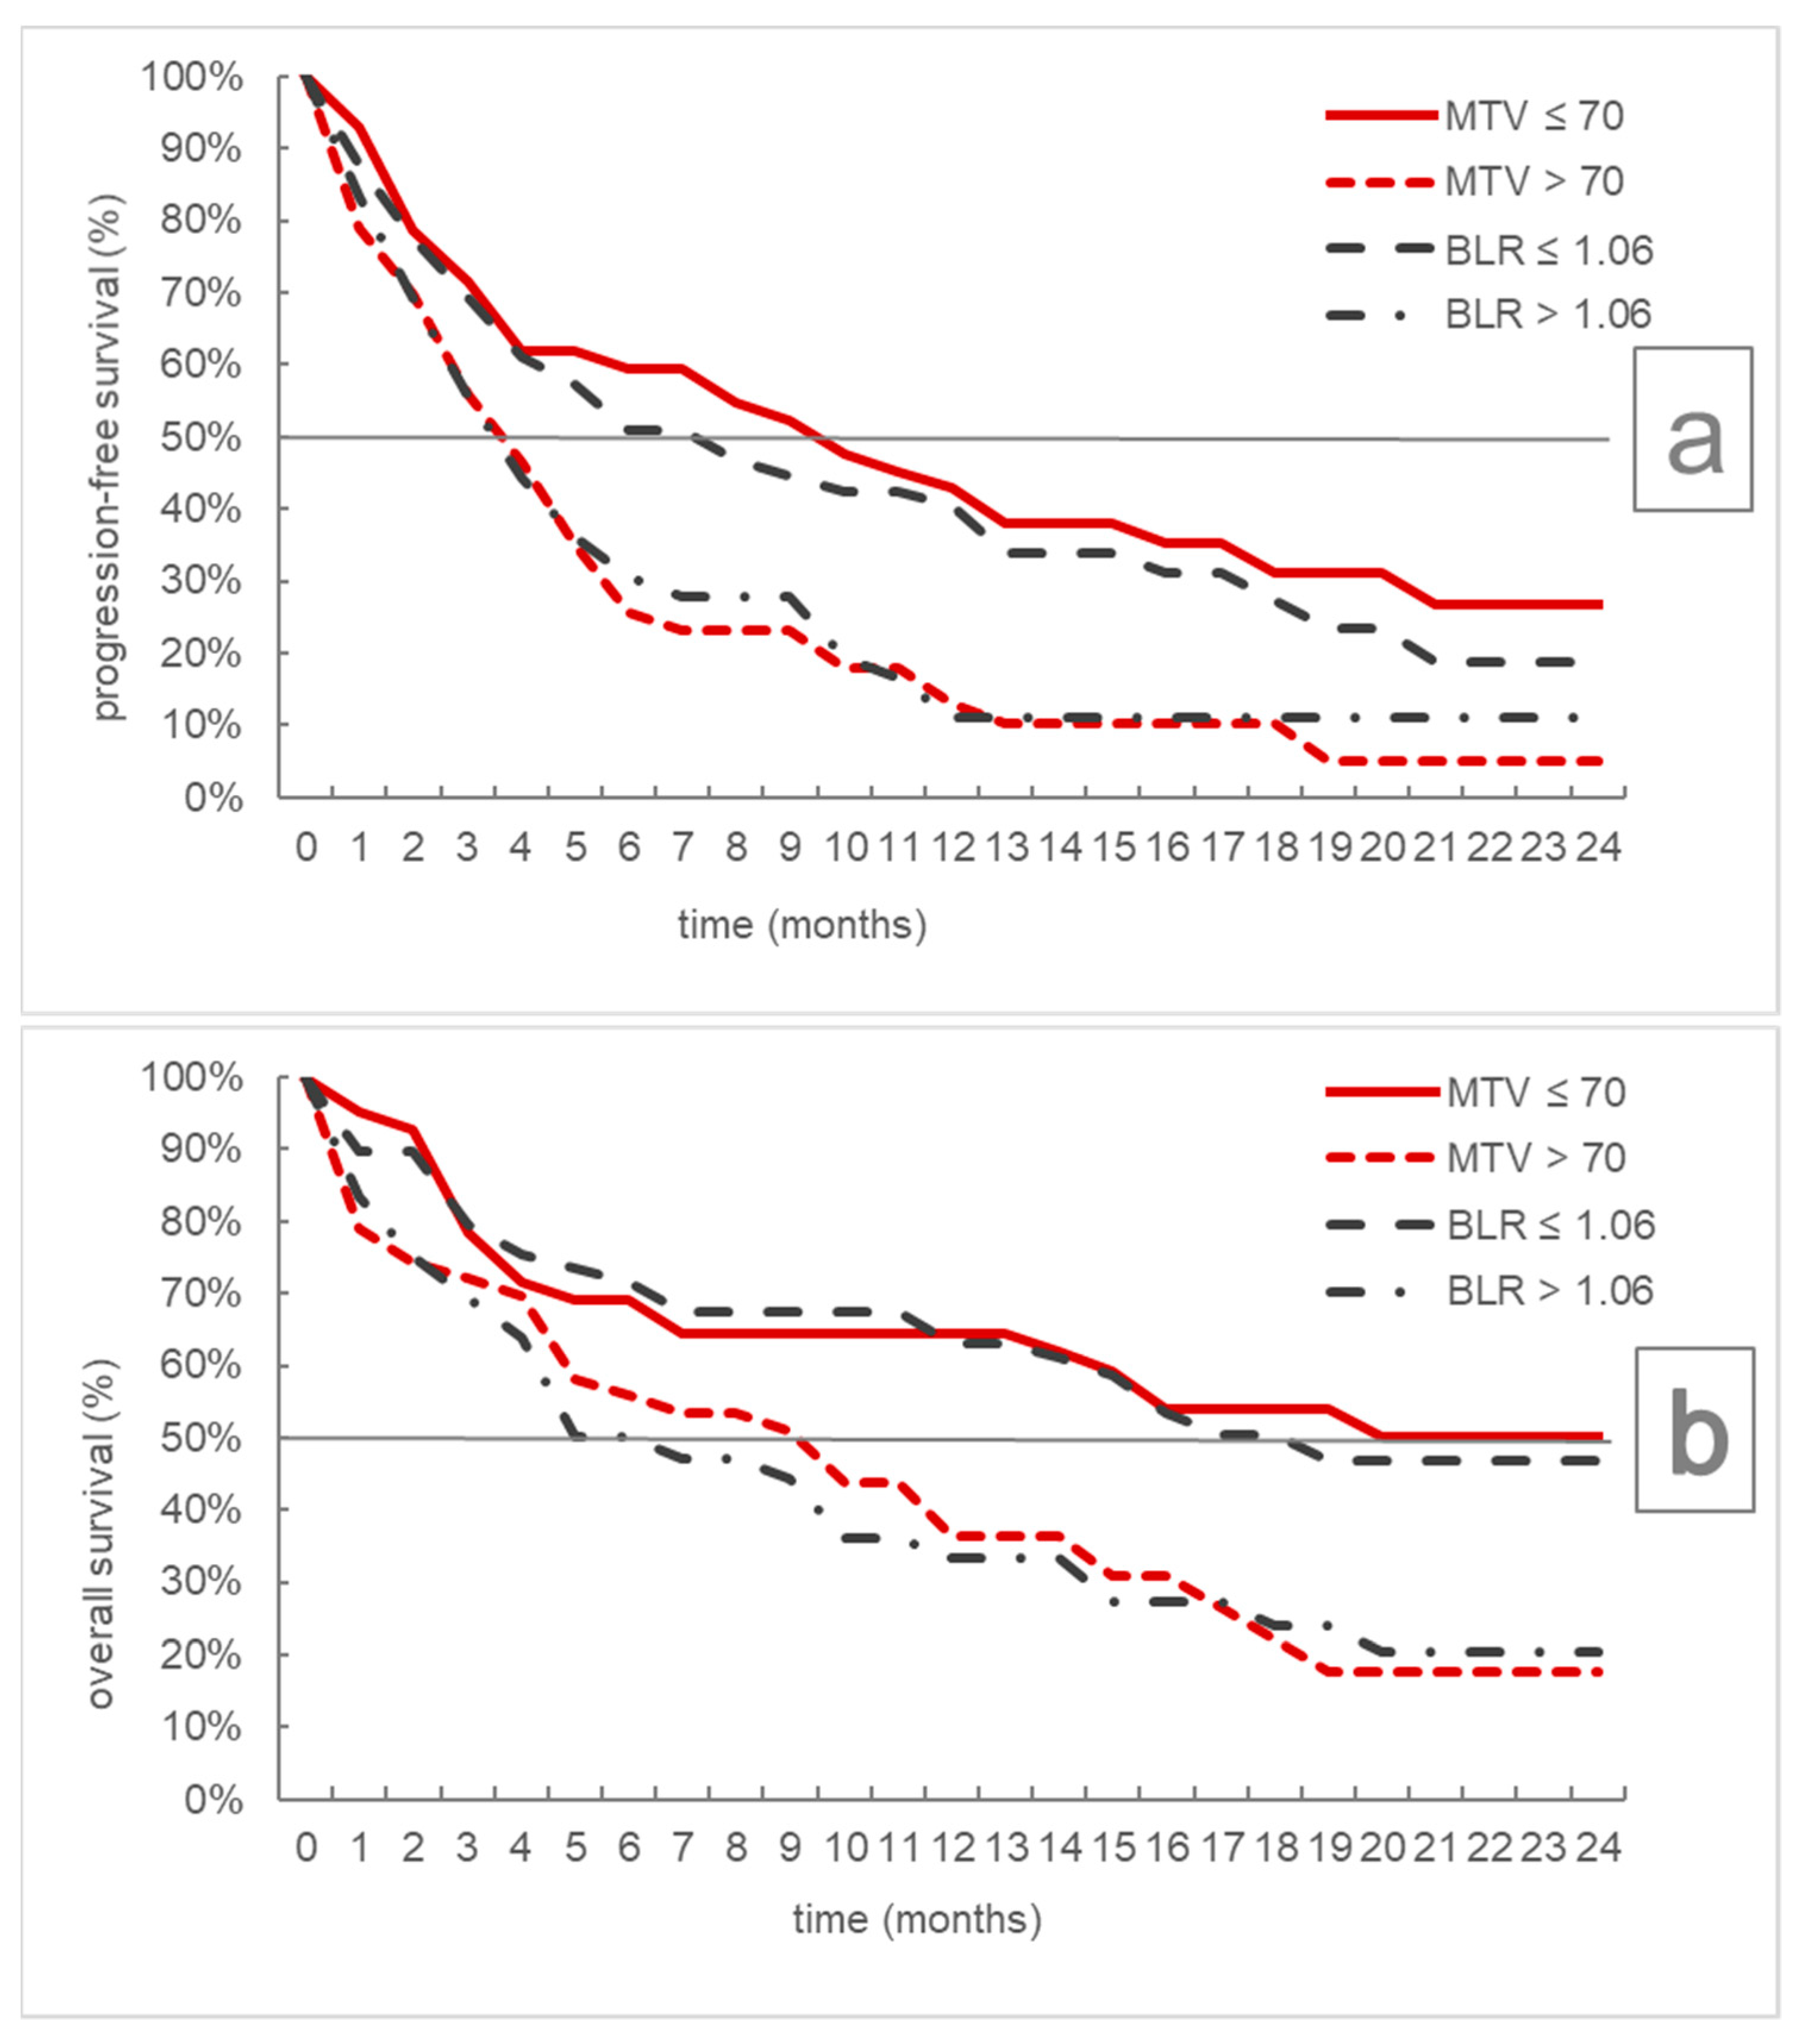
| MTV ≤ 70 mL | 10 | 4–16 | 0.001 | Not reached | 7-/ | 0.004 |
| MTV > 70 mL | 4 | 3–5 | 10 | 5–15 | ||
| BLR ≤ 1.06 | 8 | 4–13 | 0.034 | 19 | 12-/ | 0.005 |
| BLR > 1.06 | 4 | 3–6 | 6 | 4–12 | ||
| RECIST Best Response | Disease Control Rate | |||||||
|---|---|---|---|---|---|---|---|---|
| Cut-Off | n | CR, PR | SD | PD | p | CR, PR, SD | p | |
| MTV | ≤70 mL | 42 | 22 (52) | 12 (29) | 8 (19) | 0.026 | 34 (81) | 0.007 |
| >70 mL | 43 | 14 (33) | 9 (21) | 20 (46) | 23 (53) | |||
| BLR | ≤1.06 | 49 | 23 (47) | 12 (24) | 14 (29) | 0.536 | 35 (71) | 0.317 |
| >1.06 | 36 | 13 (36) | 9 (25) | 14 (39) | 22 (61) | |||
| Univariate | Multivariate | Univariate | Multivariate | |||||
|---|---|---|---|---|---|---|---|---|
| HR (95% CI) | p | HR (95% CI) | p | HR (95% CI) | p | HR (95% CI) | p | |
| Progression-Free Survival | Overall Survival | |||||||
| ICI-monotherapy vs. chemotherapy-ICI combination | 1.33 (0.70–0.52) | 0.378 | 1.50 (0.74–3.04) | 0.258 | 4.01 (1.63–9.87) | 0.003 | ||
| Sex (male vs. female) | 1.13 (0.66–1.95) | 0.654 | 1.01 (0.55–1.84) | 0.985 | ||||
| Age (>70 vs. ≤70 years) | 1.18 (0.67–2.07) | 0.567 | 1.16 (0.60–2.23) | 0.666 | ||||
| ECOG (2+ vs. 0,1) | 1.64 (0.88–3.03) | 0.117 | 2.20 (1.11–4.38) | 0.025 | ||||
| Histology (squamous cell vs. adenocarcinoma) | 1.25 (0.69–2.24) | 0.464 | 1.53 (0.80–2.93) | 0.199 | ||||
| >5 packyears (yes vs. no) | 0.55 (0.24–1.30) | 0.174 | 0.62 (0.25–1.57) | 0.315 | ||||
| LDH (>250 vs. ≤250 U/L) | 1.80 (1.05–3.07) | 0.032 | 2.22 (1.23–4.00) | 0.008 | 4.34 (2.02–9.33) | <0.001 | ||
| CRP (>0.5 vs. ≤0.5 mg/dL) | 1.27 (0.64–2.51) | 0.492 | 1.52 (0.68–3.40) | 0.306 | ||||
| PD-L1 (pos. vs. neg) | 1.22 (0.73–2.05) | 0.457 | 1.29 (0.72–2.31) | 0.384 | 3.55 (1.54–8.14) | 0.026 | ||
| Lymphocyte count (>1 vs. ≤1 G/L) | 1.16 (0.68–1.98) | 0.578 | 1.03 (0.57–1.87) | 0.914 | ||||
| Presence of brain metastases (yes vs. no) | 1.70 (1.02–2.84) | 0.043 | 1.45 (0.85–2.59) | 0.170 | ||||
| MTV (>70 vs. ≤70 mL) | 1.90 (1.12–3.23) | 0.017 | 1.90 (1.12–3.23) | 0.015 | 1.88 (1.03–3.42) | 0.040 | ||
| BLR (>1.06 vs. ≤1.06) | 1.63 (0.98–2.72) | 0.061 | 2.10 (1.18–3.74) | 0.012 | 2.09 (1.16–3.75) | 0.014 | ||
| Progression-Free Survival | Overall Survival | ||||||
|---|---|---|---|---|---|---|---|
| n | Median | 95% CI | p | Median | 95% CI | p | |
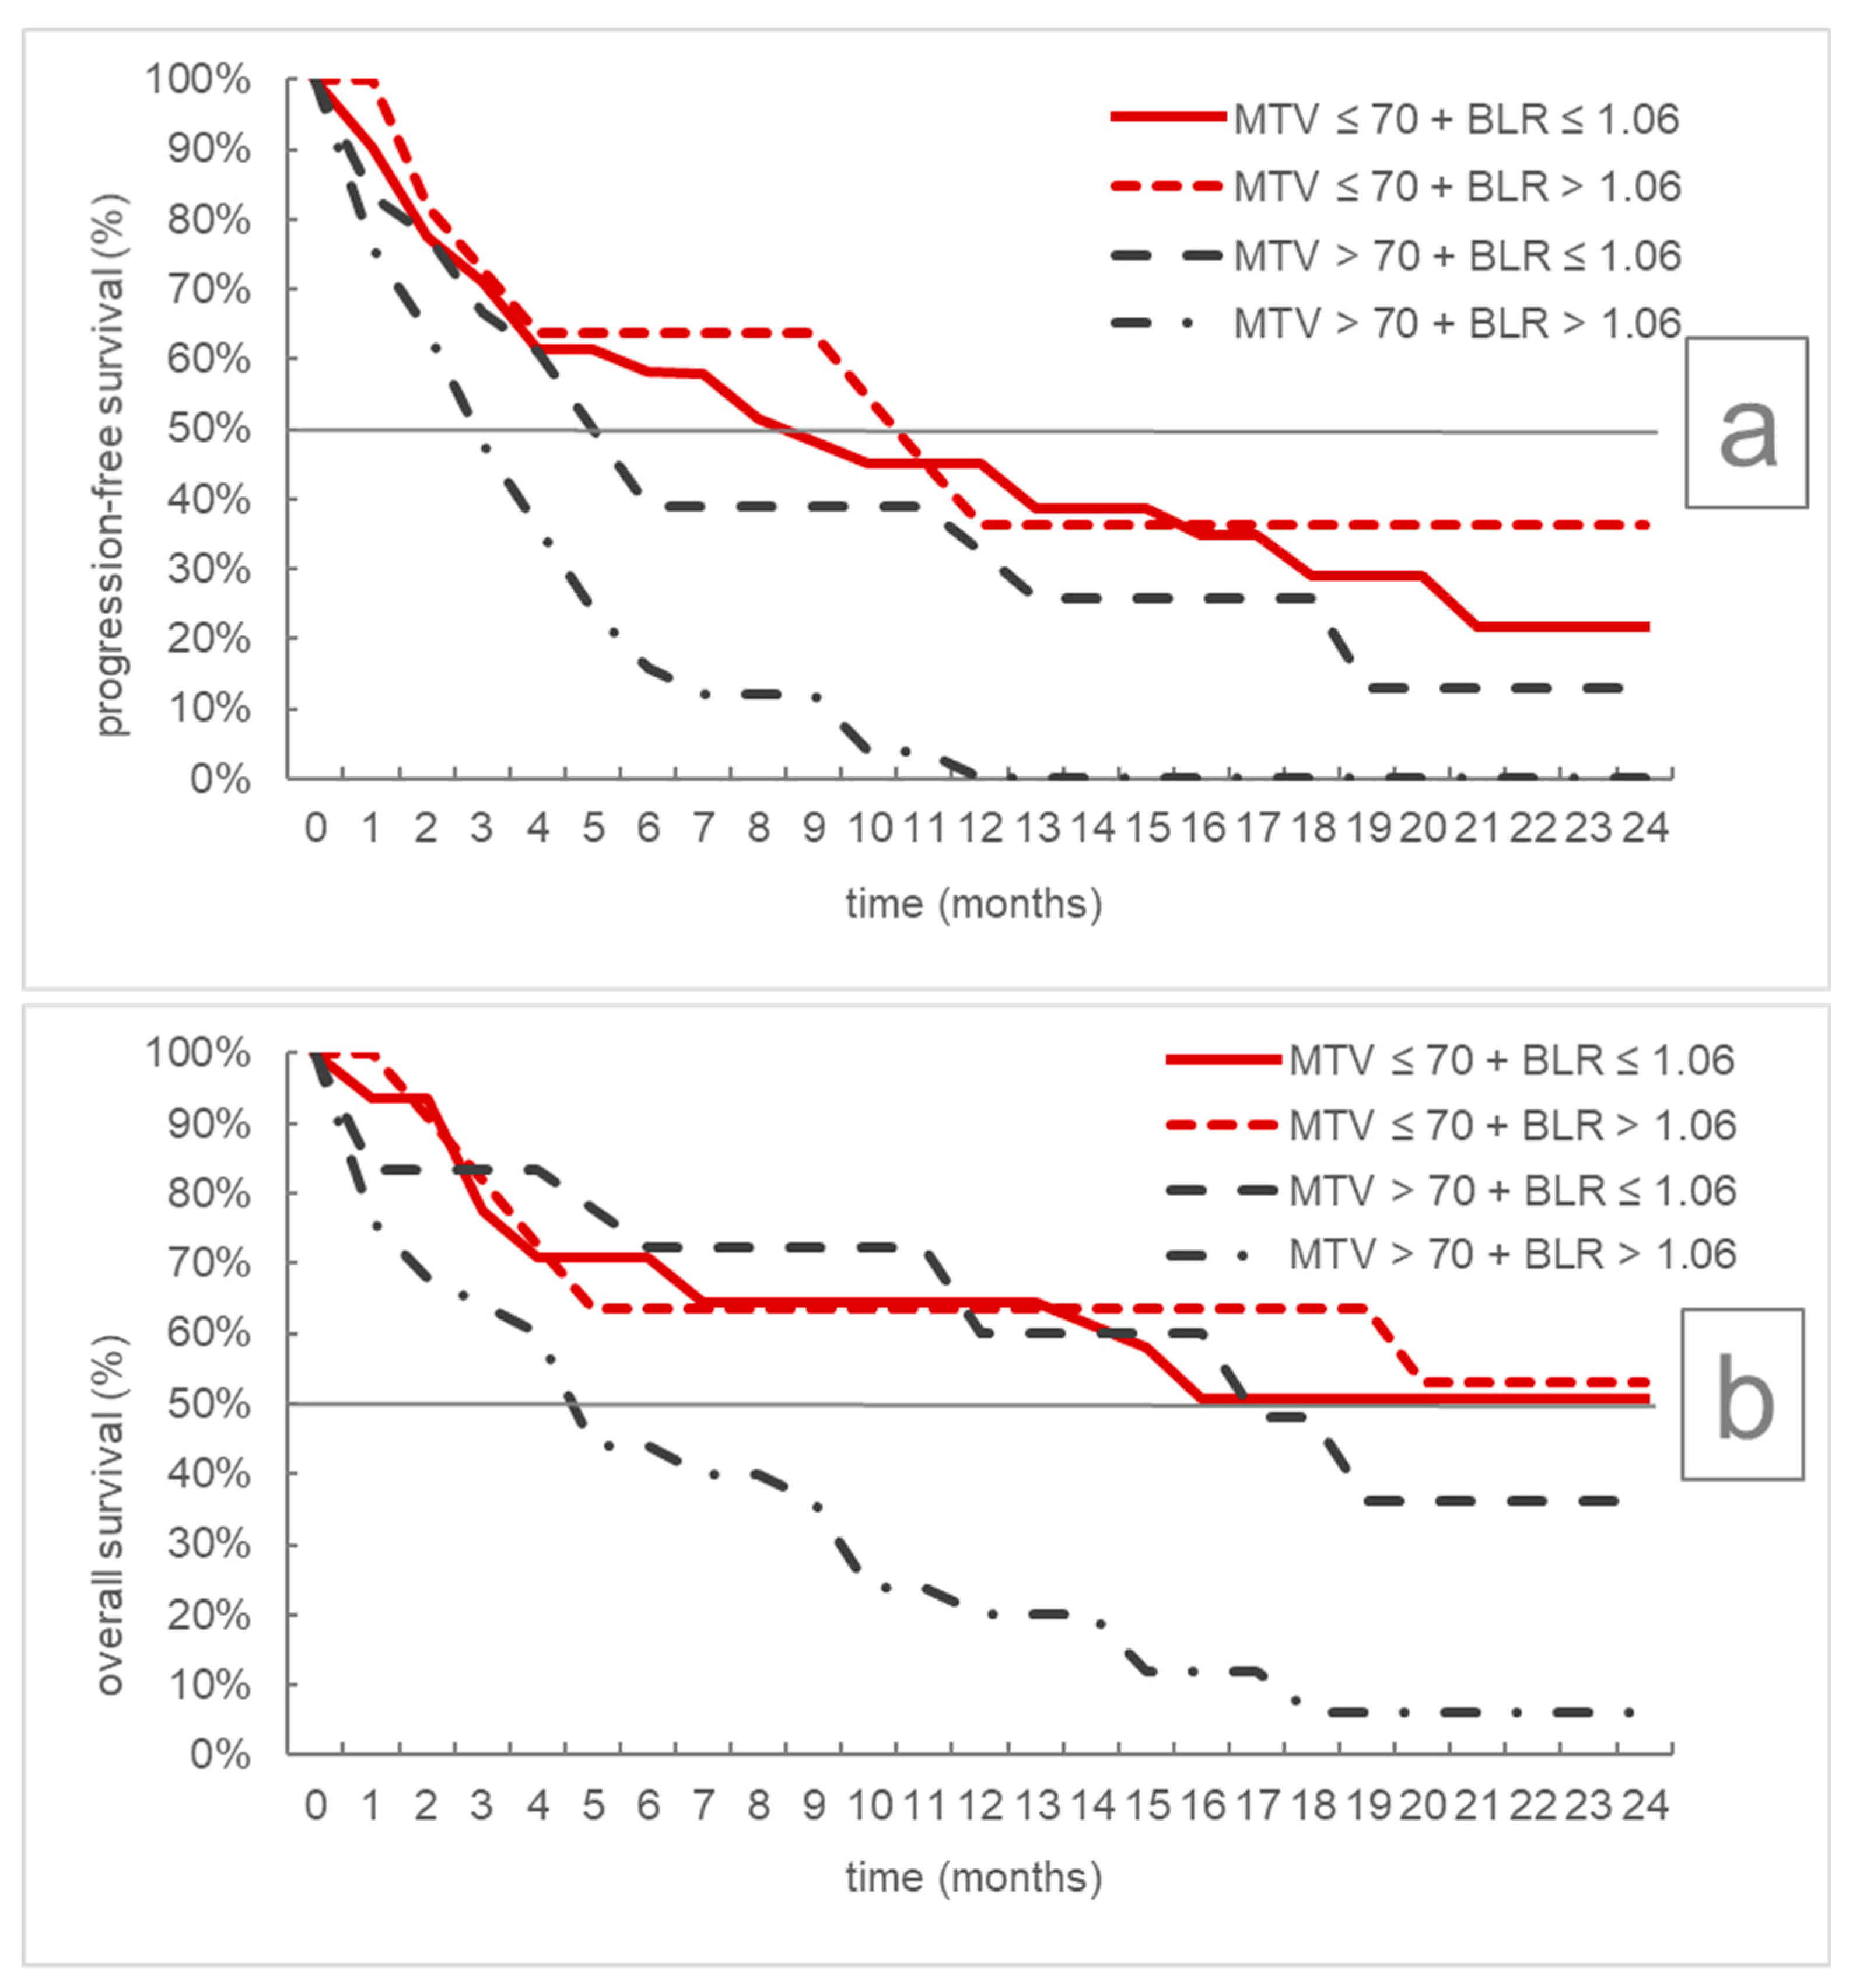
| MTV ≤ 70 mL + BLR ≤ 1.06 | 31 | 9 | 4–18 | <0.001 | Not reached | 7-/ | <0.001 |
| MTV ≤ 70 mL + BLR > 1.06 | 11 | 11 | 2-/- | Not reached | 3-/ | ||
| MTV > 70 mL + BLR ≤ 1.06 | 18 | 5.5 | 3–13 | 17 | 6-/ | ||
| MTV > 70 mL + BLR > 1.06 | 25 | 3 | 2–5 | 5 | 2–10 | ||
Publisher’s Note: MDPI stays neutral with regard to jurisdictional claims in published maps and institutional affiliations. |
© 2021 by the authors. Licensee MDPI, Basel, Switzerland. This article is an open access article distributed under the terms and conditions of the Creative Commons Attribution (CC BY) license (https://creativecommons.org/licenses/by/4.0/).
Share and Cite
Lang, D.; Ritzberger, L.; Rambousek, V.; Horner, A.; Wass, R.; Akbari, K.; Kaiser, B.; Kronbichler, J.; Lamprecht, B.; Gabriel, M. First-Line Pembrolizumab Mono- or Combination Therapy of Non-Small Cell Lung Cancer: Baseline Metabolic Biomarkers Predict Outcomes. Cancers 2021, 13, 6096. https://doi.org/10.3390/cancers13236096
Lang D, Ritzberger L, Rambousek V, Horner A, Wass R, Akbari K, Kaiser B, Kronbichler J, Lamprecht B, Gabriel M. First-Line Pembrolizumab Mono- or Combination Therapy of Non-Small Cell Lung Cancer: Baseline Metabolic Biomarkers Predict Outcomes. Cancers. 2021; 13(23):6096. https://doi.org/10.3390/cancers13236096
Chicago/Turabian StyleLang, David, Linda Ritzberger, Vanessa Rambousek, Andreas Horner, Romana Wass, Kaveh Akbari, Bernhard Kaiser, Jürgen Kronbichler, Bernd Lamprecht, and Michael Gabriel. 2021. "First-Line Pembrolizumab Mono- or Combination Therapy of Non-Small Cell Lung Cancer: Baseline Metabolic Biomarkers Predict Outcomes" Cancers 13, no. 23: 6096. https://doi.org/10.3390/cancers13236096