
Automated PD-L1 Scoring Using Artificial Intelligence in Head and Neck Squamous Cell Carcinoma

 , , and
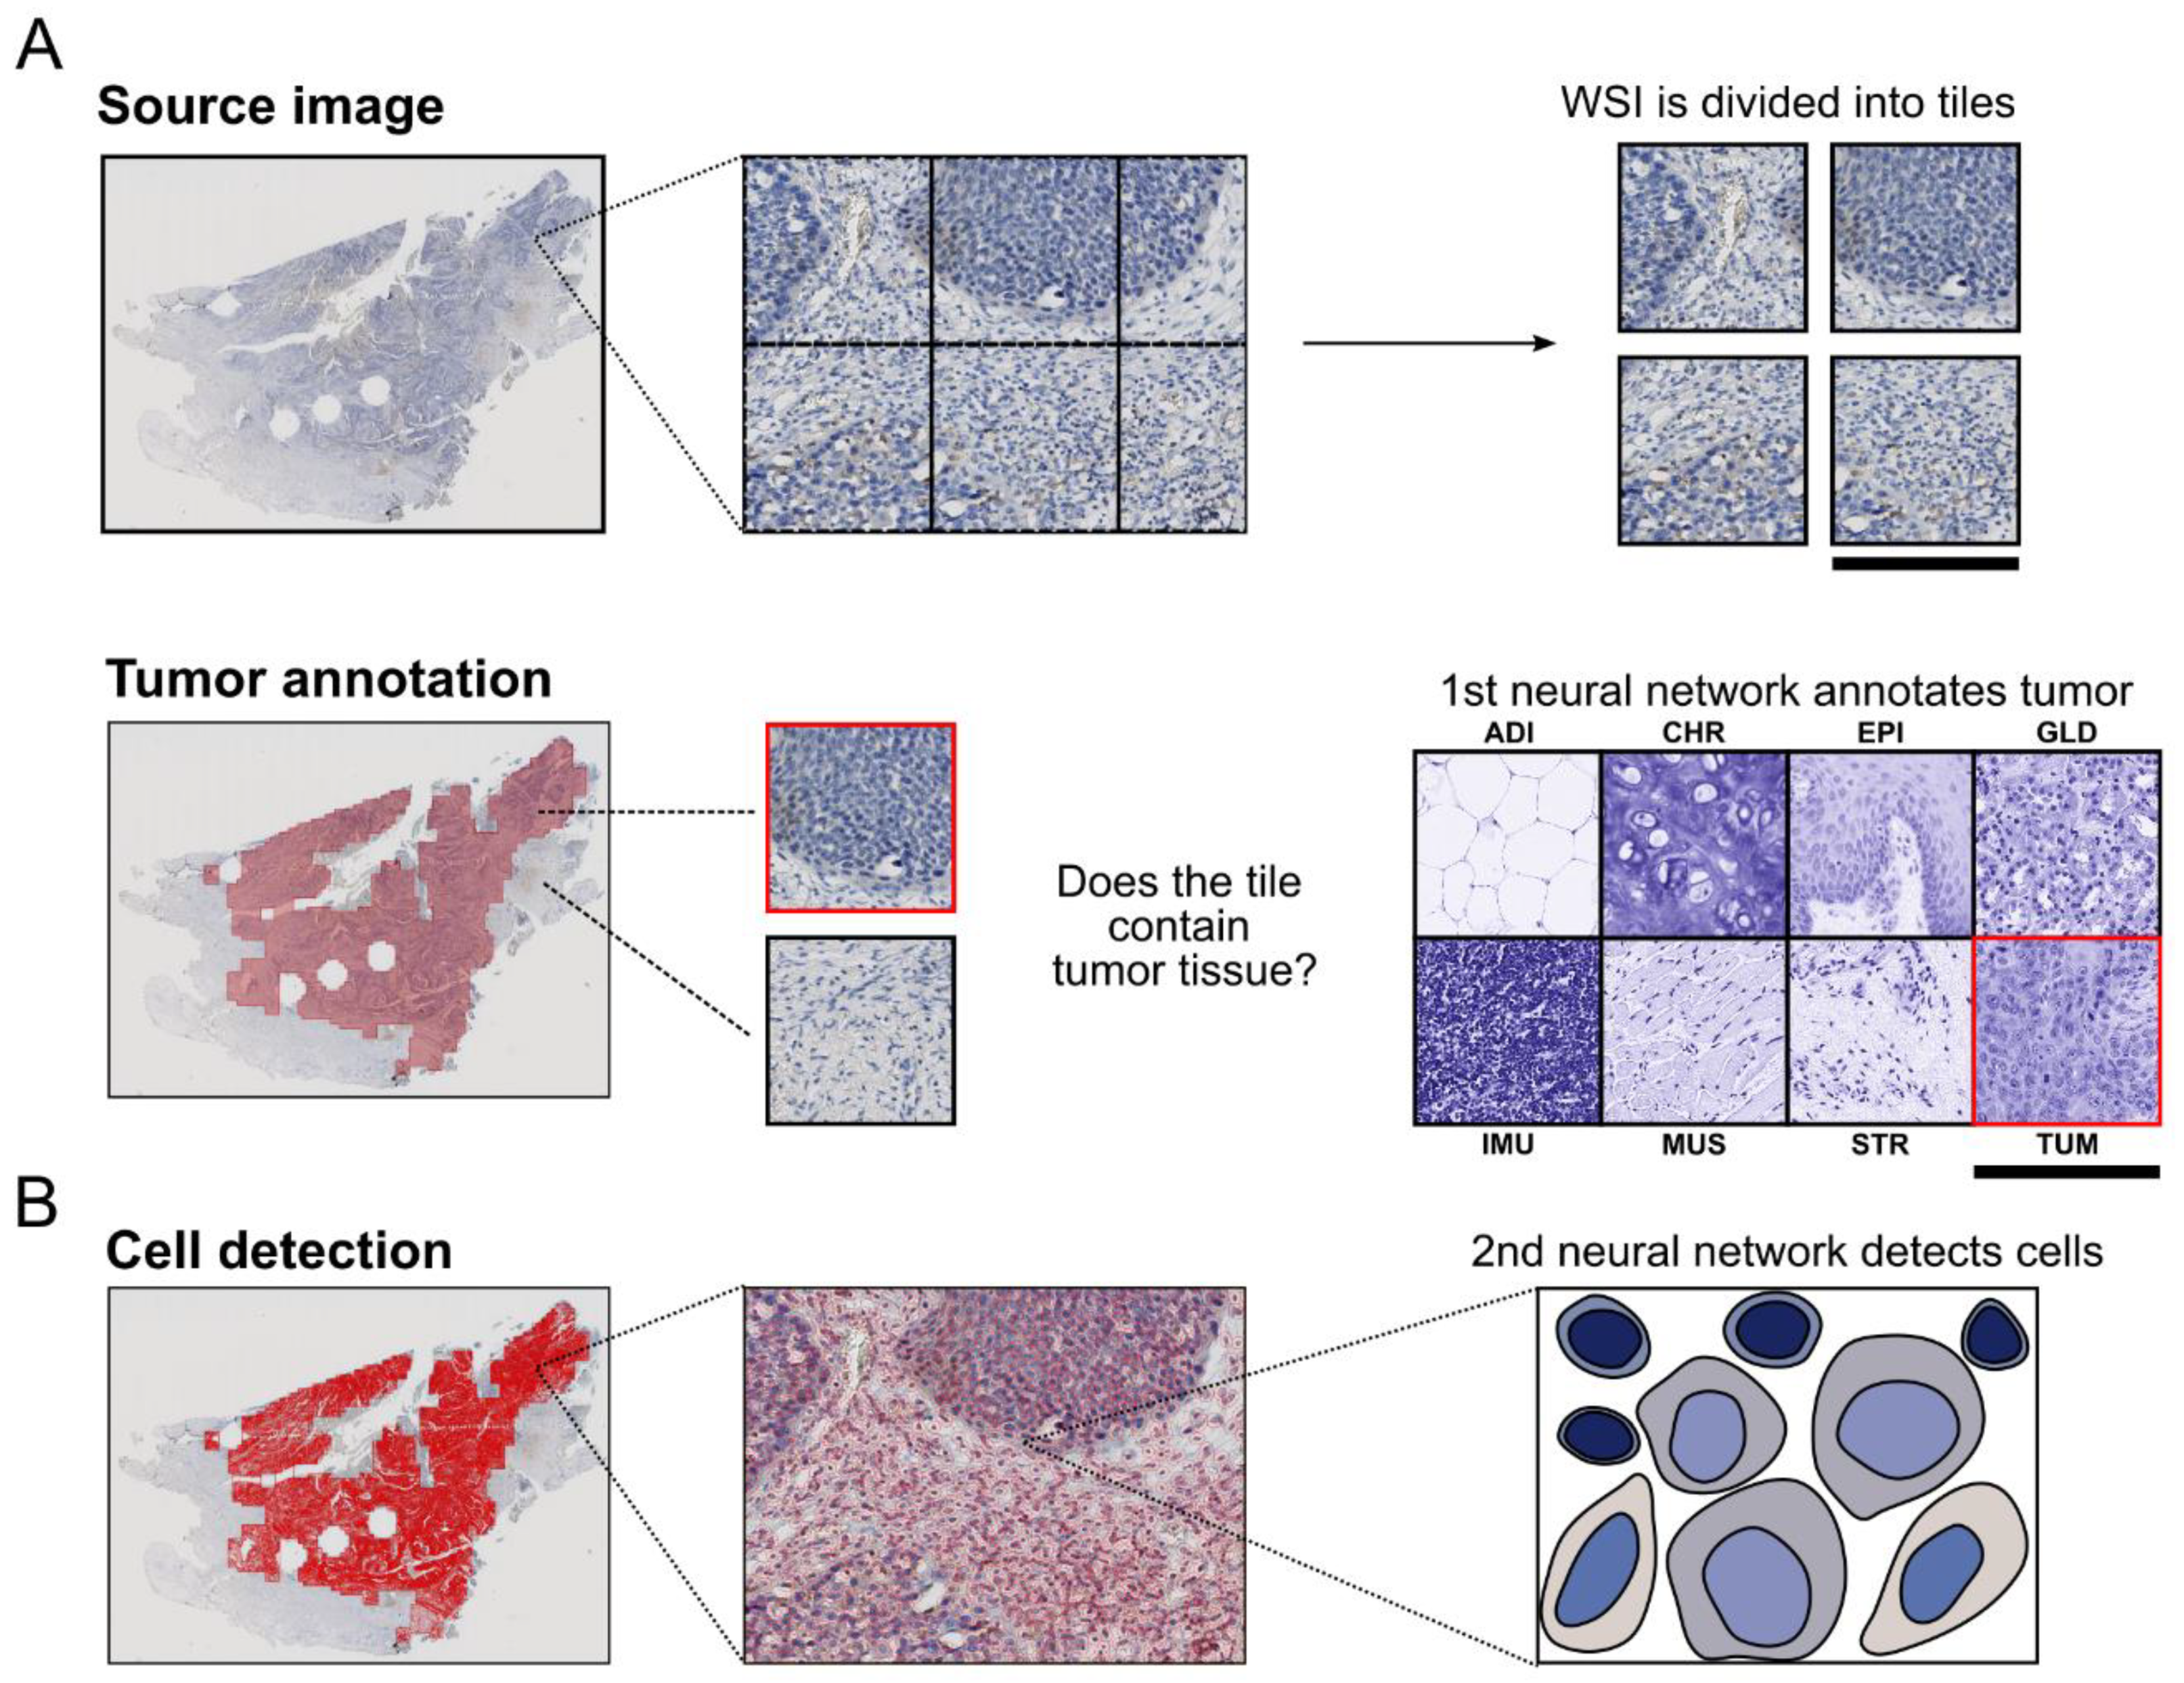
Abstract
:Simple Summary
Abstract
1. Introduction
2. Materials and Methods
2.1. Tissue Training Data, Sampling and Immunohistochemistry
2.2. Automated PD-L1 Scoring
2.2.1. Tumor Detection
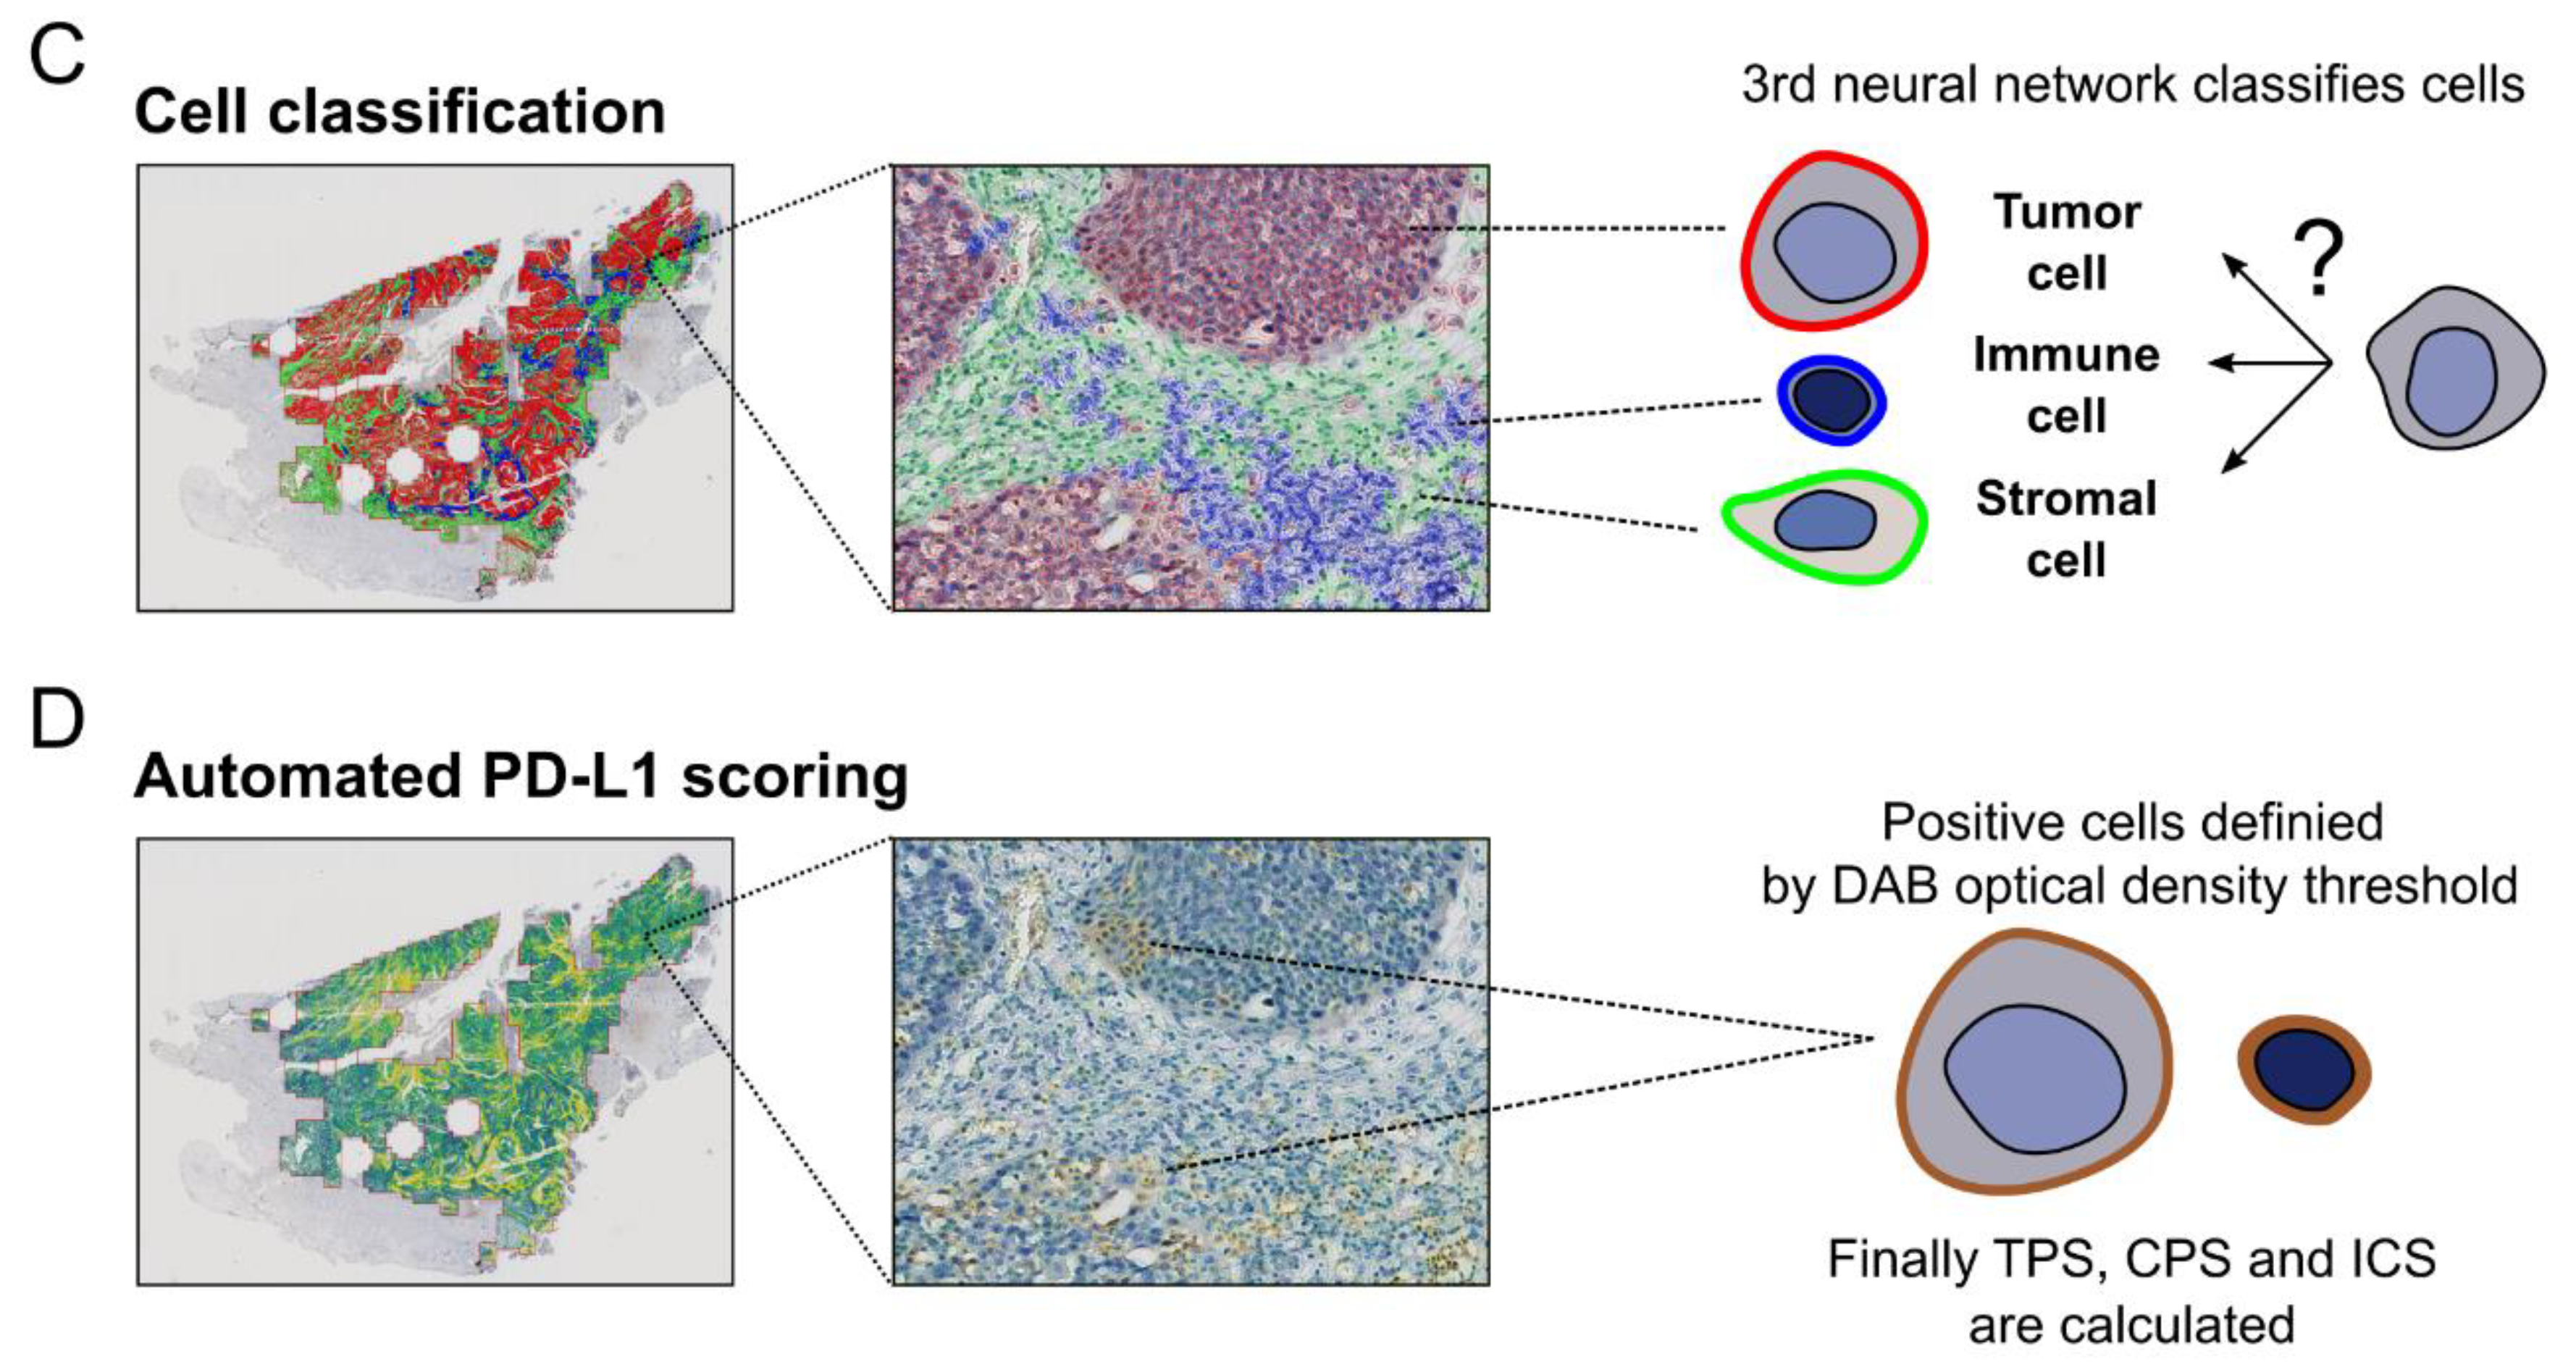
2.2.2. Cell Detection and Classification
2.2.3. Detecting PD-L1 Positive Cells and Calculating PD-L1 Scores
2.2.4. Used Soft- and Hardware
2.3. Manual PD-L1 Scoring
2.4. Statistical Analysis
3. Results
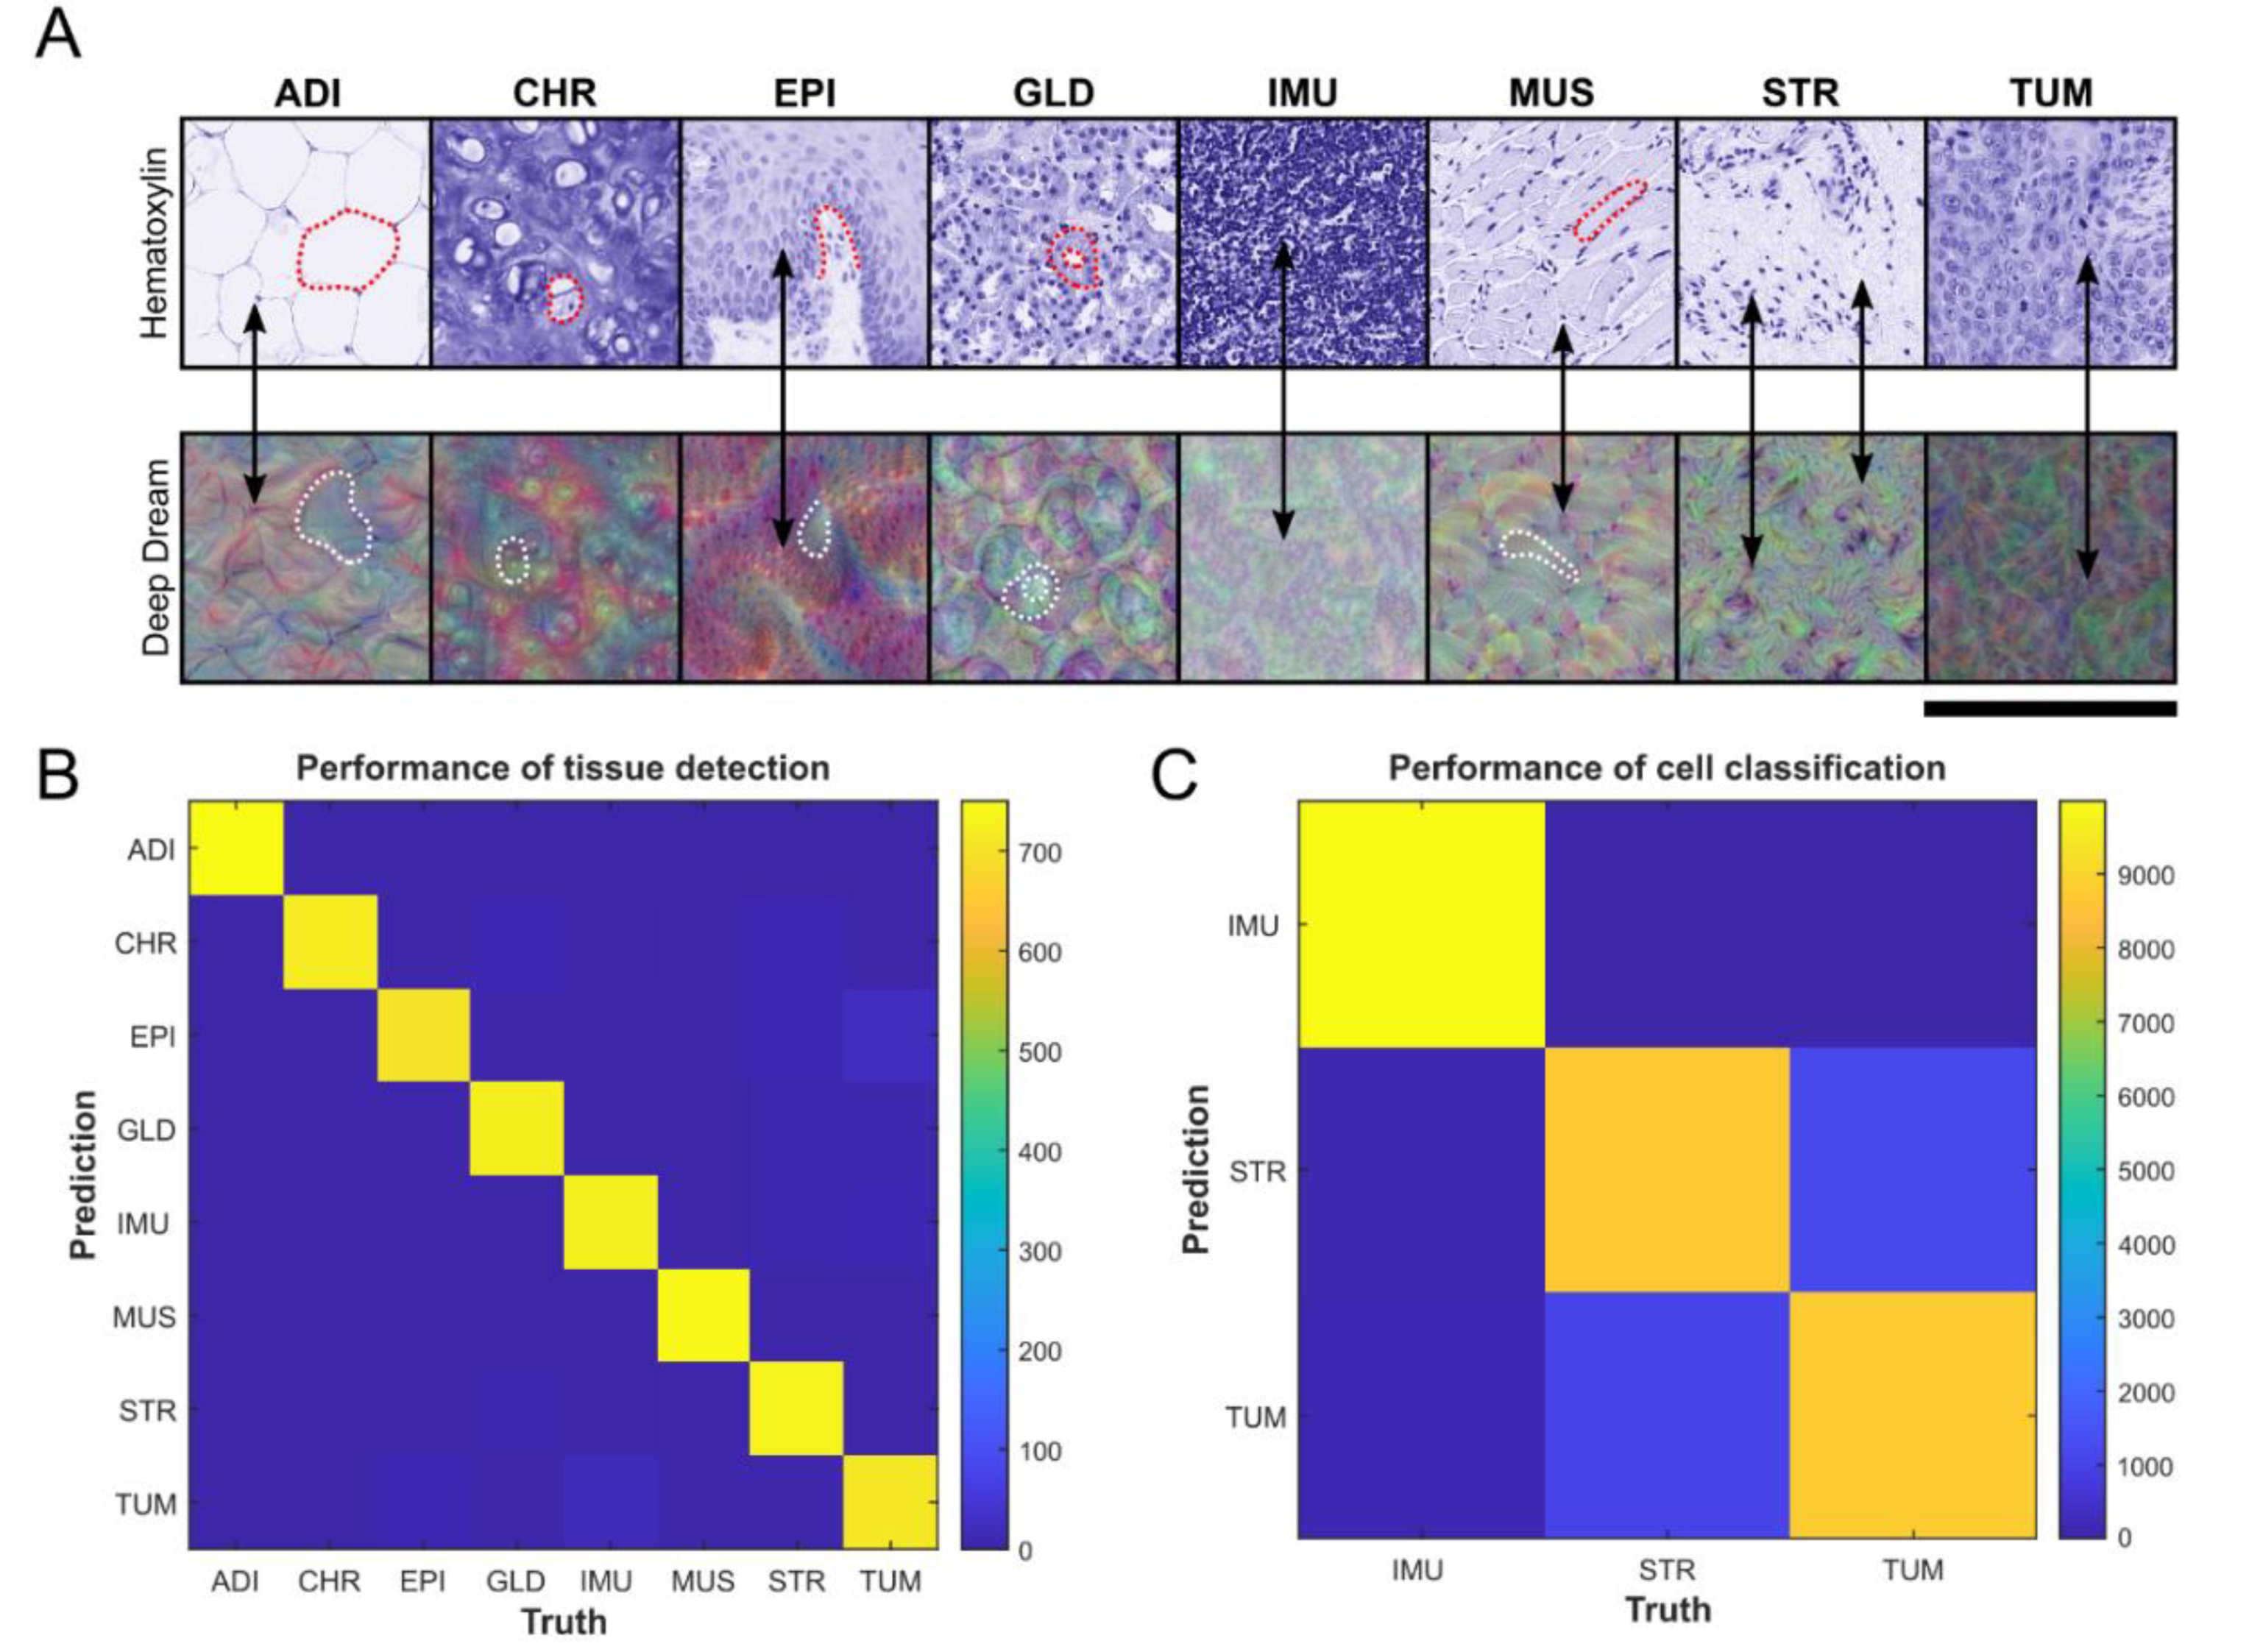
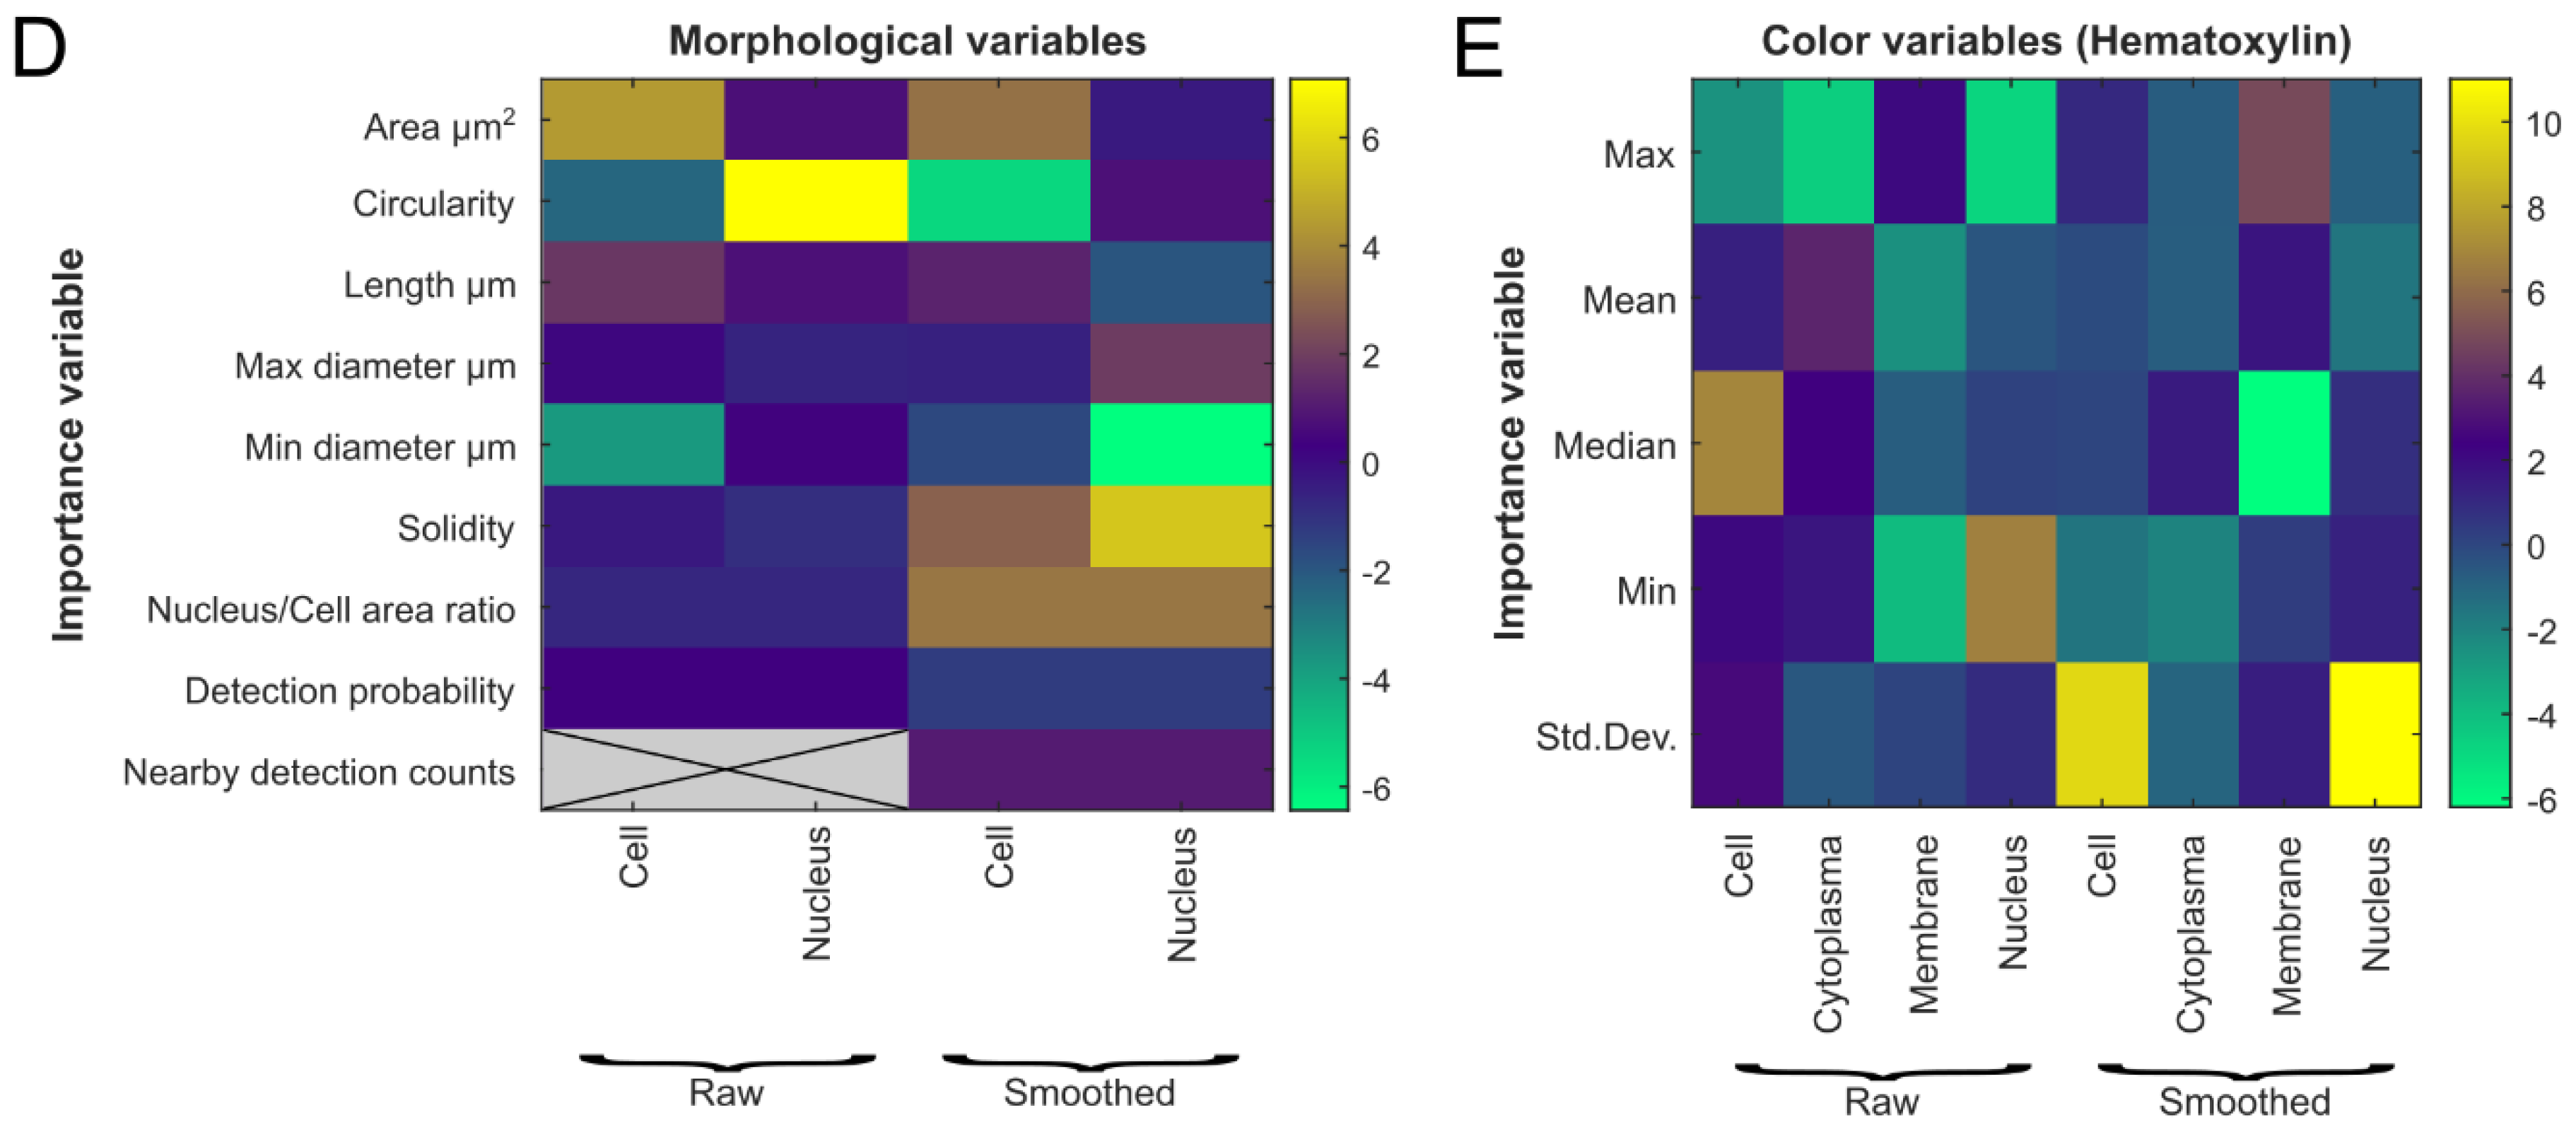
3.1. Evaluation of Tumor Detection and Cell Classification by Neural Networks
3.2. Comparison of Automated and Manual PD-L1 Scores
4. Discussion
5. Conclusions
Supplementary Materials
Author Contributions
Funding
Institutional Review Board Statement
Informed Consent Statement
Data Availability Statement
Acknowledgments
Conflicts of Interest
References
- Bray, F.; Ferlay, J.; Soerjomataram, I.; Siegel, R.L.; Torre, L.A.; Jemal, A. Global cancer statistics 2018: GLOBOCAN estimates of incidence and mortality worldwide for 36 cancers in 185 countries. CA Cancer J. Clin. 2018, 68, 394–424. [Google Scholar] [CrossRef] [Green Version]
- Cooper, J.S.; Porter, K.; Mallin, K.; Hoffman, H.T.; Weber, R.S.; Ang, K.K.; Gay, E.G.; Langer, C.J. National Cancer Database report on cancer of the head and neck: 10-year update. Head Neck J. Sci. Spec. Head Neck 2009, 31, 748–758. [Google Scholar] [CrossRef]
- Cramer, J.D.; Burtness, B.; Le, Q.T.; Ferris, R.L. The changing therapeutic landscape of head and neck cancer. Nat. Rev. Clin. Oncol. 2019, 16, 669–683. [Google Scholar] [CrossRef]
- Brouwer, A.F.; He, K.; Chinn, S.B.; Mondul, A.M.; Chapman, C.H.; Ryser, M.D.; Banerjee, M.; Eisenberg, M.C.; Meza, R.; Taylor, J.M.G. Time-varying survival effects for squamous cell carcinomas at oropharyngeal and nonoropharyngeal head and neck sites in the United States, 1973–2015. Cancer 2020, 126, 5137–5146. [Google Scholar] [CrossRef]
- Specenier, P.; Vermorken, J.B. Optimizing treatments for recurrent or metastatic head and neck squamous cell carcinoma. Expert Rev. Anticancer Ther. 2018, 18, 901–915. [Google Scholar] [CrossRef]
- Cramer, J.D.; Burtness, B.; Ferris, R.L. Immunotherapy for head and neck cancer: Recent advances and future directions. Oral Oncol. 2019, 99, 104460. [Google Scholar] [CrossRef]
- Zandberg, D.P.; Strome, S.E. The role of the PD-L1:PD-1 pathway in squamous cell carcinoma of the head and neck. Oral Oncol. 2014, 50, 627–632. [Google Scholar] [CrossRef]
- Burtness, B.; Harrington, K.J.; Greil, R.; Soulières, D.; Tahara, M.; De Castro, G.; Psyrri, A.; Basté, N.; Neupane, P.; Bratland, Å.; et al. Pembrolizumab alone or with chemotherapy versus cetuximab with chemotherapy for recurrent or metastatic squamous cell carcinoma of the head and neck (KEYNOTE-048): A randomised, open-label, phase 3 study. Lancet 2019, 394, 1915–1928. [Google Scholar] [CrossRef]
- Cohen, E.E.W.; Soulières, D.; Le Tourneau, C.; Dinis, J.; Licitra, L.; Ahn, M.-J.; Soria, A.; Machiels, J.-P.; Mach, N.; Mehra, R.; et al. Pembrolizumab versus methotrexate, docetaxel, or cetuximab for recurrent or metastatic head-and-neck squamous cell carcinoma (KEYNOTE-040): A randomised, open-label, phase 3 study. Lancet 2019, 393, 156–167. [Google Scholar] [CrossRef]
- Zajac, M.; Scott, M.; Ratcliffe, M.; Scorer, P.; Barker, C.; Al-Masri, H.; Rebelatto, M.C.; Walker, J. Concordance among four commercially available, validated programmed cell death ligand-1 assays in urothelial carcinoma. Diagn. Pathol. 2019, 14, 99. [Google Scholar] [CrossRef] [Green Version]
- Dako. PD-L1 IHC 22C3 pharmDx Interpretation Manual, HNSCC. Available online: https://www.agilent.com/cs/library/usermanuals/public/29314_22c3_pharmDx_hnscc_interpretation_manual_us.pdf (accessed on 24 August 2021).
- Federal Drug Administration. KEYTRUDA® (pembrolizumab). Available online: https://www.accessdata.fda.gov/drugsatfda_docs/label/2021/125514s096lbl.pdf (accessed on 24 August 2021).
- European Medicines Agency. Keytruda. Available online: https://www.ema.europa.eu/en/medicines/human/EPAR/keytruda (accessed on 24 August 2021).
- Inge, L.J.; Dennis, E. Development and applications of computer image analysis algorithms for scoring of PD-L1 immunohistochemistry. Immuno-Oncol. Technol. 2020, 6, 2–8. [Google Scholar] [CrossRef]
- Federal Drug Administration. TECENTRIQ® (atezolizumab). Available online: https://www.accessdata.fda.gov/drugsatfda_docs/label/2021/761034s033s034s035s036s037s038lbl.pdf (accessed on 24 August 2021).
- Kapil, A.; Meier, A.; Zuraw, A.; Steele, K.E.; Rebelatto, M.C.; Schmidt, G.; Brieu, N. Deep Semi supervised generative learning for automated tumor proportion scoring on NSCLC tissue needle biopsies. Sci. Rep. 2018, 8, 17343. [Google Scholar] [CrossRef] [PubMed] [Green Version]
- Cohen, E.E.W.; Bell, R.B.; Bifulco, C.B.; Burtness, B.; Gillison, M.L.; Harrington, K.J.; Le, Q.-T.; Lee, N.Y.; Leidner, R.; Lewis, R.L.; et al. The Society for Immunotherapy of Cancer consensus statement on immunotherapy for the treatment of squamous cell carcinoma of the head and neck (HNSCC). J. Immunother. Cancer 2019, 7, 184. [Google Scholar] [CrossRef] [PubMed] [Green Version]
- Wang, C.; Hahn, E.; Slodkowska, E.; Eskander, A.; Enepekides, D.; Higgins, K.; Vesprini, D.; Liu, S.K.; Downes, M.R.; Xu, B. Reproducibility of PD-L1 immunohistochemistry interpretation across various types of genitourinary and head/neck carcinomas, antibody clones, and tissue types. Hum. Pathol. 2018, 82, 131–139. [Google Scholar] [CrossRef]
- Downes, M.R.; Slodkowska, E.; Katabi, N.; Jungbluth, A.A.; Xu, B. Inter- and intraobserver agreement of programmed death ligand 1 scoring in head and neck squamous cell carcinoma, urothelial carcinoma and breast carcinoma. Histopathology 2020, 76, 191–200. [Google Scholar] [CrossRef] [PubMed]
- Hodgson, A.; Slodkowska, E.; Jungbluth, A.; Liu, S.K.; Vesprini, D.; Enepekides, D.; Higgins, K.; Katabi, N.; Xu, B.; Downes, M.R. PD-L1 Immunohistochemistry assay concordance in urothelial carcinoma of the bladder and hypopharyngeal squamous cell carcinoma. Am. J. Surg. Pathol. 2018, 42, 1059–1066. [Google Scholar] [CrossRef]
- De Ruiter, E.J.; Mulder, F.J.; Koomen, B.M.; Speel, E.-J.; Van den Hout, M.F.C.M.; De Roest, R.H.; Bloemena, E.; Devriese, L.A.; Willems, S.M. Comparison of three PD-L1 immunohistochemical assays in head and neck squamous cell carcinoma (HNSCC). Mod. Pathol. 2021, 34, 1125–1132. [Google Scholar] [CrossRef]
- Scheel, A.H.; Dietel, M.; Heukamp, L.C.; Jöhrens, K.; Kirchner, T.; Reu, S.; Rüschoff, J.; Schildhaus, H.-U.; Schirmacher, P.; Tiemann, M.; et al. Harmonized PD-L1 immunohistochemistry for pulmonary squamous-cell and adenocarcinomas. Mod. Pathol. 2016, 29, 1165–1172. [Google Scholar] [CrossRef] [PubMed]
- Adam, J.; Le Stang, N.; Rouquette, I.; Cazes, A.; Badoual, C.; Pinot-Roussel, H.; Tixier, L.; Danel, C.; Damiola, F.; Damotte, D.; et al. Multicenter harmonization study for PD-L1 IHC testing in non-small-cell lung cancer. Ann. Oncol. 2018, 29, 953–958. [Google Scholar] [CrossRef]
- Tsao, M.S.; Kerr, K.M.; Kockx, M.; Beasley, M.-B.; Borczuk, A.C.; Botling, J.; Bubendorf, L.; Chirieac, L.; Chen, G.; Chou, T.-Y.; et al. PD-L1 immunohistochemistry comparability study in real-life clinical samples: Results of blueprint phase 2 project. J. Thorac. Oncol. 2018, 13, 1302–1311. [Google Scholar] [CrossRef] [Green Version]
- Srinidhi, C.L.; Ciga, O.; Martel, A.L. Deep neural network models for computational histopathology: A survey. Med. Image Anal. 2021, 67, 101813. [Google Scholar] [CrossRef]
- Humphries, M.P.; Hynes, S.; Bingham, V.; Cougot, D.; James, J.; Patel-Socha, F.; Parkes, E.E.; Blayney, J.K.; O’Rorke, M.A.; Irwin, G.W.; et al. Automated tumour recognition and digital pathology scoring unravels new role for PD-L1 in predicting good outcome in ER-/HER2+ breast cancer. J. Oncol. 2018, 2018, 2937012. [Google Scholar] [CrossRef] [PubMed]
- Koelzer, V.H.; Gisler, A.; Hanhart, J.C.; Griss, J.; Wagner, S.N.; Willi, N.; Cathomas, G.; Sachs, M.; Kempf, W.; Thommen, D.S.; et al. Digital image analysis improves precision of PD-L1 scoring in cutaneous melanoma. Histopathology 2018, 73, 397–406. [Google Scholar] [CrossRef] [PubMed]
- Humphries, M.P.; McQuaid, S.; Craig, S.G.; Bingham, V.; Maxwell, P.; Maurya, M.; McLean, F.; Sampson, J.; Higgins, P.; Greene, C.; et al. Critical appraisal of programmed death ligand 1 reflex diagnostic testing: Current standards and future opportunities. J. Thorac. Oncol. 2019, 14, 45–53. [Google Scholar] [CrossRef] [Green Version]
- Taylor, C.R.; Jadhav, A.P.; Gholap, A.; Kamble, G.; Huang, J.; Gown, A.; Doshi, I.; Rimm, D.L. A multi-institutional study to evaluate automated whole slide scoring of immunohistochemistry for assessment of programmed death-ligand 1 (PD-L1) expression in non-small cell lung cancer. Appl. Immunohistochem. Mol. Morphol. 2019, 27, 263–269. [Google Scholar] [CrossRef]
- Humphries, M.P.; Bingham, V.; Abdullahi Sidi, F.; Craig, S.G.; McQuaid, S.; James, J.; Salto-Tellez, M. Improving the diagnostic accuracy of the PD-L1 test with image analysis and multiplex hybridization. Cancers 2020, 12, 1114. [Google Scholar] [CrossRef]
- Kang, Y.; Li, H.; Han, X.; Pan, B.; Li, Y.; Jin, Y.; Bu, Q.; Cui, L.; Feng, J.; Yang, L. Automated tumor proportion scoring for assessment of PD-L1 expression based on multi-stage ensemble strategy. In Machine Learning in Medical Imaging: 11th International Workshop, MLMI 2020; Liu, M., Yan, P., Lian, C., Cao, X., Eds.; Springer International Publishing: Cham, Switzerland, 2020; pp. 70–79. ISBN 978-3-030-59860-0. [Google Scholar]
- Kim, H.-N.; Jang, J.; Heo, Y.J.; Kim, B.; Jung, H.; Jang, Y.; Kang, S.Y.; Kim, S.T.; Lee, J.; Kang, W.K.; et al. PD-L1 expression in gastric cancer determined by digital image analyses: Pitfalls and correlation with pathologist interpretation. Virchows Arch. 2020, 476, 243–250. [Google Scholar] [CrossRef]
- Widmaier, M.; Wiestler, T.; Walker, J.; Barker, C.; Scott, M.L.; Sekhavati, F.; Budco, A.; Schneider, K.; Segerer, F.J.; Steele, K.; et al. Comparison of continuous measures across diagnostic PD-L1 assays in non-small cell lung cancer using automated image analysis. Mod. Pathol. 2020, 33, 380–390. [Google Scholar] [CrossRef] [Green Version]
- Wu, J.; Liu, C.; Liu, X.; Sun, W.; Li, L.; Zhang, Y.; Zhang, J.; Wang, H.; Yang, X.; Huang, X.; et al. Deep learning approach for automated cancer detection and tumor proportion score estimation of PD-L1 expression in lung adenocarcinoma. bioRxiv 2020. [Google Scholar] [CrossRef]
- Kapil, A.; Meier, A.; Steele, K.; Rebelatto, M.; Nekolla, K.; Haragan, A.; Silva, A.; Zuraw, A.; Barker, C.; Scott, M.L.; et al. Domain adaptation-based deep learning for automated Tumor Cell (TC) scoring and survival analysis on PD-L1 stained tissue images. IEEE Trans. Med. Imaging 2021, 40, 2513–2523. [Google Scholar] [CrossRef] [PubMed]
- Naso, J.R.; Povshedna, T.; Wang, G.; Banyi, N.; MacAulay, C.; Ionescu, D.N.; Zhou, C. Automated PD-L1 scoring for non-small cell lung carcinoma using open-source software. Pathol. Oncol. Res. 2021, 27, 20. [Google Scholar] [CrossRef]
- Zhang, X.; Zhou, X.; Lin, M.; Sun, J. Shufflenet: An extremely efficient convolutional neural network for mobile devices. In Proceedings of the IEEE Conference on Computer Vision and Pattern Recognition, Salt Lake City, UT, USA, 18–23 June 2018; pp. 6848–6856. [Google Scholar]
- Bankhead, P.; Loughrey, M.B.; Fernández, J.A.; Dombrowski, Y.; McArt, D.G.; Dunne, P.D.; McQuaid, S.; Gray, R.T.; Murray, L.J.; Coleman, H.G.; et al. QuPath: Open source software for digital pathology image analysis. Sci. Rep. 2017, 7, 16878. [Google Scholar] [CrossRef] [PubMed] [Green Version]
- Bankhead, P. QuPath-Import binary masks.groovy. Available online: https://gist.github.com/petebankhead/f807395f5d4f4bf0847584458ab50277 (accessed on 24 August 2021).
- The MathWorks, Inc. Deep Learning Toolbox. Natick, Massachusetts, United State. 2021. Available online: https://www.mathworks.com/help/deeplearning/ (accessed on 24 August 2021).
- Mordvintsev, A.; Olah, C.; Tyka, M. Inceptionism: Going Deeper into Neural Networks. 2015. Available online: https://research.googleblog.com/2015/06/inceptionism-going-deeper-into-neural.html (accessed on 24 August 2021).
- Schmidt, U.; Weigert, M.; Broaddus, C.; Myers, G. Cell detection with star-convex polygons. In International Conference on Medical Image Computing and Computer-Assisted Intervention; Springer: Cham, Switzerland, 2018; pp. 265–273. [Google Scholar] [CrossRef] [Green Version]
- Cell Classification—QuPath 0.2.3 Documentation. Available online: https://qupath.readthedocs.io/en/latest/docs/tutorials/cell_classification.html (accessed on 24 August 2021).
- Abdul Nasir, A.S.; Mashor, M.; Hassan, R. Classification of acute leukaemia cells using multilayer perceptron and simplified fuzzy ARTMAP neural networks. Int. Arab. J. Inf. Technol. 2013, 10, 356–364. [Google Scholar]
- Olden, J.D.; Joy, M.K.; Death, R.G. An accurate comparison of methods for quantifying variable importance in artificial neural networks using simulated data. Ecol. Model. 2004, 178, 389–397. [Google Scholar] [CrossRef]
- Gamer, M.; Lemon, J.; Fellows, I.; Singh, P. Package Irr: Various Coefficients of Interrater Reliability and Agreement (Versión 0.84). R Archive Network. 2012. Available online: https://cran.r-project.org/web/packages/irr/irr.pdf (accessed on 24 August 2021).
- Koo, T.K.; Li, M.Y. A guideline of selecting and reporting intraclass correlation coefficients for reliability research. J. Chiropr. Med. 2016, 15, 155–163. [Google Scholar] [CrossRef] [Green Version]
- Light, R.J. Measures of response agreement for qualitative data: Some generalizations and alternatives. Psychol. Bull. 1971, 76, 365–377. [Google Scholar] [CrossRef]
- Watson, P.F.; Petrie, A. Method agreement analysis: A review of correct methodology. Theriogenology 2010, 73, 1167–1179. [Google Scholar] [CrossRef] [Green Version]
- Beck, M.W. NeuralNetTools: Visualization and analysis tools for neural networks. J. Stat. Softw. 2018, 85, 1–20. [Google Scholar] [CrossRef]
- Crosta, S.; Boldorini, R.; Bono, F.; Brambilla, V.; Dainese, E.; Fusco, N.; Gianatti, A.; L’Imperio, V.; Morbini, P.; Pagni, F. PD-L1 testing and squamous cell carcinoma of the head and neck: A multicenter study on the diagnostic reproducibility of different protocols. Cancers 2021, 13, 292. [Google Scholar] [CrossRef] [PubMed]
- Aeffner, F.; Wilson, K.; Martin, N.T.; Black, J.C.; Hendriks, C.L.L.; Bolon, B.; Rudmann, D.G.; Gianani, R.; Koegler, S.R.; Krueger, J.; et al. The gold standard paradox in digital image analysis: Manual versus automated scoring as ground truth. Arch. Pathol. Lab. Med. 2017, 141, 1267–1275. [Google Scholar] [CrossRef] [Green Version]
- Brunnström, H.; Johansson, A.; Westbom-Fremer, S.; Backman, M.; Djureinovic, D.; Patthey, A.; Isaksson-Mettävainio, M.; Gulyas, M.; Micke, P. PD-L1 immunohistochemistry in clinical diagnostics of lung cancer: Inter-pathologist variability is higher than assay variability. Mod. Pathol. 2017, 30, 1411–1421. [Google Scholar] [CrossRef] [Green Version]
- Reisenbichler, E.S.; Han, G.; Bellizzi, A.; Bossuyt, V.; Brock, J.; Cole, K.; Fadare, O.; Hameed, O.; Hanley, K.; Harrison, B.T.; et al. Prospective multi-institutional evaluation of pathologist assessment of PD-L1 assays for patient selection in triple negative breast cancer. Mod. Pathol. 2020, 33, 1746–1752. [Google Scholar] [CrossRef]
- Conroy, J.M.; Pabla, S.; Nesline, M.K.; Glenn, S.T.; Papanicolau-Sengos, A.; Burgher, B.; Andreas, J.; Giamo, V.; Wang, Y.; Lenzo, F.L.; et al. Next generation sequencing of PD-L1 for predicting response to immune checkpoint inhibitors. J. Immunother. Cancer 2019, 7, 18. [Google Scholar] [CrossRef] [Green Version]
- Ruifrok, A.C.; Johnston, D.A. Quantification of histochemical staining by color deconvolution. Anal. Quant. Cytol. Histol. 2001, 23, 291–299. [Google Scholar] [PubMed]
- Kather, J.N.; Heij, L.R.; Grabsch, H.I.; Loeffler, C.; Echle, A.; Muti, H.S.; Krause, J.; Niehues, J.M.; Sommer, K.A.J.; Bankhead, P.; et al. Pan-cancer image-based detection of clinically actionable genetic alterations. Nat Cancer 2020, 1, 789–799. [Google Scholar] [CrossRef] [PubMed]
- Beucher, S.; Lantuejoul, C. Use of watersheds in contour detection. In Proceedings of the International Workshop on Image Processing: Real-time Edge and Motion Detection/Estimation, Rennes, France, 17–21 September 1979; CCETT/IRISA: Rennes, France, 1979. Available online: https://people.cmm.minesparis.psl.eu/users/beucher/publi/watershed.pdf (accessed on 24 August 2021).
- Soltau, H.; Saon, G.; Sainath, T.N. Joint Training of Convolutional and Non-Convolutional Neural Networks. In Proceedings of the 2014 IEEE International Conference on Acoustics, Speech and Signal Processing (ICASSP), Florence, Italy, 4–9 May 2014; IEEE: Piscataway, NJ, USA, 2014. [Google Scholar]


 PD-L1 average score of the four human investigators.
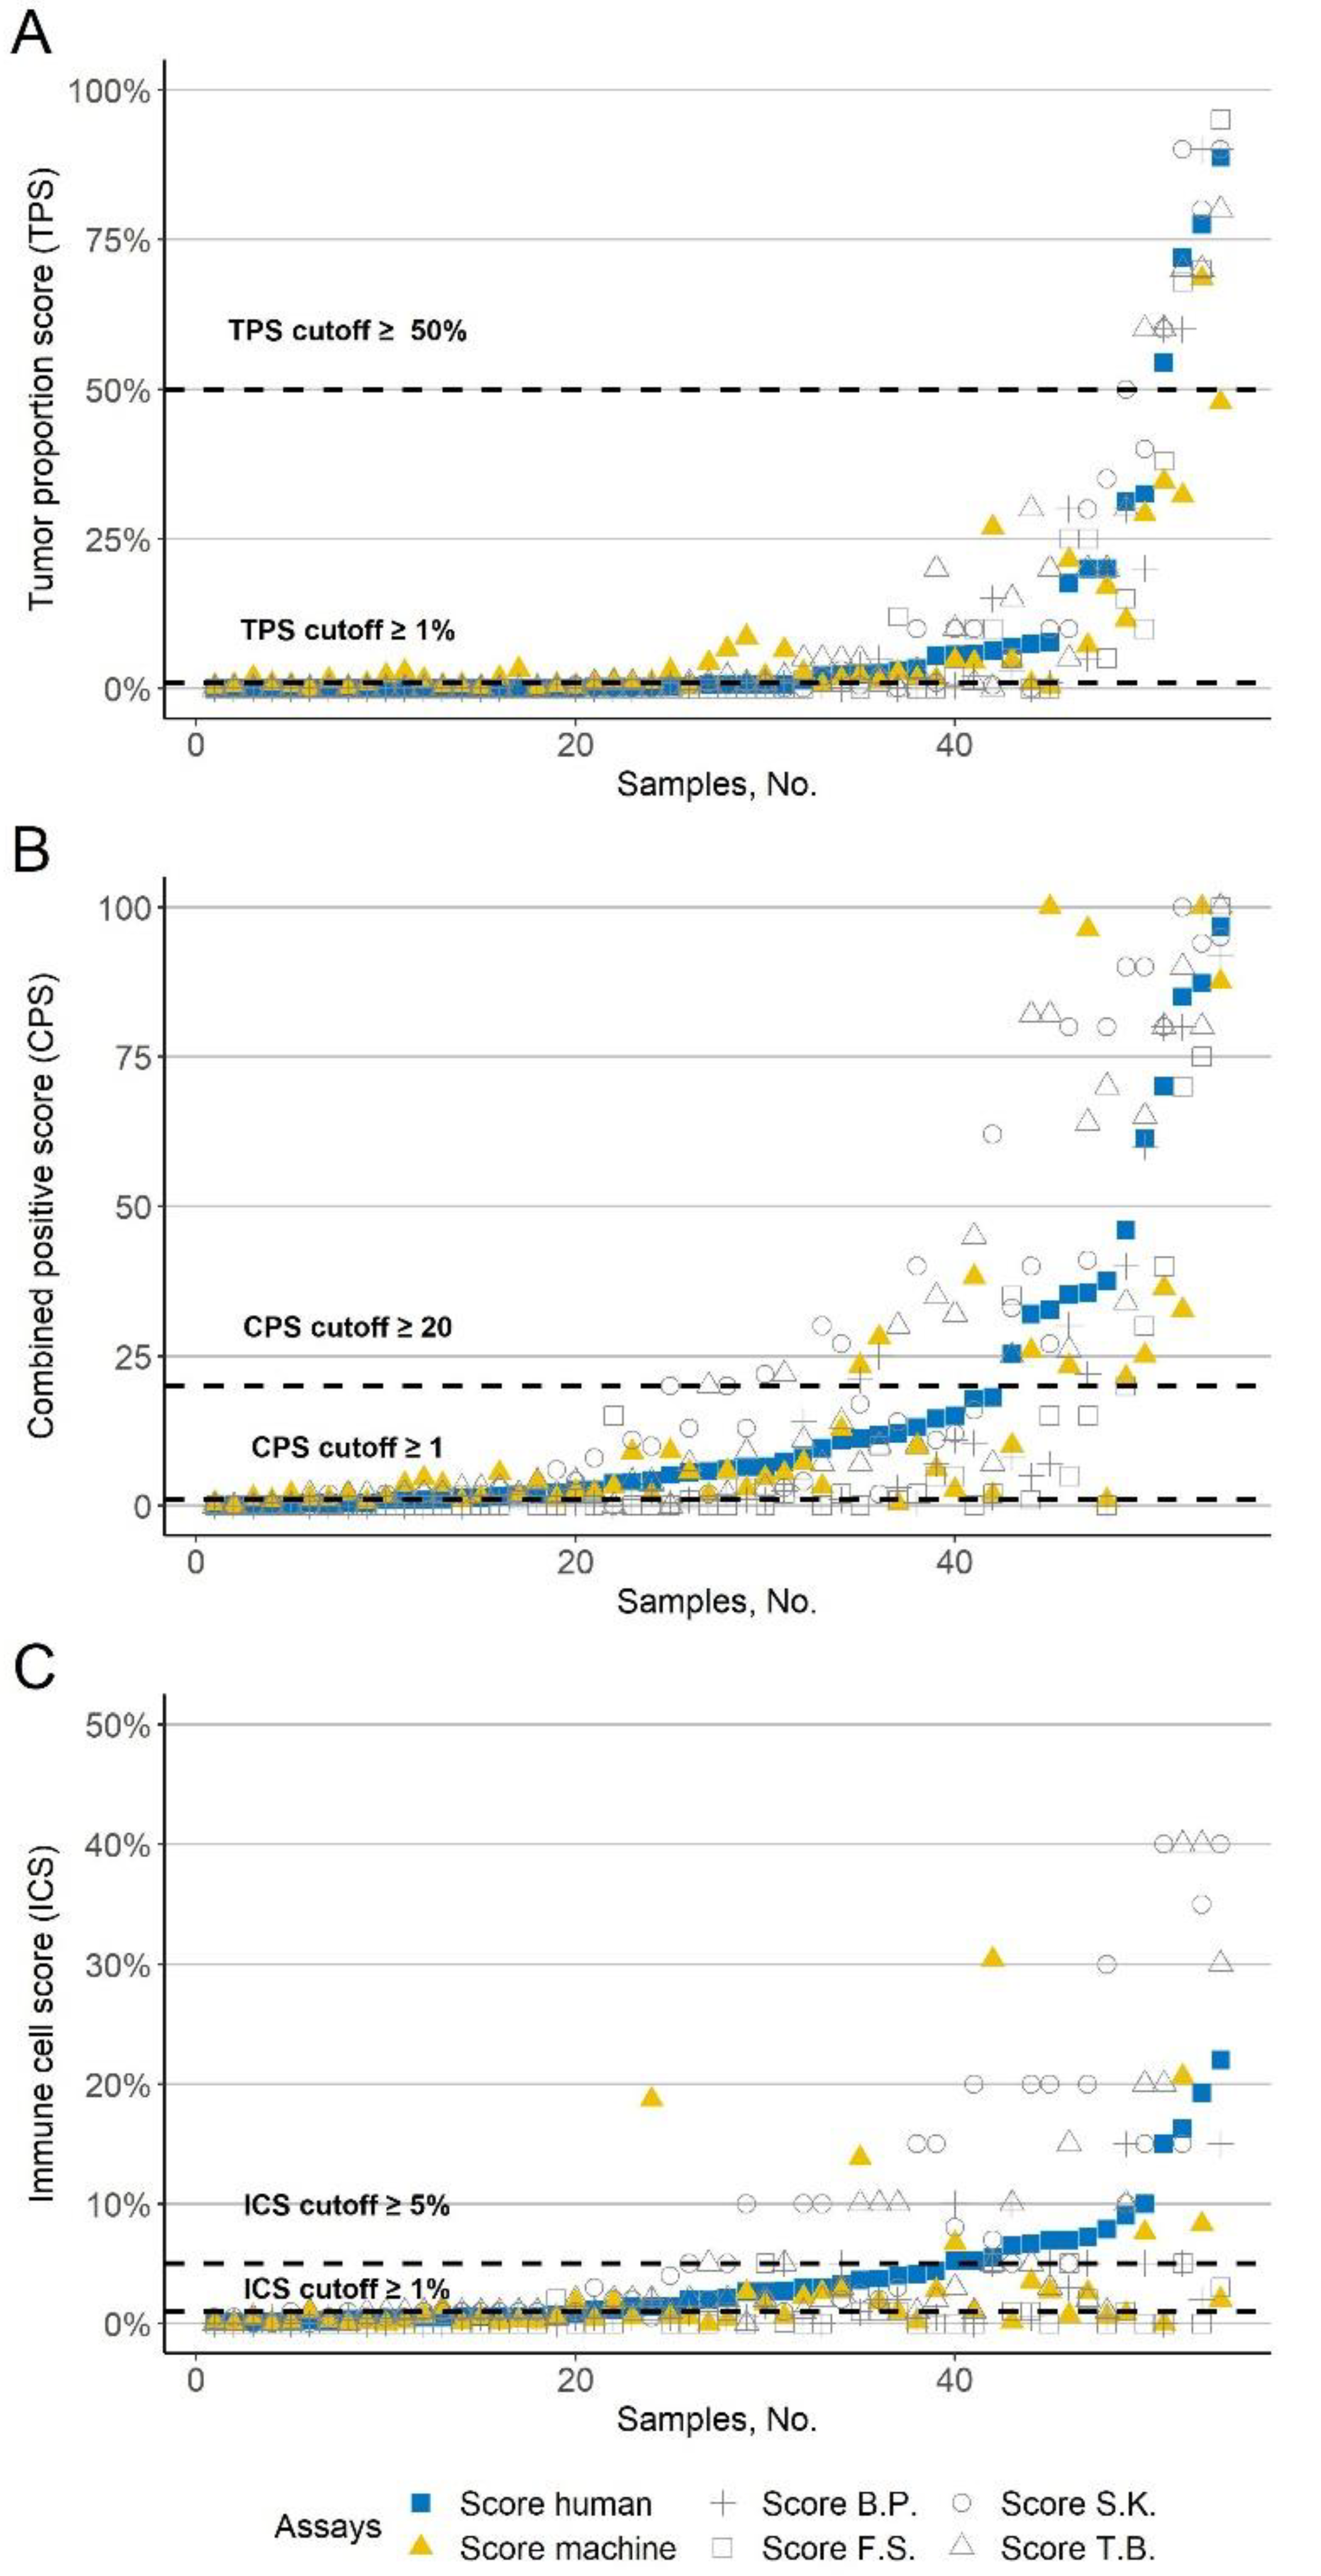
  Automated PD-L1 score based. The gray symbols correspond to the four investigators (+ B.P., □ F.S., ○ S.K., and △ T.B.); The x-axis shows the samples. The y-axis shows the corresponding PD-L1 scores. The dashed line indicates common cutoffs. The values are sorted in ascending order according to the PD-L1 average score of the four investigators. (A) Tumor proportion score (TPS). (B) Combined positive score (CPS). (C) Immune cell score (ICS).
PD-L1 average score of the four human investigators. Automated PD-L1 score based. The gray symbols correspond to the four investigators (+ B.P., □ F.S., ○ S.K., and △ T.B.); The x-axis shows the samples. The y-axis shows the corresponding PD-L1 scores. The dashed line indicates common cutoffs. The values are sorted in ascending order according to the PD-L1 average score of the four investigators. (A) Tumor proportion score (TPS). (B) Combined positive score (CPS). (C) Immune cell score (ICS).
Automated PD-L1 score based. The gray symbols correspond to the four investigators (+ B.P., □ F.S., ○ S.K., and △ T.B.); The x-axis shows the samples. The y-axis shows the corresponding PD-L1 scores. The dashed line indicates common cutoffs. The values are sorted in ascending order according to the PD-L1 average score of the four investigators. (A) Tumor proportion score (TPS). (B) Combined positive score (CPS). (C) Immune cell score (ICS).
PD-L1 average score of the four human investigators. Automated PD-L1 score based. The gray symbols correspond to the four investigators (+ B.P., □ F.S., ○ S.K., and △ T.B.); The x-axis shows the samples. The y-axis shows the corresponding PD-L1 scores. The dashed line indicates common cutoffs. The values are sorted in ascending order according to the PD-L1 average score of the four investigators. (A) Tumor proportion score (TPS). (B) Combined positive score (CPS). (C) Immune cell score (ICS).


Publisher’s Note: MDPI stays neutral with regard to jurisdictional claims in published maps and institutional affiliations. |
© 2021 by the authors. Licensee MDPI, Basel, Switzerland. This article is an open access article distributed under the terms and conditions of the Creative Commons Attribution (CC BY) license (https://creativecommons.org/licenses/by/4.0/).
Share and Cite
Puladi, B.; Ooms, M.; Kintsler, S.; Houschyar, K.S.; Steib, F.; Modabber, A.; Hölzle, F.; Knüchel-Clarke, R.; Braunschweig, T. Automated PD-L1 Scoring Using Artificial Intelligence in Head and Neck Squamous Cell Carcinoma. Cancers 2021, 13, 4409. https://doi.org/10.3390/cancers13174409
Puladi B, Ooms M, Kintsler S, Houschyar KS, Steib F, Modabber A, Hölzle F, Knüchel-Clarke R, Braunschweig T. Automated PD-L1 Scoring Using Artificial Intelligence in Head and Neck Squamous Cell Carcinoma. Cancers. 2021; 13(17):4409. https://doi.org/10.3390/cancers13174409
Chicago/Turabian StylePuladi, Behrus, Mark Ooms, Svetlana Kintsler, Khosrow Siamak Houschyar, Florian Steib, Ali Modabber, Frank Hölzle, Ruth Knüchel-Clarke, and Till Braunschweig. 2021. "Automated PD-L1 Scoring Using Artificial Intelligence in Head and Neck Squamous Cell Carcinoma" Cancers 13, no. 17: 4409. https://doi.org/10.3390/cancers13174409