Progression-Free Survival Early Assessment Is a Robust Surrogate Endpoint of Overall Survival in Immunotherapy Trials of Hepatocellular Carcinoma

 , , , ,
Abstract
:Simple Summary
Abstract
1. Introduction
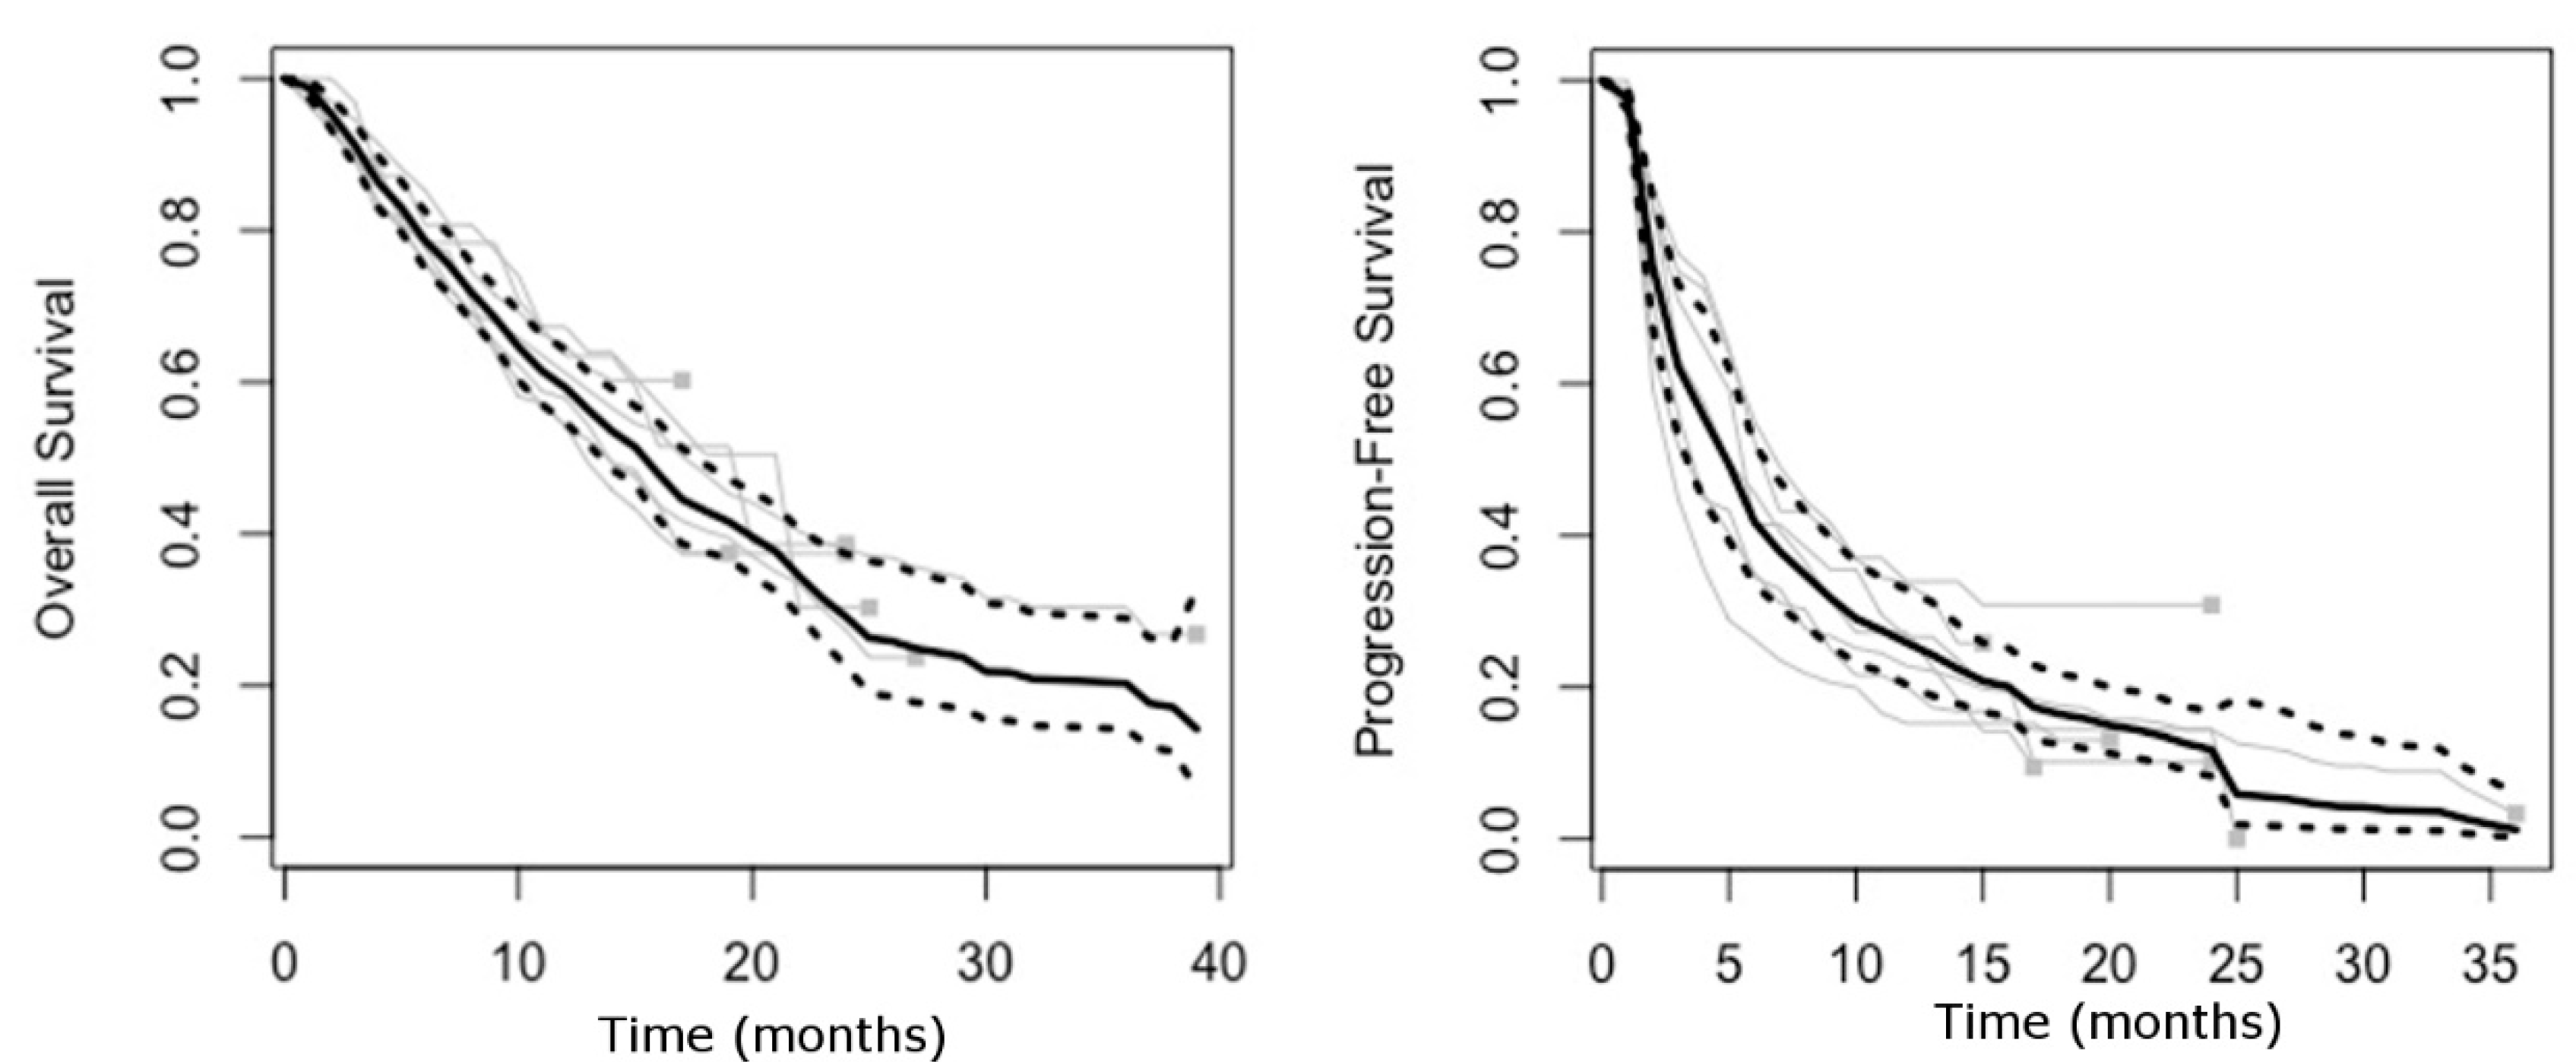
2. Results
2.1. Trial Selection and Characteristics
2.2. Surrogacy Metrics
3. Discussion
4. Materials and Methods
4.1. Literature Search and Study Selection
4.2. Trial-Level Data Extraction
4.3. Individual Patient Survival Data Extraction
4.4. Restricted Mean Survival Time (RMST)
4.5. Statistical Analysis
4.5.1. Step 1: Assessing Proportional Hazards Assumption
4.5.2. Step 2: Surrogacy Endpoint Validation
4.6. Subgroup Analyses
5. Conclusions
Supplementary Materials
Author Contributions
Funding
Institutional Review Board Statement
Informed Consent Statement
Data Availability Statement
Conflicts of Interest
References
- Bruix, J.; da Fonseca, L.G.; Reig, M. Nat Insights into the success and failure of systemic therapy for hepatocellular carcinoma. Rev. Gastroenterol. Hepatol. 2019, 16, 617–630. [Google Scholar]
- Finn, R.S.; Qin, S.; Ikeda, M.; Galle, P.R.; Ducreux, M.; Kim, T.Y.; Kudo, M.; Breder, V.; Merle, P.; Kaseb, A.O.; et al. Atezolizumab plus Bevacizumab in Unresectable Hepatocellular Carcinoma. N. Engl. J. Med. 2020, 382, 1894–1905. [Google Scholar] [CrossRef] [PubMed]
- Faivre, S.; Rimassa, L. Finn RS Molecular therapies for HCC: Looking outside the box. J. Hepatol. 2020, 72, 342–352. [Google Scholar] [CrossRef] [PubMed] [Green Version]
- Pazdur, R. Endpoints for assessing drug activity in clinical trials. Oncologist 2008, 13, 19–21. [Google Scholar] [CrossRef] [Green Version]
- Zhao, F. Surrogate end points and their validation in oncology clinical trials. J. Clin. Oncol. 2016, 34, 1436–1437. [Google Scholar] [CrossRef]
- Finn, R.S. Progression-free survival: Starting point or endpoint in advanced HCC trial design? J. Hepatol. 2019, 70, 1062–1064. [Google Scholar] [CrossRef]
- Prasad, V.; Kim, C.; Burotto, M.; Vandross, A. The strength of association between surrogate end points and survival in oncology: A systematic review of trial-level meta-analyses. JAMA Intern. Med. 2015, 175, 1389–1398. [Google Scholar] [CrossRef] [Green Version]
- Seymour, L.; Bogaerts, J.; Perrone, A.; Ford, R.; Schwartz, L.H.; Mandrekar, S.; Lin, N.U.; Litière, S.; Dancey, J.; Chen, A.; et al. iRECIST: Guidelines for response criteria for use in trials testing immunotherapeutics. Lancet Oncol. 2017, 18, e143–e152. [Google Scholar] [CrossRef] [Green Version]
- Llovet, J.M.; Montal, R.; Villanueva, A. Randomized trials and endpoints in advanced HCC: Role of PFS as a surrogate of survival. J. Hepatol. 2019, 70, 1262–1277. [Google Scholar] [CrossRef] [Green Version]
- Mushti, S.L.; Mulkey, F.; Sridhara, R. Evaluation of Overall Response Rate and Progression-Free Survival as Potential Surrogate Endpoints for Overall Survival in Immunotherapy Trials. Clin. Cancer Res. 2018, 24, 2268–2275. [Google Scholar] [CrossRef] [Green Version]
- Tan, A.; Porcher, R.; Crequit, P.; Ravaud, P.; Dechartres, A. Differences in Treatment Effect Size Between Overall Survival and Progression-Free Survival in Immunotherapy Trials: A Meta-Epidemiologic Study of Trials with Results Posted at ClinicalTrials.gov. J. Clin. Oncol. 2017, 35, 1686–1694. [Google Scholar] [CrossRef] [PubMed]
- Finn, R.S.; Ryoo, B.Y.; Merle, P.; Kudo, M.; Bouattour, M.; Lim, H.Y.; Breder, V.; Edeline, J.; Chao, Y.; Ogasawara, S.; et al. Pembrolizumab As Second-Line Therapy in Patients with Advanced Hepatocellular Carcinoma in KEYNOTE-240: A Randomized, Double-Blind, Phase III Trial. J. Clin. Oncol. 2020, 38, 193–202. [Google Scholar] [CrossRef] [PubMed]
- Zhu, A.X.; Finn, R.S.; Edeline, J.; Cattan, S.; Ogasawara, S.; Palmer, D.; Verslype, C.; Zagonel, V.; Fartoux, L.; Vogel, A.; et al. Pembrolizumab in patients with advanced hepatocellular carcinoma previously treated with sorafenib (KEYNOTE-224): A non-randomised, open-label phase 2 trial. Lancet Oncol. 2018, 19, 940–952. [Google Scholar] [CrossRef]
- El-Khoueiry, A.B.; Sangro, B.; Yau, T.; Crocenzi, T.S.; Kudo, M.; Hsu, C.; Kim, T.Y.; Choo, S.P.; Trojan, J.; Welling, T.H.R.d.; et al. Nivolumab in patients with advanced hepatocellular carcinoma (CheckMate 040): An open-label, non-comparative, phase 1/2 dose escalation and expansion trial. Lancet 2017, 389, 2492–2502. [Google Scholar] [CrossRef]
- Qin, S.; Ren, Z.; Meng, Z.; Chen, Z.; Chai, X.; Xiong, J.; Bai, Y.; Yang, L.; Zhu, H.; Fang, W.; et al. Camrelizumab in patients with previously treated advanced hepatocellular carcinoma: A multicentre, open-label, parallel-group, randomised, phase 2 trial. Lancet Oncol. 2020, 21, 571–580. [Google Scholar] [CrossRef]
- Sangro, B.; Gomez-Martin, C.; de la Mata, M.; Iñarrairaegui, M.; Garralda, E.; Barrera, P.; Riezu-Boj, J.I.; Larrea, E.; Alfaro, C.; Sarobe, P.; et al. A clinical trial of CTLA-4 blockade with tremelimumab in patients with hepatocellular carcinoma and chronic hepatitis C. J. Hepatol. 2013, 59, 81–88. [Google Scholar] [CrossRef]
- Yau, T.; Park, J.W.; Finn, R.S.; Cheng, A.; Mathurin, P.; Edeline, J.; Kudo, M.; Han, K.; Harding, J.J.; Merle, P.; et al. Checkmate 459: A Randomized, Multi-Center Phase 3 Study of Nivolumab (Nivo) Vs Sorafenib (Sor) As First-Line (1l) Treatment in Patients (Pts) with Advanced Hepatocellular Carcinoma (Ahcc). Ann. Oncol. 2019, 30 (Suppl. 5), v851–v934. [Google Scholar] [CrossRef]
- Clinicaltrials.gov. NCT01693562. Available online: https://clinicaltrials.gov/ct2/show/NCT01693562 (accessed on 15 May 2020).
- Yau, T.; Kang, Y.K.; Kim, T.Y.; El-Khoueiry, A.B.; Santoro, A.; Sangro, B.; Melero, I.; Kudo, M.; Hou, M.M.; Matilla, A.; et al. Nivolumab (NIVO) + ipilimumab (IPI) combination therapy in patients (pts) with advanced hepatocellular carcinoma (aHCC): Results from CheckMate 040. J. Clin. Oncol. 2019, 37 (Suppl. 15), 4012. [Google Scholar] [CrossRef]
- Clinicaltrials.gov. NCT02821754. Available online: https://clinicaltrials.gov/ct2/show/NCT02821754 (accessed on 15 May 2020).
- Yau, T.; Zagonel, V.; Santoro, A.; Acosta-Rivera, M.; Choo, S.P.; Matilla, A.; He, A.R.; Gracian, A.C.; El-Khoueiry, A.B.; Sangro, B.; et al. Nivolumab (NIVO) + ipilimumab (IPI) + cabozantinib (CABO) combination therapy in patients (pts) with advanced hepatocellular carcinoma (aHCC): Results from CheckMate 040. J. Clin. Oncol. 2020, 38 (Suppl. 4), 478. [Google Scholar] [CrossRef]
- Cheng, A.L.; Kang, Y.K.; Lin, D.Y.; Park, J.W.; Kudo, M.; Qin, S.; Chung, H.C.; Song, X.; Xu, J.; Poggi, G.; et al. Sunitinib versus sorafenib in advanced hepatocellular cancer: Results of a randomized phase III trial. J. Clin. Oncol. 2013, 31, 4067–4075. [Google Scholar] [CrossRef]
- Vilgrain, V.; Pereira, H.; Assenat, E.; Guiu, B.; Ilonca, A.D.; Pageaux, G.P.; Sibert, A.; Bouattour, M.; Lebtahi, R.; Allaham, W.; et al. Efficacy and safety of selective internal radiotherapy with yttrium-90 resin microspheres compared with sorafenib in locally advanced and inoperable hepatocellular carcinoma (SARAH): An open-label randomised controlled phase 3 trial. Lancet Oncol. 2017, 18, 1624–1636. [Google Scholar] [CrossRef]
- Chow, P.K.H.; Gandhi, M.; Tan, S.B.; Khin, M.W.; Khasbazar, A.; Ong, J.; Choo, S.P.; Cheow, P.C.; Chotipanich, C.; Lim, K.; et al. SIRveNIB: Selective Internal Radiation Therapy Versus Sorafenib in Asia-Pacific Patients With Hepatocellular Carcinoma. J. Clin. Oncol. 2018, 36, 1913–1921. [Google Scholar] [CrossRef] [PubMed]
- Abou-Alfa, G.K.; Shi, Q.; Knox, J.J.; Kaubisch, A.; Niedzwiecki, D.; Posey, J.; Tan, B.R., Jr.; Kavan, P.; Goel, R.; Lammers, P.E.; et al. Assessment of Treatment With Sorafenib Plus Doxorubicin vs Sorafenib Alone in Patients With Advanced Hepatocellular Carcinoma: Phase 3 CALGB 80802 Randomized Clinical Trial. JAMA Oncol. 2019, 5, 1582–1588, Epub ahead of print, Erratum in JAMA Oncol. 10 October 2019. [Google Scholar] [CrossRef] [PubMed]
- Kudo, M.; Ueshima, K.; Yokosuka, O.; Ogasawara, S.; Obi, S.; Izumi, N.; Aikata, H.; Nagano, H.; Hatano, E.; Sasaki, Y.; et al. Sorafenib plus low-dose cisplatin and fluorouracil hepatic arterial infusion chemotherapy versus sorafenib alone in patients with advanced hepatocellular carcinoma (SILIUS): A randomised, open label, phase 3 trial. Lancet Gastroenterol. Hepatol. 2018, 3, 424–432. [Google Scholar] [CrossRef]
- Hsu, C.; Yang, T.S.; Huo, T.I.; Hsieh, R.K.; Yu, C.W.; Hwang, W.S.; Hsieh, T.Y.; Huang, W.T.; Chao, Y.; Meng, R.; et al. Vandetanib in patients with inoperable hepatocellular carcinoma: A phase II, randomized, double-blind, placebo-controlled study. J. Hepatol. 2012, 56, 1097–1103. [Google Scholar] [CrossRef]
- Abou-Alfa, G.K.; Johnson, P.; Knox, J.J.; Capanu, M.; Davidenko, I.; Lacava, J.; Leung, T.; Gansukh, B.; Saltz, L.B. Doxorubicin plus sorafenib vs doxorubicin alone in patients with advanced hepatocellular carcinoma: A randomized trial. JAMA 2010, 304, 2154–2160. [Google Scholar] [CrossRef] [Green Version]
- Kudo, M.; Finn, R.S.; Qin, S.; Han, K.H.; Ikeda, K.; Piscaglia, F.; Baron, A.; Park, J.W.; Han, G.; Jassem, J.; et al. Lenvatinib versus sorafenib in first-line treatment of patients with unresectable hepatocellular carcinoma: A randomised phase 3 non-inferiority trial. Lancet 2018, 391, 1163–1173. [Google Scholar] [CrossRef] [Green Version]
- Zhu, A.X.; Ancukiewicz, M.; Supko, J.G.; Sahani, D.V.; Blaszkowsky, L.S.; Meyerhardt, J.A.; Abrams, T.A.; McCleary, N.J.; Bhargava, P.; Muzikansky, A.; et al. Efficacy, safety, pharmacokinetics, and biomarkers of cediranib monotherapy in advanced hepatocellular carcinoma: A phase II study. Clin. Cancer Res. 2013, 19, 1557–1566. [Google Scholar] [CrossRef] [Green Version]
- Bruix, J.; Qin, S.; Merle, P.; Granito, A.; Huang, Y.H.; Bodoky, G.; Pracht, M.; Yokosuka, O.; Rosmorduc, O.; Breder, V.; et al. Regorafenib for patients with hepatocellular carcinoma who progressed on sorafenib treatment (RESORCE): A randomised, double-blind, placebo-controlled, phase 3 trial. Lancet 2017, 389, 56–66. [Google Scholar] [CrossRef] [Green Version]
- Abou-Alfa, G.K.; Meyer, T.; Cheng, A.L.; El-Khoueiry, A.B.; Rimassa, L.; Ryoo, B.Y.; Cicin, I.; Merle, P.; Chen, Y.H.; Park, J.W.; et al. Cabozantinib in patients with advanced and progressing hepatocellular carcinoma. N. Engl. J. Med. 2018, 379, 54–63. [Google Scholar] [CrossRef]
- Zhu, A.X.; Park, J.O.; Ryoo, B.Y.; Yen, C.J.; Poon, R.; Pastorelli, D.; Blanc, J.F.; Chung, H.C.; Baron, A.D.; Pfiffer, T.E.F.; et al. Ramucirumab versus placebo as second-line treatment in patients with advanced hepatocellular carcinoma following first-line therapy with sorafenib (REACH): A randomised, double-blind, multicentre, phase 3 trial. Lancet Oncol. 2015, 16, 859–870. [Google Scholar] [CrossRef]
- Zhu, A.X.; Kang, Y.K.; Yen, C.J.; Finn, R.S.; Galle, P.R.; Llovet, J.M.; Assenat, E.; Brandi, G.; Pracht, M.; Lim, H.Y.; et al. Ramucirumab after sorafenib in patients with advanced hepatocellular carcinoma and increased α-fetoprotein concentrations (REACH-2): A randomised, double-blind, placebo-controlled, phase 3 trial. Lancet Oncol. 2019, 20, 282–296. [Google Scholar] [CrossRef]
- Rimassa, L.; Assenat, E.; Peck-Radosavljevic, M.; Pracht, M.; Zagonel, V.; Mathurin, P.; Rota Caremoli, E.; Porta, C.; Daniele, B.; Bolondi, L.; et al. Tivantinib for second-line treatment of MET-high, advanced hepatocellular carcinoma (METIV-HCC): A final analysis of a phase 3, randomised, placebo-controlled study. Lancet Oncol. 2018, 19, 682–693. [Google Scholar] [CrossRef]
- Abou-Alfa, G.K.; Qin, S.; Ryoo, B.Y.; Lu, S.N.; Yen, C.J.; Feng, Y.H.; Lim, H.Y.; Izzo, F.; Colombo, M.; Sarker, D.; et al. Phase III randomized study of second line ADI-PEG 20 plus best supportive care versus placebo plus best supportive care in patients with advanced hepatocellular carcinoma. Ann. Oncol. 2018, 29, 1402–1408. [Google Scholar] [CrossRef]
- Kang, Y.K.; Yau, T.; Park, J.W.; Lim, H.Y.; Lee, T.Y.; Obi, S.; Chan, S.L.; Qin, S.; Kim, R.D.; Casey, M.; et al. Randomized phase II study of axitinib versus placebo plus best supportive care in second-line treatment of advanced hepatocellular carcinoma. Ann. Oncol. 2015, 26, 2457–2463. [Google Scholar] [CrossRef]
- Escudier, B.; Faivre, S.; Van Cutsem, E.; Germann, N.; Pouget, J.C.; Plummer, R.; Vergote, I.; Thistlethwaite, F.; Bjarnason, G.A.; Jones, R.; et al. A Phase II Multicentre, Open-Label, Proof-of-Concept Study of Tasquinimod in Hepatocellular, Ovarian, Renal Cell, and Gastric Cancers. Target Oncol. 2017, 12, 655–661. [Google Scholar] [CrossRef]
- Abou-Alfa, G.K.; Puig, O.; Daniele, B.; Kudo, M.; Merle, P.; Park, J.W.; Ross, P.; Peron, J.M.; Ebert, O.; Chan, S.; et al. Randomized phase II placebo controlled study of codrituzumab in previously treated patients with advanced hepatocellular carcinoma. J. Hepatol. 2016, 65, 289–295. [Google Scholar] [CrossRef]
- Cabibbo, G.; Celsa, C.; Enea, M.; Battaglia, S.; Rizzo, G.E.M.; Grimaudo, S.; Matranga, D.; Attanasio, M.; Bruzzi, P.; Craxì, A.; et al. Optimizing Sequential Systemic Therapies for Advanced Hepatocellular Carcinoma: A Decision Analysis. Cancers 2020, 12, 2132. [Google Scholar] [CrossRef]
- Mulkey, F.; Theoret, M.R.; Keegan, P.; Pazdur, R.; Sridhara, R. Comparison of iRECIST versus RECIST V.1.1 in patients treated with an anti-PD-1 or PD-L1 antibody: Pooled FDA analysis. J. ImmunoTher. Cancer 2020, 8, e000146. [Google Scholar] [CrossRef] [Green Version]
- Ferrara, R.; Pilotto, S.; Caccese, M.; Grizzi, G.; Sperduti, I.; Giannarelli, D.; Milella, M.; Besse, B.; Tortora, G.; Bria, E. Do immune checkpoint inhibitors need new studies methodology? J. Thorac. Dis. 2018, 10 (Suppl. 13), S1564–S1580. [Google Scholar] [CrossRef]
- Hernán, M.A. The hazards of hazard ratios [published correction appears in Epidemiology. 2011 Jan;22(1):134]. Epidemiology 2010, 21, 13–15. [Google Scholar] [CrossRef] [PubMed] [Green Version]
- Royston, P.; Parmar, M.K. Restricted mean survival time: An alternative to the hazard ratio for the design and analysis of randomized trials with a time-to-event outcome. BMC Med. Res. Methodol. 2013, 13, 152. [Google Scholar] [CrossRef] [PubMed] [Green Version]
- Pak, K.; Uno, H.; Kim, D.H.; Tian, L.; Kane, R.C.; Takeuchi, M.; Fu, H.; Claggett, B.; Wei, L.J. Interpretability of Cancer Clinical Trial Results Using Restricted Mean Survival Time as an Alternative to the Hazard Ratio. JAMA Oncol. 2017, 3, 1692–1696. [Google Scholar] [CrossRef] [PubMed]
- Sharma, P.; Allison, J.P. Immune checkpoint targeting in cancer therapy: Toward combination strategies with curative potential. Cell 2015, 161, 205–214. [Google Scholar] [CrossRef] [Green Version]
- Cabibbo, G.; Petta, S.; Barbara, M.; Attardo, S.; Bucci, L.; Farinati, F.; Giannini, E.G.; Negrini, G.; Ciccarese, F.; Rapaccini, G.L.; et al. Hepatic decompensation is the major driver of death in HCV-infected cirrhotic patients with successfully treated early hepatocellular carcinoma. J. Hepatol. 2017, 67, 65–71. [Google Scholar] [CrossRef]
- Mitchell, M.; Muftakhidinov, B.; Winchen, T. Engauge Digitizer Software. Available online: http://markummitchell.github.io/engauge-digitizer (accessed on 22 April 2020).
- Guyot, P.; Ades, A.E.; Ouwens, M.J.; Welton, N.J. Enhanced secondary analysis of survival data: Reconstructing the data from published Kaplan-Meier survival curves. BMC Med. Res. Methodol. 2012, 12, 9. [Google Scholar] [CrossRef] [Green Version]
- Combescure, C.; Foucher, Y.; Jackson, D. Meta-analysis of single-arm survival studies: A distribution-free approach for estimating summary survival curves with random effects. Stat. Med. 2014, 33, 2521–2537. [Google Scholar] [CrossRef]
- Earle, C.C.; Pham, B.; Wells, G.A. An assessment of methods to combine published survival curves. Med. Decis. Making 2000, 20, 104–111. [Google Scholar] [CrossRef]
- DerSimonian, R.; Laird, N. Meta-analysis in clinical trials. Control Clin. Trials 1986, 7, 177–188. [Google Scholar] [CrossRef]
- Uno H: Vignette for survRM2 Package: Comparing Two Survival Curves Using the Restricted Mean Survival Time. Available online: https://cran.r-project.org/web/packages/survRM2/vignettes/survRM2-vignette3-1.pdf (accessed on 15 May 2020).
- Klein, J.P.; Moeschberger, M.L. Survival Analysis: Techniques for Censored and Truncated Data, 2nd ed.; Springer: New York, NY, USA, 2003; Volume 9, pp. 302–308. [Google Scholar]
- Sterne, J.A.; Jüni, P.; Schulz, K.F.; Altman, D.G.; Bartlett, C.; Egger, M. Statistical methods for assessing the influence of study characteristics on treatment effects in ‘meta-epidemiological’ research. Stat. Med. 2002, 21, 1513–1524. [Google Scholar] [CrossRef]


| Trial | Line of Treatment | Arms | Overall Survival | Progression-Free Survival | Objective Response Rate (%) | Time to First Radiological Assessment | Duration of Follow-Up (Months) | Reference | |||||||
| 1st Quartile (Months) | Median (Months) | 3rd Quartile (Months) | HR (95% CI) | 1st Quartile (Months) | Median (Months) | 3rd Quartile (Months) | HR (95% CI) | ||||||||
| Immune-checkpoint Inhibitors Alone Or In Combination | KEYNOTE-240, 2019 (phase III, full text) | Second-line | Pembrolizumab (n = 278) | 6.15 | 13.9 | 24 | 0.781 (0.611–0.998) | 1.46 | 3.0 | 8.45 | 0.718 0.570–0.904) | 18.3 | 6 weeks | 28 | [12] |
| Placebo (n = 135) | - | 10.6 | - | - | 2.8 | - | 4.4 | ||||||||
| KEYNOTE-224, 2018 (phase II, full text) | Second-line | Pembrolizumab (n = 104) | 7.25 | 12.9 | 16.1 | - | 2.12 | 4.9 | 12.5 | - | 17.3 | 9 weeks | 19 | [13] | |
| CheckMate 040, 2017 (phase I/II, full text) | Second-line | Nivolumab (n = 182) | - | 15.1 | - | - | - | 4.0 | - | - | 14.3 | - | 57 | [14] | |
| Qin et al., 2020 (phase II, full text) | Second-line | Camrelizumab (n = 217) | 6.45 | 13.8 | 16.9 | - | 1.88 | 2.1 | 6.1 | - | 14.7 | 8 weeks | 22 | [15] | |
| Sangro et al., 2013 (phase II, full text)° | Both first- and second-line | Tremelimumab (n = 21) | 6 | 8.2 | 21.6 | - | - | NA | - | 17.6 | 12 weeks | 25 | [16] | ||
| CheckMate 459, 2019 (phase III abstract) | First-line | Nivolumab (n = 371) | 6.35 | 16.4 | 36.3 | 0.85 (0.72–1.02) | 1.98 | 3.7 | 9.90 | 0.93 (0.79–1.10) | 15.4 | - | 39 | [17] | |
| Sorafenib (n = 372) | 6.0 | 14.7 | 27.3 | 1.95 | 3.8 | 7.65 | 7.0 | 37 | |||||||
| NCT01693562, 2017 (phase I/II, abstract) | Second-line | Durvalumab (n = 39) | - | 13.2 | - | - | - | NA | - | - | 10.3 | - | - | [18] | |
| CheckMate 040, 2019 (phase I/II, abstract) | Second-line | Nivolumab plus Ipilimumab * Arm A: n = 50 | - | Arm A: 23 | - | - | - | NA | - | - | Arm A: 32 | - | |||
| Arm B: n = 49 | - | Arm B: 12 | - | - | - | ArmB:30.6 | 37 | [19] | |||||||
| Arm C: n = 49 | - | Arm C: 13 | - | - | - | Arm C: 30.6 | |||||||||
| NCT02821754, 2019 (phase I/II, abstract) | Second-line | Tremelimumab plus Durvalumab (n = 10) | - | 15.9 | - | - | - | 7.8 | - | - | 20 | - | - | [20] | |
| Immune-checkpoint inhibitors in combination with multikinase inhibitors | CheckMate 040, 2020 (phase I/II, abstract) | Both first- (n = 12) and second-line (n = 19) | Nivolumab plus Ipilimumab plus Cabozantinib (n = 35) | 9 | 24 | NR | - | 3.4 | 6.8 | NR | - | 31 | - | 24 | [21] |
| Both first- (n = 12) and second-line (n = 23) | Nivolumab plus Cabozantinib (n = 36) | 8.7 | 21.5 | NR | - | 2.73 | 5.4 | 12.5 | - | 14 | |||||
| IMbrave 150, 2019 (phase III, published) | First-line | Atezolizumab plus Bevacizumab (n = 336) | 7.87 | NR | NR | 0.58(0.42–0.79) | 2.9 | 6.8 | 13.5 | 0.59 (0.47–0.76) | 26.5 | 6 weeks | 17 | [2] | |
| Sorafenib (n = 165) | 3.5 | 13.2 | - | 1.17 | 4.3 | 7.3 | 11.9 | ||||||||
| Class of Drug | Trial Arm | 6-Month Restricted Mean Survival Time | 12-Month Restricted Mean Survival Time | ||
|---|---|---|---|---|---|
| Progression-Free Survival (Months) (95% Confidence Interval) | Overall Survival (Months) (95% Confidence Interval) | Progression-Free Survival (Months) (95% Confidence Interval) | Overall Survival (Months) (95% Confidence Interval) | ||
| Immune-checkpoint inhibitors | IMBrave-150 (Atezolizumab plus Bevacizumab arm) [2] | 4.67 (4.46–4.86) | 5.62 (5.50–5.73) | 7.11 (6.65–7.58) | 9.95 (9.60–10.31) |
| CheckMate 459 (Nivolumab arm) [17] | 3.85 (3.35–4.04) | 5.42 (5.28–5.56) | 5.47 (5.03–5.9) | 9.50 (9.12–9.87) | |
| Keynote-240 (Pembrolizumab arm) [12] | 3.65 (3.40–3.89) | 5.37 (5.22–5.52) | 5.19 (4.68–5.70) | 9.23 (8.79–9.66) | |
| Keynote-224 (Pembrolizumab arm) [13] | 4.23 (3.87–4.59) | 5.44 (5.19–5.69) | 6.21 (5.41–7.02) | 9.38 (8.70–10.05) | |
| Qin et al., 2020 (Camrelizumab arm) [15] | 3.32 (3.07–3.57) | 5.35 (5.16–5.23) | 4.51 (3.99–5.04) | 9.29 (8.79–9.79) | |
| CheckMate 040 (Nivolumab plus Cabozantinib plus Ipilimumab arm) [21] | 4.72 (4.13–5.32) | 5.37 (4.84–5.89) | 7.17 (5.77–8.57) | 9.76 (8.38–11.41) | |
| CheckMate 040 (Nivolumab plus Cabozantinib arm) [21] | 4.44 (3.84–5.03) | 5.62 (5.31–5.93) | 6.6 (5.2–8) | 10.13 (9.02–11.24) | |
| Pooled immune-checkpoint inhibitors | 3.99 (3.88–4.09) | 5.45 (5.38–5.52) | 5.79 (5.56–6.02) | 9.53 (9.34–9.72) | |
| Multikinase inhibitors | SUN1170 (Sorafenib arm) [22] | 3.52 (3.35–3.69) | 4.81 (4.56–5.07) | 4.61 (4.28–7.93) | 7.08 (6.44–7.71) |
| SUN1170 (Sunitinib arm) [22] | 3.68 (3.53–3.84) | 5.00 (4.87–5.13) | 4.54 (4.26–4.82) | 7.76 (7.42–8.09) | |
| SARAH (Sorafenib arm) [23] | 3.91 (3.65–4.18) | 5.21 (5.01–5.4) | 5.22 (4.71–5.72) | 8.54 (8.02–9.06) | |
| SIRVENIB (Sorafenib arm) [24] | 4.48 (4.25–4.72) | 5.28 (5.06–5.49) | 6.16 (5.59–6.72) | 8.63 (8.05–9.21) | |
| CALGB80802 (Sorafenib arm) [25] | 3.68 (3.39–3.97) | 5.00 (4.70–5.24) | 4.75 (4.20–5.30) | 8.03 (7.44–8.63) | |
| SILIUS (Sorafenib arm) [26] | 3.71 (3.35–4.07) | 5.5 (5.39–5.59) | 4.68 (4.00–5.36) | 9.25 (8.93–9.56) | |
| Hsu et al., 2012 (Vandetanib arms) [27] | 2.19 (1.4–2.97) | 4.86 (4.17–5.56) | NA | NA | |
| Abou-Alfa et al., 2010 (Sorafenib plus Doxorubicin arm) [28] | 4.38 (3.79–4.98) | 5.15 (4.66–5.63) | 6.05 (4.85–7.25) | 8.8 (7.6–10.00) | |
| REFLECT (Sorafenib arm) [29] | 3.96 (3.77–4.14) | 5.43 (5.32–5.54) | 5.43 (5.05–5.81) | 9.04 (8.71–9.36) | |
| REFLECT (Lenvatinib arm) [29] | 4.85 (4.67–5.00) | 5.54 (5.43–5.64) | 7.78 (7.38–8.16) | 9.29 (9.6–9.91) | |
| IMBrave-150 (Sorafenib arm) [2] | 3.96 (3.64–4.28) | 5.25 (5.13–5.37) | 5.28 (4.65–5.91) | 8.56 (8.23–8.89) | |
| CheckMate 459 (Sorafenib arm) [17] | 4.02 (3.83–4.21) | 5.40 (5.27–5.54) | 5.35 (4.96–5.74) | 9.25 (8.87–9.63) | |
| Zhu et al., 2013 (Cediranib arm) [30] | 4.29 (3.39–5.19) | 5.15 (4.30–6.00) | 5.92 (4.12–7.72) | 8.50 (6.51–10.50) | |
| RESORCE (Regorafenib arm) [31] | 3.71 (3.51–3.91) | 5.22 (5.08–5.36) | 4.89 (4.49–5.29) | 8.63 (8.23–9.03) | |
| CELESTIAL (Cabozantinib arm) [32] | 4.19 (4.01–4.36) | 5.30 (5.16–5.44) | 5.29 (5.66–6.03) | 8.76 (8.39–9.12) | |
| REACH (Ramucirumab arm) [33] | 3.31 (2.00–3.61) | 5.17 (4.97–5.37) | 4.39 (3.84–4.94) | 8.18 (7.64–8.72) | |
| REACH-2 (Ramucirumab arm) [34] | 3.54 (3.30–3.79) | 5.26 (5.09–5.42) | 4.82 (4.35–5.29) | 8.55 (8.09–9.01) | |
| METIV-HCC (Tivantinib arm) [35] | 3.08 (2.62–3.15) | 4.99 (4.79–5.19) | 3.62 (3.25–3.99) | 7.86 (7.34–8.38) | |
| ADI-PEG20 (ADI-PEG20 arm) [36] | 3.19 (3.01–3.37) | 4.47 (4.29–4.65) | 3.69 (3.40–3.98) | 6.75 (6.34–7.16) | |
| Kang et al., 2015 (Axitinib arm) [37] | 3.75 (3.41–4.09) | 5.37 (4.84–5.89) | 4.98 (4.32–5.62) | 9.19 (8.56–9.82) | |
| Escudier et al., 2017 (Tasquinimod arm) [38] | 3.73 (3.20–4.27) | 5.30 (4.88–5.72) | 4.65 (3.69–5.61) | 7.89 (6.89–8.89) | |
| Abou-Alfa et al., 2016 (Codrituzumab arm) [39] | 3.02 (2.68–3.36) | 4.97 (4.68–5.26) | 3.52 (2.97–4.07) | 7.62 (6.96–8.29) | |
| Pooled multikinase inhibitors | 3.86 (3.80–3.90) | 5.26 (5.22–5.30) | 5.19 (5.08–5.30) | 8.63 (8.53–8.73) | |
Publisher’s Note: MDPI stays neutral with regard to jurisdictional claims in published maps and institutional affiliations. |
© 2020 by the authors. Licensee MDPI, Basel, Switzerland. This article is an open access article distributed under the terms and conditions of the Creative Commons Attribution (CC BY) license (http://creativecommons.org/licenses/by/4.0/).
Share and Cite
Cabibbo, G.; Celsa, C.; Enea, M.; Battaglia, S.; Rizzo, G.E.M.; Busacca, A.; Matranga, D.; Attanasio, M.; Reig, M.; Craxì, A.; et al. Progression-Free Survival Early Assessment Is a Robust Surrogate Endpoint of Overall Survival in Immunotherapy Trials of Hepatocellular Carcinoma. Cancers 2021, 13, 90. https://doi.org/10.3390/cancers13010090
Cabibbo G, Celsa C, Enea M, Battaglia S, Rizzo GEM, Busacca A, Matranga D, Attanasio M, Reig M, Craxì A, et al. Progression-Free Survival Early Assessment Is a Robust Surrogate Endpoint of Overall Survival in Immunotherapy Trials of Hepatocellular Carcinoma. Cancers. 2021; 13(1):90. https://doi.org/10.3390/cancers13010090
Chicago/Turabian StyleCabibbo, Giuseppe, Ciro Celsa, Marco Enea, Salvatore Battaglia, Giacomo Emanuele Maria Rizzo, Anita Busacca, Domenica Matranga, Massimo Attanasio, Maria Reig, Antonio Craxì, and et al. 2021. "Progression-Free Survival Early Assessment Is a Robust Surrogate Endpoint of Overall Survival in Immunotherapy Trials of Hepatocellular Carcinoma" Cancers 13, no. 1: 90. https://doi.org/10.3390/cancers13010090