A Comprehensive Molecular and Clinical Analysis of the piRNA Pathway Genes in Ovarian Cancer

 , , and
Abstract
:Simple Summary
Abstract
1. Introduction
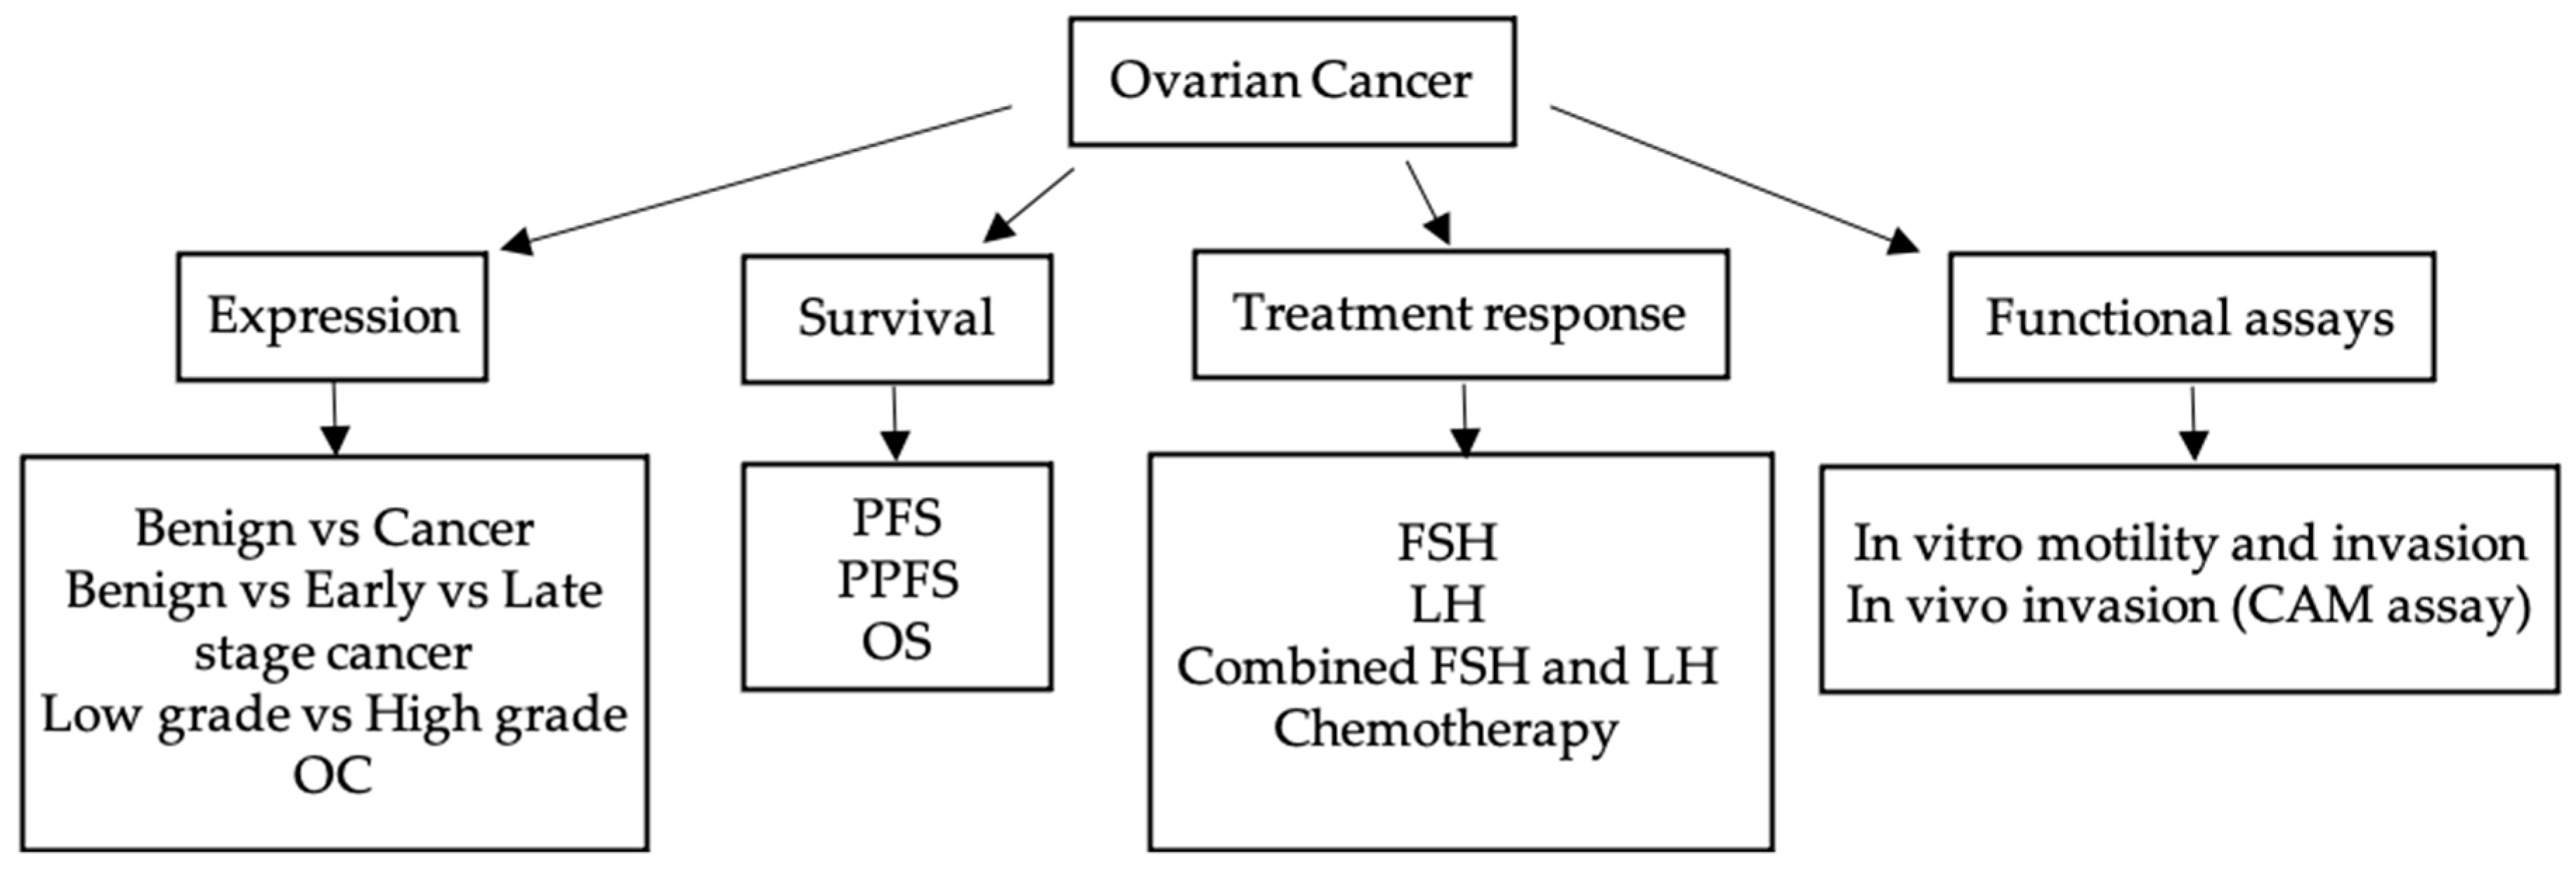
2. Results
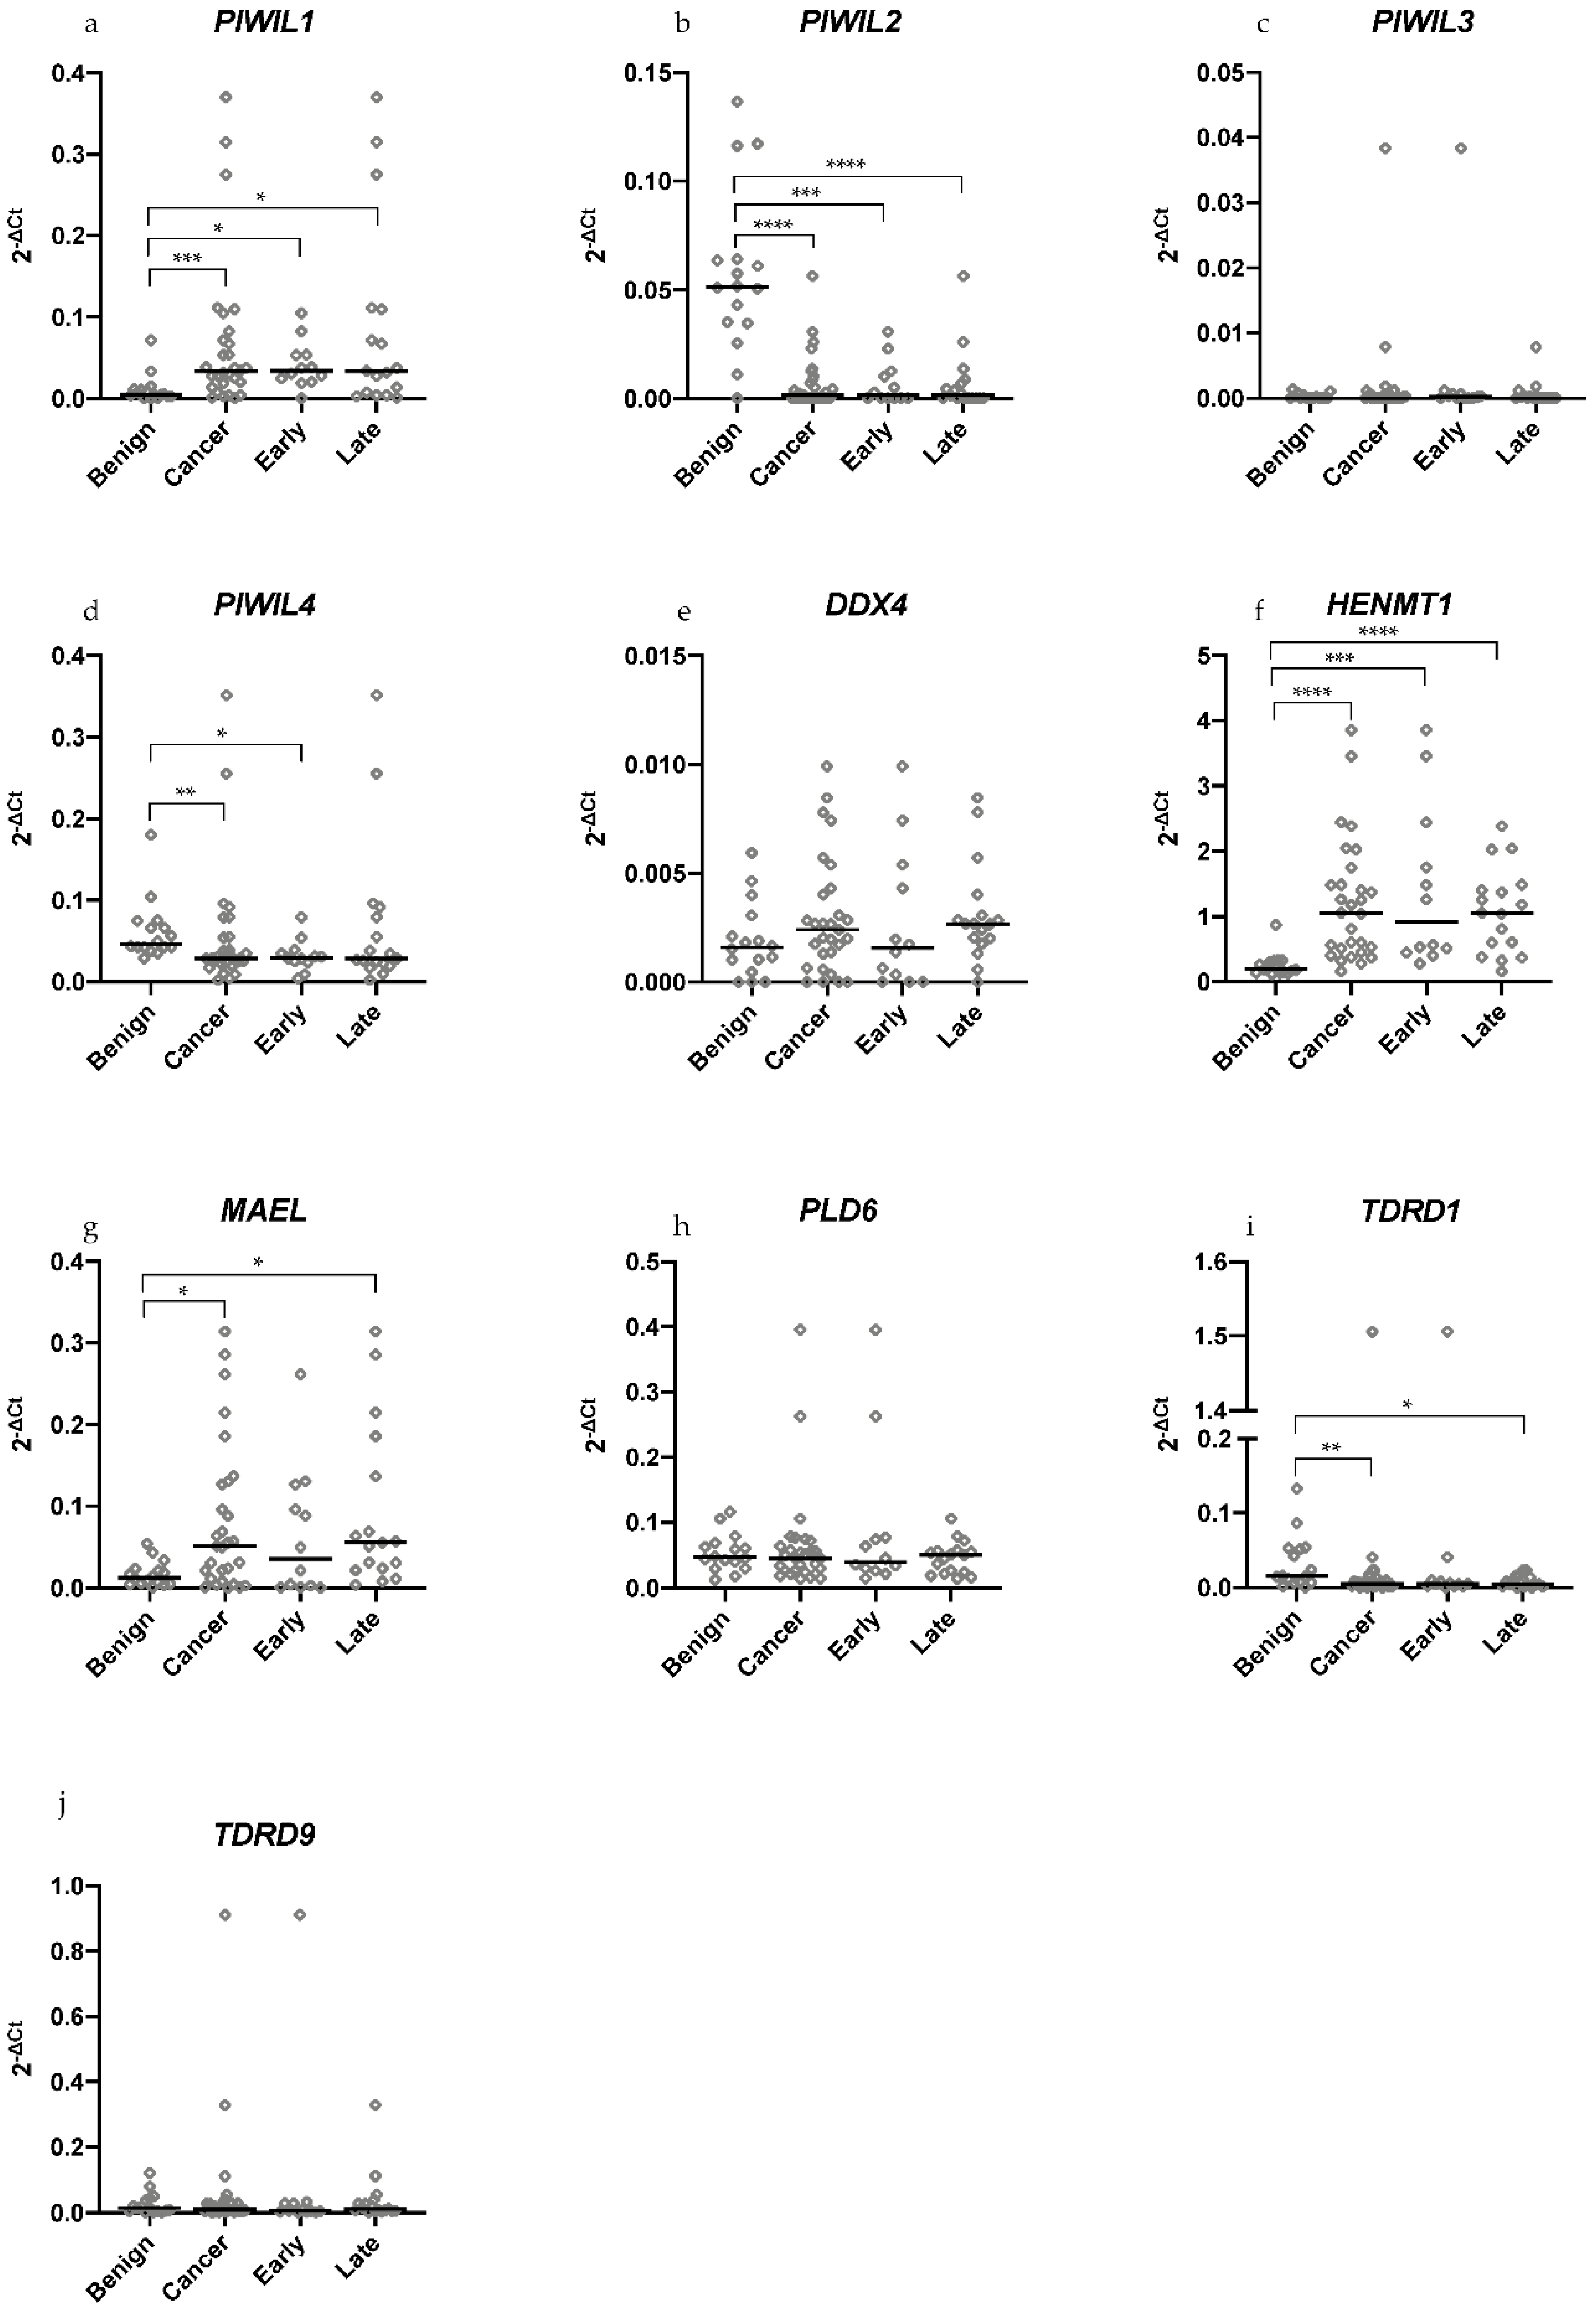
2.1. Differential Expression of piRNA Pathway Genes Occurs between Benign and Malignant HGSOC Tissue Samples
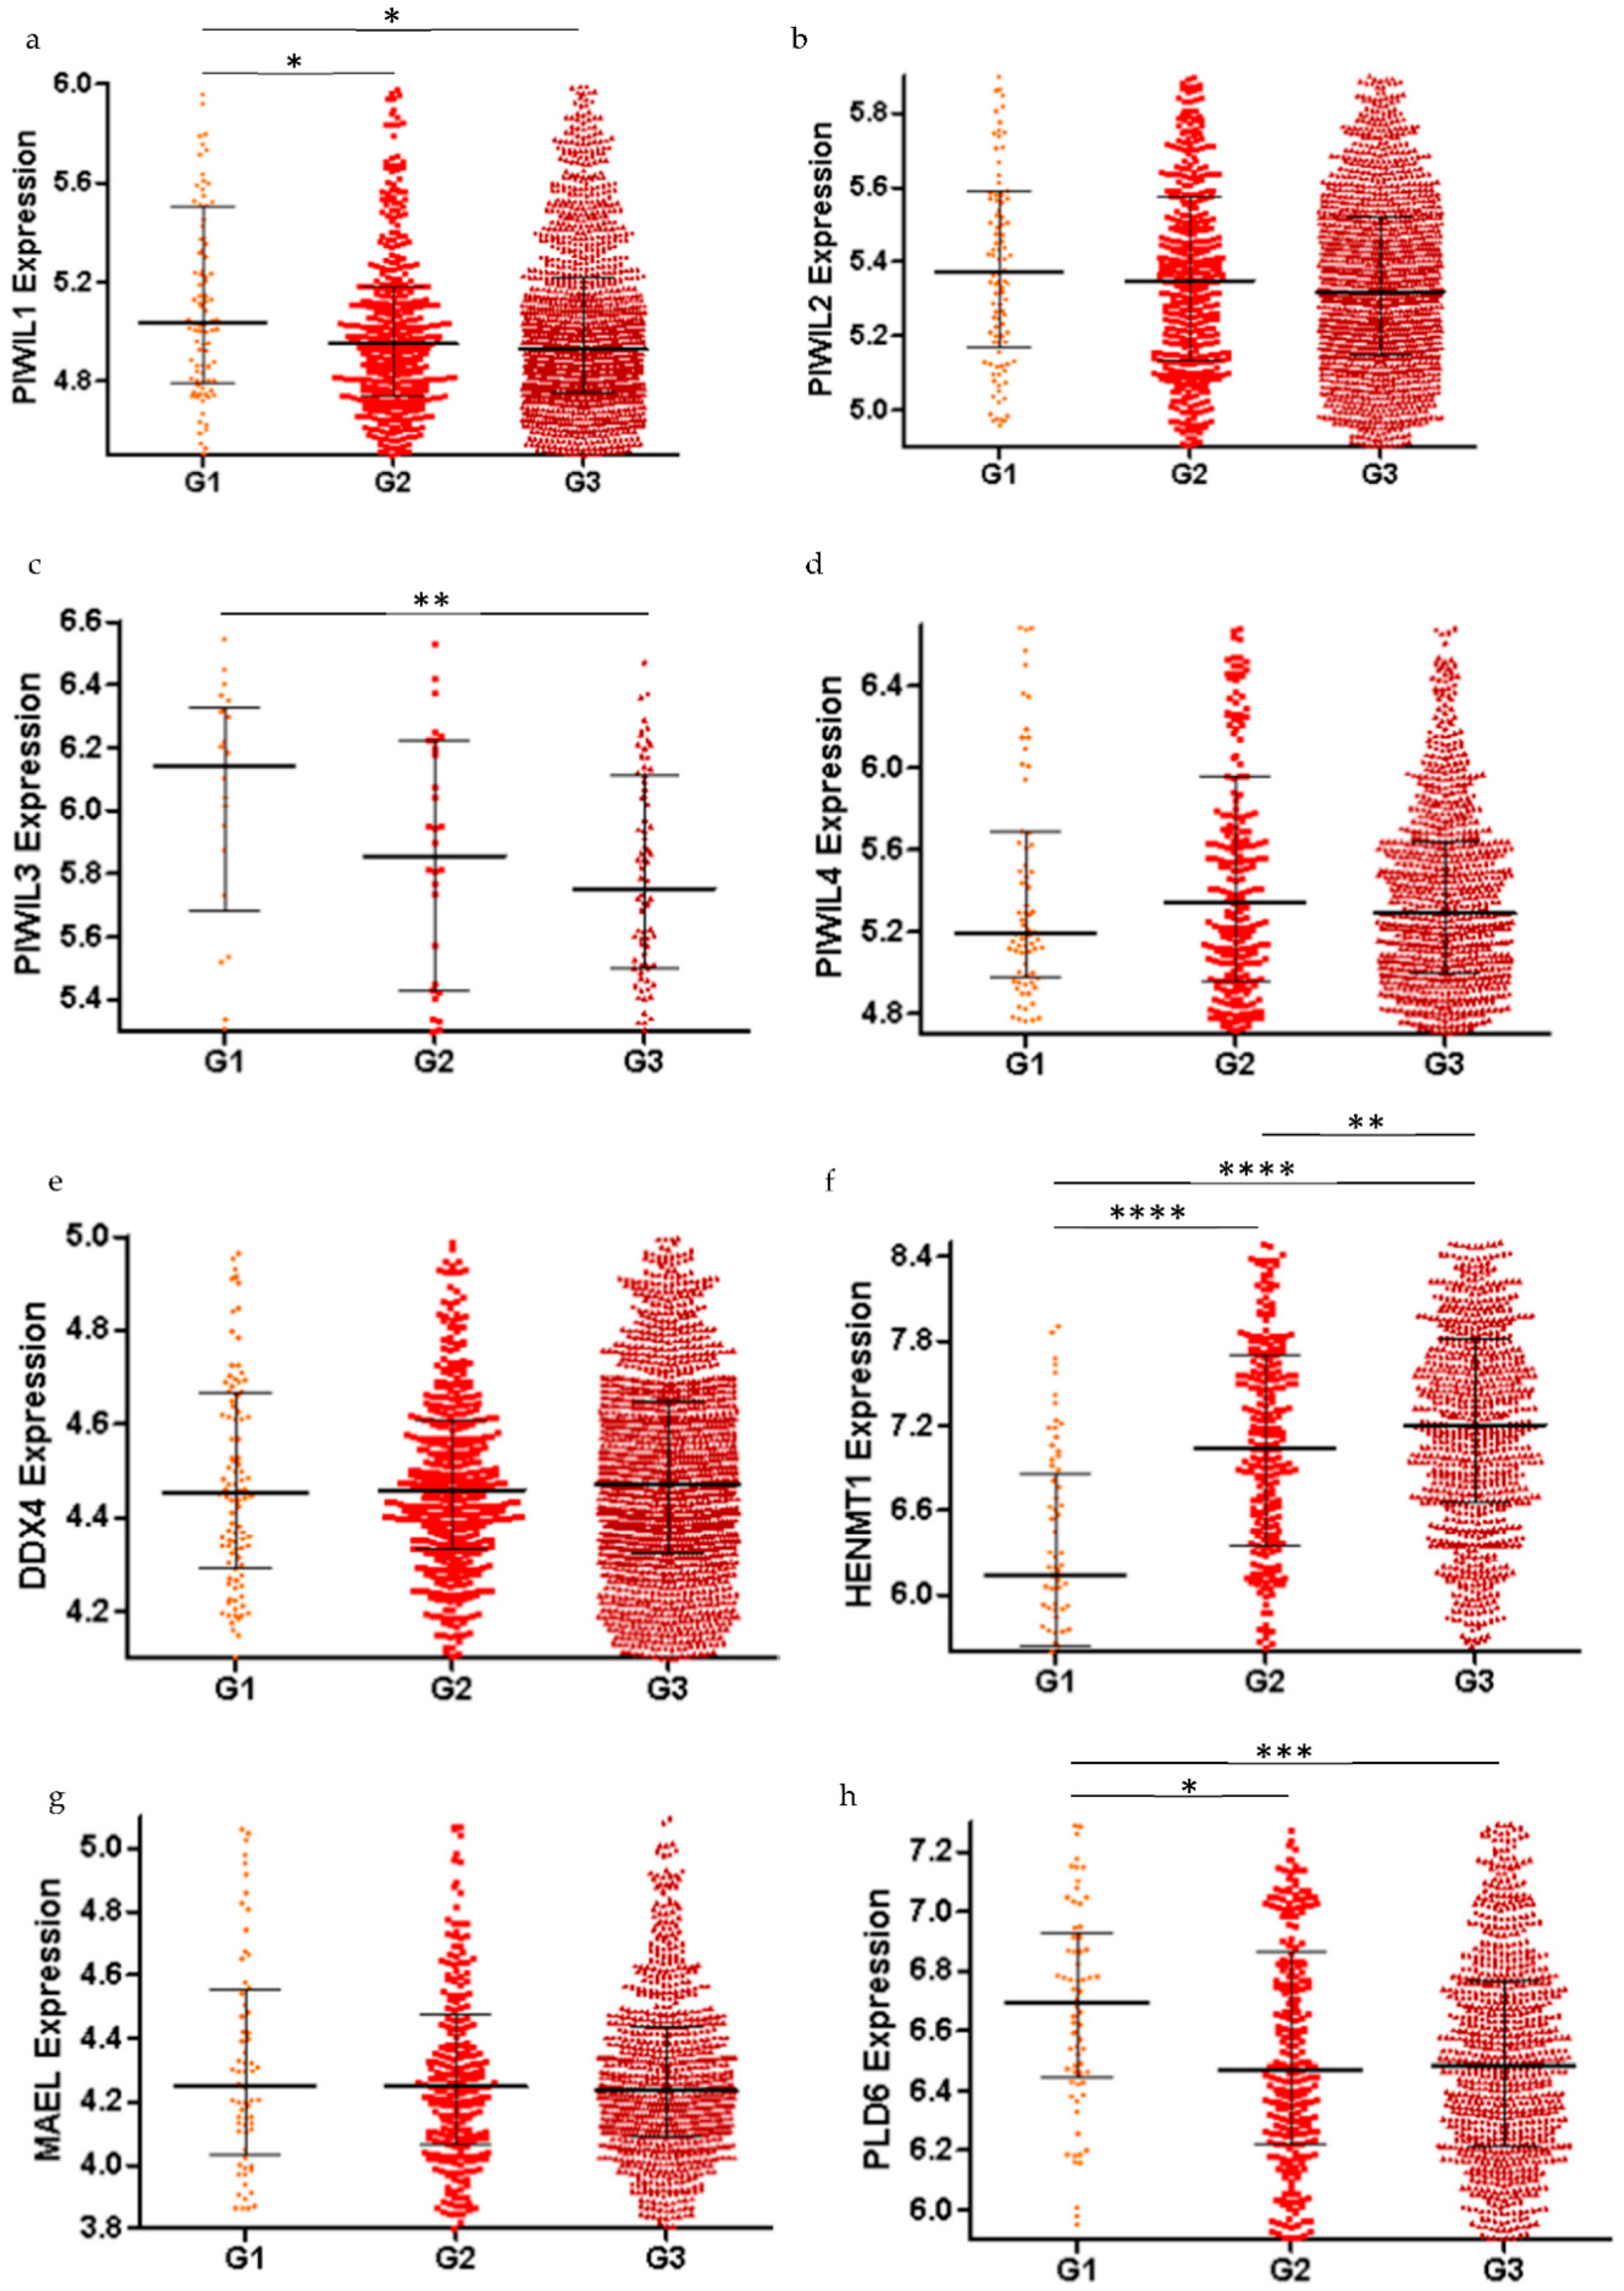
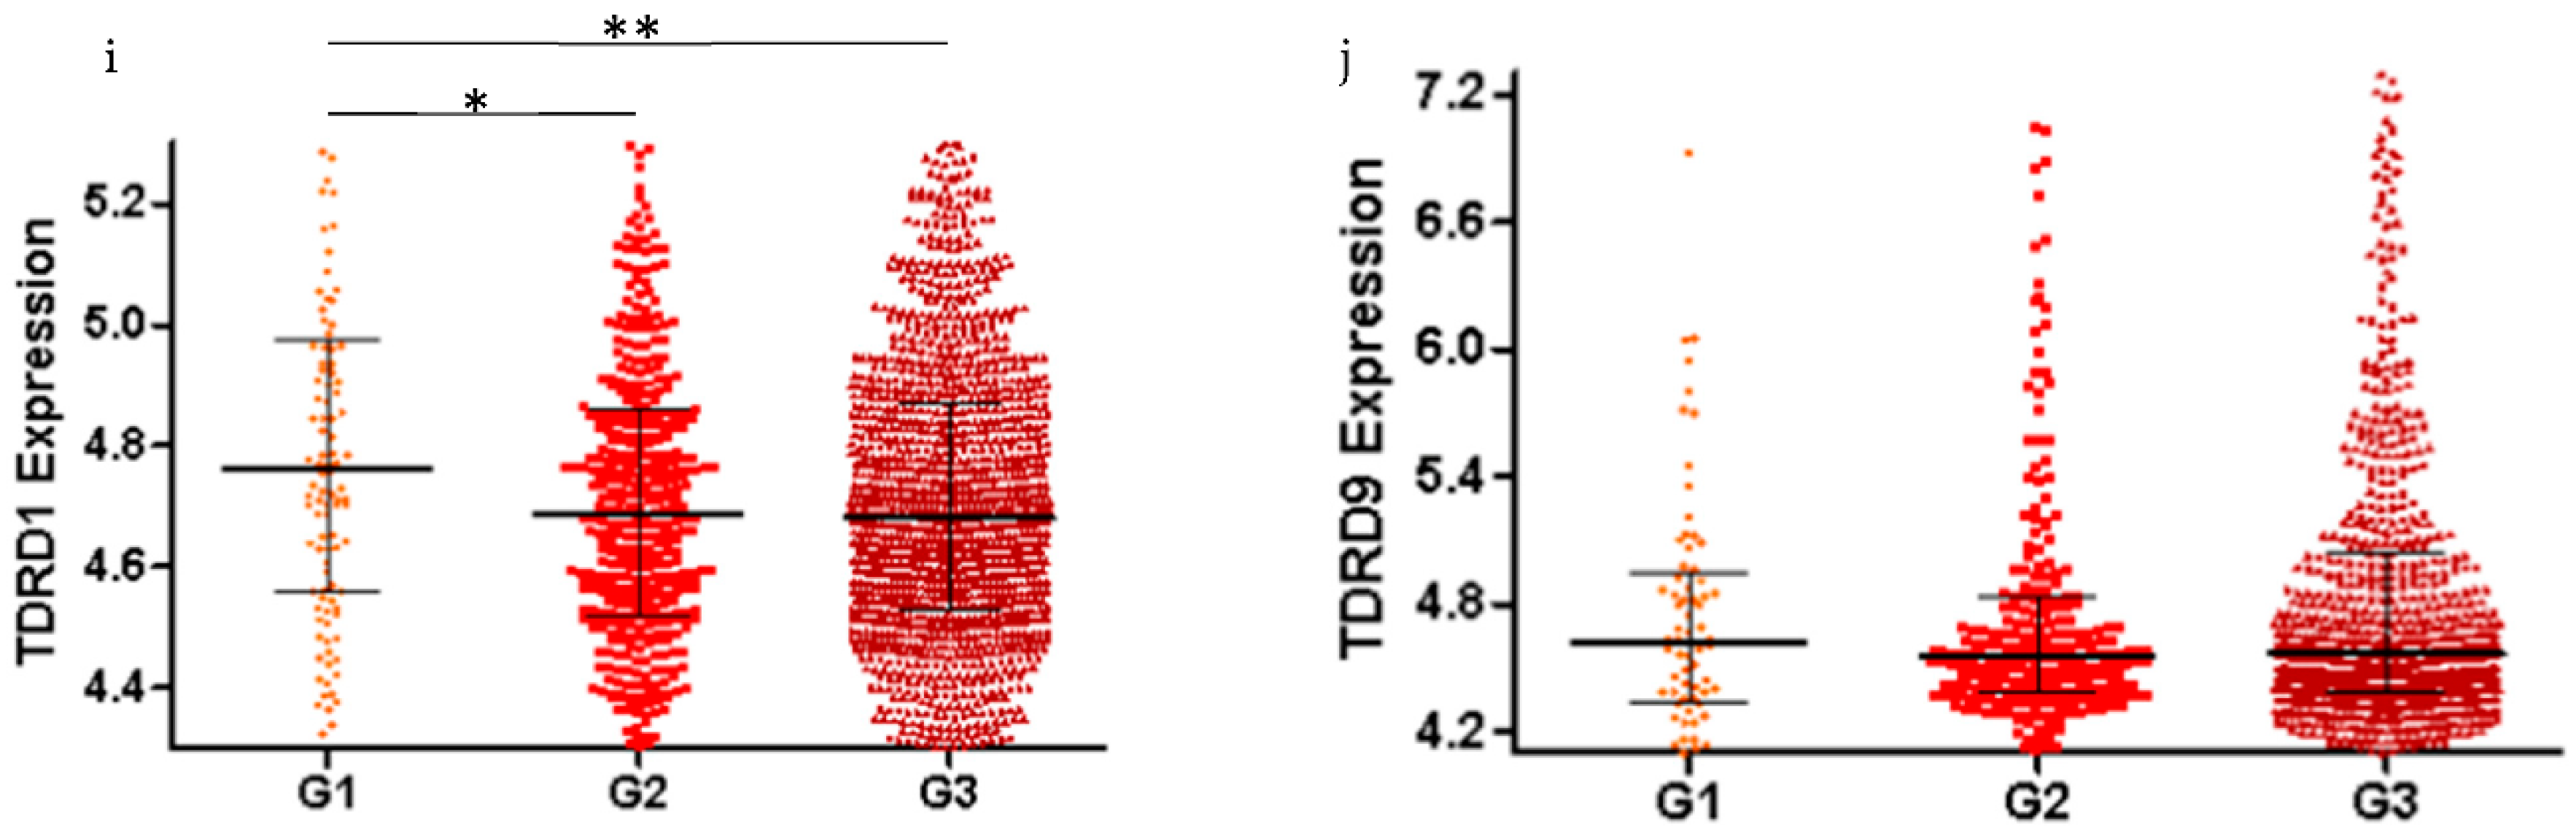
2.2. piRNA Pathway Genes are Differentially Expressed in Low Grade and High Grade Ovarian Cancer (All Subtypes)
2.3. The Level of piRNA Pathway Gene Expression Is Associated with HGSOC Patient Overall and Progression Free Survival
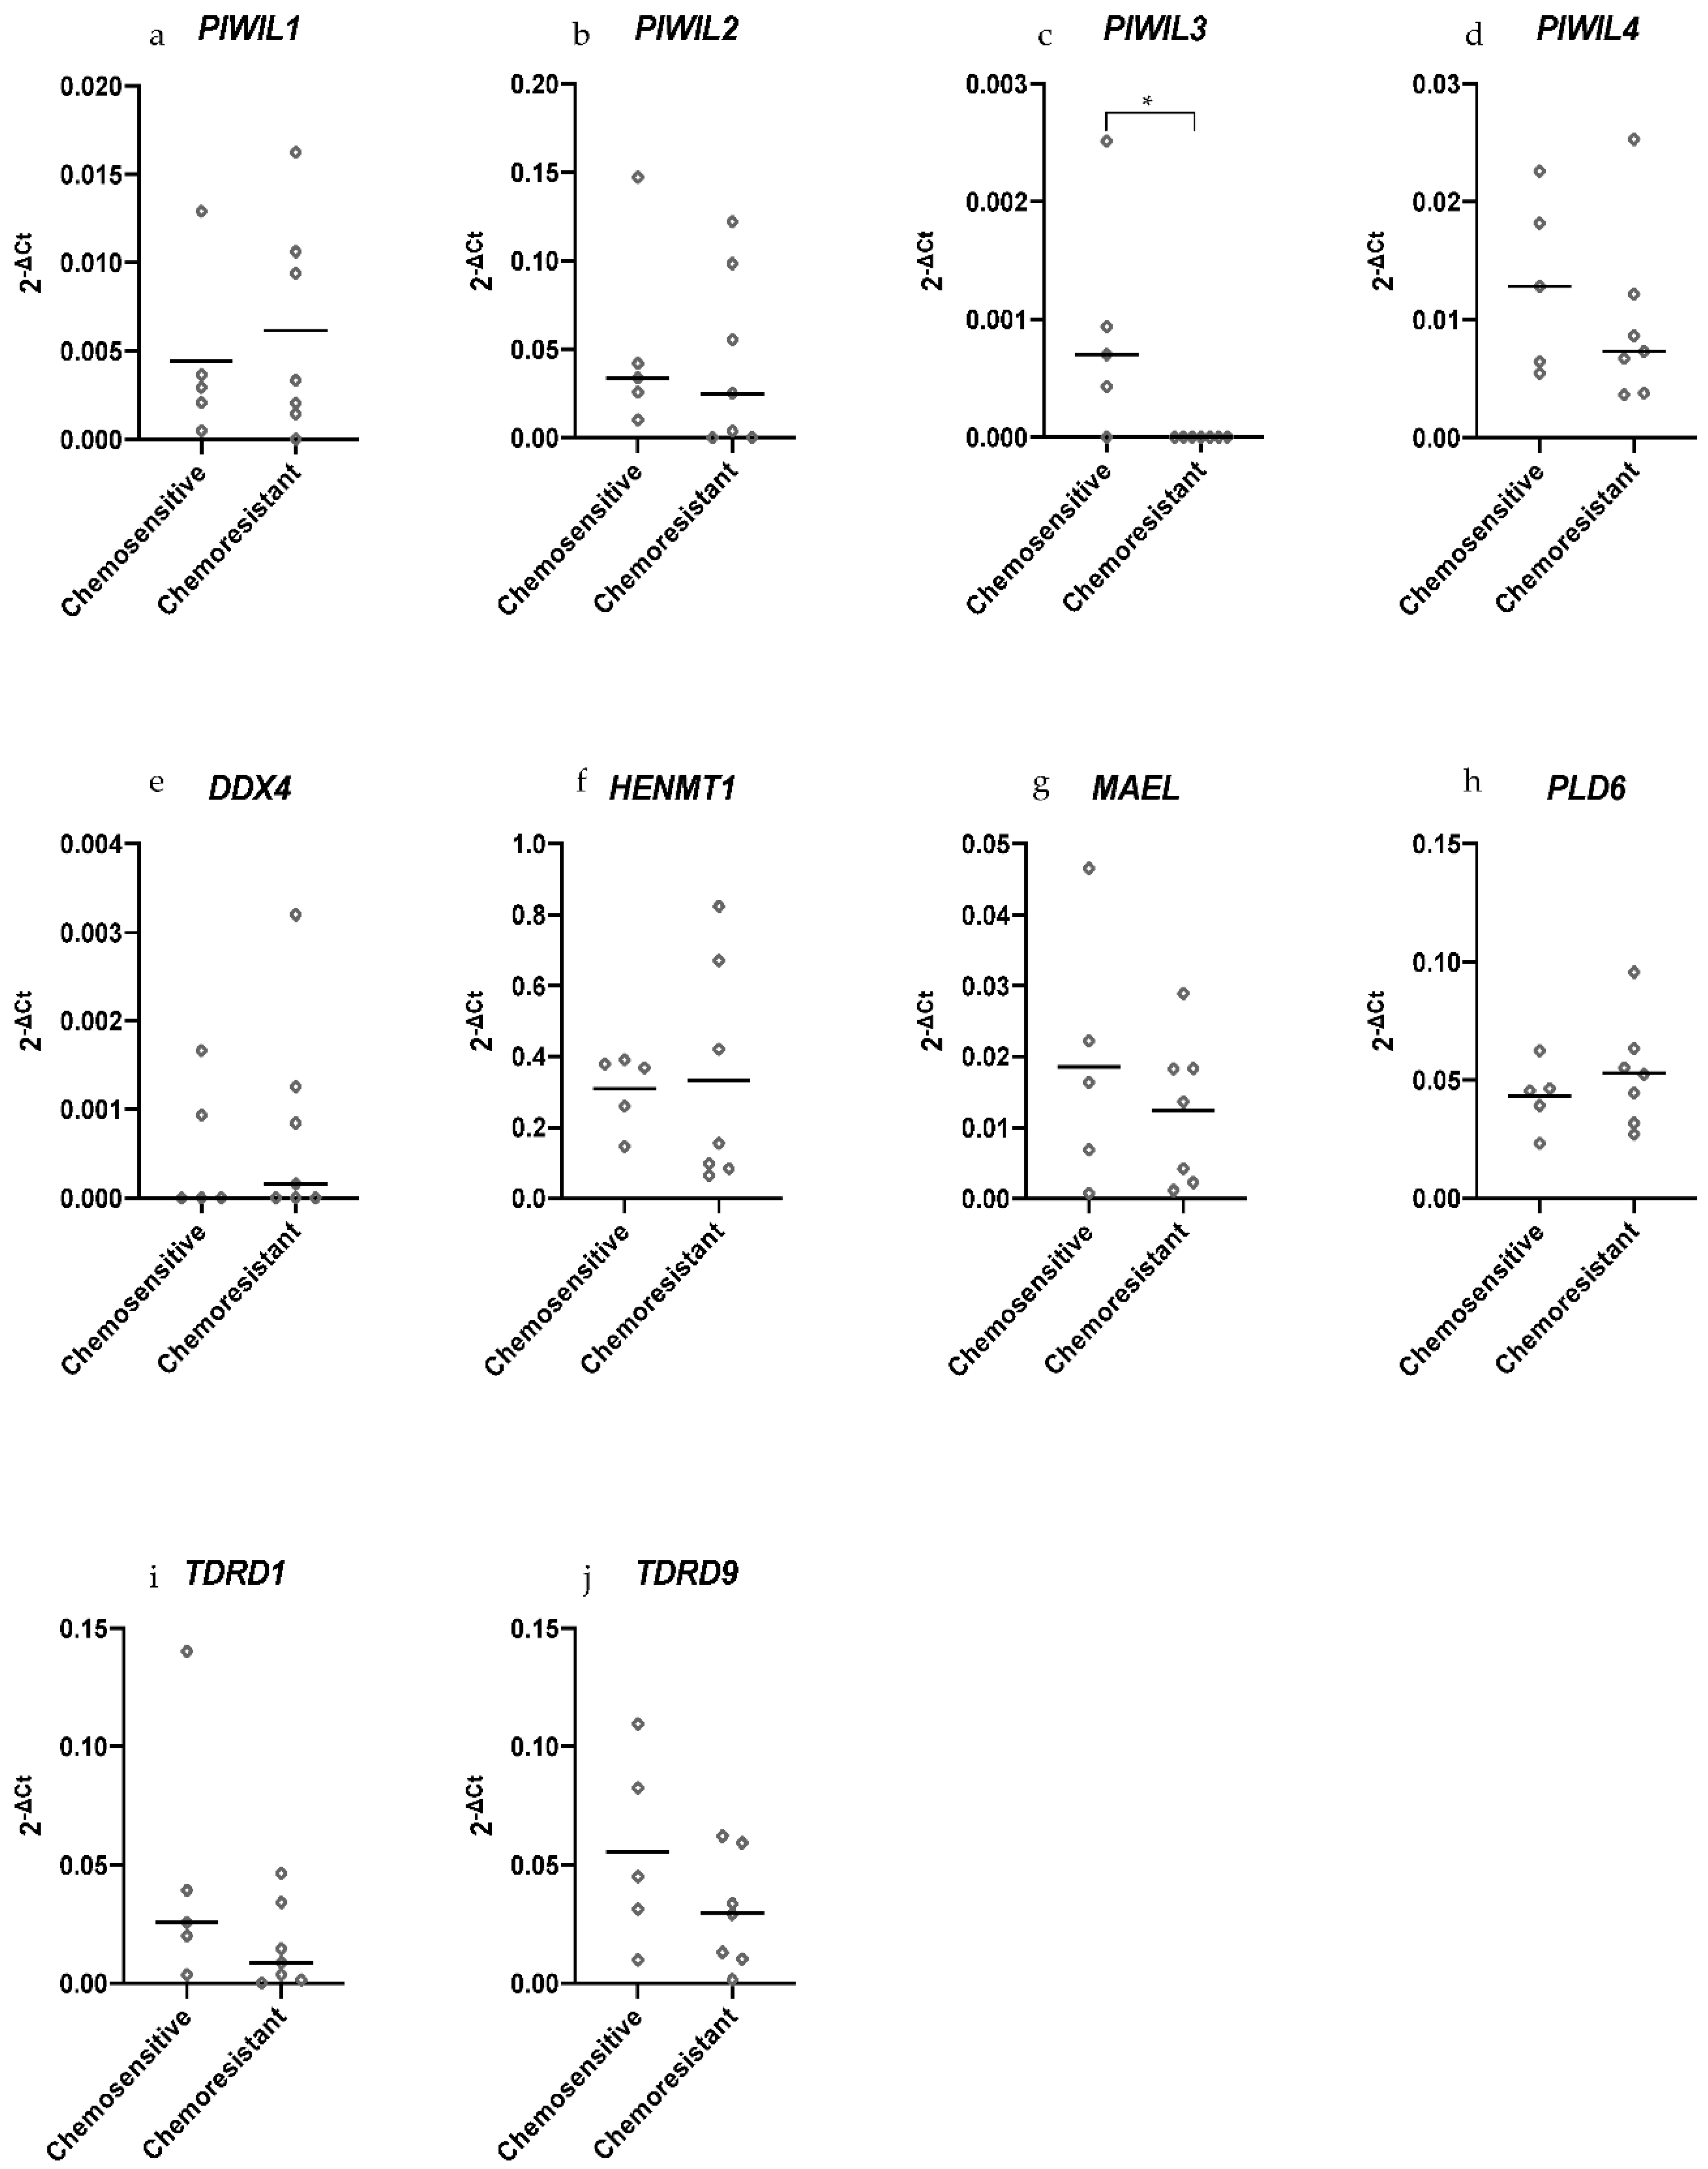
2.4. PIWIL3 Is Expressed in Chemosensitive Primary HGSOC Cells but not in Chemoresistant Primary HGSOC Cells
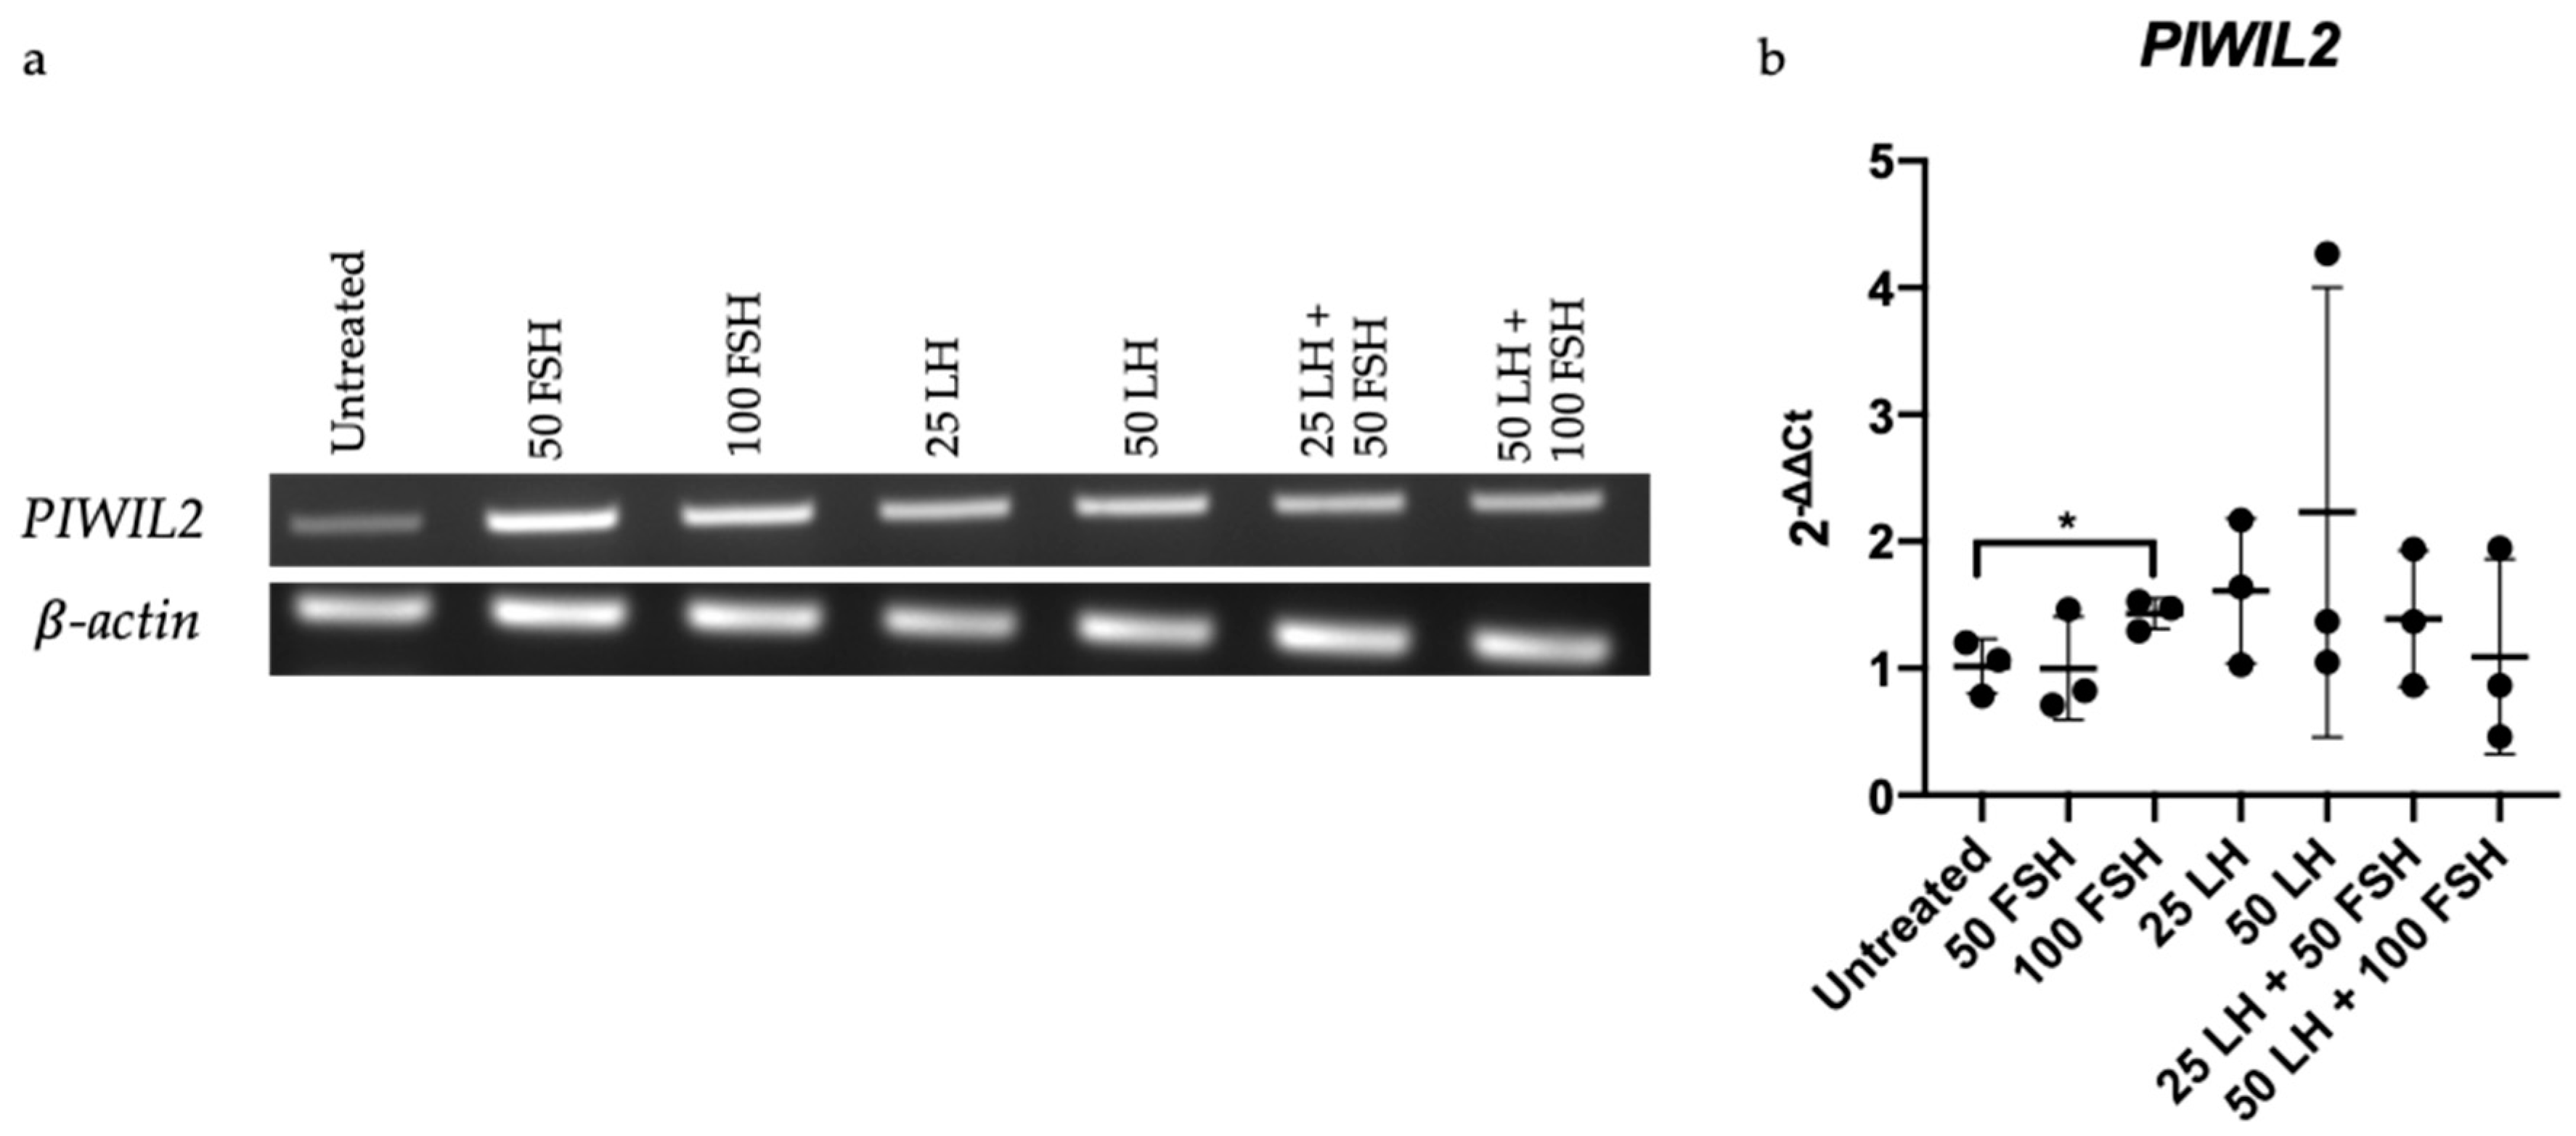
2.5. PIWIL2 Expression Increased upon FSH Treatment in OV-90 Cells
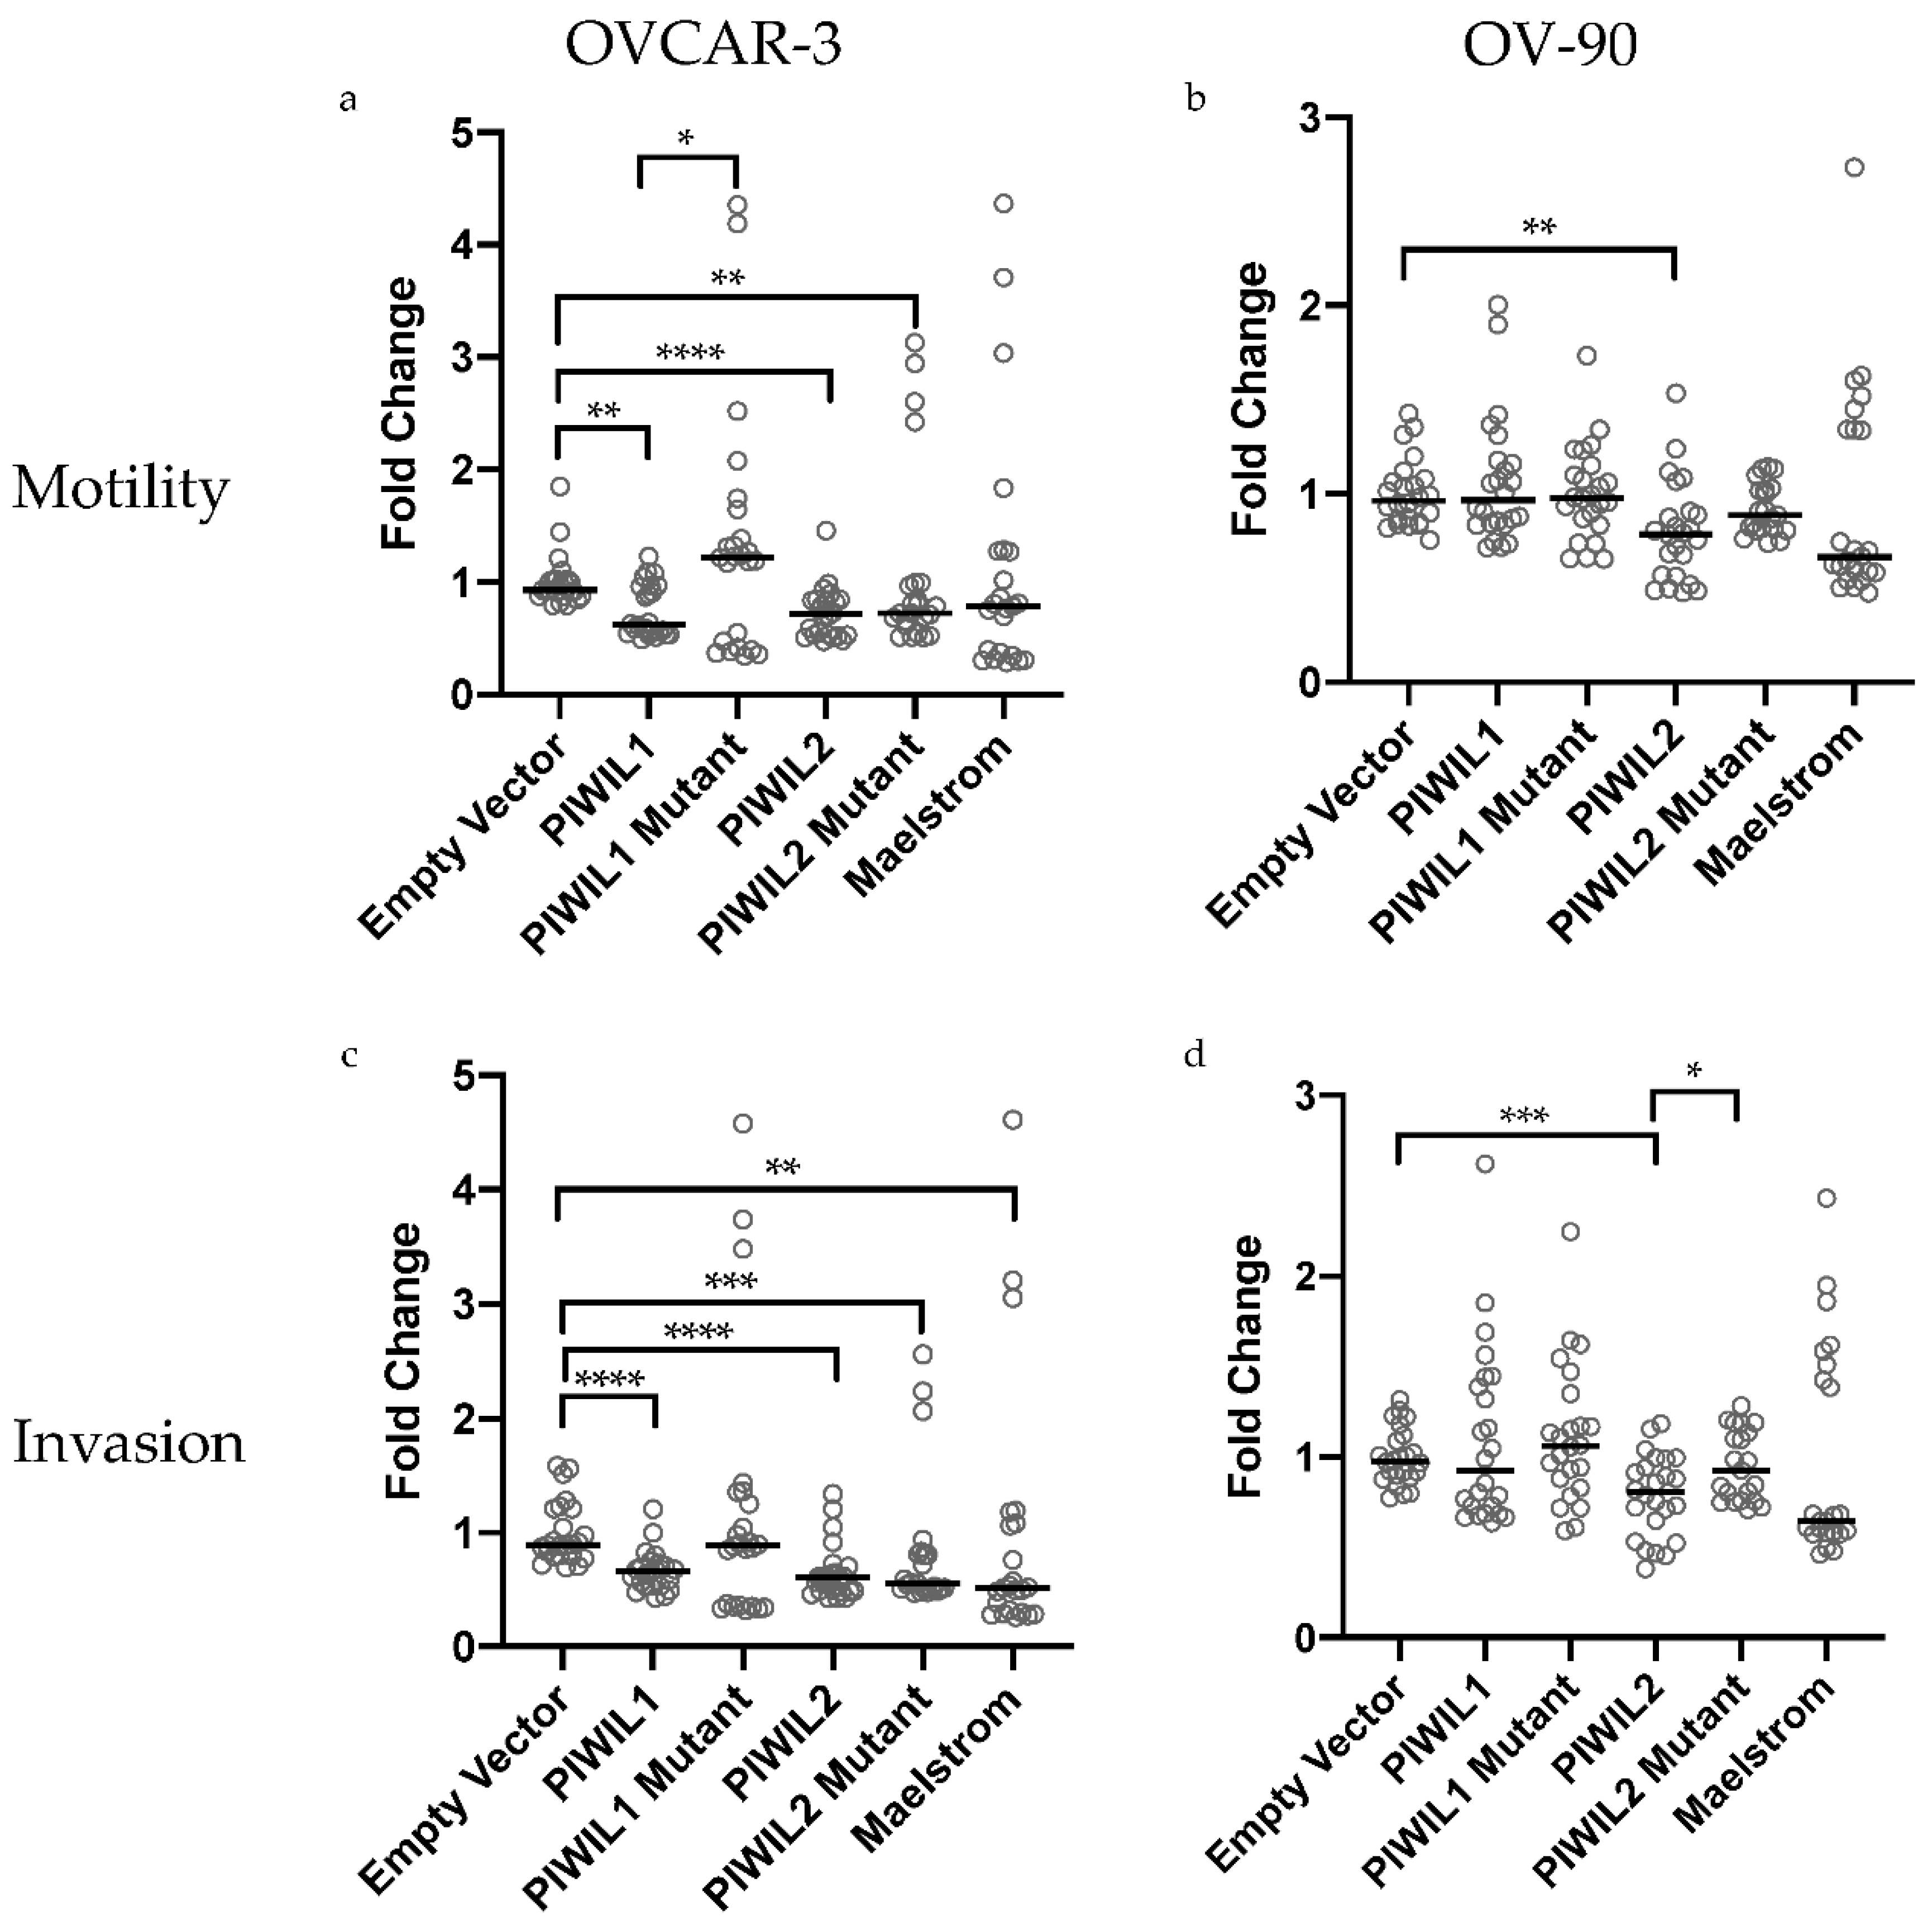
2.6. Cells Overexpressing Wildtype and Mutant piRNA Pathway Genes Have Altered Motility and Invasion In Vitro
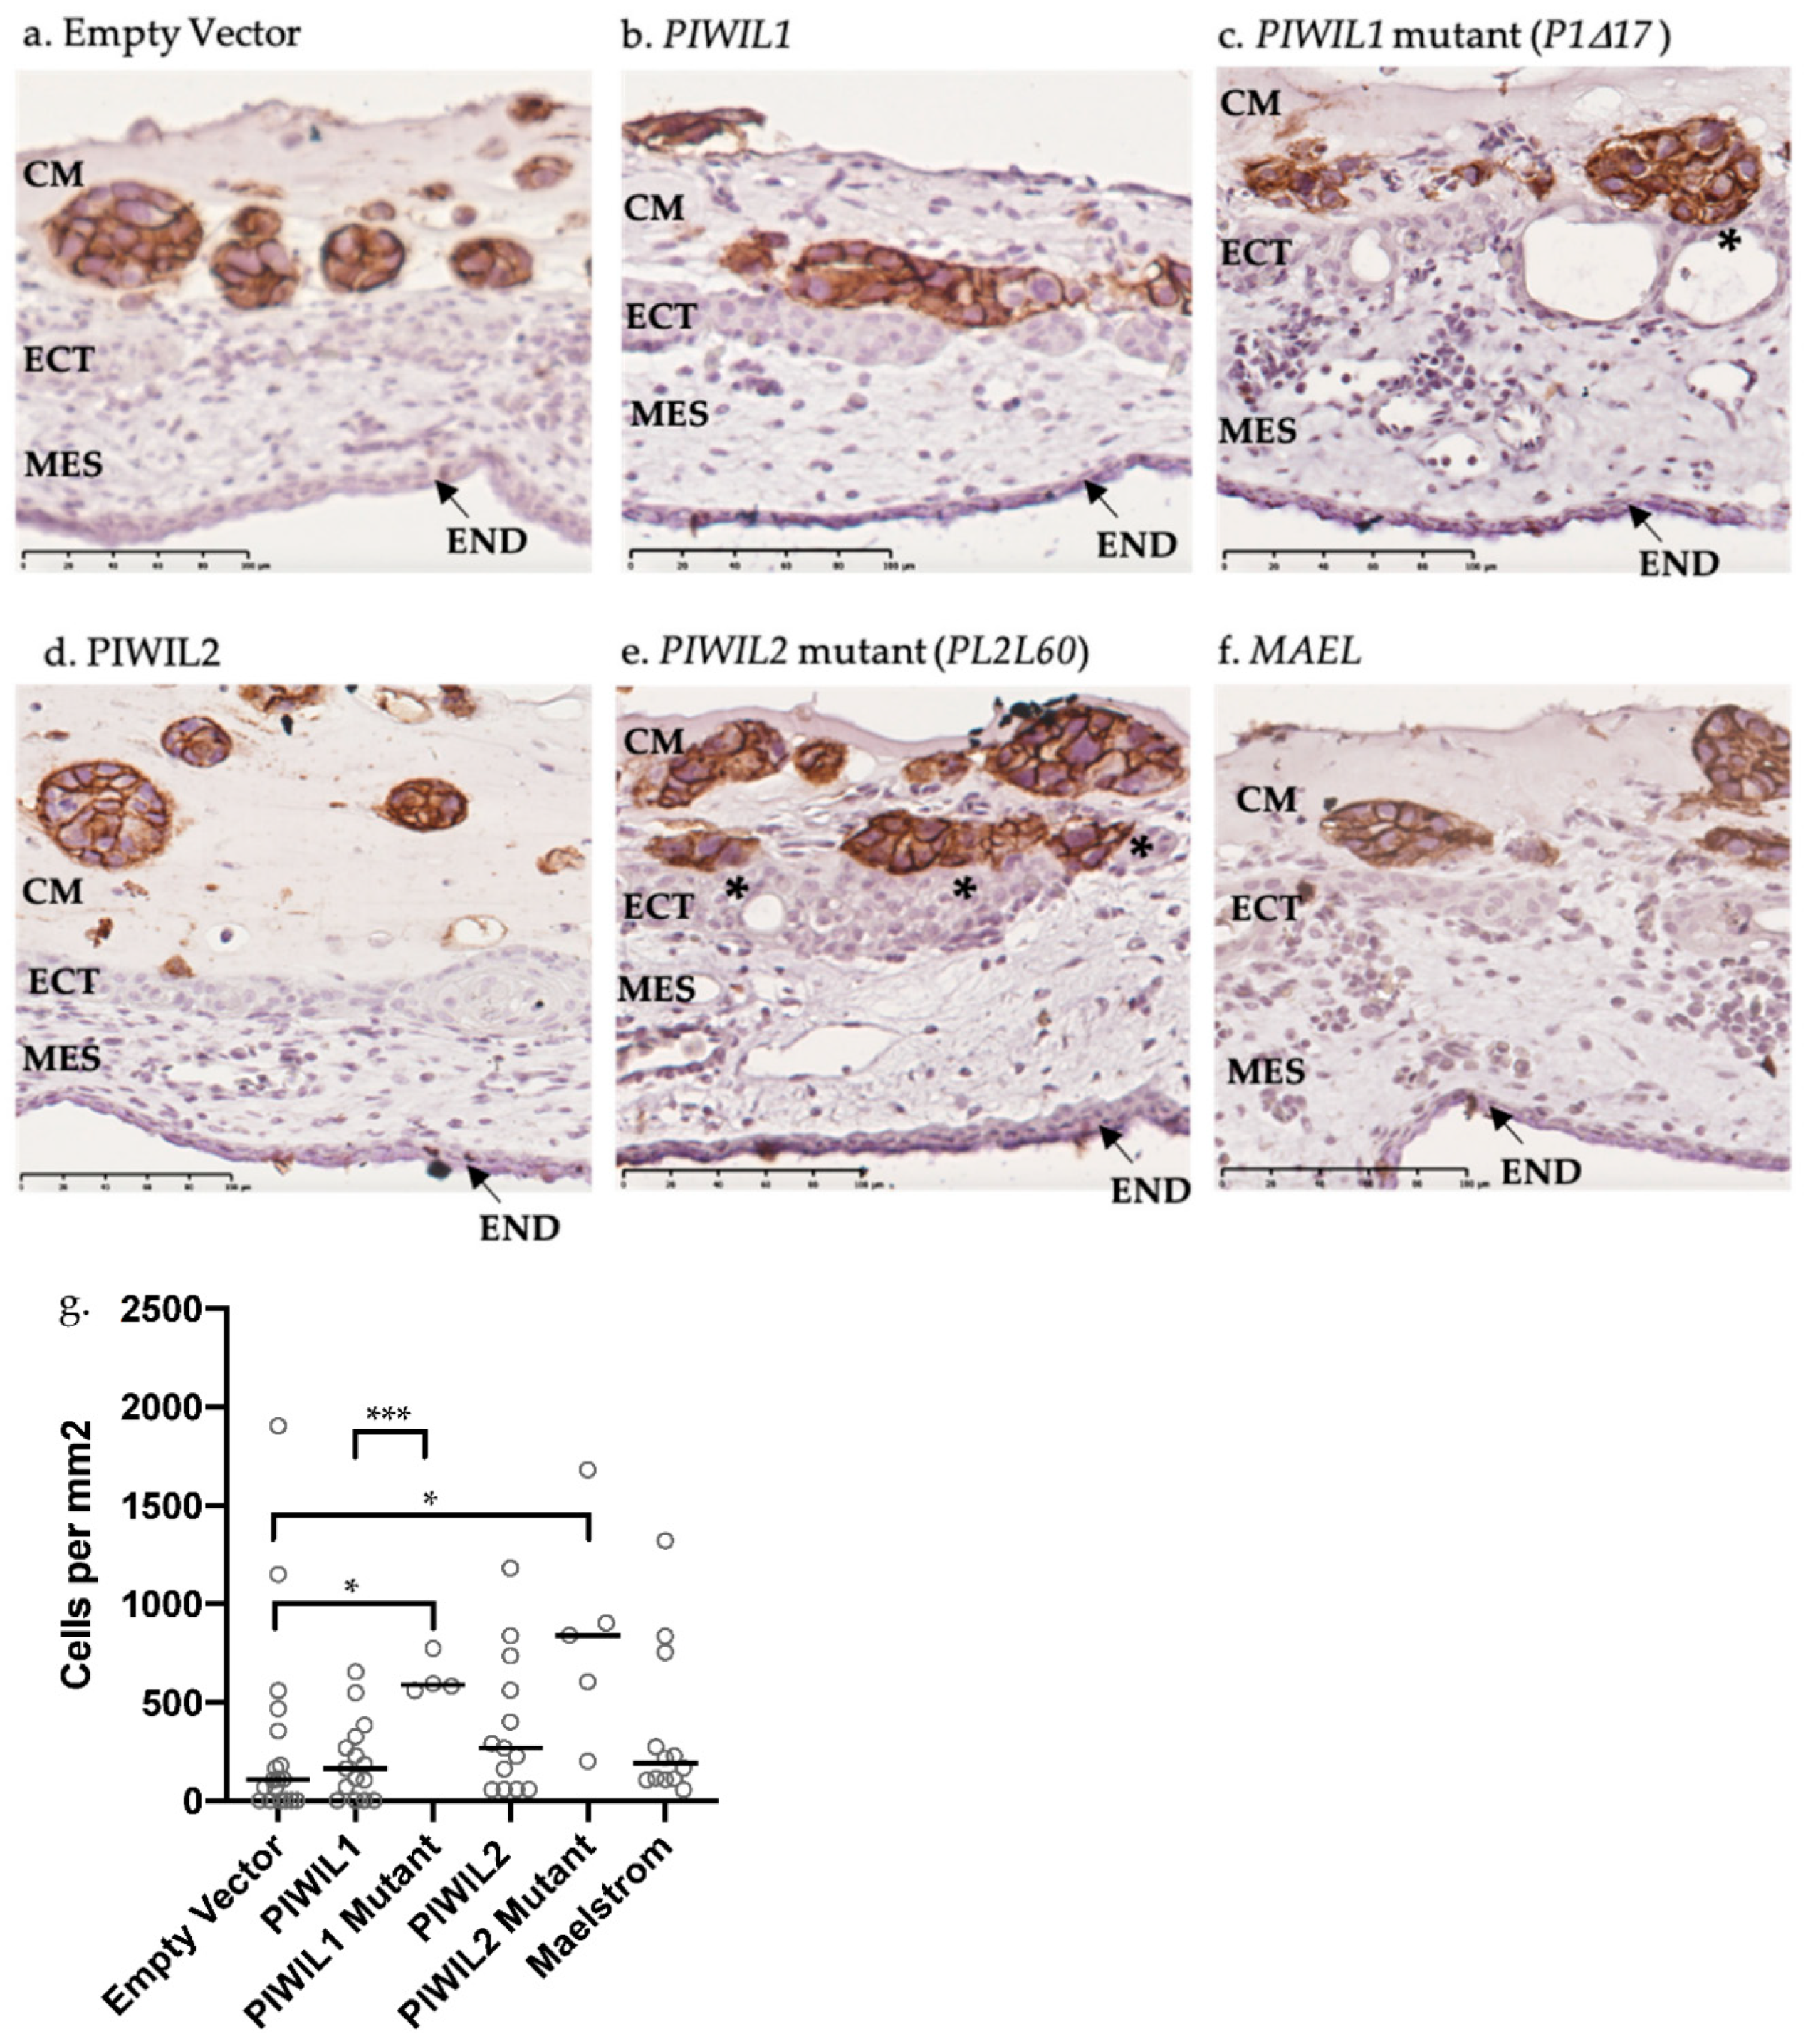
2.7. OV-90 Cells Overexpressing Mutant PIWIL1 Are More Invasive than Wildtype In Vivo
3. Discussion
4. Materials and Methods
4.1. Patient Cohort
4.2. RNA Extraction, cDNA Synthesis and Quantification
4.3. Primary and Established Ovarian Cancer Cell Lines
4.4. Quantitative Real-Time PCR (qRT-PCR)
4.5. Public Microarray Online Databases
4.6. Overexpression Transfections
4.7. RT-PCR
4.8. In Vitro Motility and Invasion Assay
4.9. Chicken Chorioallantoic Membrane (CAM) Assay and Immunohistochemistry
4.10. FSH and LH Treatment
5. Conclusions
Supplementary Materials
Author Contributions
Funding
Institutional Review Board Statement
Informed Consent Statement
Data Availability Statement
Acknowledgments
Conflicts of Interest
Abbreviations
| BSA | Bovine serum albumin |
| CAM | Chicken chorioallantoic membrane |
| CSIOVDB | Ovarian cancer database of Cancer Science Institute Singapore |
| DAB | 3:3′-diaminobenzidine |
| DDX4 | DEAD-Box Helicase 4 |
| EMT | Epithelial to mesenchymal transition |
| EOC | Epithelial ovarian cancer |
| FFPE | Formalin-fixed paraffin-embedded |
| FIGO | Fédération Internationale de Gynécologie et d’Obstétrique |
| FSH | Follicle stimulating hormone |
| GUSB | Glucuronidase Beta |
| HGSOC | High grade serous ovarian cancer |
| HENMT1 | HEN Methyltransferase 1 |
| HR | Hazard ratio |
| KM | Kaplan−Meier |
| LH | Luteinizing hormone |
| MAEL | Maelstrom |
| miRNA | MicroRNA |
| ncRNA | Noncoding RNA |
| OC | Ovarian cancer |
| OS | Overall survival |
| PBS | Phosphate-buffered saline |
| PFS | Progression free survival |
| piRNA | PIWI-interacting RNA |
| PIWIL (1-4) | P-element induced wimpy testis-like (1-4) |
| PLD6 | Phospholipase D Family Member 6 |
| PPFS | Post-progression free survival |
| SNAI (1-3) | Snail family zinc finger (1-3) |
| TBP | TATA-Box Binding Protein |
| TDRD (1:9) | Tudor Domain Containing (1,9) |
| TE | Transposable element |
| ZEB (1,2) | Zinc finger E-box binding homeobox (1,2) |
References
- Bray, F.; Ferlay, J.; Soerjomataram, I.; Siegel, R.L.; Torre, L.A.; Jemal, A. Global cancer statistics 2018: GLOBOCAN estimates of incidence and mortality worldwide for 36 cancers in 185 countries. CA A Cancer J. Clin. 2018, 68, 394–424. [Google Scholar] [CrossRef] [PubMed] [Green Version]
- Torre, L.A.; Trabert, B.; DeSantis, C.E.; Miller, K.D.; Samimi, G.; Runowicz, C.D.; Gaudet, M.M.; Jemal, A.; Siegel, R.L. Ovarian cancer statistics, 2018. CA A Cancer J. Clin. 2018, 68, 284–296. [Google Scholar] [CrossRef] [PubMed]
- Kurman, R.J.; Visvanathan, K.; Roden, R.; Wu, T.C.; Shih, I.-M. Early Detection and Treatment of Ovarian Cancer: Shifting from Early Stage to Minimal Volume of Disease Based on a New Model of Carcinogenesis. Am. J. Obstet. Gynecol. 2008, 198, 351–356. [Google Scholar] [CrossRef] [Green Version]
- Mertens-Walker, I.; Baxter, R.C.; Marsh, D.J. Gonadotropin signalling in epithelial ovarian cancer. Cancer Lett. 2012, 324, 152–159. [Google Scholar] [CrossRef]
- Gharwan, H.; Bunch, K.P.; Annunziata, C.M. The role of reproductive hormones in epithelial ovarian carcinogenesis. Endocr. Relat. Cancer 2015, 22, R339–R363. [Google Scholar] [CrossRef] [Green Version]
- Kurman, R.J.; Shih, I.-M. The Dualistic Model of Ovarian Carcinogenesis: Revisited, Revised, and Expanded. Am. J. Pathol. 2016, 186, 733–747. [Google Scholar] [CrossRef] [PubMed] [Green Version]
- Webb, P.M.; Jordan, S.J. Epidemiology of epithelial ovarian cancer. Best Pract. Res. Clin. Obstet. Gynaecol. 2017, 41, 3–14. [Google Scholar] [CrossRef] [PubMed] [Green Version]
- Prat, J. Ovarian carcinomas: Five distinct diseases with different origins, genetic alterations, and clinicopathological features. Virchows Arch. 2012, 460, 237–249. [Google Scholar] [CrossRef]
- Boussios, S.; Moschetta, M.; Zarkavelis, G.; Papadaki, A.; Kefas, A.; Tatsi, K. Ovarian sex-cord stromal tumours and small cell tumours: Pathological, genetic and management aspects. Crit. Rev. Oncol. Hematol. 2017, 120, 43–51. [Google Scholar] [CrossRef]
- Lheureux, S.; Braunstein, M.; Oza, A.M. Epithelial ovarian cancer: Evolution of management in the era of precision medicine. CA A Cancer J. Clin. 2019, 69, 280–304. [Google Scholar] [CrossRef] [Green Version]
- Lisio, M.-A.; Fu, L.; Goyeneche, A.; Gao, Z.-H.; Telleria, C. High-Grade Serous Ovarian Cancer: Basic Sciences, Clinical and Therapeutic Standpoints. Int. J. Mol. Sci. 2019, 20, 952. [Google Scholar] [CrossRef] [PubMed] [Green Version]
- Flaum, N.; Crosbie, E.J.; Edmondson, R.J.; Smith, M.J.; Evans, D.G. Epithelial ovarian cancer risk: A review of the current genetic landscape. Clin. Genet. 2020, 97, 54–63. [Google Scholar] [CrossRef] [PubMed] [Green Version]
- Olivier, M.; Hollstein, M.; Hainaut, P. TP53 mutations in human cancers: Origins, consequences, and clinical use. Cold Spring Harb. Perspect. Biol. 2010, 2, a001008. [Google Scholar] [CrossRef] [PubMed] [Green Version]
- Vang, R.; Levine, D.A.; Soslow, R.A.; Zaloudek, C.; Shih, I.-M.; Kurman, R.J. Molecular alterations of TP53 are a defining feature of ovarian high-grade serous carcinoma: A rereview of cases lacking TP53 mutations in the Cancer Genome Atlas Ovarian Study. Int. J. Gynecol. Pathol. Off. J. Int. Soc. Gynecol. Pathol. 2016, 35, 48. [Google Scholar] [CrossRef] [PubMed] [Green Version]
- Kim, S.; Han, Y.; Kim, S.I.; Kim, H.-S.; Kim, S.J.; Song, Y.S. Tumor evolution and chemoresistance in ovarian cancer. Npj Precis. Oncol. 2018, 2, 1–9. [Google Scholar] [CrossRef] [Green Version]
- Zhang, Y.; Cao, L.; Nguyen, D.; Lu, H. TP53 mutations in epithelial ovarian cancer. Transl. Cancer Res. 2016, 5, 650–663. [Google Scholar] [CrossRef]
- Telloni, S.M. Tumor Staging and Grading: A Primer. In Molecular Profiling: Methods and Protocols; Espina, V., Ed.; Springer: New York, NY, USA, 2017; pp. 1–17. [Google Scholar] [CrossRef]
- Slomovitz, B.; Gourley, C.; Carey, M.S.; Malpica, A.; Shih, I.-M.; Huntsman, D.; Fader, A.N.; Grisham, R.N.; Schlumbrecht, M.; Sun, C.C. Low-grade serous ovarian cancer: State of the science. Gynecol. Oncol. 2020, 156, 715–725. [Google Scholar] [CrossRef]
- Hanahan, D.; Weinberg, R.A. Hallmarks of Cancer: The Next Generation. Cell 2011, 144, 646–674. [Google Scholar] [CrossRef] [Green Version]
- Shibue, T.; Weinberg, R.A. EMT, CSCs, and drug resistance: The mechanistic link and clinical implications. Nat. Rev. Clin. Oncol. 2017, 14, 611. [Google Scholar] [CrossRef] [Green Version]
- Han, Y.N.; Li, Y.; Xia, S.Q.; Zhang, Y.Y.; Zheng, J.H.; Li, W. PIWI Proteins and PIWI-Interacting RNA: Emerging Roles in Cancer. Cell. Physiol. Biochem. 2017, 44, 1–20. [Google Scholar] [CrossRef] [Green Version]
- Kim, S.-H.; Park, E.-R.; Cho, E.; Jung, W.-H.; Jeon, J.-Y.; Joo, H.-Y.; Lee, K.-H.; Shin, H.-J. Mael is essential for cancer cell survival and tumorigenesis through protection of genetic integrity. Oncotarget 2017, 8, 5026–5037. [Google Scholar] [CrossRef] [PubMed] [Green Version]
- Xiao, L.; Lanz, R.B.; Frolov, A.; Castro, P.D.; Zhang, Z.; Dong, B.; Xue, W.; Jung, S.Y.; Lydon, J.P.; Edwards, D.P. The germ cell gene TDRD1 as an ERG target gene and a novel prostate cancer biomarker. Prostate 2016, 76, 1271–1284. [Google Scholar] [CrossRef] [PubMed]
- Schudrowitz, N.; Takagi, S.; Wessel, G.M.; Yajima, M. Germline factor DDX 4 functions in blood-derived cancer cell phenotypes. Cancer Sci. 2017, 108, 1612–1619. [Google Scholar] [CrossRef] [PubMed] [Green Version]
- Lim, S.L.; Ricciardelli, C.; Oehler, M.K.; De Arao Tan, I.M.D.; Russell, D.; Grützner, F. Overexpression of piRNA Pathway Genes in Epithelial Ovarian Cancer. PLoS ONE 2014, 9, e99687. [Google Scholar] [CrossRef] [Green Version]
- Wang, Q.-E.; Han, C.; Milum, K.; Wani, A.A. Stem cell protein Piwil2 modulates chromatin modifications upon cisplatin treatment. Mutat. Res. Fundam. Mol. Mech. Mutagenesis 2011, 708, 59–68. [Google Scholar] [CrossRef] [Green Version]
- Hirakata, S.; Siomi, M.C. piRNA biogenesis in the germline: From transcription of piRNA genomic sources to piRNA maturation. Biochim. Biophys. Acta (BBA) Gene Regul. Mech. 2016, 1859, 82–92. [Google Scholar] [CrossRef]
- Ozata, D.M.; Gainetdinov, I.; Zoch, A.; O’Carroll, D.; Zamore, P.D. PIWI-interacting RNAs: Small RNAs with big functions. Nat. Rev. Genet. 2019, 20, 89–108. [Google Scholar] [CrossRef] [Green Version]
- Aravin, A.; Gaidatzis, D.; Pfeffer, S.; Lagos-Quintana, M.; Landgraf, P.; Iovino, N.; Morris, P.; Brownstein, M.J.; Kuramochi-Miyagawa, S.; Nakano, T. A novel class of small RNAs bind to MILI protein in mouse testes. Nature 2006, 442, 203–207. [Google Scholar] [CrossRef]
- Iwasaki, Y.W.; Siomi, M.C.; Siomi, H. PIWI-Interacting RNA: Its Biogenesis and Functions. Annu. Rev. Biochem. 2015, 84, 405–433. [Google Scholar] [CrossRef]
- Cora, E.; Pandey, R.R.; Xiol, J.; Taylor, J.; Sachidanandam, R.; McCarthy, A.A.; Pillai, R.S. The MID-PIWI module of Piwi proteins specifies nucleotide- and strand-biases of piRNAs. RNA 2014, 20, 773–781. [Google Scholar] [CrossRef] [Green Version]
- Bamezai, S.; Rawat, V.P.S.; Buske, C. Concise Review: The Piwi-piRNA Axis: Pivotal Beyond Transposon Silencing. Stem Cells 2012, 30, 2603–2611. [Google Scholar] [CrossRef] [PubMed]
- Simon, B.; Kirkpatrick, J.P.; Eckhardt, S.; Reuter, M.; Rocha, E.A.; Andrade-Navarro, M.A.; Sehr, P.; Pillai, R.S.; Carlomagno, T. Recognition of 2′-O-methylated 3′-end of piRNA by the PAZ domain of a Piwi protein. Structure 2011, 19, 172–180. [Google Scholar] [CrossRef] [PubMed] [Green Version]
- Aravin, A.A.; Sachidanandam, R.; Girard, A.; Fejes-Toth, K.; Hannon, G.J. Developmentally Regulated piRNA Clusters Implicate MILI in Transposon Control. Science 2007, 316, 744–747. [Google Scholar] [CrossRef] [PubMed] [Green Version]
- Brennecke, J.; Aravin, A.A.; Stark, A.; Dus, M.; Kellis, M.; Sachidanandam, R.; Hannon, G.J. Discrete Small RNA-Generating Loci as Master Regulators of Transposon Activity in Drosophila. Cell 2007, 128, 1089–1103. [Google Scholar] [CrossRef] [Green Version]
- Siomi, M.C.; Sato, K.; Pezic, D.; Aravin, A.A. PIWI-interacting small RNAs: The vanguard of genome defence. Nat. Rev. Mol. Cell Biol. 2011, 12, 246–258. [Google Scholar] [CrossRef]
- Soper, S.F.C.; van der Heijden, G.W.; Hardiman, T.C.; Goodheart, M.; Martin, S.L.; de Boer, P.; Bortvin, A. Mouse Maelstrom, a component of nuage, is essential for spermatogenesis and transposon repression in meiosis. Dev. Cell 2008, 15, 285–297. [Google Scholar] [CrossRef] [Green Version]
- Sienski, G.; Dönertas, D.; Brennecke, J. Transcriptional Silencing of Transposons by Piwi and Maelstrom and Its Impact on Chromatin State and Gene Expression. Cell 2012, 151, 964–980. [Google Scholar] [CrossRef] [Green Version]
- Lim, S.L.; Qu, Z.P.; Kortschak, R.D.; Lawrence, D.M.; Geoghegan, J.; Hempfling, A.-L.; Bergmann, M.; Goodnow, C.C.; Ormandy, C.J.; Wong, L.; et al. HENMT1 and piRNA Stability Are Required for Adult Male Germ Cell Transposon Repression and to Define the Spermatogenic Program in the Mouse. PLoS Genet. 2015, 11, e1005620. [Google Scholar] [CrossRef]
- Mani, S.R.; Juliano, C.E. Untangling the web: The diverse functions of the PIWI/piRNA pathway. Mol. Reprod. Dev. 2013, 80, 632–664. [Google Scholar] [CrossRef] [Green Version]
- Sato, K.; Siomi, M.C. The piRNA pathway in Drosophila ovarian germ and somatic cells. Proc. Jpn. Acad. Ser. B 2020, 96, 32–42. [Google Scholar] [CrossRef] [Green Version]
- Ng, K.W.; Anderson, C.; Marshall, E.A.; Minatel, B.C.; Enfield, K.S.S.; Saprunoff, H.L.; Lam, W.L.; Martinez, V.D. Piwi-interacting RNAs in cancer: Emerging functions and clinical utility. Mol. Cancer 2016, 15, 5. [Google Scholar] [CrossRef] [PubMed] [Green Version]
- Liu, Y.; Dou, M.; Song, X.; Dong, Y.; Liu, S.; Liu, H.; Tao, J.; Li, W.; Yin, X.; Xu, W. The emerging role of the piRNA/piwi complex in cancer. Mol. Cancer 2019, 18, 123. [Google Scholar] [CrossRef] [PubMed] [Green Version]
- Tan, Y.; Liu, L.; Liao, M.; Zhang, C.; Hu, S.; Zou, M.; Gu, M.; Li, X. Emerging roles for PIWI proteins in cancer. Acta Biochim. Biophys. Sin. 2015, 47, 315–324. [Google Scholar] [CrossRef] [PubMed] [Green Version]
- Xiao, L.; Wang, Y.; Zhou, Y.; Sun, Y.; Sun, W.; Wang, L.; Zhou, C.; Zhou, J.; Zhang, J. Identification of a novel human cancer/testis gene MAEL that is regulated by DNA methylation. Mol. Biol. Rep. 2010, 37, 2355–2360. [Google Scholar] [CrossRef] [PubMed]
- Babatunde, K.A.; Najafi, A.; Salehipour, P.; Modarressi, M.H.; Mobasheri, M.B. Cancer/Testis genes in relation to sperm biology and function. Iran. J. Basic Med. Sci. 2017, 20, 967–974. [Google Scholar] [CrossRef] [PubMed]
- Liu, L.; Dai, Y.; Chen, J.; Zeng, T.; Li, Y.; Chen, L.; Zhu, Y.H.; Li, J.; Ma, S.; Xie, D. Maelstrom promotes hepatocellular carcinoma metastasis by inducing epithelial-mesenchymal transition by way of Akt/GSK-3β/Snail signaling. Hepatology 2014, 59, 531–543. [Google Scholar] [CrossRef]
- Fite, K. Dysregulation of Phospholipase D (PLD) Isoforms Increases Breast Cancer Cell Invasion; Wright State University: Dayton, OH, USA, 2017. [Google Scholar]
- Boormans, J.L.; Korsten, H.; Ziel-van der Made, A.J.; van Leenders, G.J.; de Vos, C.V.; Jenster, G.; Trapman, J. Identification of TDRD1 as a direct target gene of ERG in primary prostate cancer. Int. J. Cancer 2013, 133, 335–345. [Google Scholar] [CrossRef]
- Ye, Y.; Yin, D.-T.; Chen, L.; Zhou, Q.; Shen, R.; He, G.; Yan, Q.; Tong, Z.; Issekutz, A.C.; Shapiro, C.L.; et al. Identification of Piwil2-Like (PL2L) Proteins that Promote Tumorigenesis. PLoS ONE 2010, 5, e13406. [Google Scholar] [CrossRef] [Green Version]
- Linder, P. Dead-box proteins: A family affair—Active and passive players in RNP-remodeling. Nucleic Acids Res. 2006, 34, 4168–4180. [Google Scholar] [CrossRef]
- Horwich, M.D.; Li, C.; Matranga, C.; Vagin, V.; Farley, G.; Wang, P.; Zamore, P.D. The Drosophila RNA Methyltransferase, DmHen1, Modifies Germline piRNAs and Single-Stranded siRNAs in RISC. Curr. Biol. 2007, 17, 1265–1272. [Google Scholar] [CrossRef] [Green Version]
- Findley, S.D.; Tamanaha, M.; Clegg, N.J.; Ruohola-Baker, H. Maelstrom, a Drosophila spindle-class gene, encodes a protein that colocalizes with Vasa and RDE1/AGO1 homolog, Aubergine, in nuage. Development 2003, 130, 859–871. [Google Scholar] [CrossRef] [PubMed] [Green Version]
- Gomez-Cambronero, J. Phospholipase D in cell signaling: From a myriad of cell functions to cancer growth and metastasis. J. Biol. Chem. 2014, 289, 22557–22566. [Google Scholar] [CrossRef] [PubMed] [Green Version]
- Chen, C.; Nott, T.J.; Jin, J.; Pawson, T. Deciphering arginine methylation: Tudor tells the tale. Nat. Rev. Mol. Cell Biol. 2011, 12, 629–642. [Google Scholar] [CrossRef] [PubMed]
- Jiang, L.; Wang, W.-J.; Li, Z.-W.; Wang, X.-Z. Downregulation of Piwil3 suppresses cell proliferation, migration and invasion in gastric cancer. Cancer Biomark. 2017, 20, 499–509. [Google Scholar] [CrossRef] [PubMed]
- Yang, Y.; Zhang, X.; Song, D.; Wei, J. Piwil2 modulates the invasion and metastasis of prostate cancer by regulating the expression of matrix metalloproteinase-9 and epithelial-mesenchymal transitions. Oncol. Lett. 2015, 10, 1735–1740. [Google Scholar] [CrossRef] [Green Version]
- Wang, X.; Tong, X.; Gao, H.; Yan, X.; Xu, X.; Sun, S.; Wang, Q.; Wang, J. Silencing HIWI suppresses the growth, invasion and migration of glioma cells. Int. J. Oncol. 2014, 45, 2385–2392. [Google Scholar] [CrossRef] [PubMed] [Green Version]
- Kim, K.H.; Kang, Y.-J.; Jo, J.-O.; Ock, M.S.; Moon, S.H.; Suh, D.S.; Yoon, M.S.; Park, E.-S.; Jeong, N.; Eo, W.-K. DDX4 (DEAD box polypeptide 4) colocalizes with cancer stem cell marker CD133 in ovarian cancers. Biochem. Biophys. Res. Commun. 2014, 447, 315–322. [Google Scholar] [CrossRef]
- Hashimoto, H.; Sudo, T.; Mikami, Y.; Otani, M.; Takano, M.; Tsuda, H.; Itamochi, H.; Katabuchi, H.; Ito, M.; Nishimura, R. Germ cell specific protein VASA is over-expressed in epithelial ovarian cancer and disrupts DNA damage-induced G2 checkpoint. Gynecol. Oncol. 2008, 111, 312–319. [Google Scholar] [CrossRef]
- Guijo, M.; Ceballos-Chávez, M.; Gómez-Marín, E.; Basurto-Cayuela, L.; Reyes, J.C. Expression of TDRD9 in a subset of lung carcinomas by CpG island hypomethylation protects from DNA damage. Oncotarget 2017, 9, 9618–9631. [Google Scholar] [CrossRef] [Green Version]
- Li, J.; Xu, L.; Bao, Z.; Xu, P.; Chang, H.; Wu, J.; Bei, Y.; Xia, L.; Wu, P.; Cui, G. High expression of PIWIL2 promotes tumor cell proliferation, migration and predicts a poor prognosis in glioma. Oncol. Rep. 2017, 38, 183–192. [Google Scholar] [CrossRef]
- Gainetdinov, I.V.; Kondratieva, S.A.; Skvortsova, Y.V.; Zinovyeva, M.V.; Stukacheva, E.A.; Klimov, A.; Tryakin, A.A.; Azhikina, T.L. Distinguishing epigenetic features of preneoplastic testis tissues adjacent to seminomas and nonseminomas. Oncotarget 2016, 7, 22439. [Google Scholar] [CrossRef] [Green Version]
- Iliev, R.; Stanik, M.; Fedorko, M.; Poprach, A.; Vychytilova-Faltejskova, P.; Slaba, K.; Svoboda, M.; Fabian, P.; Pacik, D.; Dolezel, J. Decreased expression levels of PIWIL1, PIWIL2, and PIWIL4 are associated with worse survival in renal cell carcinoma patients. Oncotargets Ther. 2016, 9, 217. [Google Scholar]
- Cheng, J.; Deng, H.; Xiao, B.; Zhou, H.; Zhou, F.; Shen, Z.; Guo, J. piR-823, a novel non-coding small RNA, demonstrates in vitro and in vivo tumor suppressive activity in human gastric cancer cells. Cancer Lett. 2012, 315, 12–17. [Google Scholar] [CrossRef] [PubMed]
- Yan, H.; Wu, Q.; Sun, C.; Ai, L.; Deng, J.; Zhang, L.; Chen, L.; Chu, Z.; Tang, B.; Wang, K. piRNA-823 contributes to tumorigenesis by regulating de novo DNA methylation and angiogenesis in multiple myeloma. Leukemia 2015, 29, 196–206. [Google Scholar] [CrossRef] [PubMed]
- Cheng, J.; Guo, J.-M.; Xiao, B.-X.; Miao, Y.; Jiang, Z.; Zhou, H.; Li, Q.-N. piRNA, the new non-coding RNA, is aberrantly expressed in human cancer cells. Clin. Chim. Acta 2011, 412, 1621–1625. [Google Scholar] [CrossRef] [PubMed]
- Palma Flores, C.; García-Vázquez, R.; Gallardo Rincón, D.; Ruiz-García, E.; Astudillo de la Vega, H.; Marchat, L.A.; Salinas Vera, Y.M.; López-Camarillo, C. MicroRNAs driving invasion and metastasis in ovarian cancer: Opportunities for translational medicine. Int. J. Oncol. 2017, 50, 1461–1476. [Google Scholar] [CrossRef] [PubMed] [Green Version]
- Law, P.T.-Y.; Qin, H.; Ching, A.K.-K.; Lai, K.P.; Co, N.N.; He, M.; Lung, R.W.-M.; Chan, A.W.-H.; Chan, T.-F.; Wong, N. Deep sequencing of small RNA transcriptome reveals novel non-coding RNAs in hepatocellular carcinoma. J. Hepatol. 2013, 58, 1165–1173. [Google Scholar] [CrossRef]
- Liu, X.; Zheng, J.; Xue, Y.; Yu, H.; Gong, W.; Wang, P.; Li, Z.; Liu, Y. PIWIL3/OIP5-AS1/miR-367-3p/CEBPA feedback loop regulates the biological behavior of glioma cells. Theranostics 2018, 8, 1084–1105. [Google Scholar] [CrossRef]
- von Eyss, B.; Jaenicke, L.A.; Kortlever, R.M.; Royla, N.; Wiese, K.E.; Letschert, S.; McDuffus, L.-A.; Sauer, M.; Rosenwald, A.; Evan, G.I.; et al. A MYC-Driven Change in Mitochondrial Dynamics Limits YAP/TAZ Function in Mammary Epithelial Cells and Breast Cancer. Cancer Cell 2015, 28, 743–757. [Google Scholar] [CrossRef] [Green Version]
- Hempfling, A.-L.; Lim, S.L.; Adelson, D.; Evans, J.; O’Connor, A.E.; Qu, Z.; Kliesch, S.; Weidner, W.; O’Bryan, M.; Bergmann, M. Expression patterns of HENMT1 and PIWIL1 in human testis-Implications for transposon expression. Reproduction 2017, 154, 363–374. [Google Scholar] [CrossRef] [Green Version]
- Iorio, M.V.; Visone, R.; Di Leva, G.; Donati, V.; Petrocca, F.; Casalini, P.; Taccioli, C.; Volinia, S.; Liu, C.-G.; Alder, H. MicroRNA signatures in human ovarian cancer. Cancer Res. 2007, 67, 8699–8707. [Google Scholar] [CrossRef] [PubMed] [Green Version]
- Kacprzyk, L.A.; Laible, M.; Andrasiuk, T.; Brase, J.C.; Börno, S.T.; Fälth, M.; Kuner, R.; Lehrach, H.; Schweiger, M.R.; Sültmann, H. ERG Induces Epigenetic Activation of Tudor Domain-Containing Protein 1 (TDRD1) in ERG Rearrangement-Positive Prostate Cancer. PLoS ONE 2013, 8, e59976. [Google Scholar] [CrossRef] [PubMed]
- Gambichler, T.; Kohsik, C.; Höh, A.-K.; Lang, K.; Käfferlein, H.U.; Brüning, T.; Stockfleth, E.; Stücker, M.; Dreißigacker, M.; Sand, M. Expression of PIWIL3 in primary and metastatic melanoma. J. Cancer Res. Clin. Oncol. 2017, 143, 433–437. [Google Scholar] [CrossRef] [PubMed]
- Li, W.; Martinez-Useros, J.; Garcia-Carbonero, N.; Fernandez-Aceñero, M.J.; Orta, A.; Ortega-Medina, L.; Garcia-Botella, S.; Perez-Aguirre, E.; Diez-Valladares, L.; Celdran, A.; et al. The Clinical Significance of PIWIL3 and PIWIL4 Expression in Pancreatic Cancer. J. Clin. Med. 2020, 9, 1252. [Google Scholar] [CrossRef] [PubMed]
- Tan, M.; van Tol, H.T.; Rosenkranz, D.; Roovers, E.F.; Damen, M.J.; Stout, T.A.; Wu, W.; Roelen, B.A. PIWIL3 forms a complex with TDRKH in mammalian oocytes. Cells 2020, 9, 1356. [Google Scholar] [CrossRef] [PubMed]
- Salomon-Perzyński, A.; Salomon-Perzyńska, M.; Michalski, B.; Skrzypulec-Plinta, V. High-grade serous ovarian cancer: The clone wars. Arch. Gynecol. Obstet. 2017, 295, 569–576. [Google Scholar] [CrossRef] [Green Version]
- Birkbak, N.J.; Eklund, A.C.; Li, Q.; McClelland, S.E.; Endesfelder, D.; Tan, P.; Tan, I.B.; Richardson, A.L.; Szallasi, Z.; Swanton, C. Paradoxical relationship between chromosomal instability and survival outcome in cancer. Cancer Res. 2011, 71, 3447–3452. [Google Scholar] [CrossRef] [Green Version]
- Öner, Ç.; Turgut Coşan, D.; Çolak, E. Estrogen and Androgen Hormone Levels Modulate the Expression of PIWI Interacting RNA in Prostate and Breast Cancer. PLoS ONE 2016, 11, e0159044. [Google Scholar] [CrossRef] [Green Version]
- Wang, H.; Wang, B.; Liu, J.; Li, A.; Zhu, H.; Wang, X.; Zhang, Q. Piwil1 gene is regulated by hypothalamic-pituitary-gonadal axis in turbot (Scophthalmus maximus): A different effect in ovaries and testes. Gene 2018, 658, 86–95. [Google Scholar] [CrossRef]
- Zhang, D.; Duarte-Guterman, P.; Langlois, V.S.; Trudeau, V.L. Temporal expression and steroidal regulation of piRNA pathway genes (mael, piwi, vasa) during Silurana (Xenopus) tropicalis embryogenesis and early larval development. Comp. Biochem. Physiol. Part C Toxicol. Pharmacol. 2010, 152, 202–206. [Google Scholar] [CrossRef]
- Zhou, Y.; Zhong, H.; Liu, S.; Yu, F.; Hu, J.; Zhang, C.; Tao, M.; Liu, Y. Elevated expression of Piwi and piRNAs in ovaries of triploid crucian carp. Mol. Cell. Endocrinol. 2014, 383, 1–9. [Google Scholar] [CrossRef] [PubMed]
- Pan, Y.; Hu, M.; Liang, H.; Wang, J.-J.; Tang, L.-J. The expression of the PIWI family members miwi and mili in mice testis is negatively affected by estrogen. Cell Tissue Res. 2012, 350, 177–181. [Google Scholar] [CrossRef] [PubMed]
- Lee, E.; University of Adelaide, Adelaide, South Australia, Australia. Personal communication, 2020.
- Zheng, W.; Lu, J.J.; Luo, F.; Zheng, Y.; Feng, Y.-J.; Felix, J.C.; Lauchlan, S.C.; Pike, M.C. Ovarian Epithelial Tumor Growth Promotion by Follicle-Stimulating Hormone and Inhibition of the Effect by Luteinizing Hormone. Gynecol. Oncol. 2000, 76, 80–88. [Google Scholar] [CrossRef]
- Syed, V.; Ulinski, G.; Mok, S.C.; Ho, S.-M. Reproductive hormone-induced, STAT3-mediated interleukin 6 action in normal and malignant human ovarian surface epithelial cells. J. Natl. Cancer Inst. 2002, 94, 617–629. [Google Scholar] [CrossRef]
- Li, D.; Sun, X.; Yan, D.; Huang, J.; Luo, Q.; Tang, H.; Peng, Z. Piwil2 modulates the proliferation and metastasis of colon cancer via regulation of matrix metallopeptidase 9 transcriptional activity. Exp. Biol. Med. 2012, 237, 1231–1240. [Google Scholar] [CrossRef] [PubMed]
- Lee, J.H.; Jung, C.; Javadian-Elyaderani, P.; Schweyer, S.; Schütte, D.; Shoukier, M.; Karimi-Busheri, F.; Weinfeld, M.; Rasouli-Nia, A.; Hengstler, J.G.; et al. Pathways of Proliferation and Antiapoptosis Driven in Breast Cancer Stem Cells by Stem Cell Protein Piwil2. Cancer Res. 2010, 70, 4569–4579. [Google Scholar] [CrossRef] [PubMed] [Green Version]
- Zhang, D.; Wu, X.; Liu, X.; Cai, C.; Zeng, G.; Rohozinski, J.; Zhang, Y.; Wei, G.; He, D. Piwil2-transfected human fibroblasts are cancer stem cell-like and genetically unstable. Oncotarget 2017, 8, 12259. [Google Scholar] [CrossRef] [Green Version]
- Zhang, Z.; Zhu, Y.; Lai, Y.; Wu, X.; Feng, Z.; Yu, Y.; Bast, R.C.; Wan, X.; Xi, X.; Feng, Y. Follicle-stimulating hormone inhibits apoptosis in ovarian cancer cells by regulating the OCT4 stem cell signaling pathway. Int. J. Oncol. 2013, 43, 1194–1204. [Google Scholar] [CrossRef] [Green Version]
- Gera, S.; Kumar, S.S.; Swamy, S.N.; Bhagat, R.; Vadaparty, A.; Gawari, R.; Bhat, R.; Dighe, R.R. Follicle-Stimulating Hormone Is an Autocrine Regulator of the Ovarian Cancer Metastatic Niche Through Notch Signaling. J. Endocr. Soc. 2018, 3, 340–357. [Google Scholar] [CrossRef] [Green Version]
- Feng, D.; Zhao, T.; Yan, K.; Liang, H.; Liang, J.; Zhou, Y.; Zhao, W.; Ling, B. Gonadotropins promote human ovarian cancer cell migration and invasion via a cyclooxygenase 2-dependent pathway. Oncol. Rep. 2017, 38, 1091. [Google Scholar] [CrossRef]
- Mertens-Walker, I.; Bolitho, C.; Baxter, R.C.; Marsh, D.J. Gonadotropin-induced ovarian cancer cell migration and proliferation require extracellular signal-regulated kinase 1/2 activation regulated by calcium and protein kinase Cδ. Endocr. Relat. Cancer 2010, 17, 335. [Google Scholar] [CrossRef] [PubMed] [Green Version]
- Song, K.; Dai, L.; Long, X.; Wang, W.; Di, W. Follicle-stimulating hormone promotes the proliferation of epithelial ovarian cancer cells by activating sphingosine kinase. Sci. Rep. 2020, 10, 1–13. [Google Scholar] [CrossRef] [PubMed]
- Ivarsson, K.; Sundfeldt, K.; Brännström, M.; Hellberg, P.R.; Janson, P.O. Diverse effects of FSH and LH on proliferation of human ovarian surface epithelial cells. Hum. Reprod. 2001, 16, 18–23. [Google Scholar] [CrossRef] [PubMed]
- Bourgeois, D.L.; Kabarowski, K.A.; Porubsky, V.L.; Kreeger, P.K. High-grade serous ovarian cancer cell lines exhibit heterogeneous responses to growth factor stimulation. Cancer Cell Int. 2015, 15, 112. [Google Scholar] [CrossRef]
- Chen, Z.; Che, Q.; He, X.; Wang, F.; Wang, H.; Zhu, M.; Sun, J.; Wan, X. Stem cell protein Piwil1 endowed endometrial cancer cells with stem-like properties via inducing epithelial-mesenchymal transition. BMC Cancer 2015, 15, 811. [Google Scholar] [CrossRef] [Green Version]
- Li, C.; Zhou, X.; Chen, J.; Lu, Y.; Sun, Q.; Tao, D.; Hu, W.; Zheng, X.; Bian, S.; Liu, Y.; et al. PIWIL1 destabilizes microtubule by suppressing phosphorylation at Ser16 and RLIM-mediated degradation of stathmin1. Oncotarget 2015, 6, 27794–27804. [Google Scholar] [CrossRef] [Green Version]
- Qu, X.; Liu, J.; Zhong, X.; Li, X.; Zhang, Q. PIWIL2 promotes progression of non-small cell lung cancer by inducing CDK2 and Cyclin A expression. J. Transl. Med. 2015, 13, 301. [Google Scholar] [CrossRef] [Green Version]
- Jiang, S.; Zhao, L.; Lu, Y.; Wang, M.; Chen, Y.; Tao, D.; Liu, Y.; Sun, H.; Zhang, S.; Ma, Y. Piwil2 inhibits keratin 8 degradation through promoting p38-induced phosphorylation to resist Fas-mediated apoptosis. Mol. Cell. Biol. 2014, 34, 3928–3938. [Google Scholar] [CrossRef] [Green Version]
- Lu, Y.; Zhang, K.; Li, C.; Yao, Y.; Tao, D.; Liu, Y.; Zhang, S.; Ma, Y. Piwil2 Suppresses P53 by Inducing Phosphorylation of Signal Transducer and Activator of Transcription 3 in Tumor Cells. PLoS ONE 2012, 7, e30999. [Google Scholar] [CrossRef]
- Lokman, N.A.; Price, Z.K.; Hawkins, E.K.; Macpherson, A.M.; Oehler, M.K.; Ricciardelli, C. 4-Methylumbelliferone Inhibits Cancer Stem Cell Activation and Overcomes Chemoresistance in Ovarian Cancer. Cancers 2019, 11, 1187. [Google Scholar] [CrossRef] [Green Version]
- Tan, T.Z.; Yang, H.; Ye, J.; Low, J.; Choolani, M.; Tan, D.S.P.; Thiery, J.-P.; Huang, R.Y.-J. CSIOVDB: A microarray gene expression database of epithelial ovarian cancer subtype. Oncotarget 2015, 6, 43843. [Google Scholar] [CrossRef] [PubMed] [Green Version]
- Győrffy, B.; Lánczky, A.; Szállási, Z. Implementing an online tool for genome-wide validation of survival-associated biomarkers in ovarian-cancer using microarray data from 1287 patients. Endocr. Relat. Cancer 2012, 19, 197–208. [Google Scholar] [CrossRef] [PubMed] [Green Version]
- Lokman, N.A.; Elder, A.S.F.; Ricciardelli, C.; Oehler, M.K. Chick Chorioallantoic Membrane (CAM) Assay as an In Vivo Model to Study the Effect of Newly Identified Molecules on Ovarian Cancer Invasion and Metastasis. Int. J. Mol. Sci. 2012, 13, 9959–9970. [Google Scholar] [CrossRef] [PubMed] [Green Version]


| (a) Early Stage HGSOC Patients (FIGO Stage I and II) | |||||||||
|---|---|---|---|---|---|---|---|---|---|
| piRNA Pathway Genes | Progression Free Survival | Post Progression Survival | Overall Survival | ||||||
| HR | 95% CI | p-Value | HR | 95% CI | p-Value | HR | 95% CI | p-Value | |
| PIWIL1 | 0.66 | 0.31–1.4 | 0.27 | 0.33 | 0.11–0.96 | 0.034 | 0.37 | 0.16–0.86 | 0.017 |
| PIWIL2 | 0.55 | 0.25–1.21 | 0.13 | 3.64 | 0.47–28.09 | 0.18 | 2.03 | 0.87–4.78 | 0.097 |
| PIWIL4 | 2 | 0.74–5.4 | 0.16 | 0.17 | 0.02–1.48 | 0.07 | 0.66 | 0.21–2.1 | 0.48 |
| DDX4 | 0.45 | 0.2–1.01 | 0.046 | 0.41 | 0.09–1.88 | 0.24 | 3.51 | 1.02–12.09 | 0.035 |
| HENMT1 | 2.79 | 0.96–8.15 | 0.051 | 4.47 | 0.81–24.55 | 0.059 | 2.33 | 0.7–7.72 | 0.15 |
| MAEL | 4.75 | 1.5–15.08 | 0.0037 | 2.78 | 0.32–24.36 | 0.34 | 2.54 | 0.74–8.69 | 0.12 |
| PLD6 | 0.42 | 0.14–1.29 | 0.12 | 0.3 | 0.04–2.23 | 0.21 | 3.4 | 0.74–15.61 | 0.094 |
| TDRD1 | 0.24 | 0.11–0.5 | 0.000042 | 0.44 | 0.14–1.38 | 0.15 | 0.49 | 0.21–1.17 | 0.1 |
| TDRD9 | 0.6 | 0.2–1.84 | 0.37 | 3.11 | 0.59–16.26 | 0.16 | 0.6 | 0.17–2.08 | 0.42 |
| (b) Late Stage HGSOC Patients (FIGO Stage III) | |||||||||
| PIWIL1 | 0.91 | 0.76–1.08 | 0.27 | 0.68 | 0.55–0.83 | 0.0002 | 0.7 | 0.58–0.85 | 0.00033 |
| PIWIL2 | 1.32 | 1.09–1.61 | 0.0051 | 1.27 | 1–1.6 | 0.048 | 0.88 | 0.73–1.06 | 0.18 |
| PIWIL4 | 1.35 | 1.06–1.72 | 0.015 | 1.25 | 0.94–1.68 | 0.13 | 1.3 | 0.98–1.74 | 0.067 |
| DDX4 | 0.91 | 0.76–1.09 | 0.3 | 1.17 | 0.96–1.43 | 0.11 | 0.88 | 0.72–1.07 | 0.19 |
| HENMT1 | 1.17 | 0.9–1.52 | 0.23 | 1.2 | 0.87–1.66 | 0.27 | 1.28 | 0.93–1.74 | 0.13 |
| MAEL | 1.27 | 1–1.62 | 0.048 | 0.77 | 0.56–1.05 | 0.093 | 0.72 | 0.53–0.99 | 0.041 |
| PLD6 | 1.19 | 0.94–1.51 | 0.15 | 1.18 | 0.88–1.59 | 0.27 | 1.38 | 1.04–1.84 | 0.027 |
| TDRD1 | 0.89 | 0.74–1.08 | 0.24 | 0.84 | 0.67–1.05 | 0.14 | 0.83 | 0.69–1.01 | 0.061 |
| TDRD9 | 1.27 | 1–1.61 | 0.05 | 0.82 | 0.6–1.11 | 0.2 | 1.18 | 0.89–1.56 | 0.24 |
Publisher’s Note: MDPI stays neutral with regard to jurisdictional claims in published maps and institutional affiliations. |
© 2020 by the authors. Licensee MDPI, Basel, Switzerland. This article is an open access article distributed under the terms and conditions of the Creative Commons Attribution (CC BY) license (http://creativecommons.org/licenses/by/4.0/).
Share and Cite
Lee, E.; Lokman, N.A.; Oehler, M.K.; Ricciardelli, C.; Grutzner, F. A Comprehensive Molecular and Clinical Analysis of the piRNA Pathway Genes in Ovarian Cancer. Cancers 2021, 13, 4. https://doi.org/10.3390/cancers13010004
Lee E, Lokman NA, Oehler MK, Ricciardelli C, Grutzner F. A Comprehensive Molecular and Clinical Analysis of the piRNA Pathway Genes in Ovarian Cancer. Cancers. 2021; 13(1):4. https://doi.org/10.3390/cancers13010004
Chicago/Turabian StyleLee, Eunice, Noor A. Lokman, Martin K. Oehler, Carmela Ricciardelli, and Frank Grutzner. 2021. "A Comprehensive Molecular and Clinical Analysis of the piRNA Pathway Genes in Ovarian Cancer" Cancers 13, no. 1: 4. https://doi.org/10.3390/cancers13010004