Circulating miRNA Increases the Diagnostic Accuracy of Chromogranin A in Metastatic Pancreatic Neuroendocrine Tumors

Abstract
:Simple Summary
Abstract
1. Introduction
2. Results
2.1. Evaluation of Cell Contamination Based on miRNA Signature
2.2. Analysis of Circulating miRNAs by Next-Generation Sequencing
2.3. miRNA Validation
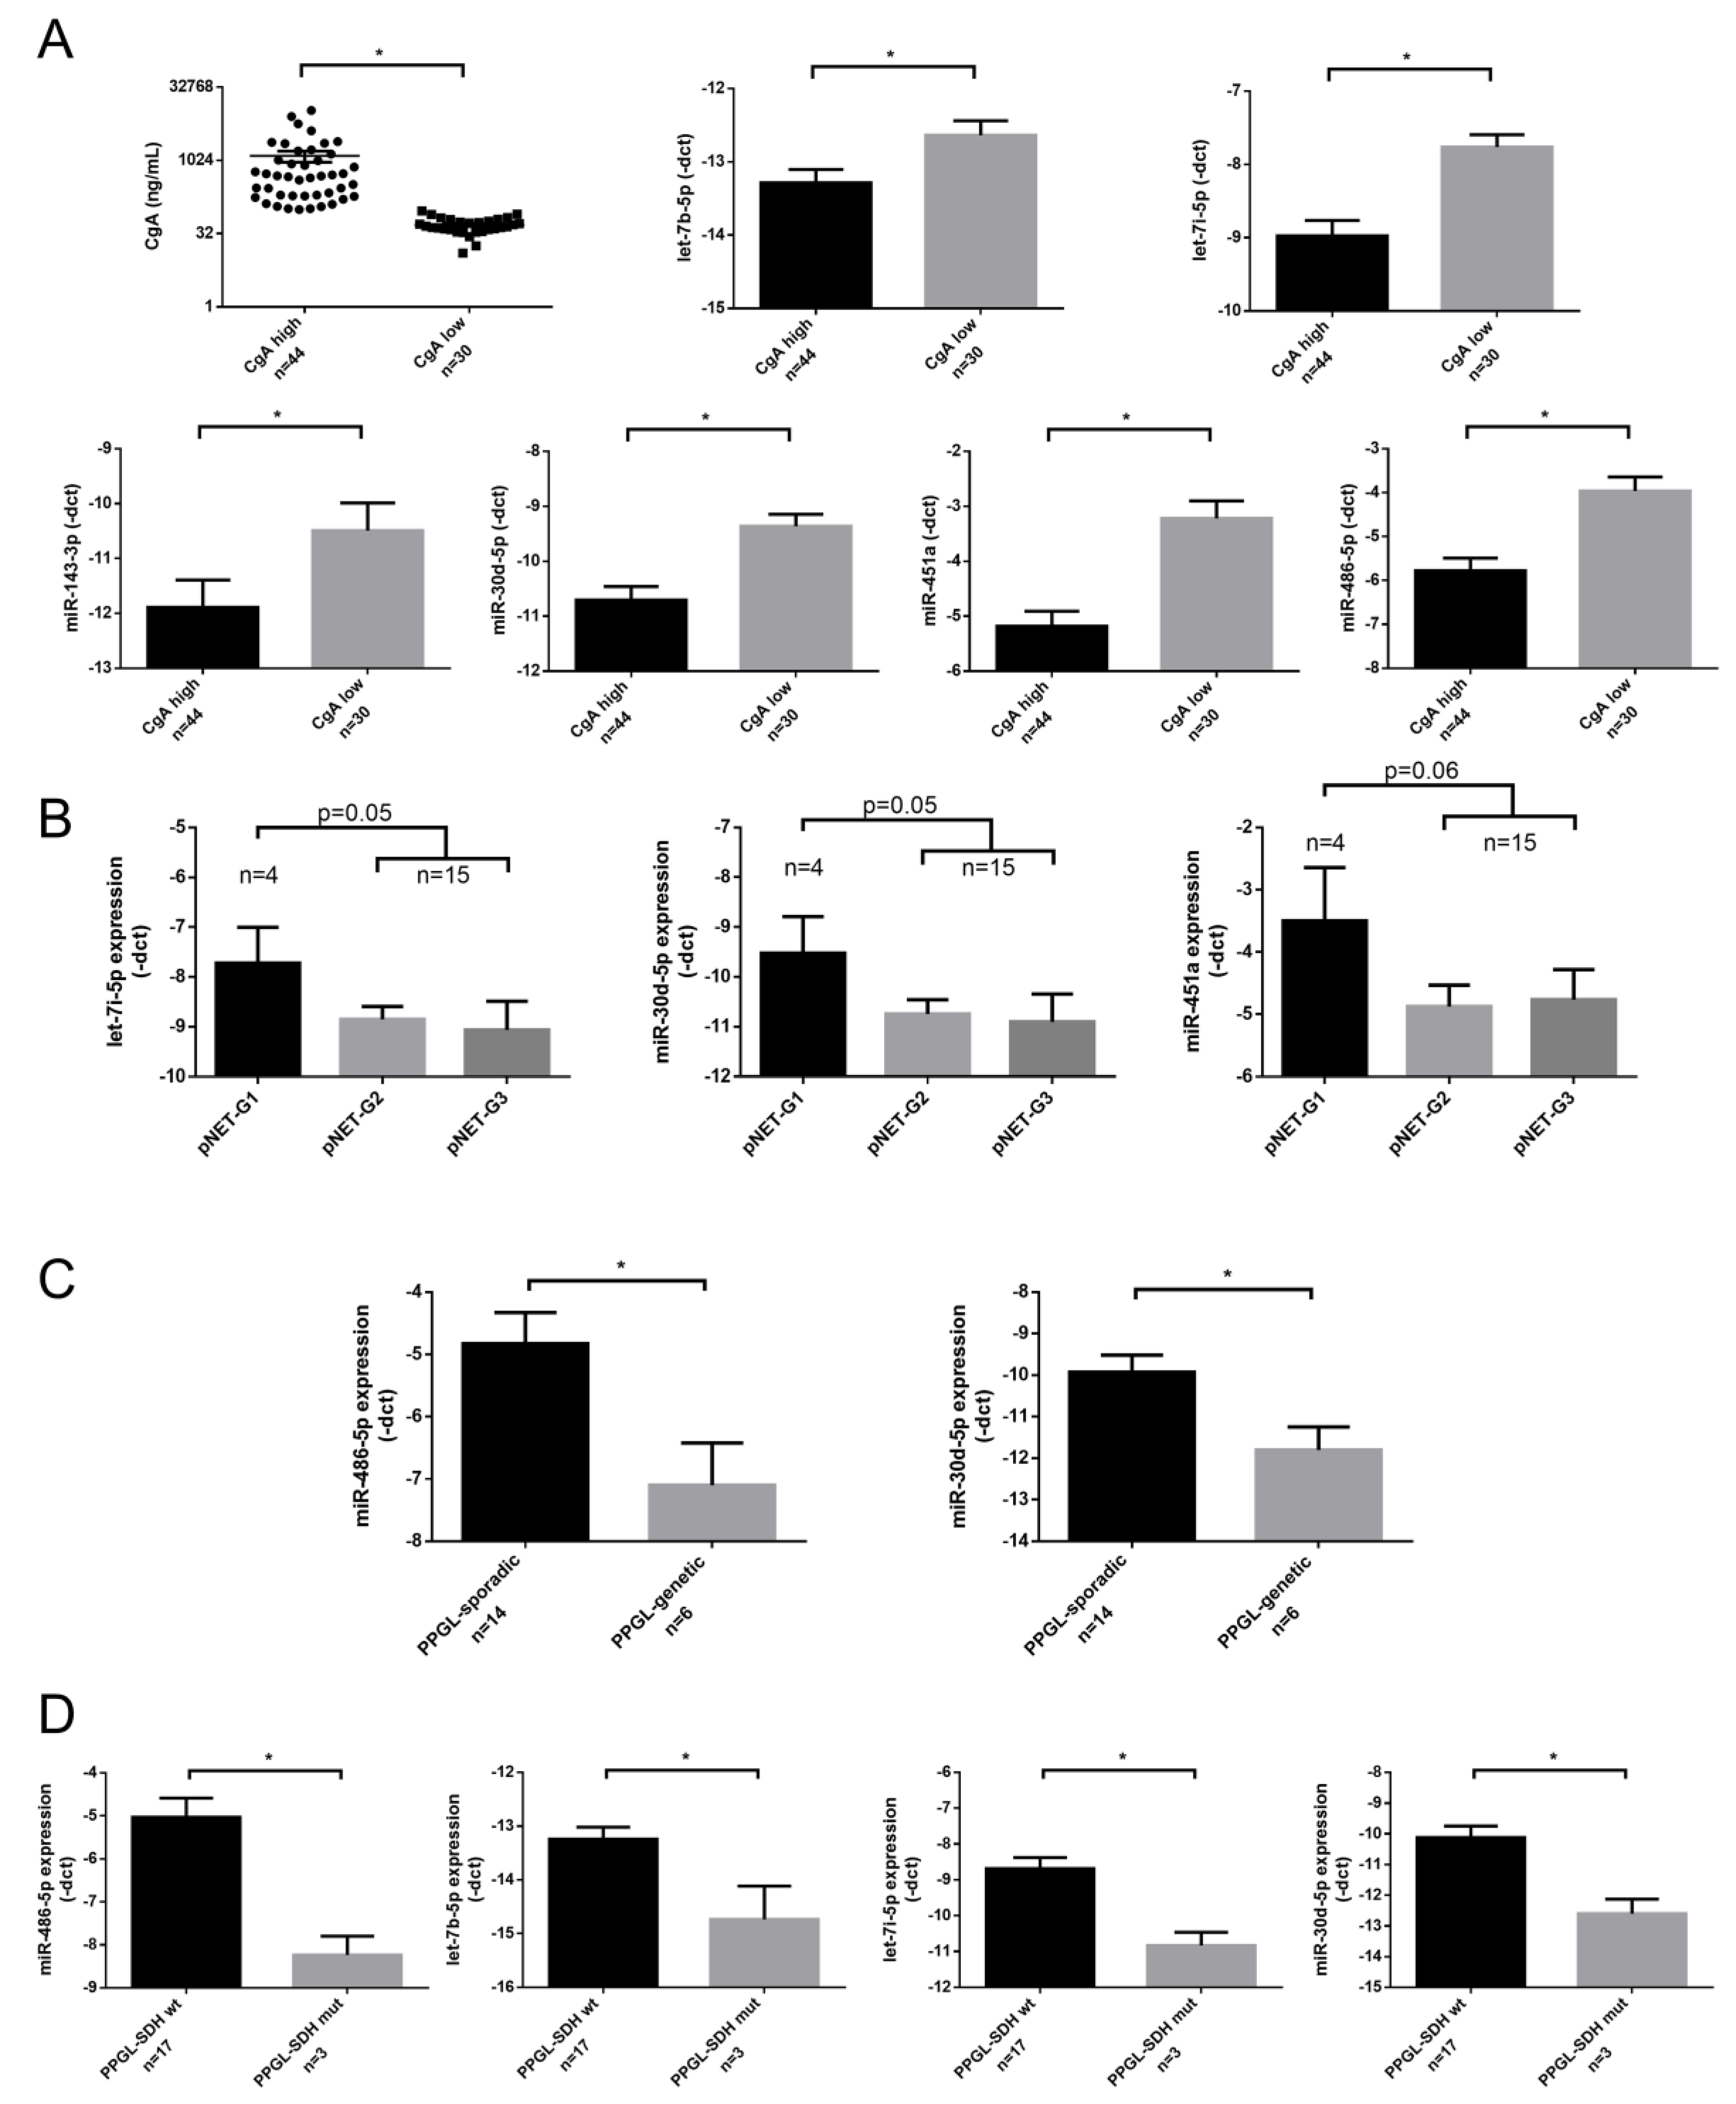
2.4. Association of miRNA Expression with Clinicopathological Parameters
2.5. Diagnostic Value of the Circulating miRNAs in PPGL/pNET
2.6. Analysis of Deregulated pNET/PPGL Tissue miRNAs in Serum Samples
3. Discussion
4. Materials and Methods
4.1. Patients and Controls
4.2. Sample Handling and RNA Extraction
4.3. miRNA Expression Profiling by Next-Generation Sequencing
4.4. RT-qPCR Validation of NGS Results
4.5. Literature Mining for Tissue-Serum miRNA Expression Cross-Referencing
4.6. Statistical Analysis
5. Conclusions
Author Contributions
Funding
Acknowledgments
Conflicts of Interest
Abbreviations
| AUC | area under curve |
| CgA | chromogranin A |
| miRNA | micro-RNA |
| MYC | MYC proto-oncogene, bHLH transcription factor |
| NET | Neuroendocrine tumors |
| NF1 | neurofibromin 1 |
| NF-NET | nonfunctioning neuroendocrine tumor |
| NGS | next-generation sequencing |
| PCC | pheochromocytoma |
| PGL | paragangliomas |
| pNET | pancreatic neuroendocrine tumor |
| PPGL | pheochromocytoma-paraganglioma |
| PPI | proton-pump inhibitor |
| RET | ret proto-oncogene |
| RIA | radioimmunoassay |
| ROC | receiver-operating characteristic |
| SDHB | succinate dehydrogenase complex iron-sulfur subunit B |
| UMI | unique molecular index |
| VHL | von Hippel–Lindau tumor suppressor |
| VIPoma | vasoactive intestinal peptide producing neuroendocrine tumor |
References
- Modlin, I.; Gustafsson, B.I.; Moss, S.F.; Pavel, M.; Tsolakis, A.V.; Kidd, M. Chromogranin A—Biological Function and Clinical Utility in Neuro Endocrine Tumor Disease. Ann. Surg. Oncol. 2010, 17, 2427–2443. [Google Scholar] [CrossRef] [PubMed]
- Yao, J.C.; Hassan, M.; Phan, A.; Dagohoy, C.; Leary, C.; Mares, J.E.; Abdalla, E.K.; Fleming, J.B.; Vauthey, J.-N.; Rashid, A.; et al. One Hundred Years After “Carcinoid”: Epidemiology of and Prognostic Factors for Neuroendocrine Tumors in 35,825 Cases in the United States. J. Clin. Oncol. 2008, 26, 3063–3072. [Google Scholar] [CrossRef] [PubMed] [Green Version]
- Dasari, A.; Shen, C.; Halperin, D.M.; Zhao, B.; Zhou, S.; Xu, Y.; Shih, T.; Yao, J.C. Trends in the Incidence, Prevalence, and Survival Outcomes in Patients With Neuroendocrine Tumors in the United States. JAMA Oncol. 2017, 3, 1335–1342. [Google Scholar] [CrossRef] [PubMed]
- Ro, C.; Chai, W.; Yu, V.E.; Yu, R. Pancreatic neuroendocrine tumors: Biology, diagnosis, and treatment. Chin. J. Cancer 2013, 32, 312–324. [Google Scholar] [CrossRef] [Green Version]
- Bílek, R.; Vlcek, P.; Šafařík, L.; Michalský, D.; Novák, K.; Dušková, J.; Vaclavikova, E.; Widimský, J.J.; Zelinka, T.; Widimský, J. Chromogranin A in the Laboratory Diagnosis of Pheochromocytoma and Paraganglioma. Cancers 2019, 11, 586. [Google Scholar] [CrossRef] [Green Version]
- Gkolfinopoulos, S.; Tsapakidis, K.; Papadimitriou, K.; Papamichael, D.; Kountourakis, P. Chromogranin A as a valid marker in oncology: Clinical application or false hopes? World J. Methodol. 2017, 7, 9–15. [Google Scholar] [CrossRef]
- Ozaslan, E.; Karacan, H.; Simsek, Y.; Bayram, F. An Overview of Neuroendocrine Tumour Markers. Turk. J. Endocrinol. Metab. 2014, 18, 132–136. [Google Scholar] [CrossRef] [Green Version]
- Nobels, F.R.E.; Kwekkeboom, D.J.; Coopmans, W.; Schoenmakers, C.H.H.; Lindemans, J.; De Herder, W.W.; Krenning, E.P.; Bouillon, R.; Lamberts, S.W.J. Chromogranin A as Serum Marker for Neuroendocrine Neoplasia: Comparison with Neuron-Specific Enolase and the ?-Subunit of Glycoprotein Hormones. J. Clin. Endocrinol. Metab. 1997, 82, 2622–2628. [Google Scholar] [CrossRef] [Green Version]
- Di Giacinto, P.; Rota, F.; Rizza, L.; Campana, D.; Isidori, A.M.; Lania, A.; Lenzi, A.; Zuppi, P.; Baldelli, R. Chromogranin A: From Laboratory to Clinical Aspects of Patients with Neuroendocrine Tumors. Int. J. Endocrinol. 2018, 2018, 8126087. [Google Scholar] [CrossRef]
- Mosli, H.H.; Dennis, A.; Kocha, W.; Asher, L.J.; Van Uum, S.H.M. Effect of Short-Term Proton Pump Inhibitor Treatment and Its Discontinuation on Chromogranin A in Healthy Subjects. J. Clin. Endocrinol. Metab. 2012, 97, E1731–E1735. [Google Scholar] [CrossRef] [Green Version]
- Pregun, I.; Herszényi, L.; Juhasz, M.; Miheller, P.; Hritz, I.; Patocs, A.; Rácz, K.; Tulassay, Z. Effect of Proton-Pump Inhibitor Therapy on Serum Chromogranin A Level. Digestion 2011, 84, 22–28. [Google Scholar] [CrossRef] [PubMed]
- Hofland, J.; Zandee, W.; De Herder, W.W. Role of biomarker tests for diagnosis of neuroendocrine tumours. Nat. Rev. Endocrinol. 2018, 14, 656–669. [Google Scholar] [CrossRef] [PubMed]
- Mjønes, P.G.; Sagatun, L.; Nordrum, I.S.; Waldum, H.L. Neuron-Specific Enolase as an Immunohistochemical Marker Is Better Than Its Reputation. J. Histochem. Cytochem. 2017, 65, 687–703. [Google Scholar] [CrossRef] [PubMed]
- Baudin, E.; Gigliotti, A.; Ducreux, M.; Ropers, J.; Comoy, E.; Sabourin, J.C.; Bidart, J.M.; Cailleux, A.F.; Bonacci, R.; Ruffié, P.; et al. Neuron-specific enolase and chromogranin A as markers of neuroendocrine tumours. Br. J. Cancer 1998, 78, 1102–1107. [Google Scholar] [CrossRef]
- Leader, M.; Collins, M.; Patel, J.; Henry, K. Antineuron specific enolase staining reactions in sarcomas and carcinomas: Its lack of neuroendocrine specificity. J. Clin. Pathol. 1986, 39, 1186–1192. [Google Scholar] [CrossRef] [Green Version]
- Tischler, A.S. Molecular and cellular biology of pheochromocytomas and extra-adrenal paragangliomas. Endocr. Pathol. 2006, 17, 321–328. [Google Scholar] [CrossRef]
- Mitchell, P.S.; Parkin, R.K.; Kroh, E.M.; Fritz, B.R.; Wyman, S.K.; Pogosova-Agadjanyan, E.L.; Peterson, A.; Noteboom, J.; O’Briant, K.C.; Allen, A.; et al. Circulating microRNAs as stable blood-based markers for cancer detection. Proc. Natl. Acad. Sci. USA 2008, 105, 10513–10518. [Google Scholar] [CrossRef] [Green Version]
- Wang, H.; Peng, R.; Wang, J.; Qin, Z.; Xue, L. Circulating microRNAs as potential cancer biomarkers: The advantage and disadvantage. Clin. Epigenet. 2018, 10, 59. [Google Scholar] [CrossRef] [Green Version]
- Malczewska, A.; Kidd, M.; Matar, S.; Kos-Kudła, B.; Modlin, I. A Comprehensive Assessment of the Role of miRNAs as Biomarkers in Gastroenteropancreatic Neuroendocrine Tumors. Neuroendocrinology 2018, 107, 73–90. [Google Scholar] [CrossRef]
- Zatelli, M.C.; Grossrubatscher, E.M.; Guadagno, E.; Sciammarella, C.; Faggiano, A.; Colao, A. Circulating tumor cells and miRNAs as prognostic markers in neuroendocrine neoplasms. Endocr. Relat. Cancer 2017, 24, R223–R237. [Google Scholar] [CrossRef]
- Modlin, I.; Drozdov, I.; Alaimo, D.; Callahan, S.; Teixiera, N.; Bodei, L.; Kidd, M. A multianalyte PCR blood test outperforms single analyte ELISAs (chromogranin A, pancreastatin, neurokinin A) for neuroendocrine tumor detection. Endocr. Relat. Cancer 2014, 21, 615–628. [Google Scholar] [CrossRef] [PubMed]
- Shah, J.S.; Soon, P.S.; Marsh, D.J. Comparison of Methodologies to Detect Low Levels of Hemolysis in Serum for Accurate Assessment of Serum microRNAs. PLoS ONE 2016, 11, e0153200. [Google Scholar] [CrossRef] [PubMed]
- Pritchard, C.C.; Cheng, H.H.; Tewari, M. MicroRNA profiling: Approaches and considerations. Nat. Rev. Genet. 2012, 13, 358–369. [Google Scholar] [CrossRef] [PubMed]
- Pritchard, C.C.; Kroh, E.; Wood, B.; Arroyo, J.D.; Dougherty, K.J.; Miyaji, M.M.; Tait, J.F.; Tewari, M. Blood cell origin of circulating microRNAs: A cautionary note for cancer biomarker studies. Cancer Prev. Res. 2011, 5, 492–497. [Google Scholar] [CrossRef] [Green Version]
- Cheng, H.H.; Yi, H.S.; Kim, Y.; Kroh, E.M.; Chien, J.W.; Eaton, K.D.; Goodman, M.T.; Tait, J.F.; Tewari, M.; Pritchard, C.C. Plasma Processing Conditions Substantially Influence Circulating microRNA Biomarker Levels. PLoS ONE 2013, 8, e64795. [Google Scholar] [CrossRef] [Green Version]
- Németh, K.; Darvasi, O.; Likó, I.; Szücs, N.; Czirják, S.; Reiniger, L.; Szabó, B.; Krokker, L.; Pállinger, É.; Igaz, P.; et al. Comprehensive Analysis of Circulating miRNAs in the Plasma of Patients With Pituitary Adenomas. J. Clin. Endocrinol. Metab. 2019, 104, 4151–4168. [Google Scholar] [CrossRef]
- Patterson, E.; Webb, R.; Weisbrod, A.; Bian, B.; He, M.; Zhang, L.; Holloway, A.K.; Krishna, R.; Nilubol, N.; Pacak, K.; et al. The microRNA expression changes associated with malignancy and SDHB mutation in pheochromocytoma. Endocr. Relat. Cancer 2012, 19, 157–166. [Google Scholar] [CrossRef] [Green Version]
- Tömböl, Z.; Éder, K.; Kovács, A.; Szabó, P.M.; Kulka, J.; Likó, I.; Zalatnai, A.; Rácz, G.; Tóth, M.; Patócs, A.; et al. MicroRNA expression profiling in benign (sporadic and hereditary) and recurring adrenal pheochromocytomas. Mod. Pathol. 2010, 23, 1583–1595. [Google Scholar] [CrossRef] [Green Version]
- Jiang, X.; Shan, A.; Su, Y.; Cheng, Y.; Gu, W.; Wang, W.; Ning, G.; Cao, Y. miR-144/451 Promote Cell Proliferation via Targeting PTEN/AKT Pathway in Insulinomas. Endocrinology 2015, 156, 2429–2439. [Google Scholar] [CrossRef] [Green Version]
- Thorns, C.; Schurmann, C.; Gebauer, N.; Wallaschofski, H.; Kümpers, C.; Bernard, V.; Feller, A.C.; Keck, T.; Habermann, J.K.; Begum, N.; et al. Global microRNA profiling of pancreatic neuroendocrine neoplasias. Anticancer Res. 2014, 34, 2249–2254. [Google Scholar]
- Zhou, H.Q.; Chen, Q.C.; Qiu, Z.T.; Tan, W.L.; Mo, C.Q.; Gao, S.W. Integrative microRNA-mRNA and protein-protein interaction analysis in pancreatic neuroendocrine tumors. Eur. Rev. Med. Pharmacol. Sci. 2016, 20, 2842–2852. [Google Scholar] [PubMed]
- Lee, Y.S.; Kim, H.; Kim, H.W.; Lee, J.C.; Paik, K.H.; Kang, J.; Kim, J.; Yoon, Y.S.; Han, H.S.; Sohn, I.; et al. High Expression of MicroRNA-196a Indicates Poor Prognosis in Resected Pancreatic Neuroendocrine Tumor. Medicine 2015, 94, e2224. [Google Scholar] [CrossRef] [PubMed]
- Roldo, C.; Missiaglia, E.; Hagan, J.P.; Falconi, M.; Capelli, P.; Bersani, S.; Calin, G.A.; Volinia, S.; Liu, C.G.; Scarpa, A.; et al. MicroRNA Expression Abnormalities in Pancreatic Endocrine and Acinar Tumors Are Associated With Distinctive Pathologic Features and Clinical Behavior. J. Clin. Oncol. 2006, 24, 4677–4684. [Google Scholar] [CrossRef] [PubMed]
- Grolmusz, V.K.; Kovesdi, A.; Borka, K.; Igaz, P.; Patocs, A. Prognostic relevance of proliferation-related miRNAs in pancreatic neuroendocrine neoplasms. Eur. J. Endocrinol. 2018, 179, 219–228. [Google Scholar] [CrossRef] [Green Version]
- Zimmermann, N.; Knief, J.; Kacprowski, T.; Lazar-Karsten, P.; Keck, T.; Billmann, F.; Schmid, S.; Luley, K.; Lehnert, H.; Brabant, G.; et al. MicroRNA analysis of gastroenteropancreatic neuroendocrine tumors and metastases. Oncotarget 2018, 9, 28379–28390. [Google Scholar] [CrossRef] [Green Version]
- Zong, L.; Meng, L.; Shi, R. Role of miR-101 in pheochromocytoma patients with SDHD mutation. Int. J. Clin. Exp. Pathol. 2015, 8, 1545–1554. [Google Scholar]
- Meyer-Rochow, G.Y.; Jackson, N.E.; Conaglen, J.V.; Whittle, D.E.; Kunnimalaiyaan, M.; Chen, H.; Westin, G.; Sandgren, J.; Stålberg, P.; Khanafshar, E.; et al. MicroRNA profiling of benign and malignant pheochromocytomas identifies novel diagnostic and therapeutic targets. Endocr. Relat. Cancer 2010, 17, 835–846. [Google Scholar] [CrossRef]
- De Cubas, A.A.; Leandro-García, L.J.; Schiavi, F.; Mancikova, V.; Comino-Méndez, I.; Inglada-Pérez, L.; Perez-Martinez, M.; Ibarz, N.; Ximénez-Embún, P.; López-Jiménez, E.; et al. Integrative analysis of miRNA and mRNA expression profiles in pheochromocytoma and paraganglioma identifies genotype-specific markers and potentially regulated pathways. Endocr. Relat. Cancer 2013, 20, 477–493. [Google Scholar] [CrossRef] [Green Version]
- Lu, J.; Getz, G.; Miska, E.A.; Alvarez-Saavedra, E.; Lamb, J.; Peck, D.; Sweet-Cordero, A.; Ebert, B.L.; Mak, R.H.; Ferrando, A.A.; et al. MicroRNA expression profiles classify human cancers. Nature 2005, 435, 834–838. [Google Scholar] [CrossRef]
- Ma, R.; Jiang, T.; Kang, X. Circulating microRNAs in cancer: Origin, function and application. J. Exp. Clin. Cancer Res. 2012, 31, 38. [Google Scholar] [CrossRef] [Green Version]
- Aakko, S.; Straume, A.H.; Birkeland, E.E.; Chen, P.; Qiao, X.; ’Lønning, P.E.; Kallio, M. MYC-Induced miR-203b-3p and miR-203a-3p Control Bcl-xL Expression and Paclitaxel Sensitivity in Tumor Cells. Transl. Oncol. 2018, 12, 170–179. [Google Scholar] [CrossRef] [PubMed]
- Shen, M.; Dong, C.; Ruan, X.; Yan, W.; Cao, M.; Pizzo, D.; Wu, X.; Yang, L.; Liu, L.; Ren, X.; et al. Chemotherapy-Induced Extracellular Vesicle miRNAs Promote Breast Cancer Stemness by Targeting ONECUT2. Cancer Res. 2019, 79, 3608–3621. [Google Scholar] [CrossRef] [PubMed]
- An, N.; Zheng, B. MiR-203a-3p Inhibits Pancreatic Cancer Cell Proliferation, EMT, and Apoptosis by Regulating SLUG. Technol. Cancer Res. Treat. 2020, 19, 1533033819898729. [Google Scholar] [CrossRef] [PubMed]
- Chen, L.; Gao, H.; Liang, J.; Qiao, J.; Duan, J.; Shi, H.; Zhen, T.; Li, H.; Zhang, F.; Zhu, Z.; et al. miR-203a-3p promotes colorectal cancer proliferation and migration by targeting PDE4D. Am. J. Cancer Res. 2018, 8, 2387–2401. [Google Scholar]
- Di, C.; Jiang, Y.; Li, M.; Juan, X.; Xu, C. Circulating Exosomal microRNA Signature As a Noninvasive Biomarker for Diagnosis of Diffuse Large B-Cell Lymphoma. Blood 2018, 132, 5406. [Google Scholar] [CrossRef]
- Huang, Z.; Chen, W.; Du, Y.; Guo, Q.; Mao, Y.; Zhou, X.; Hua, D. Serum miR-16 as a potential biomarker for human cancer diagnosis: Results from a large-scale population. J. Cancer Res. Clin. Oncol. 2019, 145, 787–796. [Google Scholar] [CrossRef]
- Barakat, M.T.; Meeran, K.; Bloom, S.R. Neuroendocrine tumours. Endocr. Relat. Cancer 2004, 11, 1–18. [Google Scholar] [CrossRef]
- Klöppel, S.; Couvelard, A.; Perren, A.; Komminoth, P.; McNicol, A.M.; Nilsson, O.; Scarpa, A.; Scoazec, J.Y.; Wiedenmann, B.; Papotti, M.; et al. ENETS Consensus Guidelines for the Standards of Care in Neuroendocrine Tumors: Towards a Standardized Approach to the Diagnosis of Gastroenteropancreatic Neuroendocrine Tumors and Their Prognostic Stratification. Neuroendocrinology 2008, 90, 162–166. [Google Scholar] [CrossRef] [Green Version]
- Li, M.; Song, Q.; Song, Q.; Li, H.; Lou, Y.; Wang, L. Circulating miR-25-3p and miR-451a May Be Potential Biomarkers for the Diagnosis of Papillary Thyroid Carcinoma. PLoS ONE 2015, 10, e0132403. [Google Scholar]
- Lario, S.; Brunet-Vega, A.; Quílez, M.E.; Ramírez-Lázaro, M.J.; Lozano, J.J.; Garcia-Martinez, L.; Pericay, C.; Miquel, M.; Junquera, F.; Campo, R.; et al. Expression profile of circulating microRNAs in the Correa pathway of progression to gastric cancer. United Eur. Gastroenterol. J. 2018, 6, 691–701. [Google Scholar] [CrossRef]
- Miyashita, Y.; Ishikawa, K.; Fukushima, Y.; Kouwaki, T.; Nakamura, K.; Oshiumi, H. Immune-regulatory microRNA expression levels within circulating extracellular vesicles correspond with the appearance of local symptoms after seasonal flu vaccination. PLoS ONE 2019, 14, e0219510. [Google Scholar] [CrossRef] [PubMed]
- Chirshev, E.; Oberg, K.C.; Ioffe, Y.J.; Unternaehrer, J. Let -7 as biomarker, prognostic indicator, and therapy for precision medicine in cancer. Clin. Transl. Med. 2019, 8, 24. [Google Scholar] [CrossRef] [PubMed] [Green Version]
- Yu, L.X.; Zhang, B.L.; Yang, Y.; Wang, M.C.; Lei, G.L.; Gao, Y.; Liu, H.; Xiao, C.H.; Xu, J.J.; Qin, H.; et al. Exosomal microRNAs as potential biomarkers for cancer cell migration and prognosis in hepatocellular carcinoma patient-derived cell models. Oncol. Rep. 2018, 41, 257–269. [Google Scholar] [CrossRef] [PubMed] [Green Version]
- Li, A.; Yu, J.; Kim, H.; Wolfgang, C.L.; Canto, M.I.; Hruban, R.H.; Goggins, M. MicroRNA array analysis finds elevated serum miR-1290 accurately distinguishes patients with low-stage pancreatic cancer from healthy and disease controls. Clin. Cancer Res. 2013, 19, 3600–3610. [Google Scholar] [CrossRef] [Green Version]
- Vicentini, C.; Calore, F.; Nigita, G.; Fadda, P.; Simbolo, M.; Sperandio, N.; Luchini, C.; Lawlor, R.T.; Croce, C.M.; Corbo, V.; et al. Exosomal miRNA signatures of pancreatic lesions. BMC Gastroenterol. 2020, 20, 137. [Google Scholar] [CrossRef]
- Calsina, B.; Castro-Vega, L.J.; Torres-Pérez, R.; Inglada-Pérez, L.; Currás-Freixes, M.; Roldán-Romero, J.M.; Mancikova, V.; Letón, R.; Remacha, L.; Santos, M.; et al. Integrative multi-omics analysis identifies a prognostic miRNA signature and a targetable miR-21-3p/TSC2/mTOR axis in metastatic pheochromocytoma/paraganglioma. Theranostics 2019, 9, 4946–4958. [Google Scholar] [CrossRef]
- Ruff, S.M.; Ayabe, R.I.; Malekzadeh, P.; Good, M.L.; Wach, M.M.; Gonzales, M.K.; Tirosh, A.; Nilubol, N.; Pacak, K.; Kebebew, E.; et al. MicroRNA-210 May Be a Preoperative Biomarker of Malignant Pheochromocytomas and Paragangliomas. J. Surg. Res. 2019, 243, 1–7. [Google Scholar] [CrossRef]
- Lloyd, R.V.; Osamura, R.Y.; Klöppel, G.; Rosai, J. WHO Classification of Tumours of Endocrine Organs. Available online: https://publications.iarc.fr/Book-And-Report-Series/Who-Classification-Of-Tumours/WHO-Classification-Of-Tumours-Of-Endocrine-Organs-2017 (accessed on 18 May 2020).
- Krokker, L.; Nyírő, G.; Reiniger, L.; Darvasi, O.; Szücs, N.; Czirják, S.; Tóth, M.; Igaz, P.; Patócs, A.; Butz, H. Differentially Expressed miRNAs Influence Metabolic Processes in Pituitary Oncocytoma. Neurochem. Res. 2019, 44, 2360–2371. [Google Scholar] [CrossRef] [Green Version]
- Tam, S.; Tsao, M.; McPherson, J.D. Optimization of miRNA-seq data preprocessing. Brief. Bioinform. 2015, 16, 950–963. [Google Scholar] [CrossRef] [Green Version]
- Liu, J.; Gao, J.; Du, Y.; Li, Z.; Ren, Y.; Gu, J.; Wang, X.; Gong, Y.; Wang, W.; Kong, X. Combination of plasma microRNAs with serum CA19-9 for early detection of pancreatic cancer. Int. J. Cancer 2011, 131, 683–691. [Google Scholar] [CrossRef]
- Pesta, M.; Kucera, R.; Topolčan, O.; Karlikova, M.; Houfkova, K.; Polivka, J.; Macanova, T.; Machová, I.; Slouka, D.; Kulda, V. Plasma microRNA Levels Combined with CEA and CA19-9 in the Follow-Up of Colorectal Cancer Patients. Cancers 2019, 11, 864. [Google Scholar] [CrossRef] [PubMed] [Green Version]


| miRNA | ANOVA p-Value | pNET vs. Control&PPI | PGGL vs. Control&PPI | pNET vs. PPGL | |||
|---|---|---|---|---|---|---|---|
| log2FC | Post-hoc p-Value | log2FC | Post-hoc p-Value | log2FC | Post-hoc p-Value | ||
| hsa-miR-223-3p | 0.0015 | −1.62 | 0.0304 | −2.27 | 0.0235 | 0.65 | 1 |
| hsa-miR-486-3p | 0.0002 | −1.56 | 0.0177 | −2.51 | 0.0066 | 0.95 | 1 |
| hsa-miR-451a | 0.0003 | −1.42 | 0.0257 | −2.35 | 0.0058 | 0.93 | 1 |
| hsa-miR-16-5p | 0.0009 | −1.48 | 0.0320 | −2.00 | 0.0139 | 0.52 | 1 |
| hsa-miR-25-3p | 0.0001 | −1.48 | 0.0153 | −2.10 | 0.0054 | 0.62 | 1 |
| hsa-miR-143-3p | 0.0001 | −1.35 | 0.0240 | −2.34 | 0.0031 | 1.00 | 1 |
| hsa-miR-101-3p | 0.0040 | −1.31 | 0.0823 | −1.90 | 0.0273 | 0.60 | 1 |
| hsa-miR-486-5p | 0.0005 | −1.27 | 0.0413 | −2.50 | 0.0066 | 1.23 | 1 |
| hsa-miR-425-5p | 0.0000 | −1.23 | 0.0178 | −2.23 | 0.0024 | 0.99 | 1 |
| hsa-miR-148a-3p | 0.0010 | −1.25 | 0.0322 | −1.82 | 0.0146 | 0.57 | 1 |
| hsa-miR-93-5p | 0.0003 | −1.29 | 0.0240 | −1.97 | 0.0066 | 0.68 | 1 |
| hsa-let-7g-5p | 0.0000 | −1.14 | 0.0178 | −2.20 | 0.0024 | 1.06 | 1 |
| hsa-let-7i-5p | 0.0003 | −1.06 | 0.0316 | −1.89 | 0.0055 | 0.83 | 1 |
| hsa-miR-92a-3p | 0.0004 | −1.05 | 0.0440 | −2.05 | 0.0060 | 1.01 | 1 |
| hsa-let-7a-5p | 0.0003 | −1.00 | 0.0235 | −1.66 | 0.0064 | 0.66 | 1 |
| hsa-miR-185-5p | 0.0008 | −1.02 | 0.0859 | −2.23 | 0.0079 | 1.22 | 1 |
| hsa-miR-342-3p | 0.0029 | −0.97 | 0.0624 | −1.63 | 0.0249 | 0.66 | 1 |
| hsa-miR-30e-5p | 0.0001 | −0.93 | 0.0295 | −1.77 | 0.0031 | 0.84 | 1 |
| hsa-miR-142-3p | 0.0055 | −0.85 | 0.1610 | −1.71 | 0.0287 | 0.86 | 1 |
| hsa-miR-30d-5p | 0.0015 | −0.88 | 0.0432 | −1.57 | 0.0165 | 0.69 | 1 |
| hsa-let-7b-5p | 0.0029 | −0.84 | 0.0539 | −1.51 | 0.0261 | 0.67 | 1 |
| hsa-let-7f-5p | 0.0007 | −0.75 | 0.0475 | −1.41 | 0.0081 | 0.66 | 1 |
| hsa-miR-199a-3p | 0.0069 | −0.77 | 0.1009 | −1.47 | 0.0375 | 0.70 | 1 |
| hsa-miR-103a-3p | 0.0003 | −0.74 | 0.0371 | −1.38 | 0.0055 | 0.63 | 1 |
| hsa-miR-26b-5p | 0.0003 | −0.65 | 0.0424 | −1.31 | 0.0054 | 0.66 | 1 |
| hsa-miR-6743-3p | 0.0002 | 0.61 | 0.0179 | 0.45 | 0.0054 | 0.15 | 1 |
| hsa-miR-4440 | 0.0000 | 0.65 | 0.0107 | 0.54 | 0.0031 | 0.11 | 1 |
| hsa-miR-6717-5p | 0.0000 | 0.66 | 0.0009 | 0.43 | 0.0007 | 0.23 | 1 |
| hsa-miR-148a-5p | 0.0000 | 0.89 | 0.0067 | 0.59 | 0.0054 | 0.30 | 1 |
| hsa-miR-7155-5p | 0.0002 | 0.96 | 0.0071 | 0.31 | 0.0358 | 0.65 | 1 |
| hsa-miR-203a-3p | 0.0006 | 1.54 | 0.0716 | 2.07 | 0.0066 | −0.54 | 1 |
| hsa-miR-6857-3p | 0.0071 | 2.67 | 0.0316 | 0.49 | 0.6878 | 2.18 | 1 |
| hsa-miR-4274 | 0.0055 | 3.09 | 0.0279 | 1.23 | 0.6318 | 1.86 | 1 |
| All Samples | |||
| Correlation | Sample Number | Spearman | p-value |
| CgA & hsa-let-7b-5p | 74 | −0.29 | 0.0125 |
| CgA & hsa-let-7i-5p | 74 | −0.46 | 0.0000 |
| CgA & hsa-miR-143-3p | 74 | −0.34 | 0.0029 |
| CgA & hsa-miR-30d-5p | 74 | −0.39 | 0.0007 |
| CgA & hsa-miR-451a | 74 | −0.50 | 0.0000 |
| CgA & hsa-miR-486-5p | 74 | −0.39 | 0.0006 |
| Healthy Controls (with & without PPI) | |||
| Correlation | Sample number | Spearman | p-value |
| CgA & hsa-let-7b-5p | 29 | −0.27 | 0.1599 |
| CgA & hsa-let-7i-5p | 29 | −0.42 | 0.0249 |
| CgA & hsa-miR-143-3p | 29 | −0.40 | 0.0293 |
| CgA & hsa-miR-30d-5p | 29 | −0.39 | 0.0377 |
| CgA & hsa-miR-451a | 29 | −0.40 | 0.0334 |
| CgA & hsa-miR-486-5p | 29 | −0.17 | 0.3852 |
| PPGL | |||
| Correlation | Sample number | Spearman | p-value |
| CgA & hsa-let-7b-5p | 20 | −0.05 | 0.8256 |
| CgA & hsa-let-7i-5p | 20 | −0.42 | 0.0655 |
| CgA & hsa-miR-143-3p | 20 | −0.37 | 0.1069 |
| CgA & hsa-miR-30d-5p | 20 | −0.35 | 0.1317 |
| CgA & hsa-miR-451a | 20 | -0.38 | 0.1009 |
| CgA & hsa-miR-486-5p | 20 | -0.45 | 0.0451 |
| pNET | |||
| Correlation | Sample number | Spearman | p-value |
| CgA & hsa-let-7b-5p | 25 | −0.04 | 0.8380 |
| CgA & hsa-let-7i-5p | 25 | −0.22 | 0.2838 |
| CgA & hsa-miR-143-3p | 25 | −0.14 | 0.5116 |
| CgA & hsa-miR-30d-5p | 25 | −0.02 | 0.9157 |
| CgA & hsa-miR-451a | 25 | −0.32 | 0.1198 |
| CgA & hsa-miR-486-5p | 25 | −0.18 | 0.3892 |
| PPGL vs. Controls with & without PPI treatment | AUC | Cutoff * | Sensitivity % | Specificity % | p-value | |
|---|---|---|---|---|---|---|
| CgA | 0.890 | >102.3 | 95.0 | 72.4 | <0.0001 | |
| Individual miRNAs | hsa-let-7b-5p | 0.707 | >12.5 | 90.0 | 48.3 | 0.0147 |
| hsa-let-7i-5p | 0.710 | >5.7 | 100.0 | 3.4 | 0.0135 | |
| hsa-miR-143-3p | 0.598 | >7.7 | 100.0 | 27.6 | 0.2463 | |
| hsa-miR-30d-5p | 0.643 | >9.9 | 65.0 | 65.5 | 0.0914 | |
| miR-451a | 0.678 | >5.8 | 45.0 | 86.2 | 0.0353 | |
| miR-486-5p | 0.660 | >7.3 | 30.0 | 96.6 | 0.0586 | |
| Binary logistic regression model | AUC | cut-off ** | Sensitivity % | Specificity % | p-value | |
| Best of all combinations | CgA+hsa-let-7b-5p+hsa-miR-143-3p+hsa-miR-486-5p | 0.862 | 0.4 | 85.0 | 82.8 | 0.0085 |
| pNET vs. Controls with & without PPI treatment | AUC | cut-off * | Sensitivity % | Specificity % | p-value | |
| CgA | 0.672 | >102.5 | 64.0 | 72.4 | 0.0308 | |
| Individual miRNAs | hsa-let-7b-5p | 0.702 | >12.9 | 80.0 | 62.1 | 0.0111 |
| hsa-let-7i-5p | 0.661 | >7.9 | 80.0 | 51.7 | 0.0433 | |
| hsa-miR-143-3p | 0.661 | >9.0 | 100.0 | 41.4 | 0.0433 | |
| hsa-miR-30d-5p | 0.675 | >9.7 | 76.0 | 62.1 | 0.0276 | |
| miR-451a | 0.692 | >2.9 | 96.0 | 41.4 | 0.0159 | |
| miR-486-5p | 0.712 | >4.2 | 88.0 | 58.6 | 0.0078 | |
| Binary logistic regression model | AUC | cut-off** | Sensitivity % | Specificity % | p-value | |
| Best of all combinations | CgA+hsa-let-7b-5p+hsa-let-7i-5p+hsa-miR-143-3p+hsa-miR-30d-5p | 0.752 | 0.5 | 75.9 | 68.0 | 0.0351 |
| CgA low pNET vs. Controls with & without PPI treatment | AUCa | cut-off * | Sensitivity % | Specificity % | p-value | |
| CgA | 0.613 | <79.6 | 100.0 | 37.9 | 0.3112 | |
| Individual miRNAs | hsa-let-7b-5p | 0.651 | >12.9 | 77.8 | 62.1 | 0.1751 |
| hsa-let-7i-5p | 0.517 | <8.8 | 100.0 | 20.7 | 0.8772 | |
| hsa-miR-143-3p | 0.646 | >9.9 | 100.0 | 48.3 | 0.1920 | |
| hsa-miR-30d-5p | 0.577 | >9.4 | 77.8 | 55.2 | 0.4923 | |
| miR-451a | 0.527 | >2.9 | 88.9 | 41.4 | 0.8101 | |
| miR-486-5p | 0.561 | >4.2 | 66.7 | 58.6 | 0.5828 | |
| Binary logistic regression model | AUC | cut-off ** | Sensitivity % | Specificity % | p-value | |
| Best of all combinations | CgA+hsa-let-7b-5p+hsa-let-7i-5p+hsa-miR-143-3p+hsa-miR-30d-5p+hsa-miR-486-5p | 0.904 | 0.55 | 66.7 | 96.6 | 0.0342 |
| pNET | |||||
|---|---|---|---|---|---|
| miRNA | Corrected p-Value | Controls | pNET | Reference | |
| avg. UMI Read Number | |||||
| miR-103a-3p | 0.0371 | 109 | 65 | Roldo et al., 2006 [33] | overexpressed in pNET+PACC vs. NP |
| Zimmermann et al., 2018 [35] | negative correlation with Ki-67 in GEP-NET | ||||
| miR-26b-5p | 0.0423 | 115 | 73 | Roldo et al., 2006 [33] | overexpressed in pNET+PACC vs. NP |
| miR-143-3p | 0.0240 | 110 | 43 | Jiang et al., 2015 [29] | overexpressed in INS vs pancreatic islet |
| miR-451a | 0.0257 | 198 | 74 | Jiang et al., 2015 [29] | overexpressed in INS vs pancreatic islet |
| miR-25 | 0.0153 | 383 | 138 | Zimmermann et al., 2018 [35] | overexpressed in nodal met. vs. primary GEP-NET |
| miR-425-5p | 0.01781 | 111 | 47 | Zimmermann et al., 2018 [35] | overexpressed in nodal met. vs. primary GEP-NET |
| miR-93-5p | 0.0240 | 286 | 117 | Grolmusz et al., 2018 [34] | higher expression in higher grade pNET |
| miR-16-5p | 0.0320 | 9670 | 3475 | Zimmermann et al., 2018 [35] | negative correlation with Ki-67 in GEP-NET |
| miR-203a-3p | 0.0715 | 19 | 56 | Roldo et al., 2006 [33] | overexpressed in INS vs NF-pNET |
| PCC | |||||
| miRNA | Corrected p-Value | Controls | PCC | Reference | |
| avg. UMI Read Number | |||||
| miR-101-3p | 0.0273 | 209 | 56 | Zong et al.2015 [36] | higher expression in malignant vs. benign PCC higher expression in SDHD mutation-associated tumors |
| Patterson et al., 2012 [27] | differentially expressed between malignant vs. benign PCC | ||||
| miR-16-5p | 0.0139 | 9670 | 2423 | Meyer-Rochow et al., 2010 [37] | underexpressed in malignant vs. benign PCC |
| miR-451a | 0.005 | 198 | 39 | Meyer-Rochow et al., 2010 [37] | underexpressed in malignant vs. benign PCC |
| Sample ID. | Sex | Age at Sampling | Group | CgA (ng/mL; Ref: 19.4–98.1) | PPGL: Benign/Malignant; pNET: Grade G1-G2-G3 | Experiment |
|---|---|---|---|---|---|---|
| 51 | F | 12 | PPGL (PCC) | 548.6 | benign (pr) | NGS & qPCR |
| 52 | M | 41 | PPGL (PCC) | 10870 | benign (pr) | NGS & qPCR |
| 53 | M | 51 | PPGL (SDHB mutation associated. PCC; no other malignant tumor yet) | 863.4 | benign (pr) | NGS & qPCR |
| 18 | F | 47 | PPGL (MEN2 assoc. PCC) | 402.9 | malignant (rec & met) | qPCR |
| 19 | F | 45 | PPGL (PCC) | 128.1 | malignant (rec) | qPCR |
| 23 | F | 67 | PPGL (PCC) | 749.6 | benign (pr) | qPCR |
| 20 | M | 56 | PPGL (PGL) | 8166 | malignant (rec & met) | qPCR |
| 56 | M | 40 | PPGL (SDHB mutation associated PGL) | 2265 | malignant (rec & met) | NGS & qPCR |
| 57 | F | 69 | PPGL (PCC) | 1375 | malignant (rec & met) | NGS & qPCR |
| 21 | F | 44 | PPGL (PGL) | 273 | malignant (rec & met) | qPCR |
| 62 | F | 48 | PPGL (PCC) | 2409 | benign (pr) | NGS & qPCR |
| 28 | M | 20 | PPGL (PCC) | 809.5 | NA | qPCR |
| 22 | F | 35 | PPGL (NF1 mutation associated PCC; no other malignant manifestation) | 1602 | malignant (rec & met) | qPCR |
| 64 | F | 35 | PPGL (PCC) | 487.9 | benign (pr) | NGS & qPCR |
| 26 | M | 24 | PPGL (VHL mutation associated PCC; no other malignant tumor) | 63.2 | malignant (bilateral) | qPCR |
| 24 | F | 69 | PPGL (PCC) | 2295 | malignant (rec & met) | qPCR |
| 29 | M | 21 | PPGL (PCC) | 104.1 | benign (pr) | qPCR |
| 27 | F | 62 | PPGL (PCC) | 115 | benign (pr) | qPCR |
| 66 | F | 15 | PPGL (SDHB mutation associated PCC) | 470.8 | malignant (rec & met) | NGS & qPCR |
| 25 | M | 36 | PPGL (PCC) | 1037.4 | malignant (rec & met) | qPCR |
| 1 | M | 75 | pNET | 34.2 | G1 | qPCR |
| 54 | F | 58 | pNET | 191.5 | NA | NGS & qPCR |
| 55 | M | 67 | pNET | 176.6 | G3 | NGS & qPCR |
| 2 | M | 57 | pNET | 35.2 | G2 | qPCR |
| 3 | F | 62 | pNET | 62.2 | G2 | qPCR |
| 4 | M | 77 | pNET | 67.9 | G2 | qPCR |
| 58 | F | 66 | pNET | 162.7 | NA | NGS & qPCR |
| 59 | M | 52 | pNET | 448.5 | G2 | NGS & qPCR |
| 5 | F | 62 | pNET | 44.2 | G2 | qPCR |
| 60 | M | 72 | pNET | 1679 | G2 | NGS & qPCR |
| 61 | F | 61 | pNET | 543.6 | G2 | NGS & qPCR |
| 6 | M | 39 | pNET | 327.4 | G3 | qPCR |
| 63 | F | 47 | pNET | 1009 | G2 | NGS & qPCR |
| 7 | M | 68 | pNET | 219.2 | G2 | qPCR |
| 65 | M | 74 | pNET | 104.5 | G1 | NGS & qPCR |
| 8 | M | 42 | pNET | 190.1 | G3 | qPCR |
| 9 | F | 48 | pNET | 115.4 | NA | qPCR |
| 10 | F | 82 | pNET | 79.1 | G1 | qPCR |
| 11 | F | 76 | pNET | 132 | G2 | qPCR |
| 12 | F | 58 | pNET | 51.5 | G1 | qPCR |
| 13 | M | 75 | pNET | 2490.8 | NA | qPCR |
| 14 | F | 64 | pNET | 4163 | G2 | qPCR |
| 15 | F | 59 | pNET | 275.7 | NA | qPCR |
| 16 | M | 72 | pNET | 49.8 | G2 | qPCR |
| 17 | M | 73 | pNET | 34.4 | NA | qPCR |
| 74 | M | 77 | healthy control | 38.5 | na | qPCR |
| 38 | M | 71 | healthy control | 53.7 | na | qPCR |
| 40 | F | 49 | healthy control | 12.7 | na | qPCR |
| 31 | M | 49 | healthy control | 41.5 | na | qPCR |
| 76 | M | 44 | healthy control | 39.8 | na | NGS & qPCR |
| 36 | F | 68 | healthy control | 100.4 | na | qPCR |
| 30 | F | 13 | healthy control | 18 | na | qPCR |
| 34 | M | 40 | healthy control | 40.2 | na | qPCR |
| 35 | F | 69 | healthy control | 48.7 | na | qPCR |
| 41 | F | 47 | healthy control | 93 | na | qPCR |
| 39 | F | 63 | healthy control | 55 | na | qPCR |
| 75 | M | 65 | healthy control | 39 | na | qPCR |
| 37 | M | 55 | healthy control | 57.2 | na | qPCR |
| 73 | M | 47 | healthy control | 34 | na | NGS & qPCR |
| 43 | F | 16 | healthy control | 52.6 | na | qPCR |
| 42 | F | 33 | healthy control | 68.4 | na | qPCR |
| 72 | F | 46 | healthy control | 42.8 | na | NGS & qPCR |
| 32 | F | 58 | healthy control | 80.2 | na | qPCR |
| 71 | M | 37 | healthy control | 27.7 | na | NGS & qPCR |
| 45 | F | 72 | healthy control without PPI | 494 | na | qPCR |
| 46 | F | 72 | healthy control on PPI | 5775 | na | qPCR |
| 47 | F | 62 | healthy control without PPI | 198.9 | na | qPCR |
| 48 | F | 62 | healthy control on PPI | 516 | na | qPCR |
| 67 | F | 39 | healthy control without PPI | 42.3 | na | NGS & qPCR |
| 68 | F | 39 | healthy control on PPI | 197.8 | na | NGS & qPCR |
| 33 | M | 64 | healthy control without PPI | 186.7 | na | qPCR |
| 49 | M | 64 | healthy control on PPI | 595.4 | na | qPCR |
| 69 | F | 46 | healthy control without PPI | 45.6 | na | NGS & qPCR |
| 70 | F | 46 | healthy control on PPI | 278 | na | NGS & qPCR |
© 2020 by the authors. Licensee MDPI, Basel, Switzerland. This article is an open access article distributed under the terms and conditions of the Creative Commons Attribution (CC BY) license (http://creativecommons.org/licenses/by/4.0/).
Share and Cite
Kövesdi, A.; Kurucz, P.A.; Nyírő, G.; Darvasi, O.; Patócs, A.; Butz, H. Circulating miRNA Increases the Diagnostic Accuracy of Chromogranin A in Metastatic Pancreatic Neuroendocrine Tumors. Cancers 2020, 12, 2488. https://doi.org/10.3390/cancers12092488
Kövesdi A, Kurucz PA, Nyírő G, Darvasi O, Patócs A, Butz H. Circulating miRNA Increases the Diagnostic Accuracy of Chromogranin A in Metastatic Pancreatic Neuroendocrine Tumors. Cancers. 2020; 12(9):2488. https://doi.org/10.3390/cancers12092488
Chicago/Turabian StyleKövesdi, Annamária, Petra Anna Kurucz, Gábor Nyírő, Ottó Darvasi, Attila Patócs, and Henriett Butz. 2020. "Circulating miRNA Increases the Diagnostic Accuracy of Chromogranin A in Metastatic Pancreatic Neuroendocrine Tumors" Cancers 12, no. 9: 2488. https://doi.org/10.3390/cancers12092488