Organotypic Co-Cultures as a Novel 3D Model for Head and Neck Squamous Cell Carcinoma

 , , and
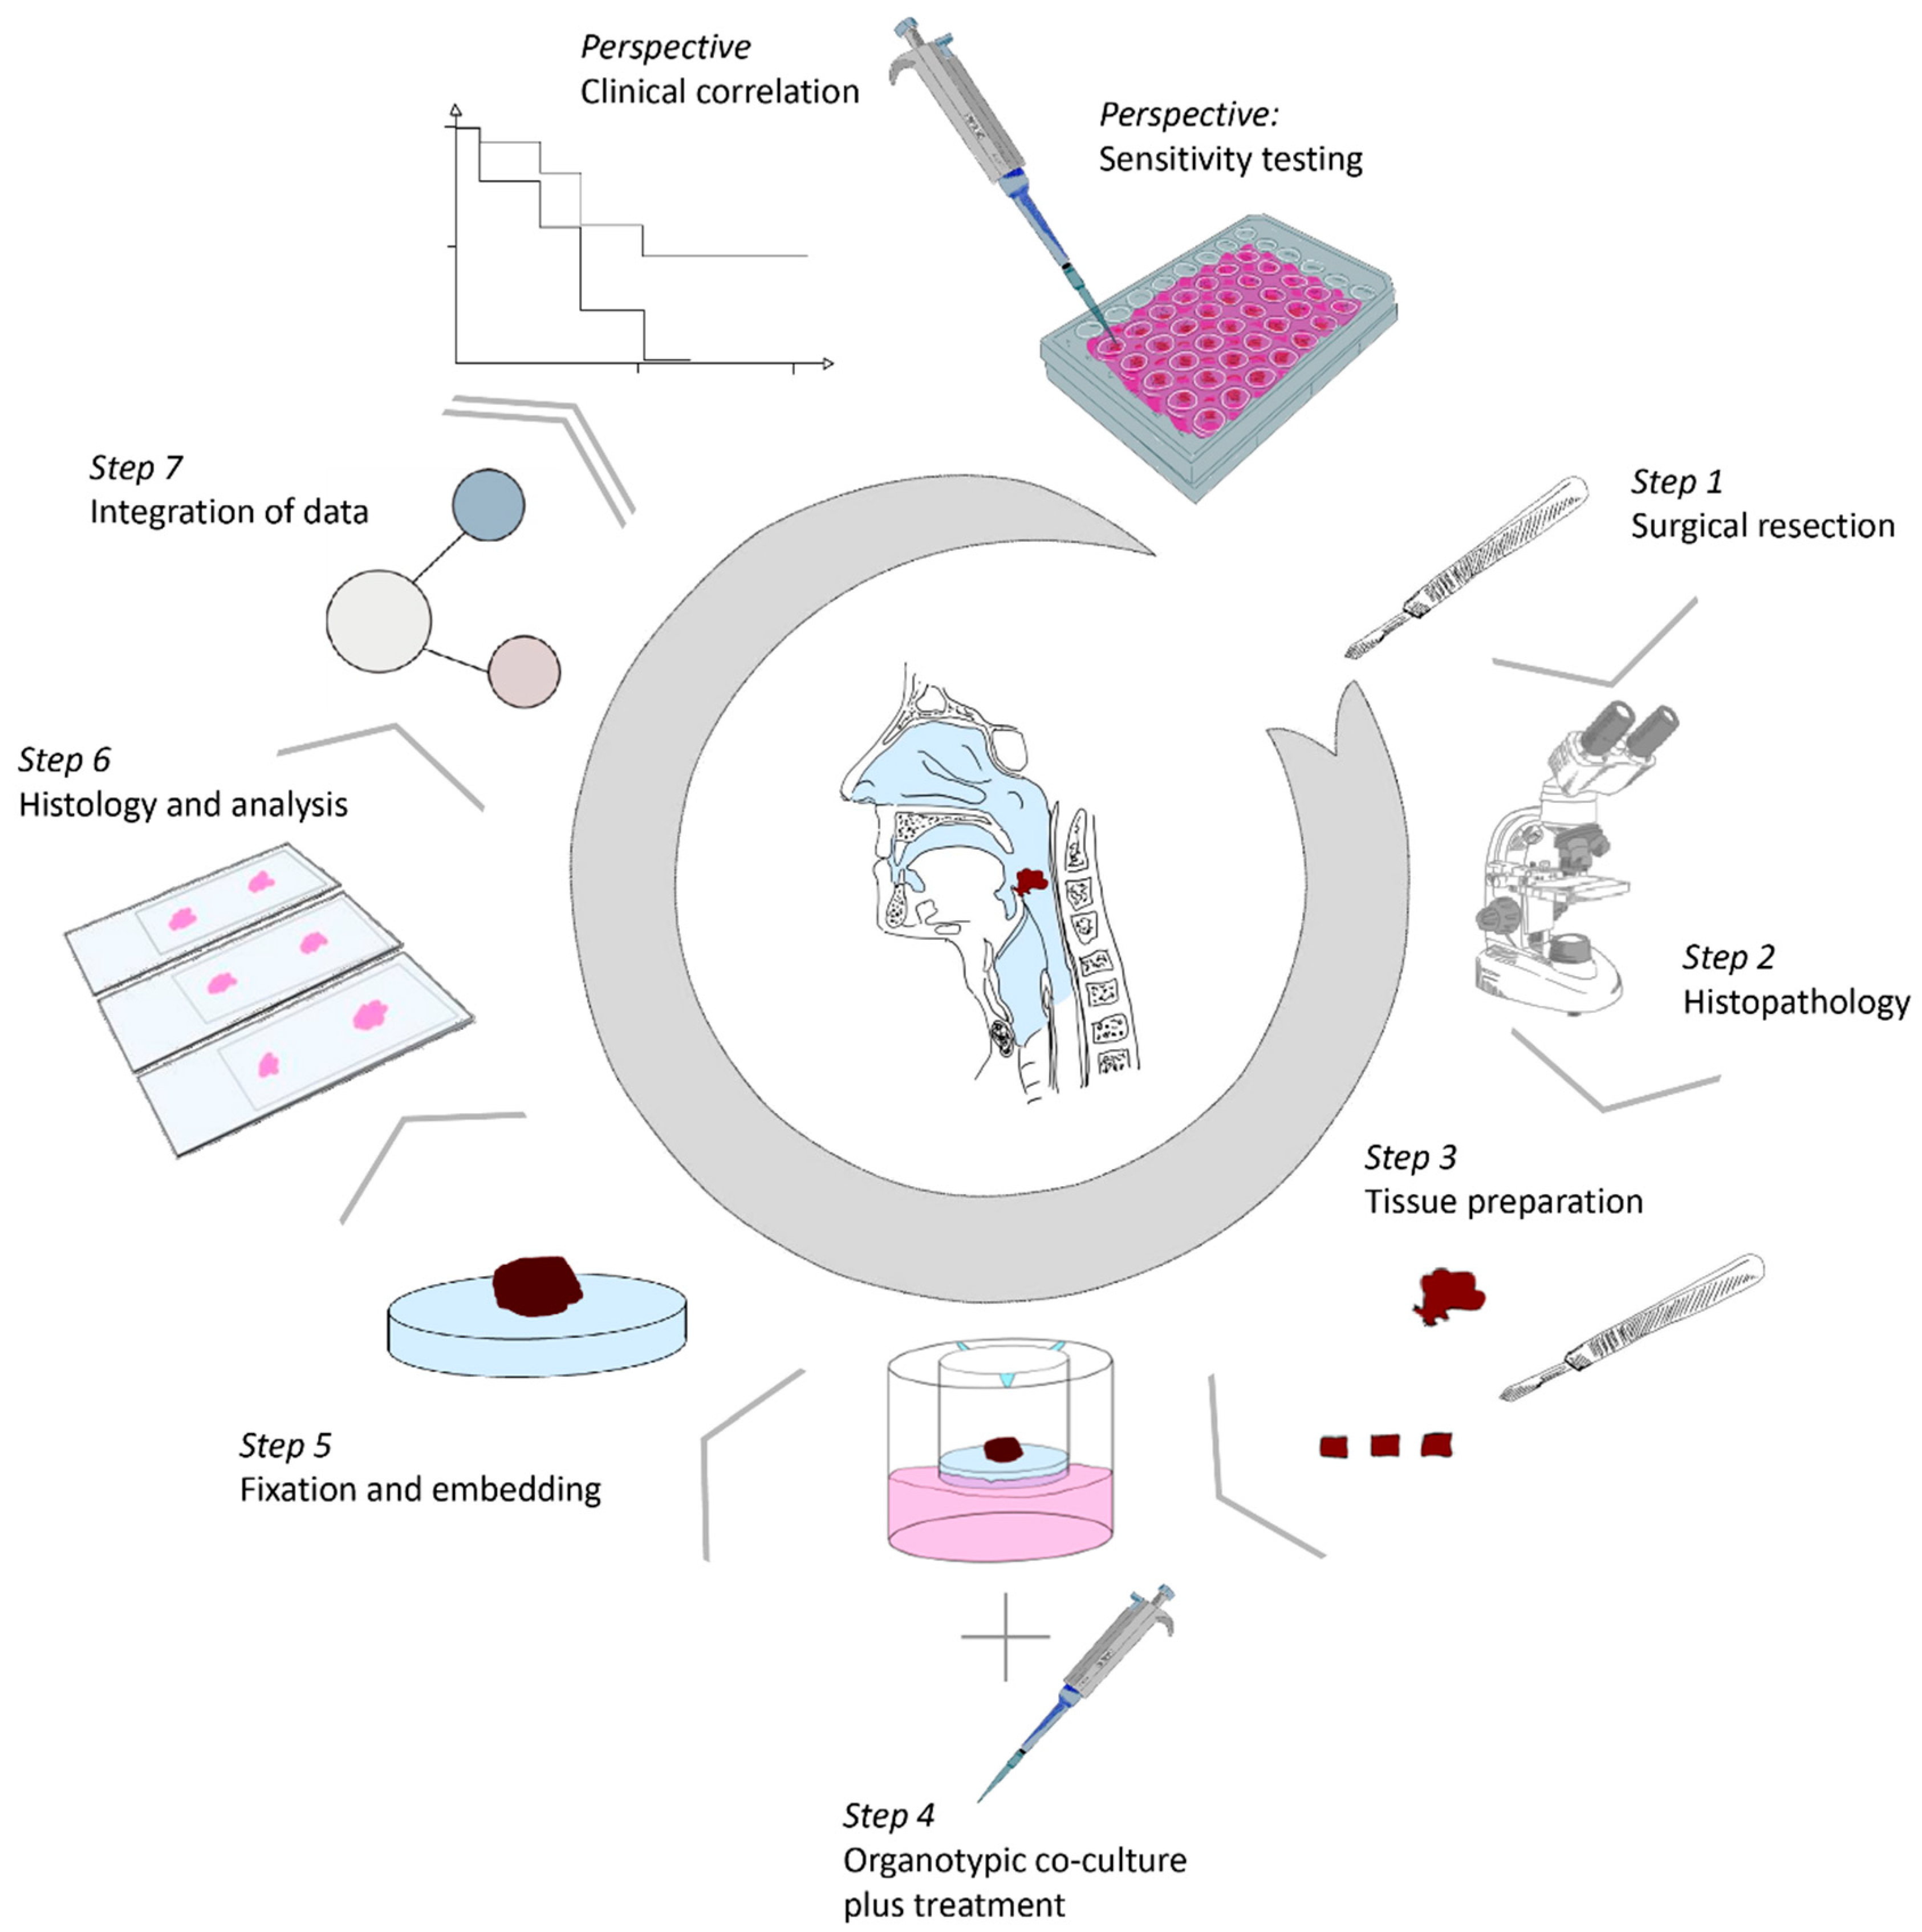
Abstract
:1. Background
2. Materials and Methods
2.1. Patient Collective
2.2. Preparation of Dermal Equivalents (DEs)
2.3. HNSCC Tissue Preparation and Culture of 3D-OTC
2.4. Fractionated Irradiation of 3D-OTC
2.5. Histological, Immunohistochemical and Immunofluorescence Analysis
2.6. Detection of HPV DNA
2.7. Analysis of Tumor Cell Proportion
2.8. Analysis of Proliferation Indices
2.9. Analysis of the Immune Cell Proprtion
3. Results
3.1. D-OTC Models from Non-HPV-Driven Tumors
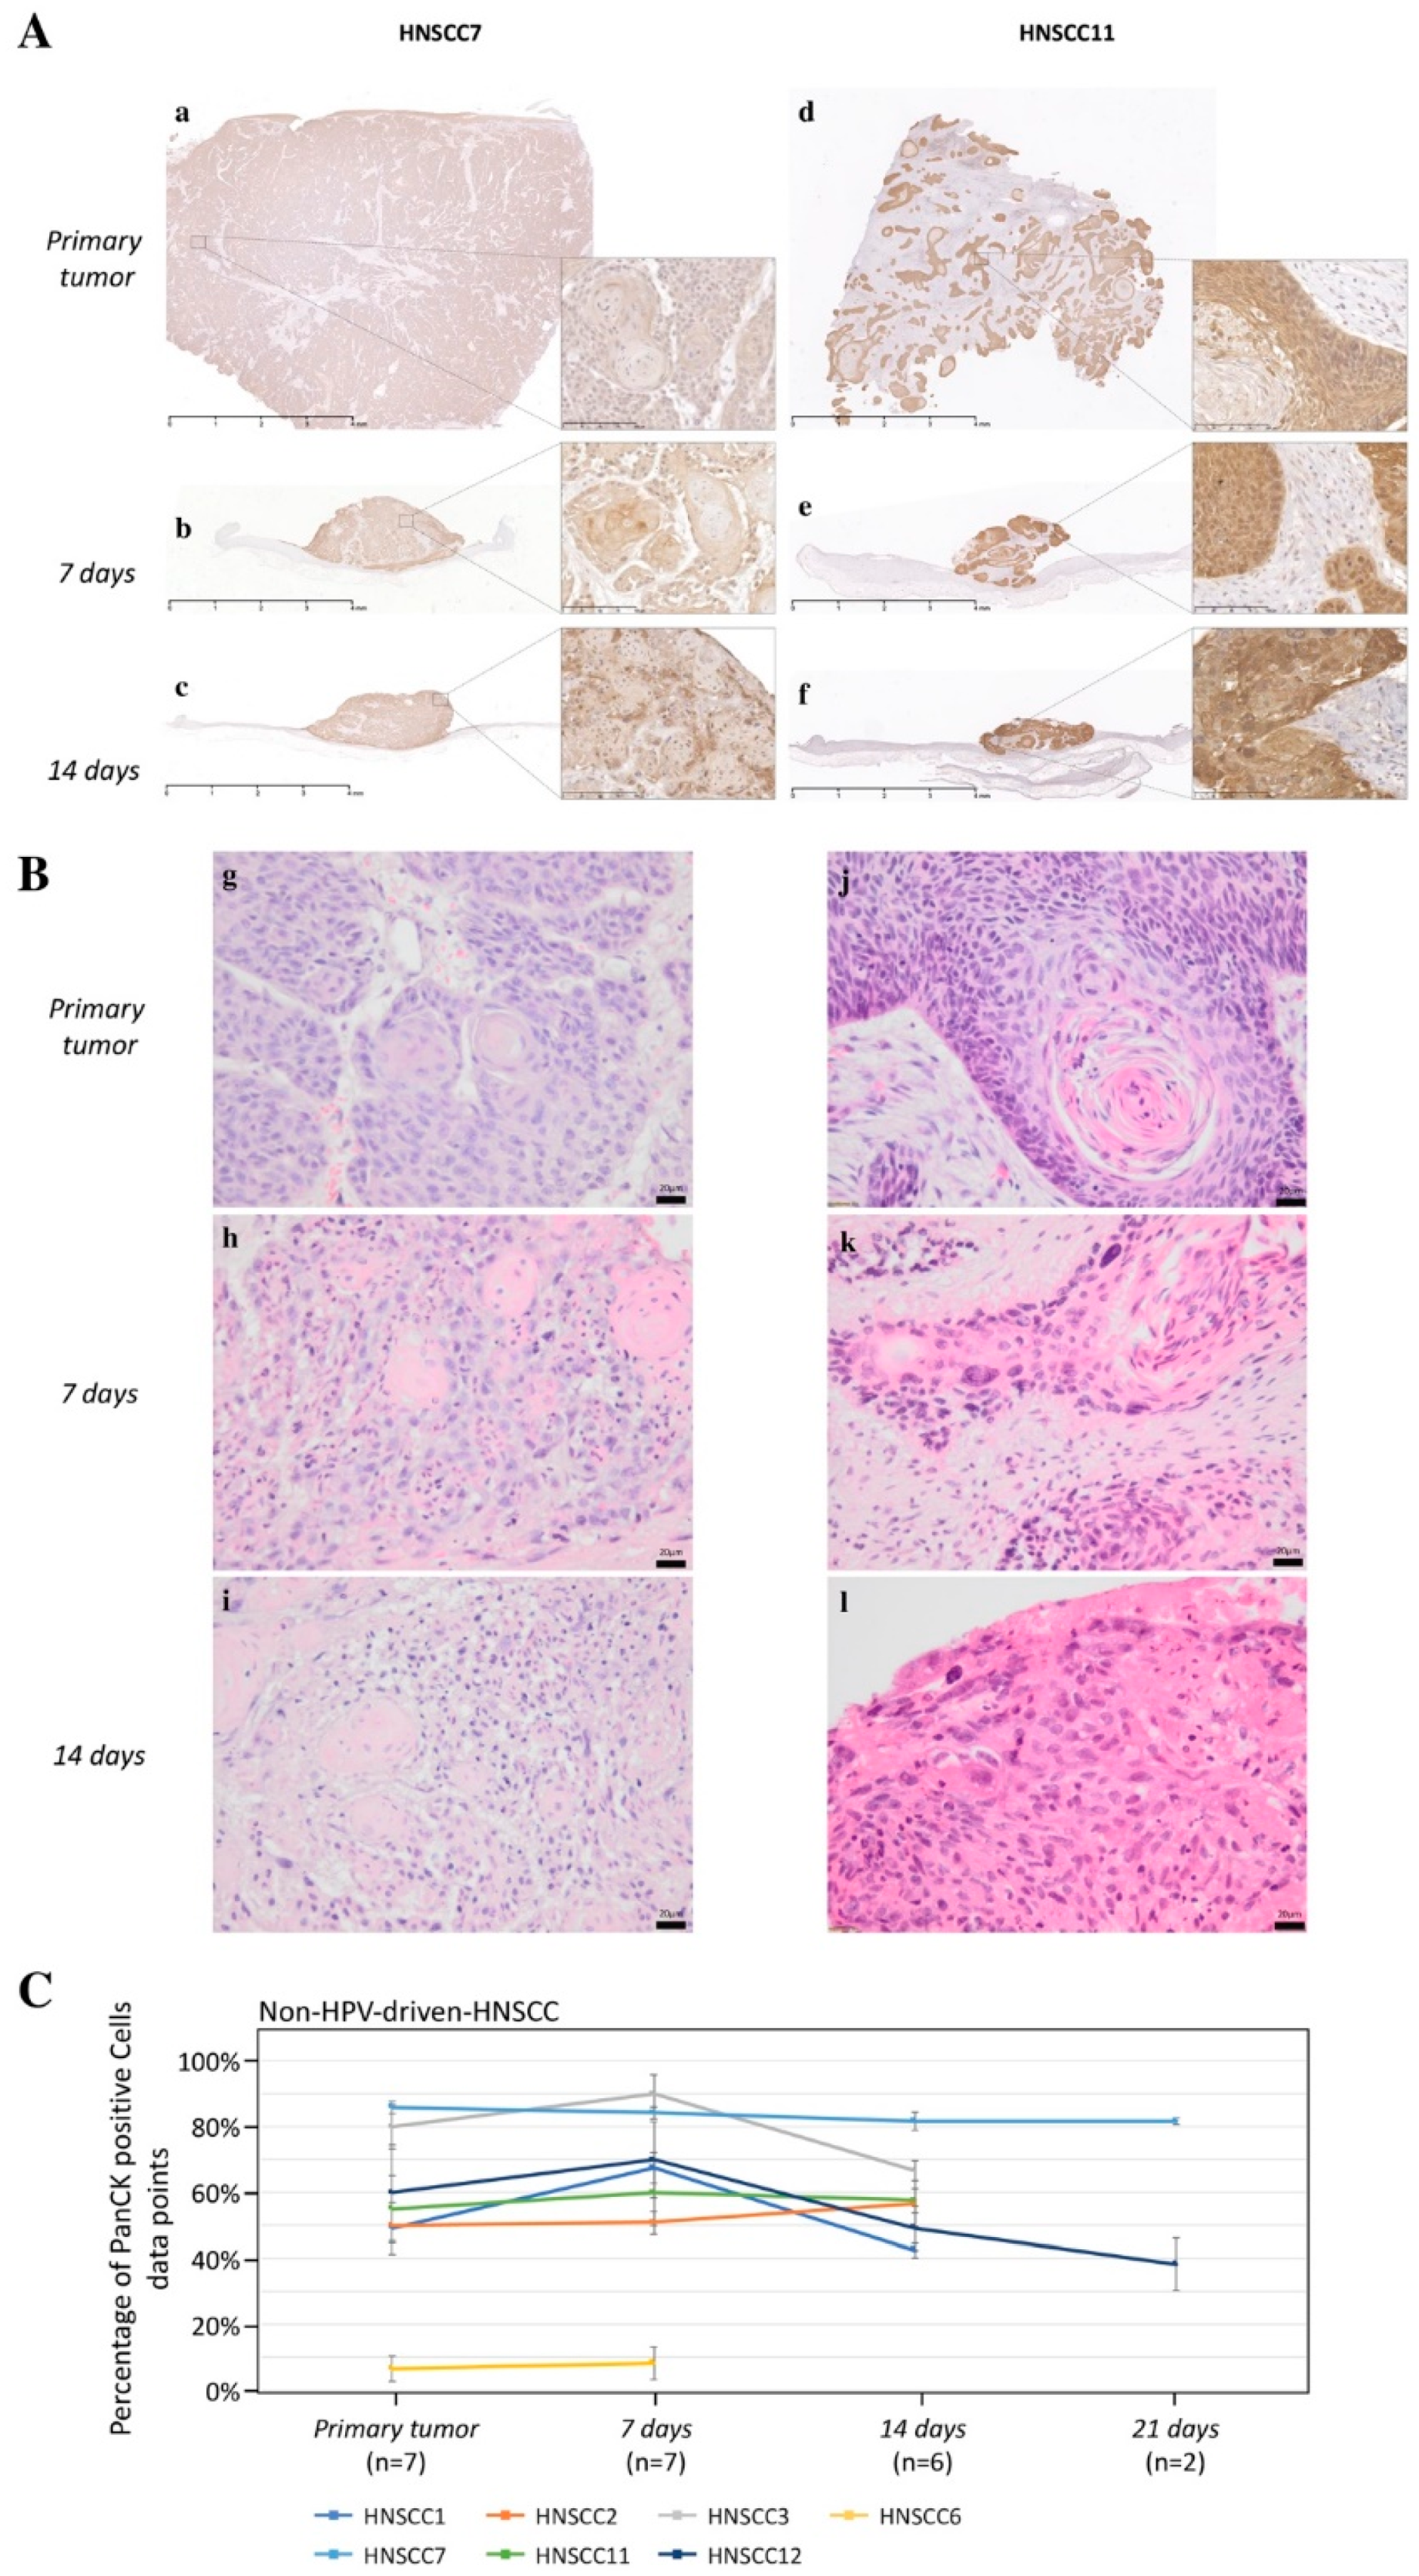
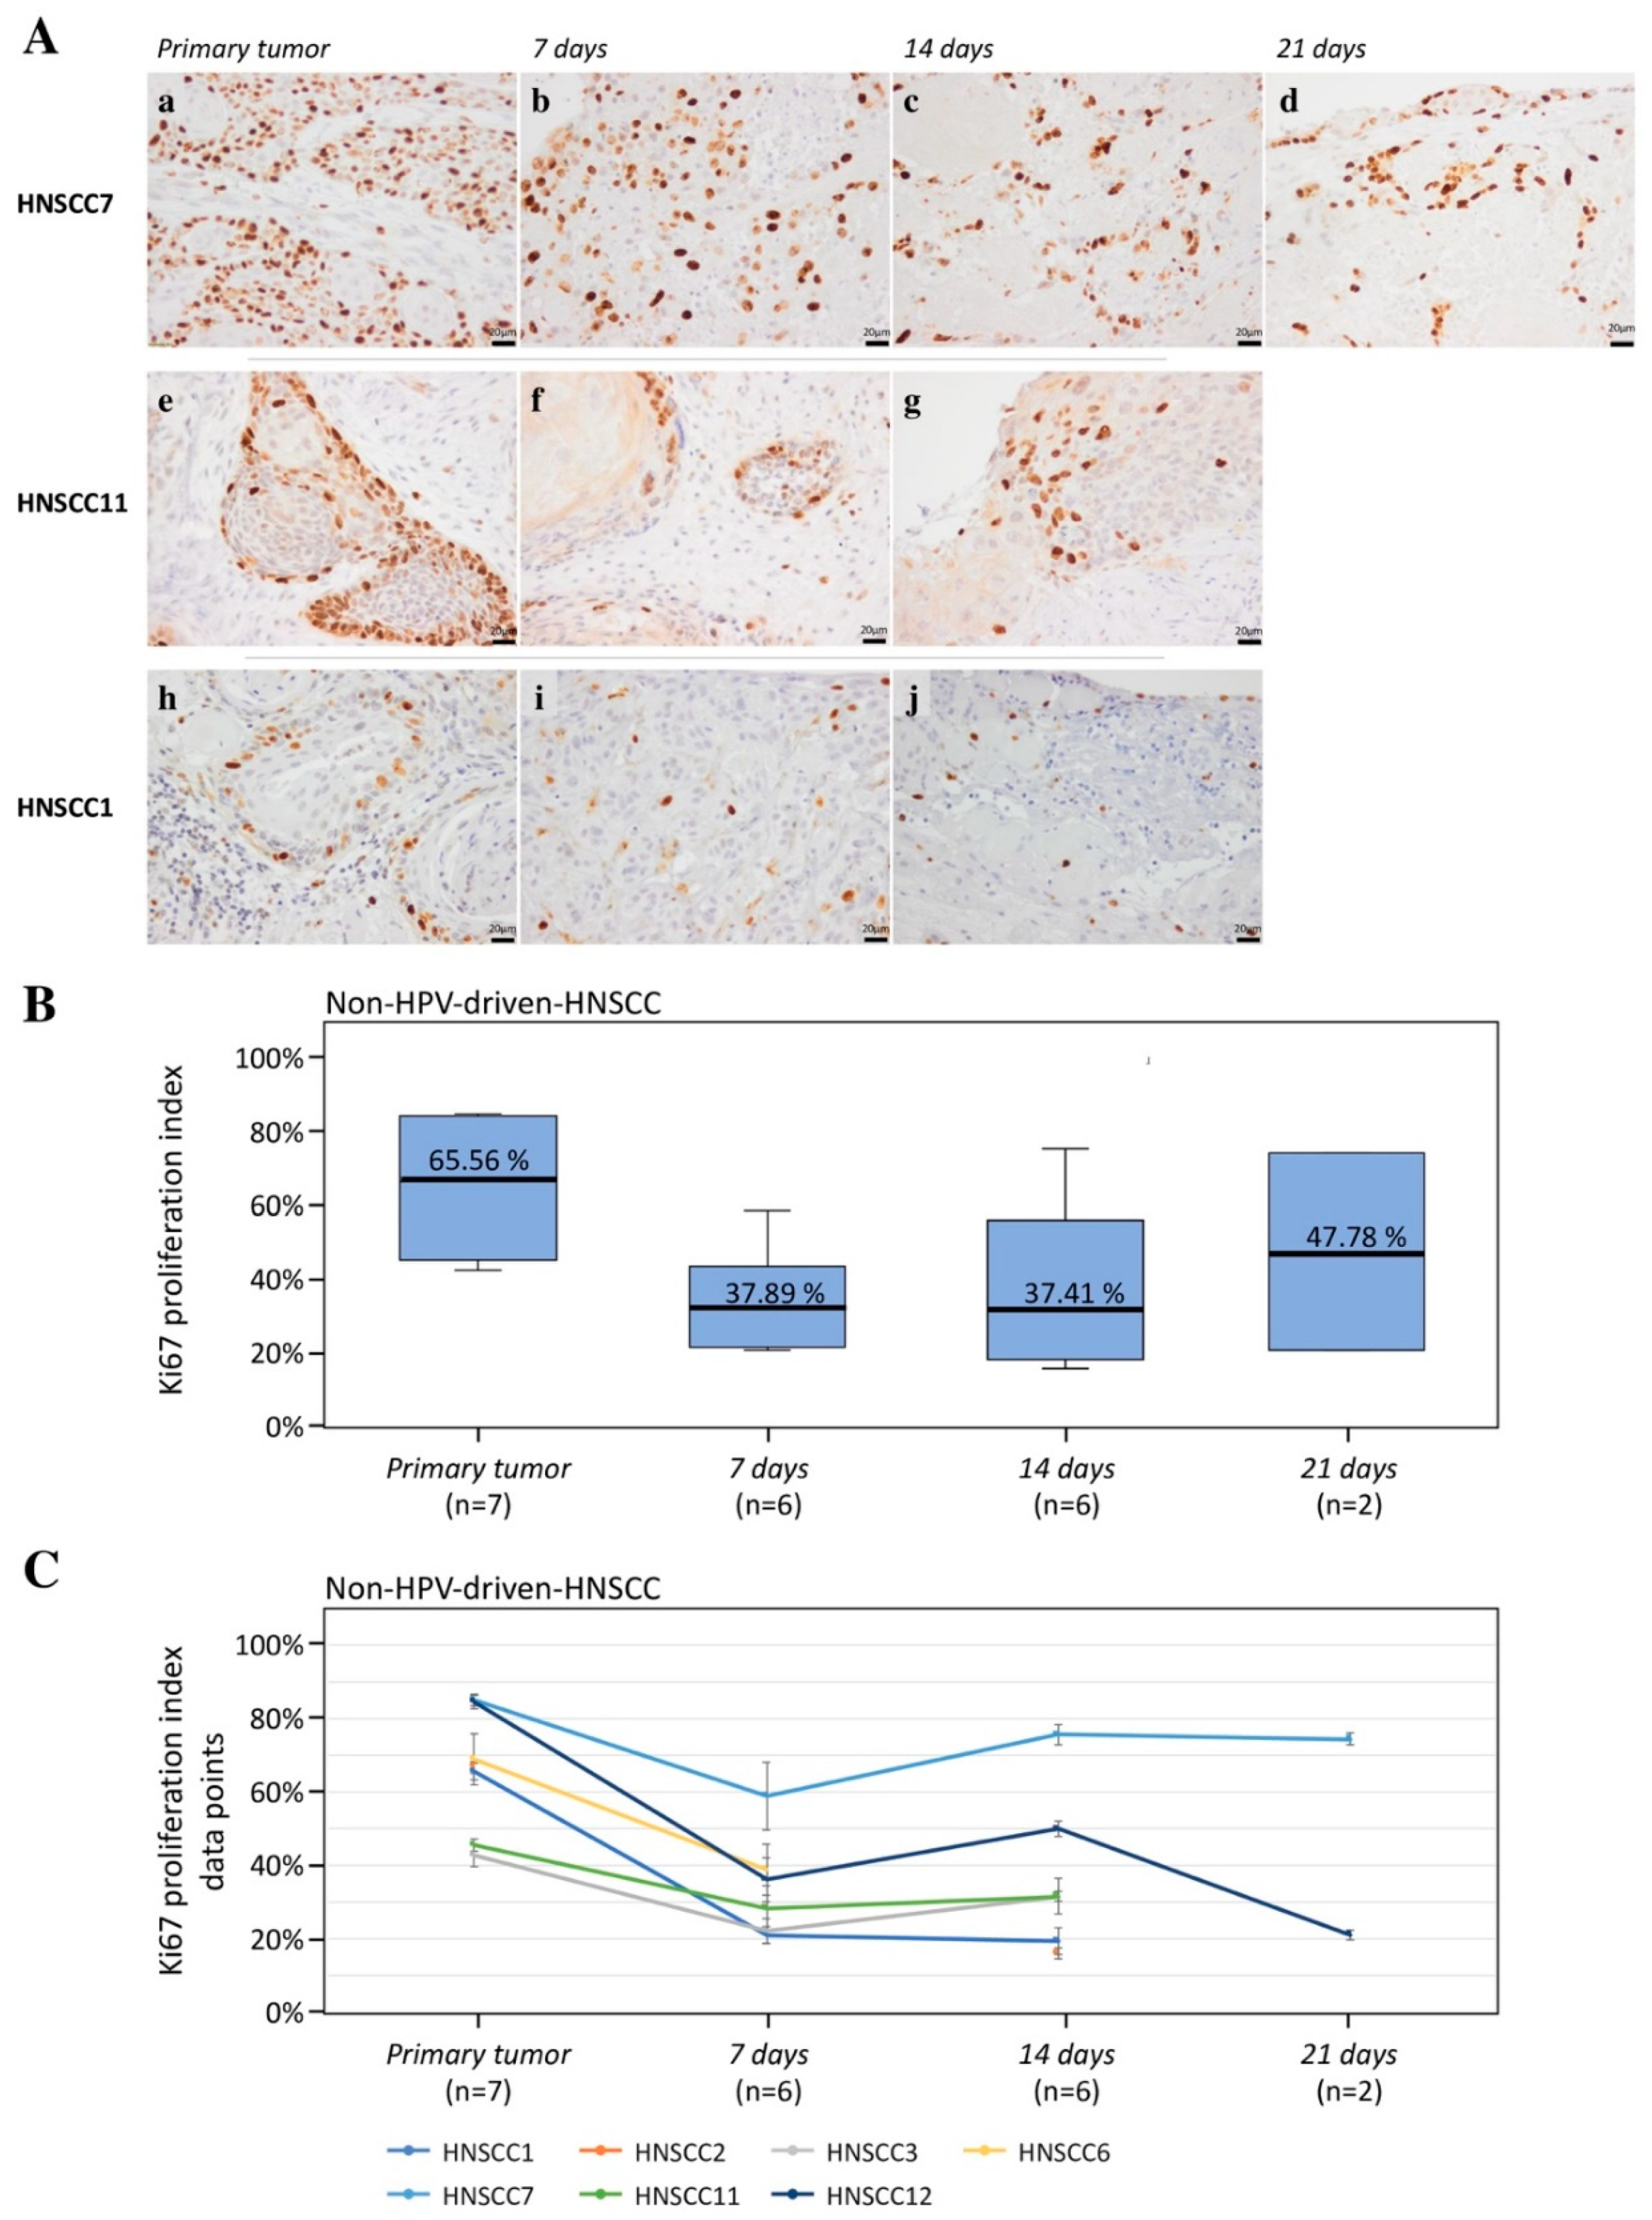
3.1.1. Cancer Cell Viability, Proliferation, and Apoptosis of Non-HPV-Driven HNSCC
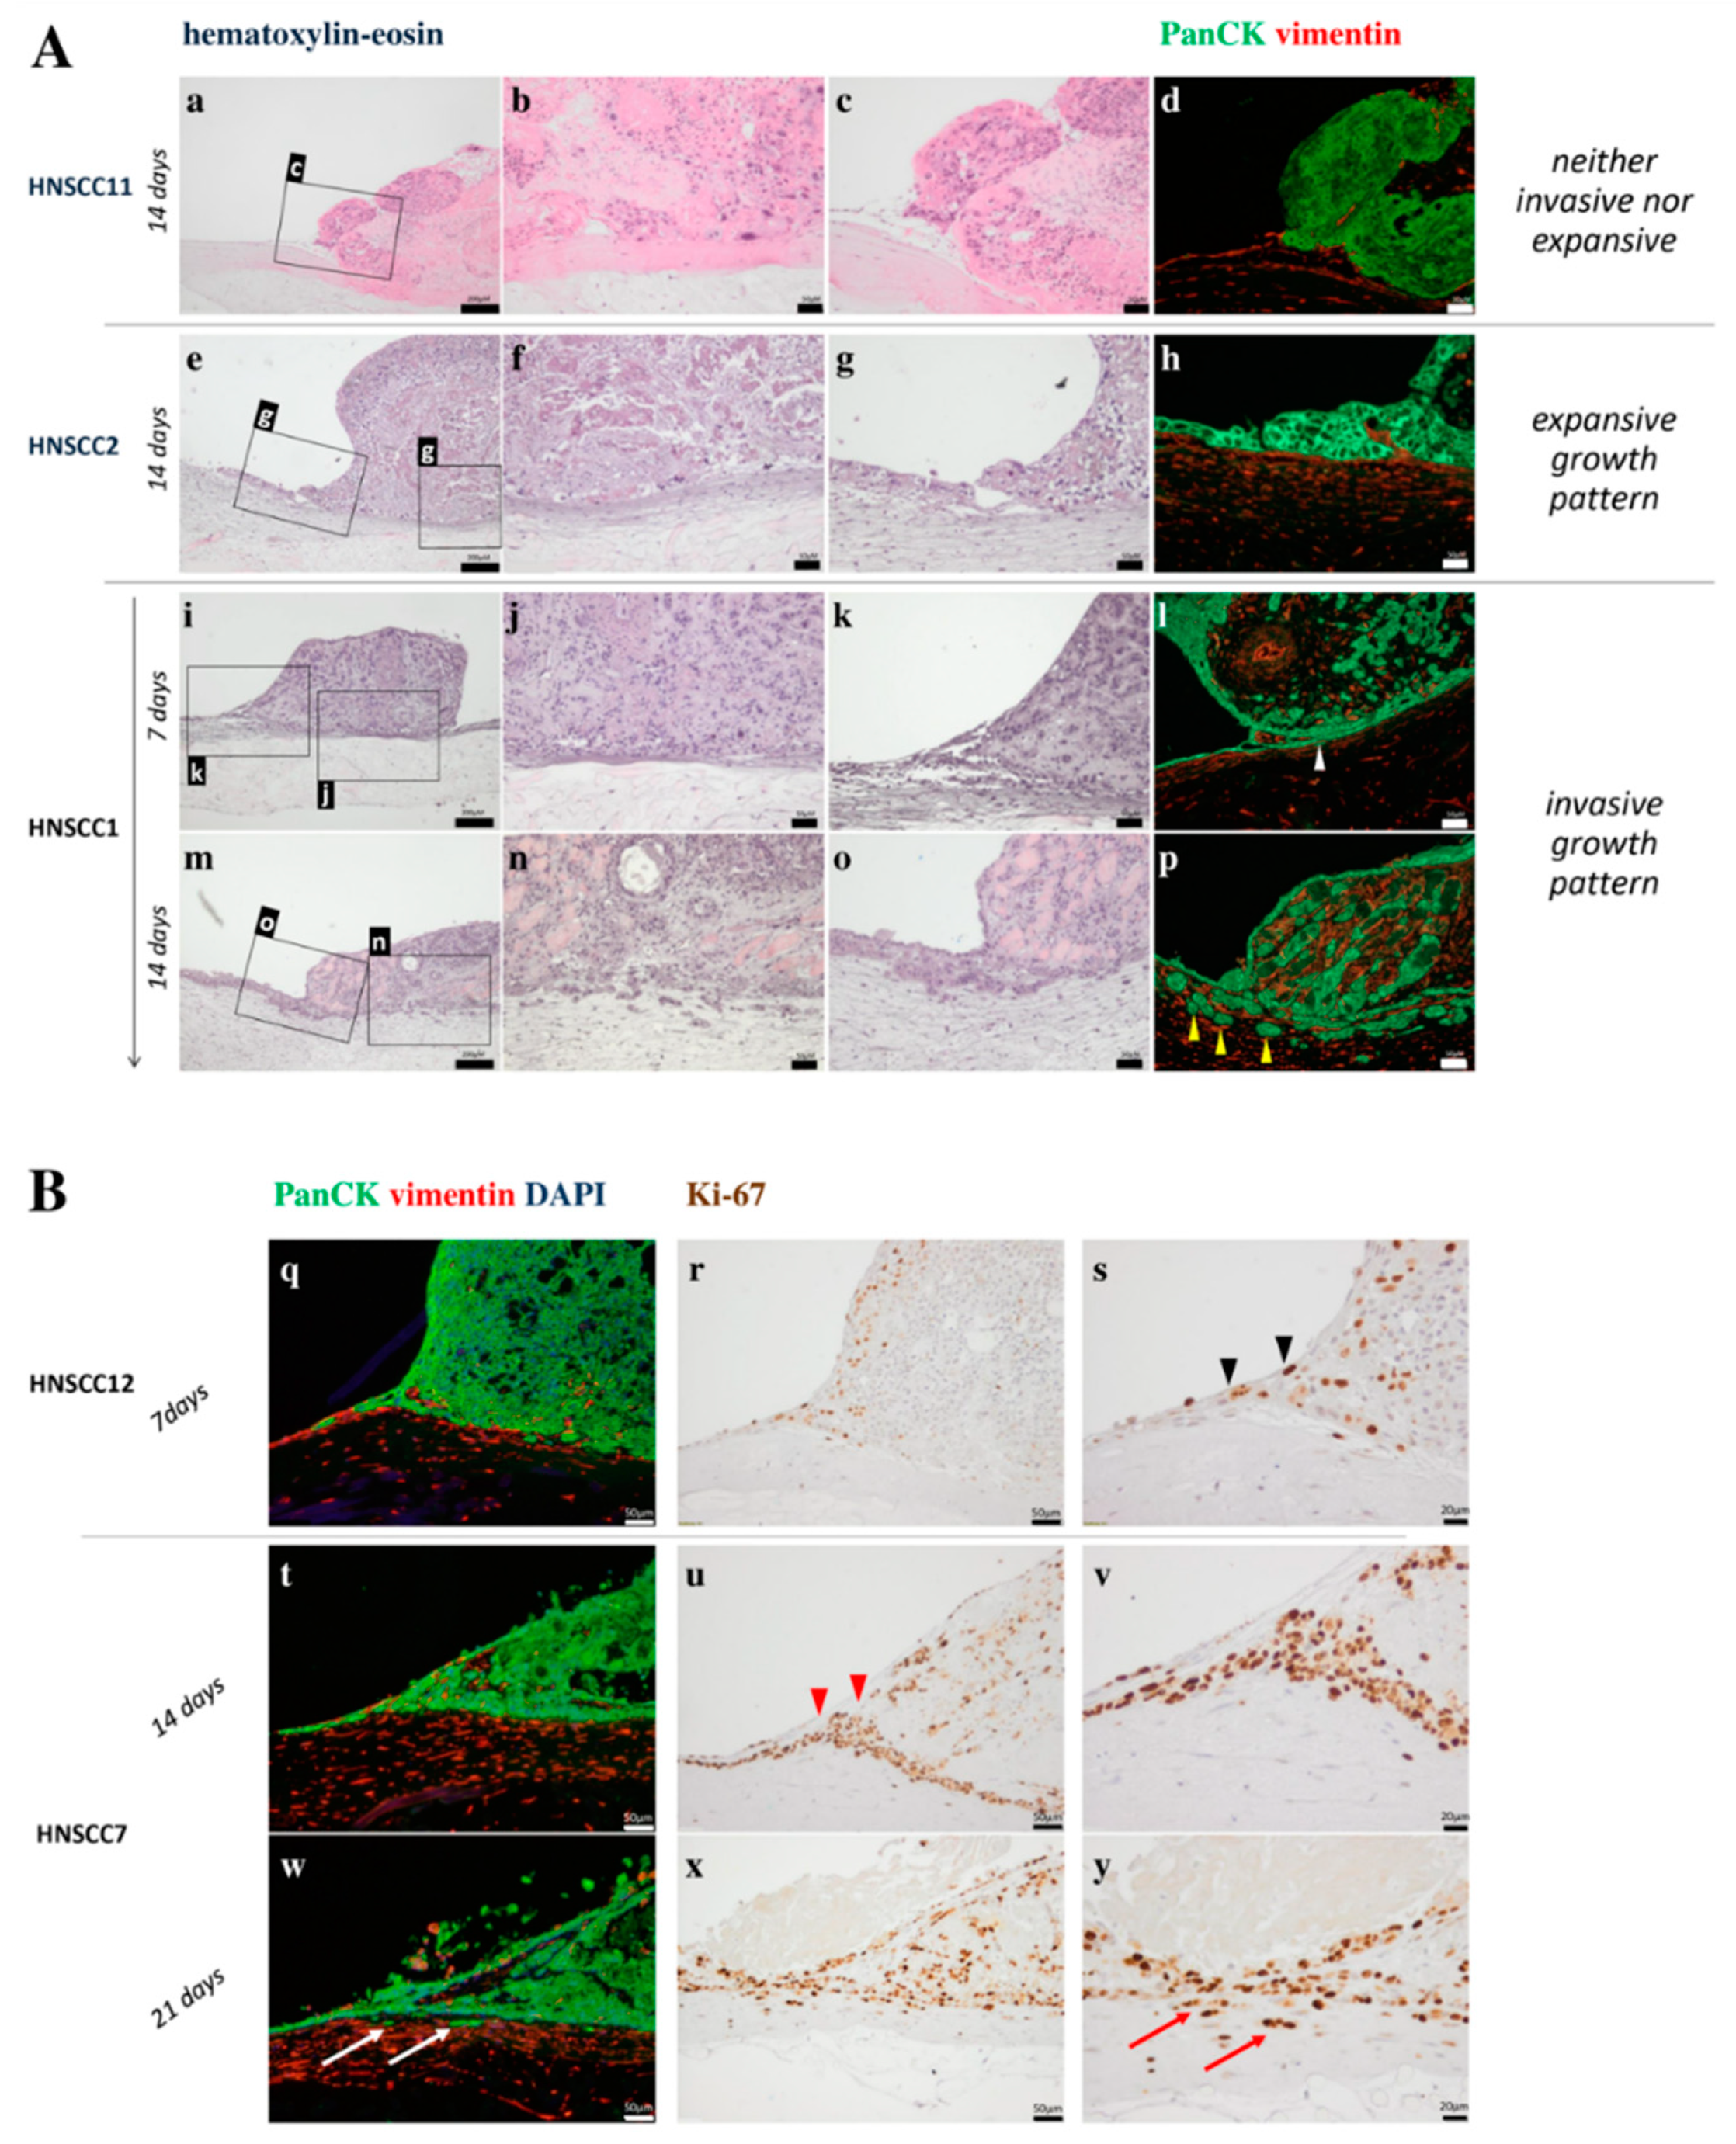
3.1.2. Motility and Invasiveness of Non-HPV-Driven HNSCC
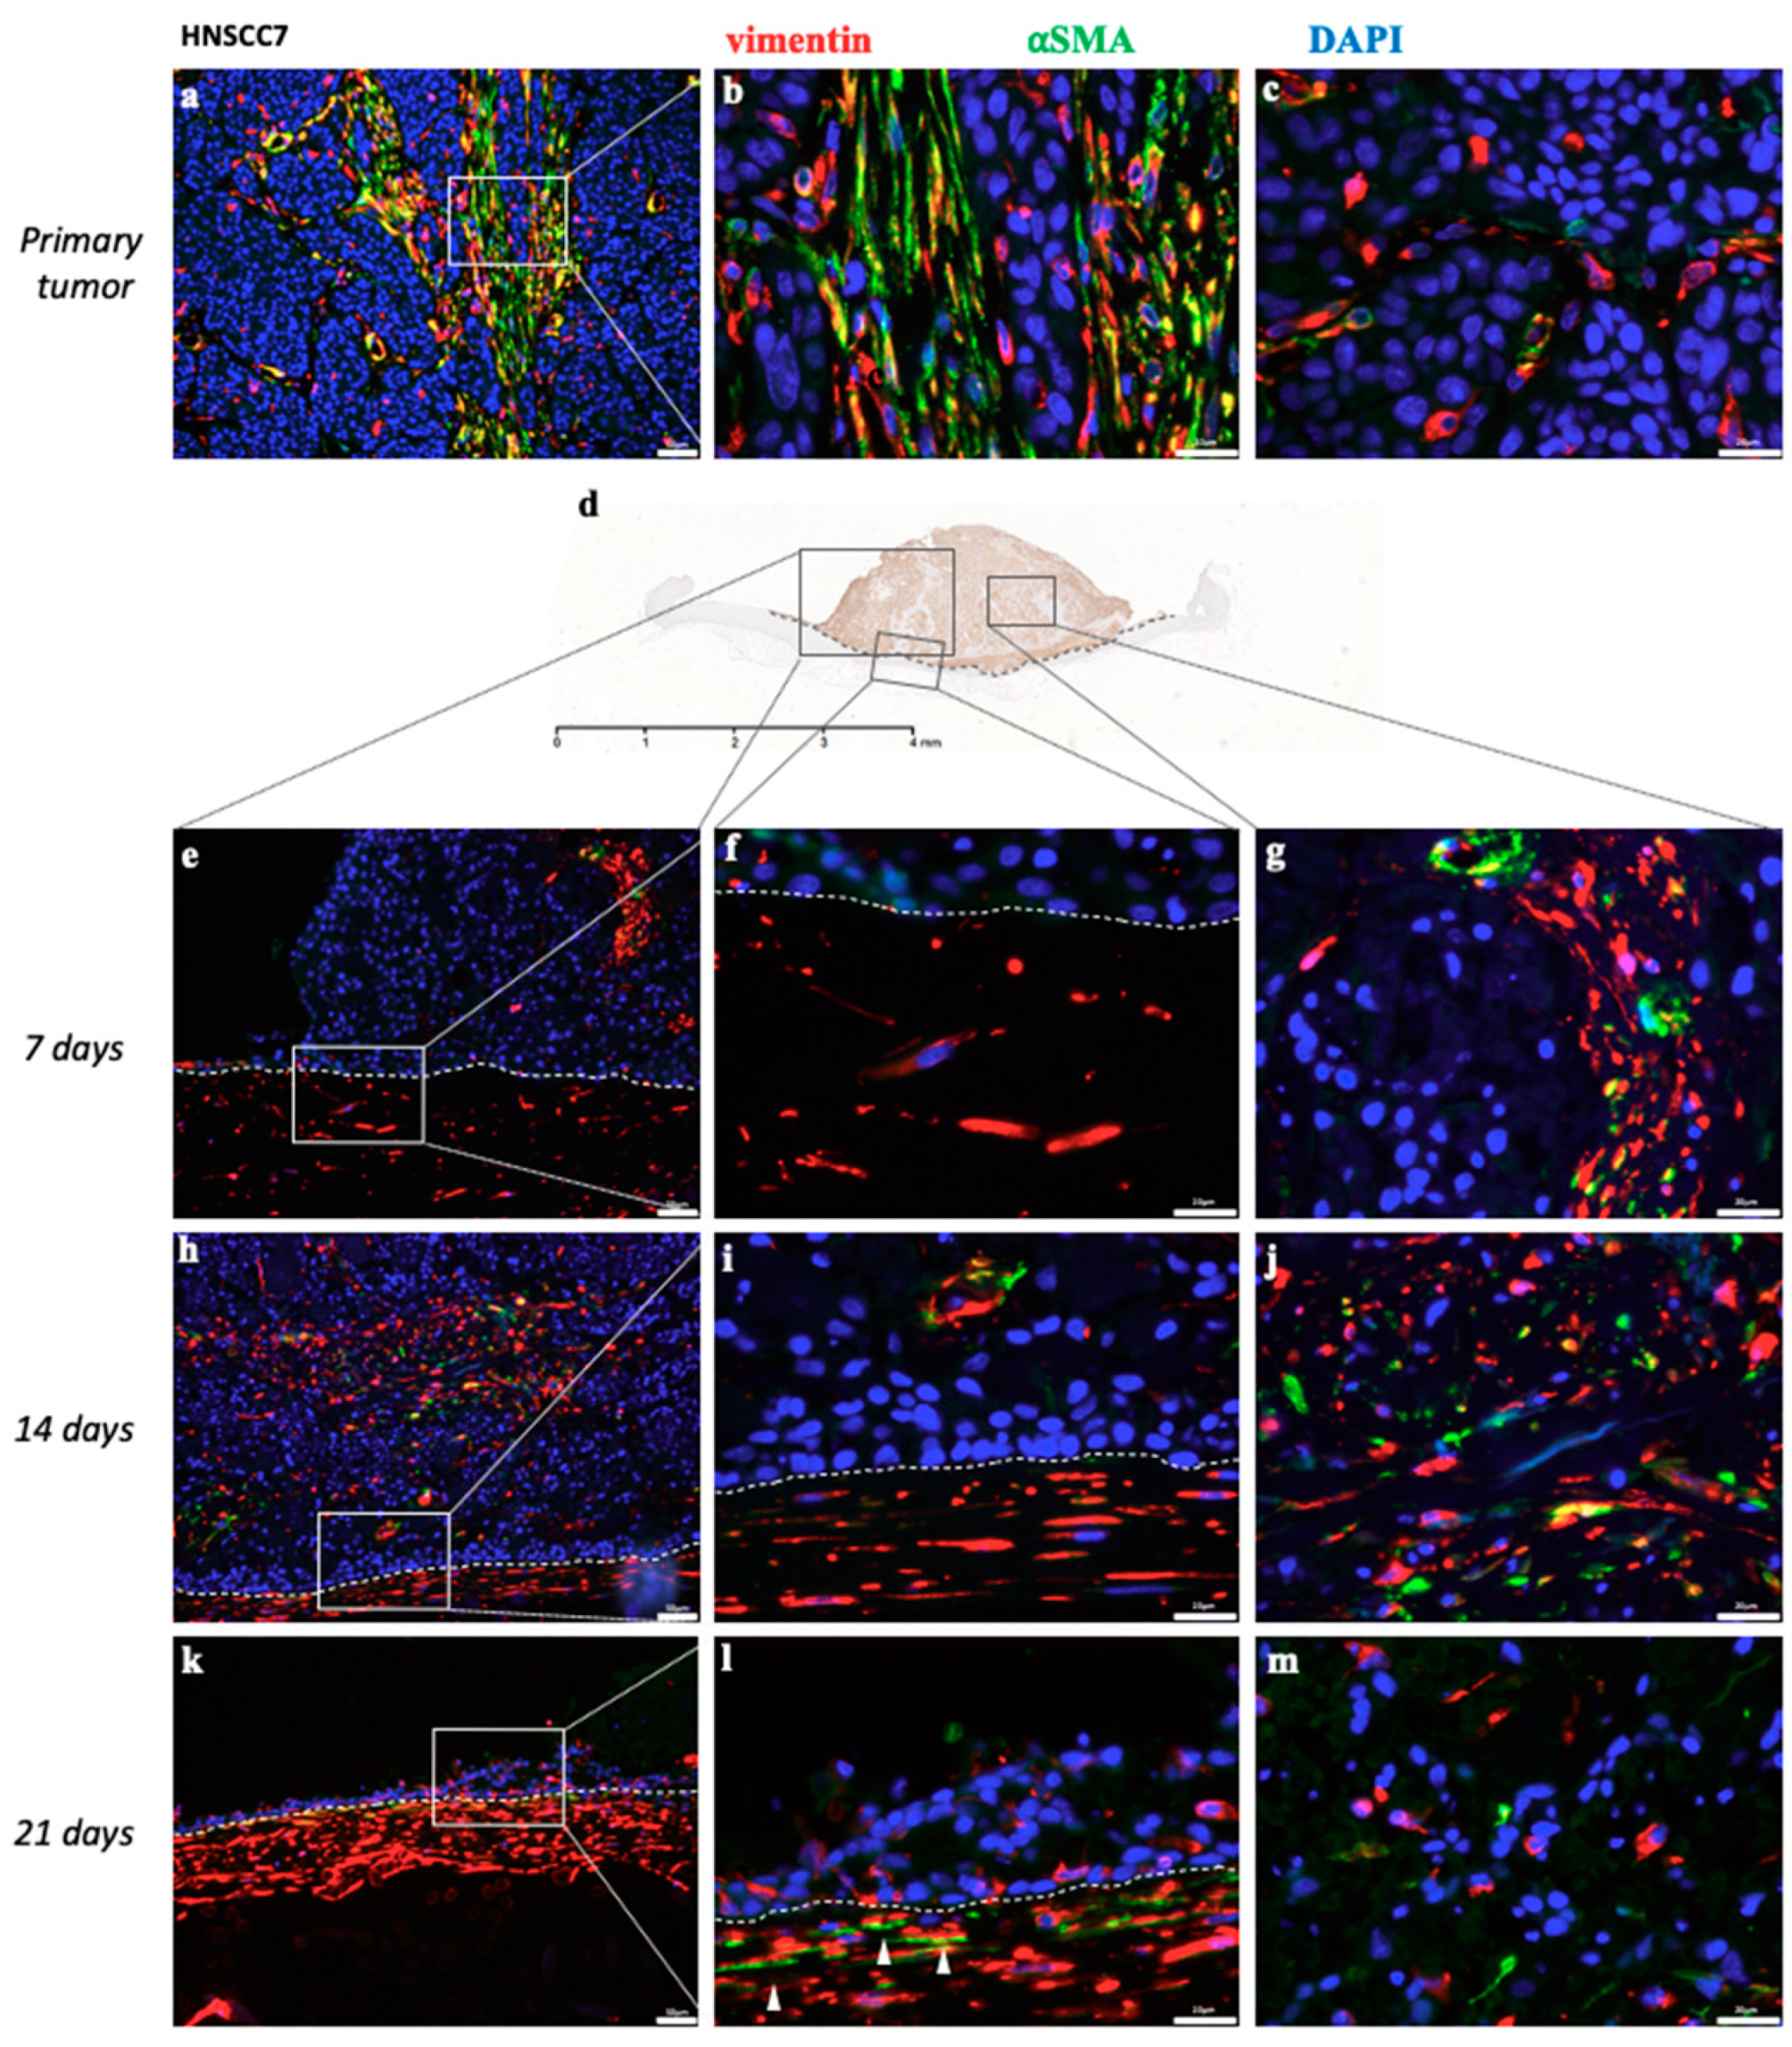
3.1.3. Cancer-Associated Fibroblasts in Non-HPV-Driven HNSCC
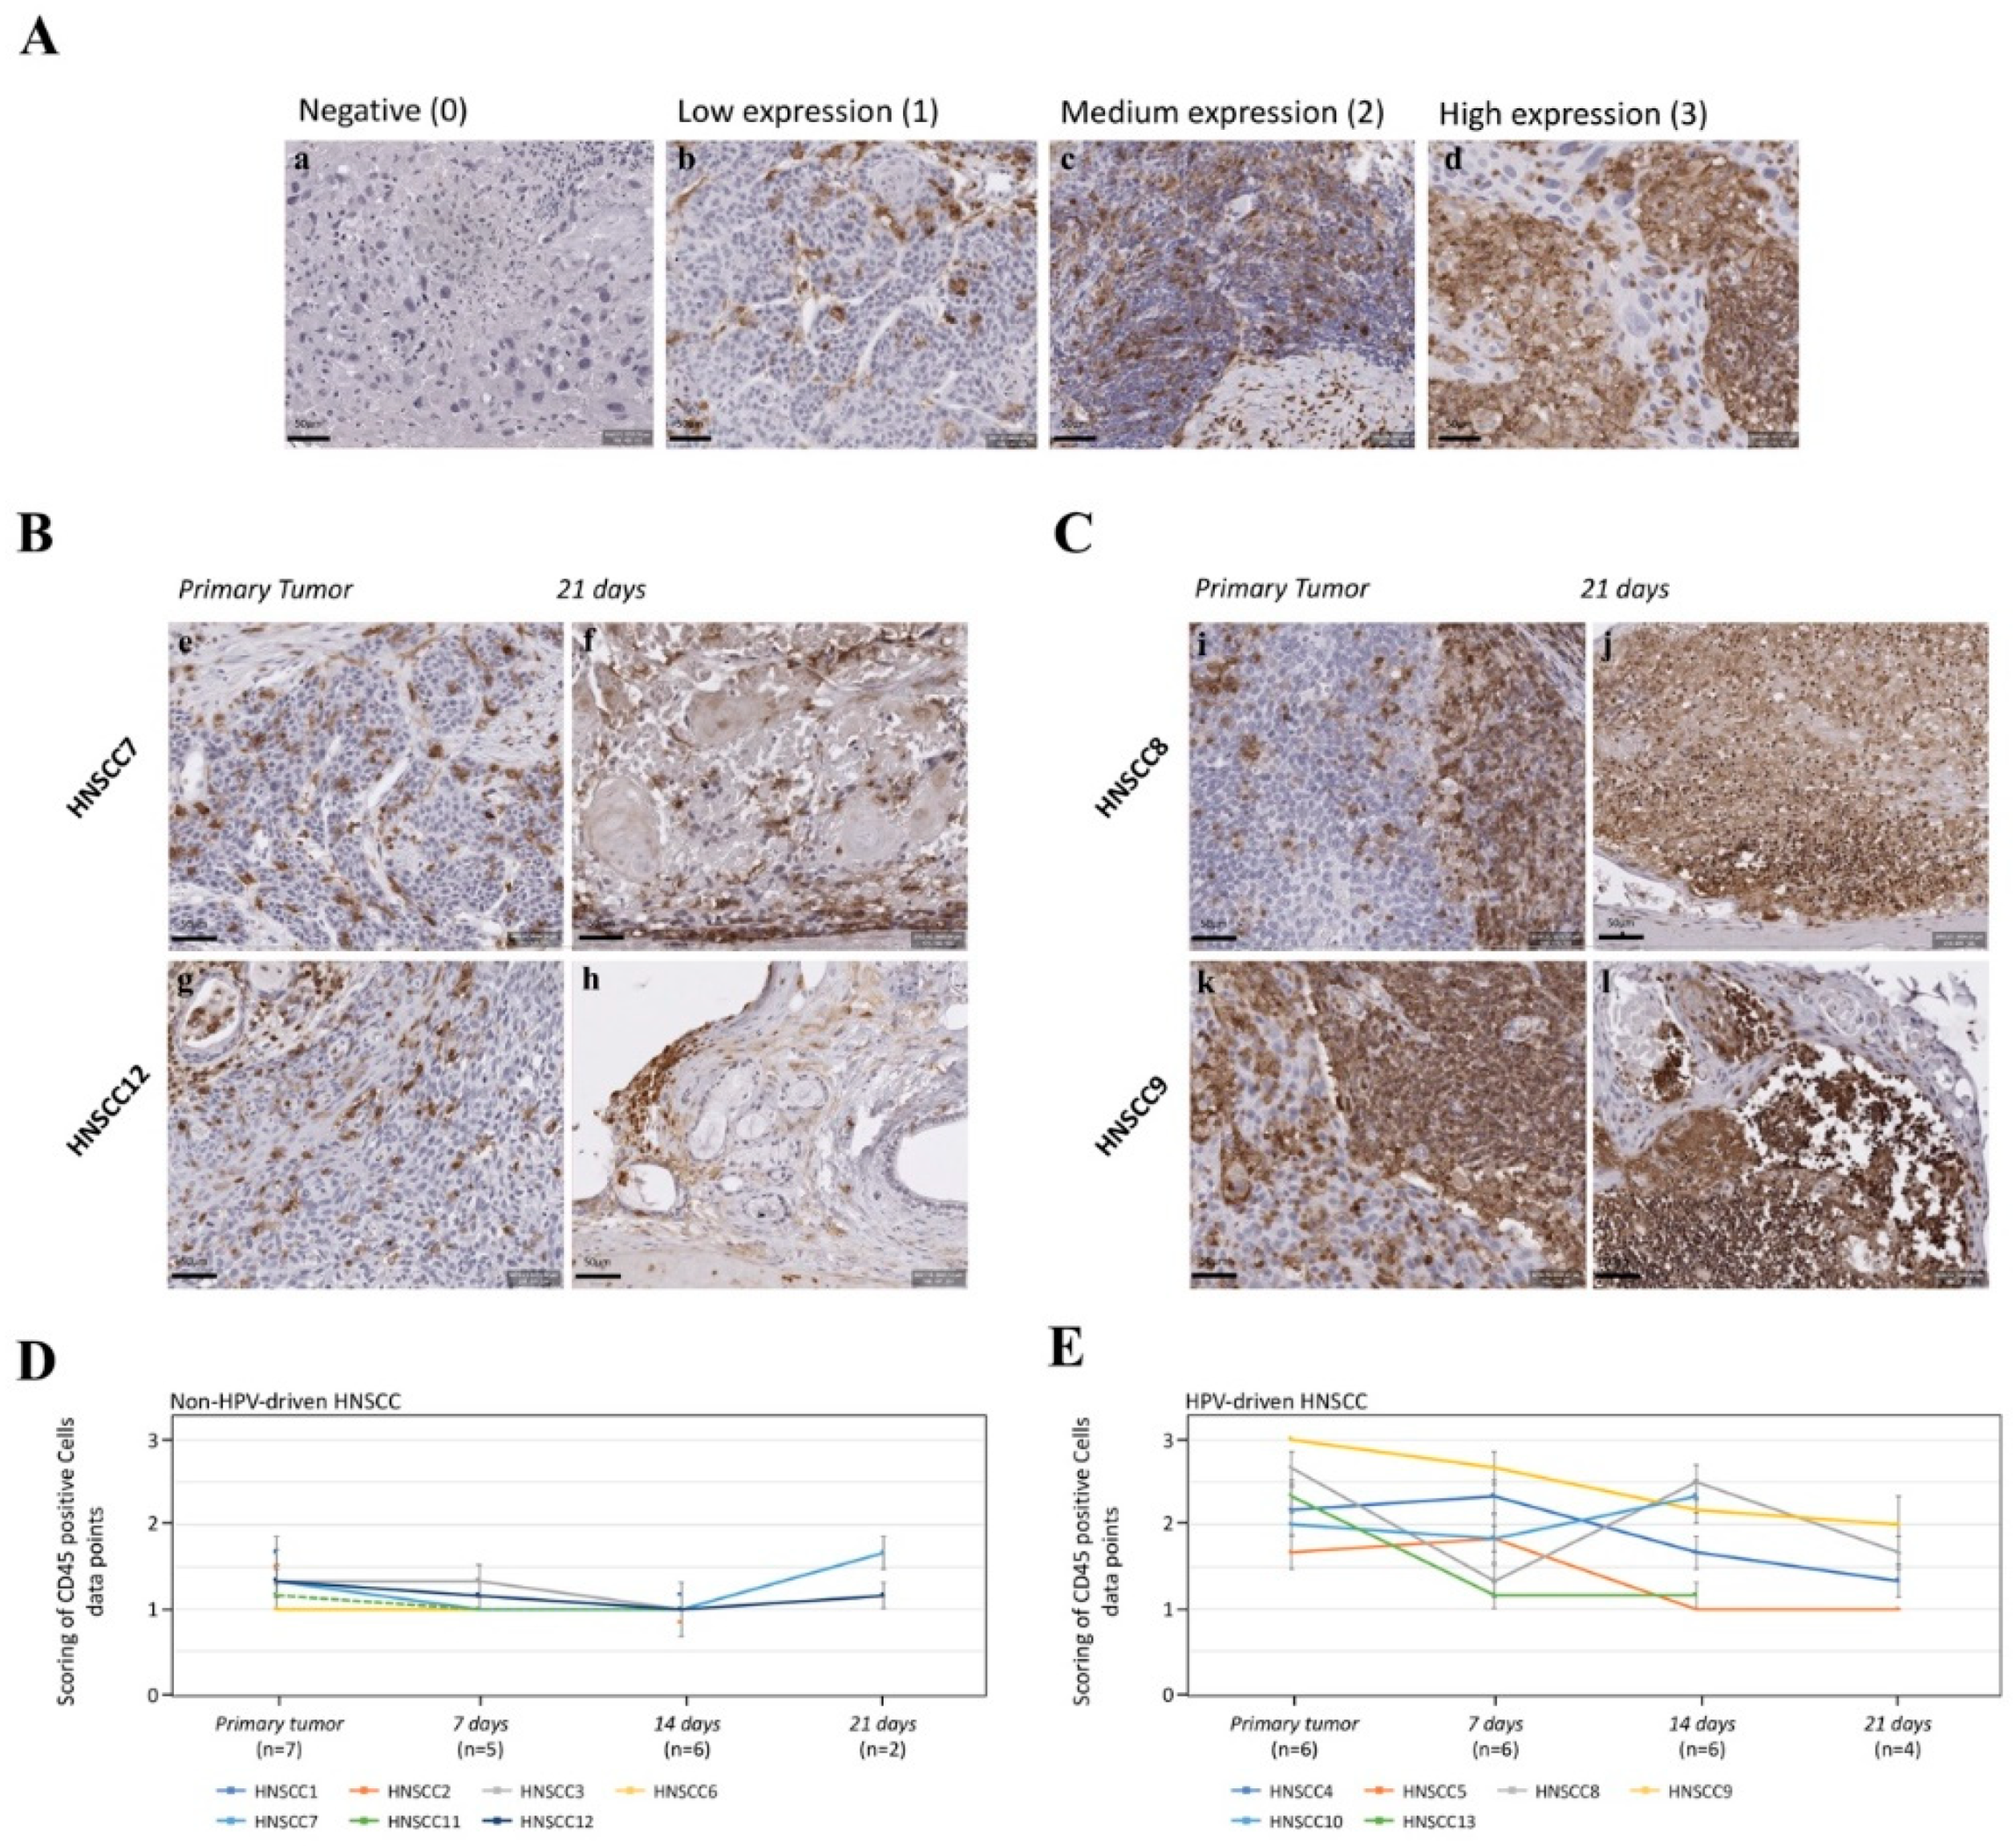
3.1.4. Expression of CD45 as a Pan-Leukocyte Marker in Non-HPV-Driven HNSCC
3.2. D-OTC Models from HPV-Driven Tumors
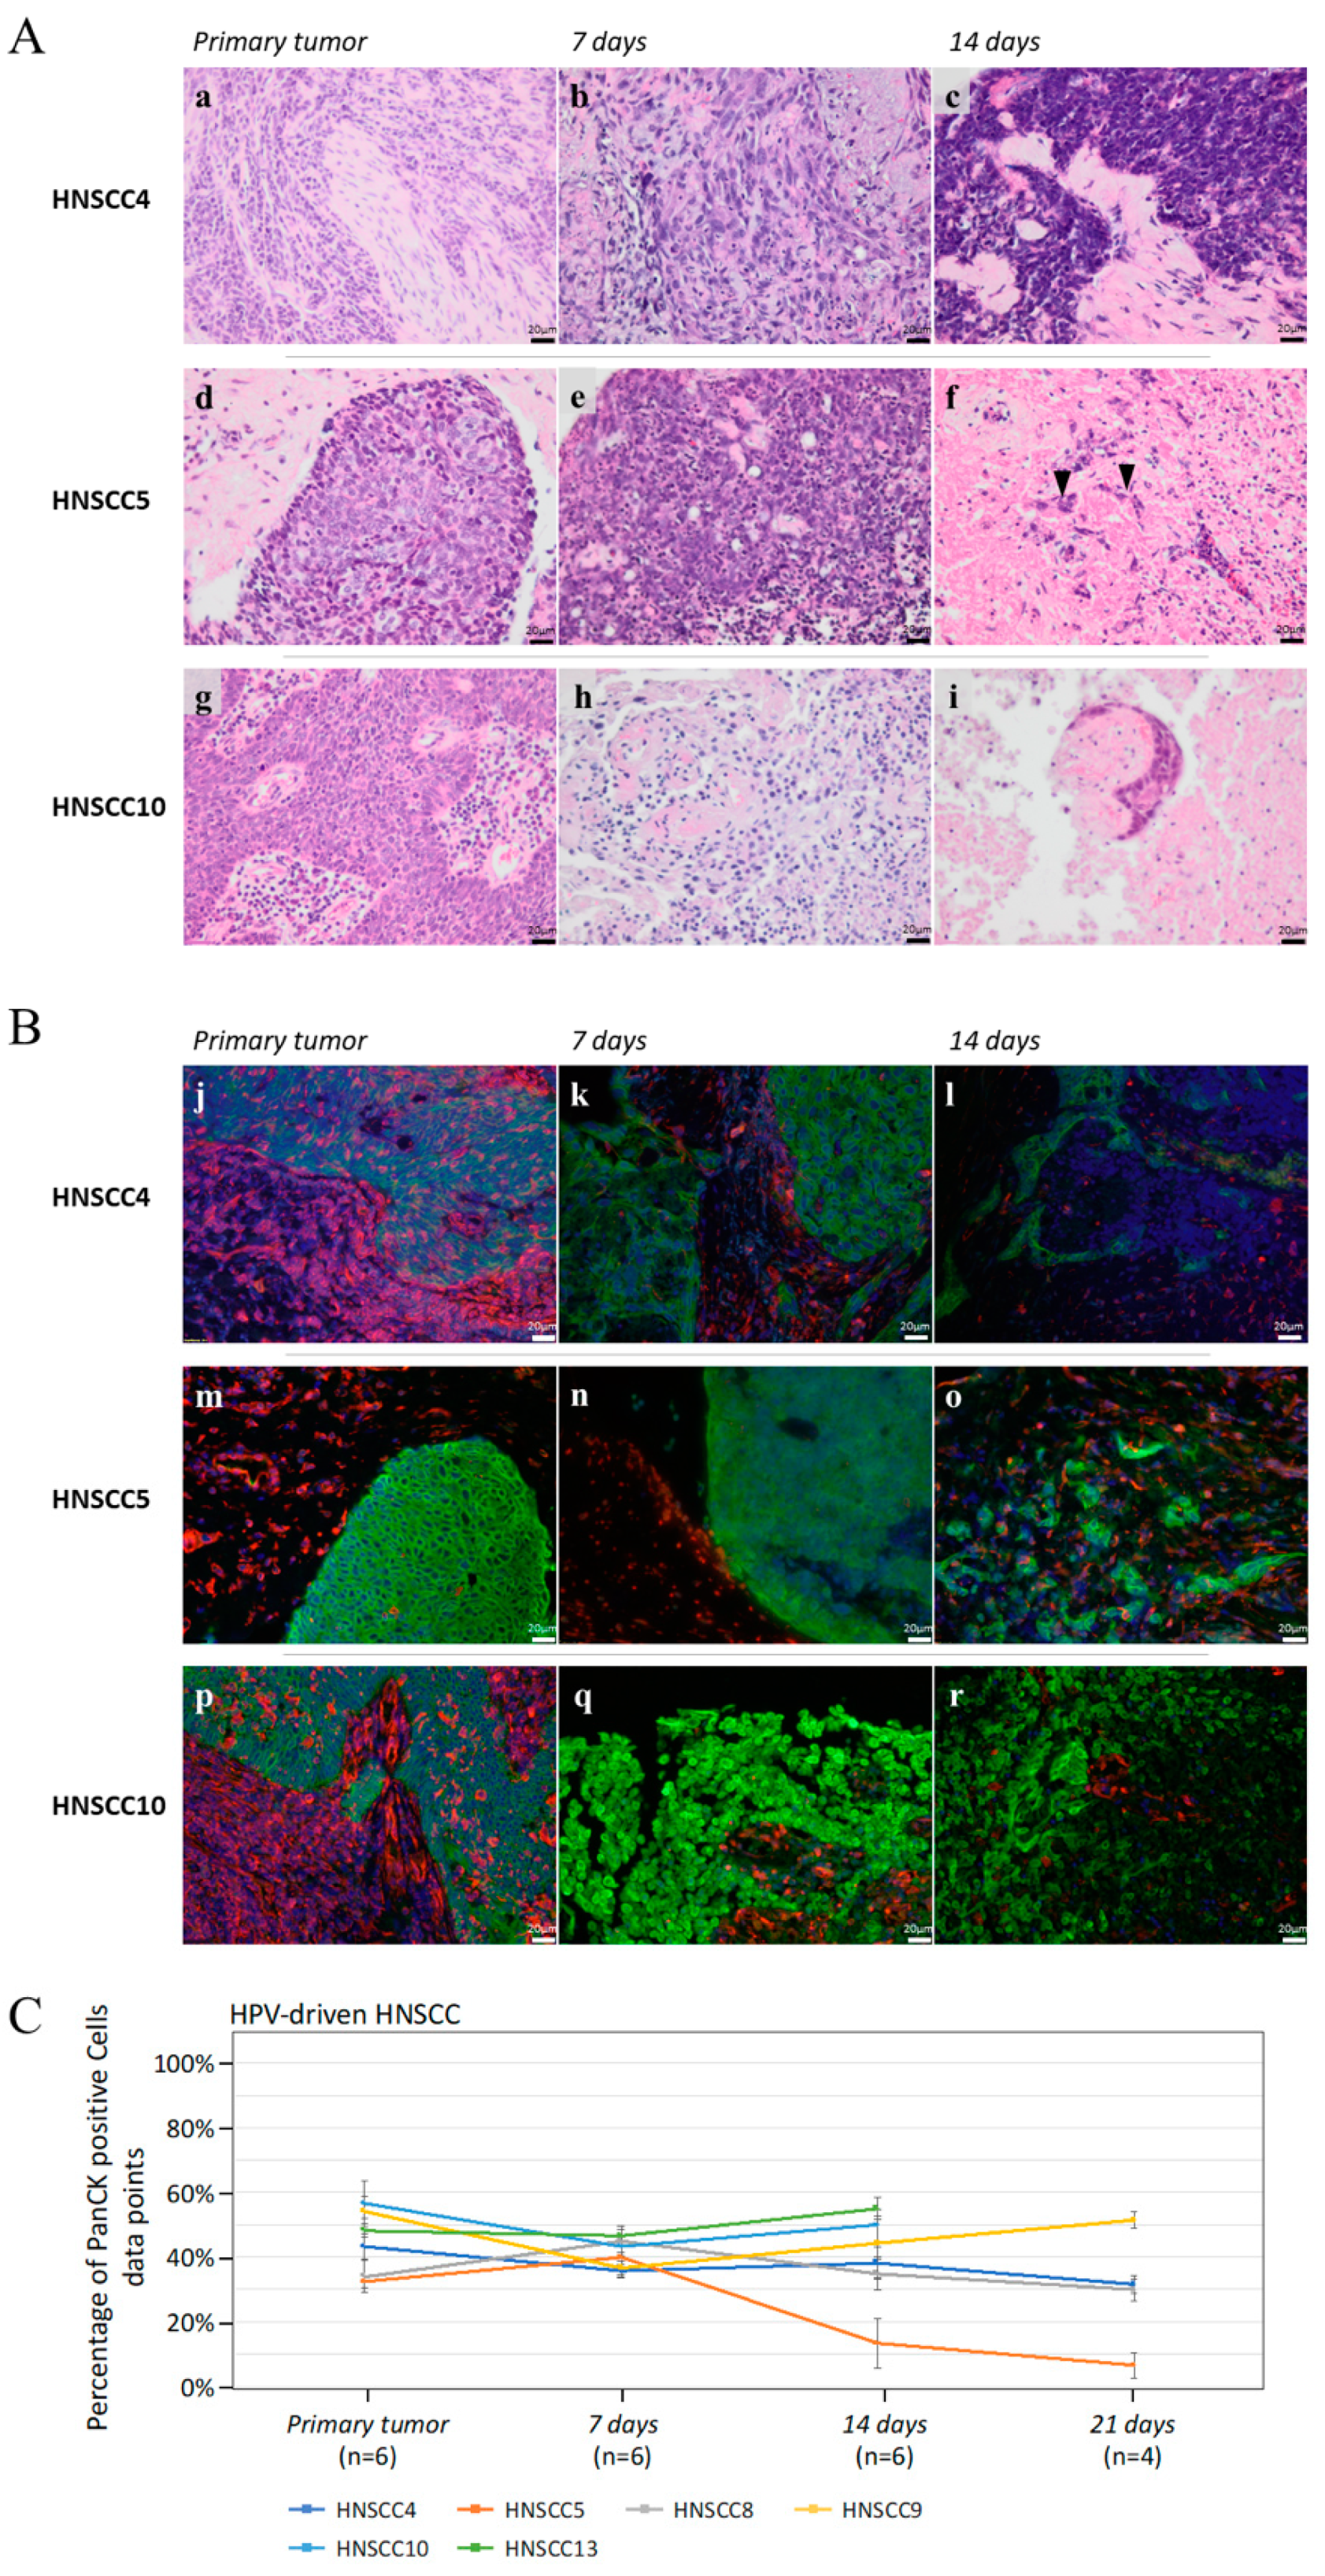
3.2.1. Cancer Cell Viability, Proliferation, and Apoptosis of HPV-Driven HNSCC
3.2.2. Motility and Invasiveness of HPV-Driven HNSCC
3.2.3. Cancer-Associated Fibroblasts in HPV-Driven HNSCC
3.2.4. Expression of CD45 as a Pan-Leukocyte Marker in HPV-Driven HNSCC
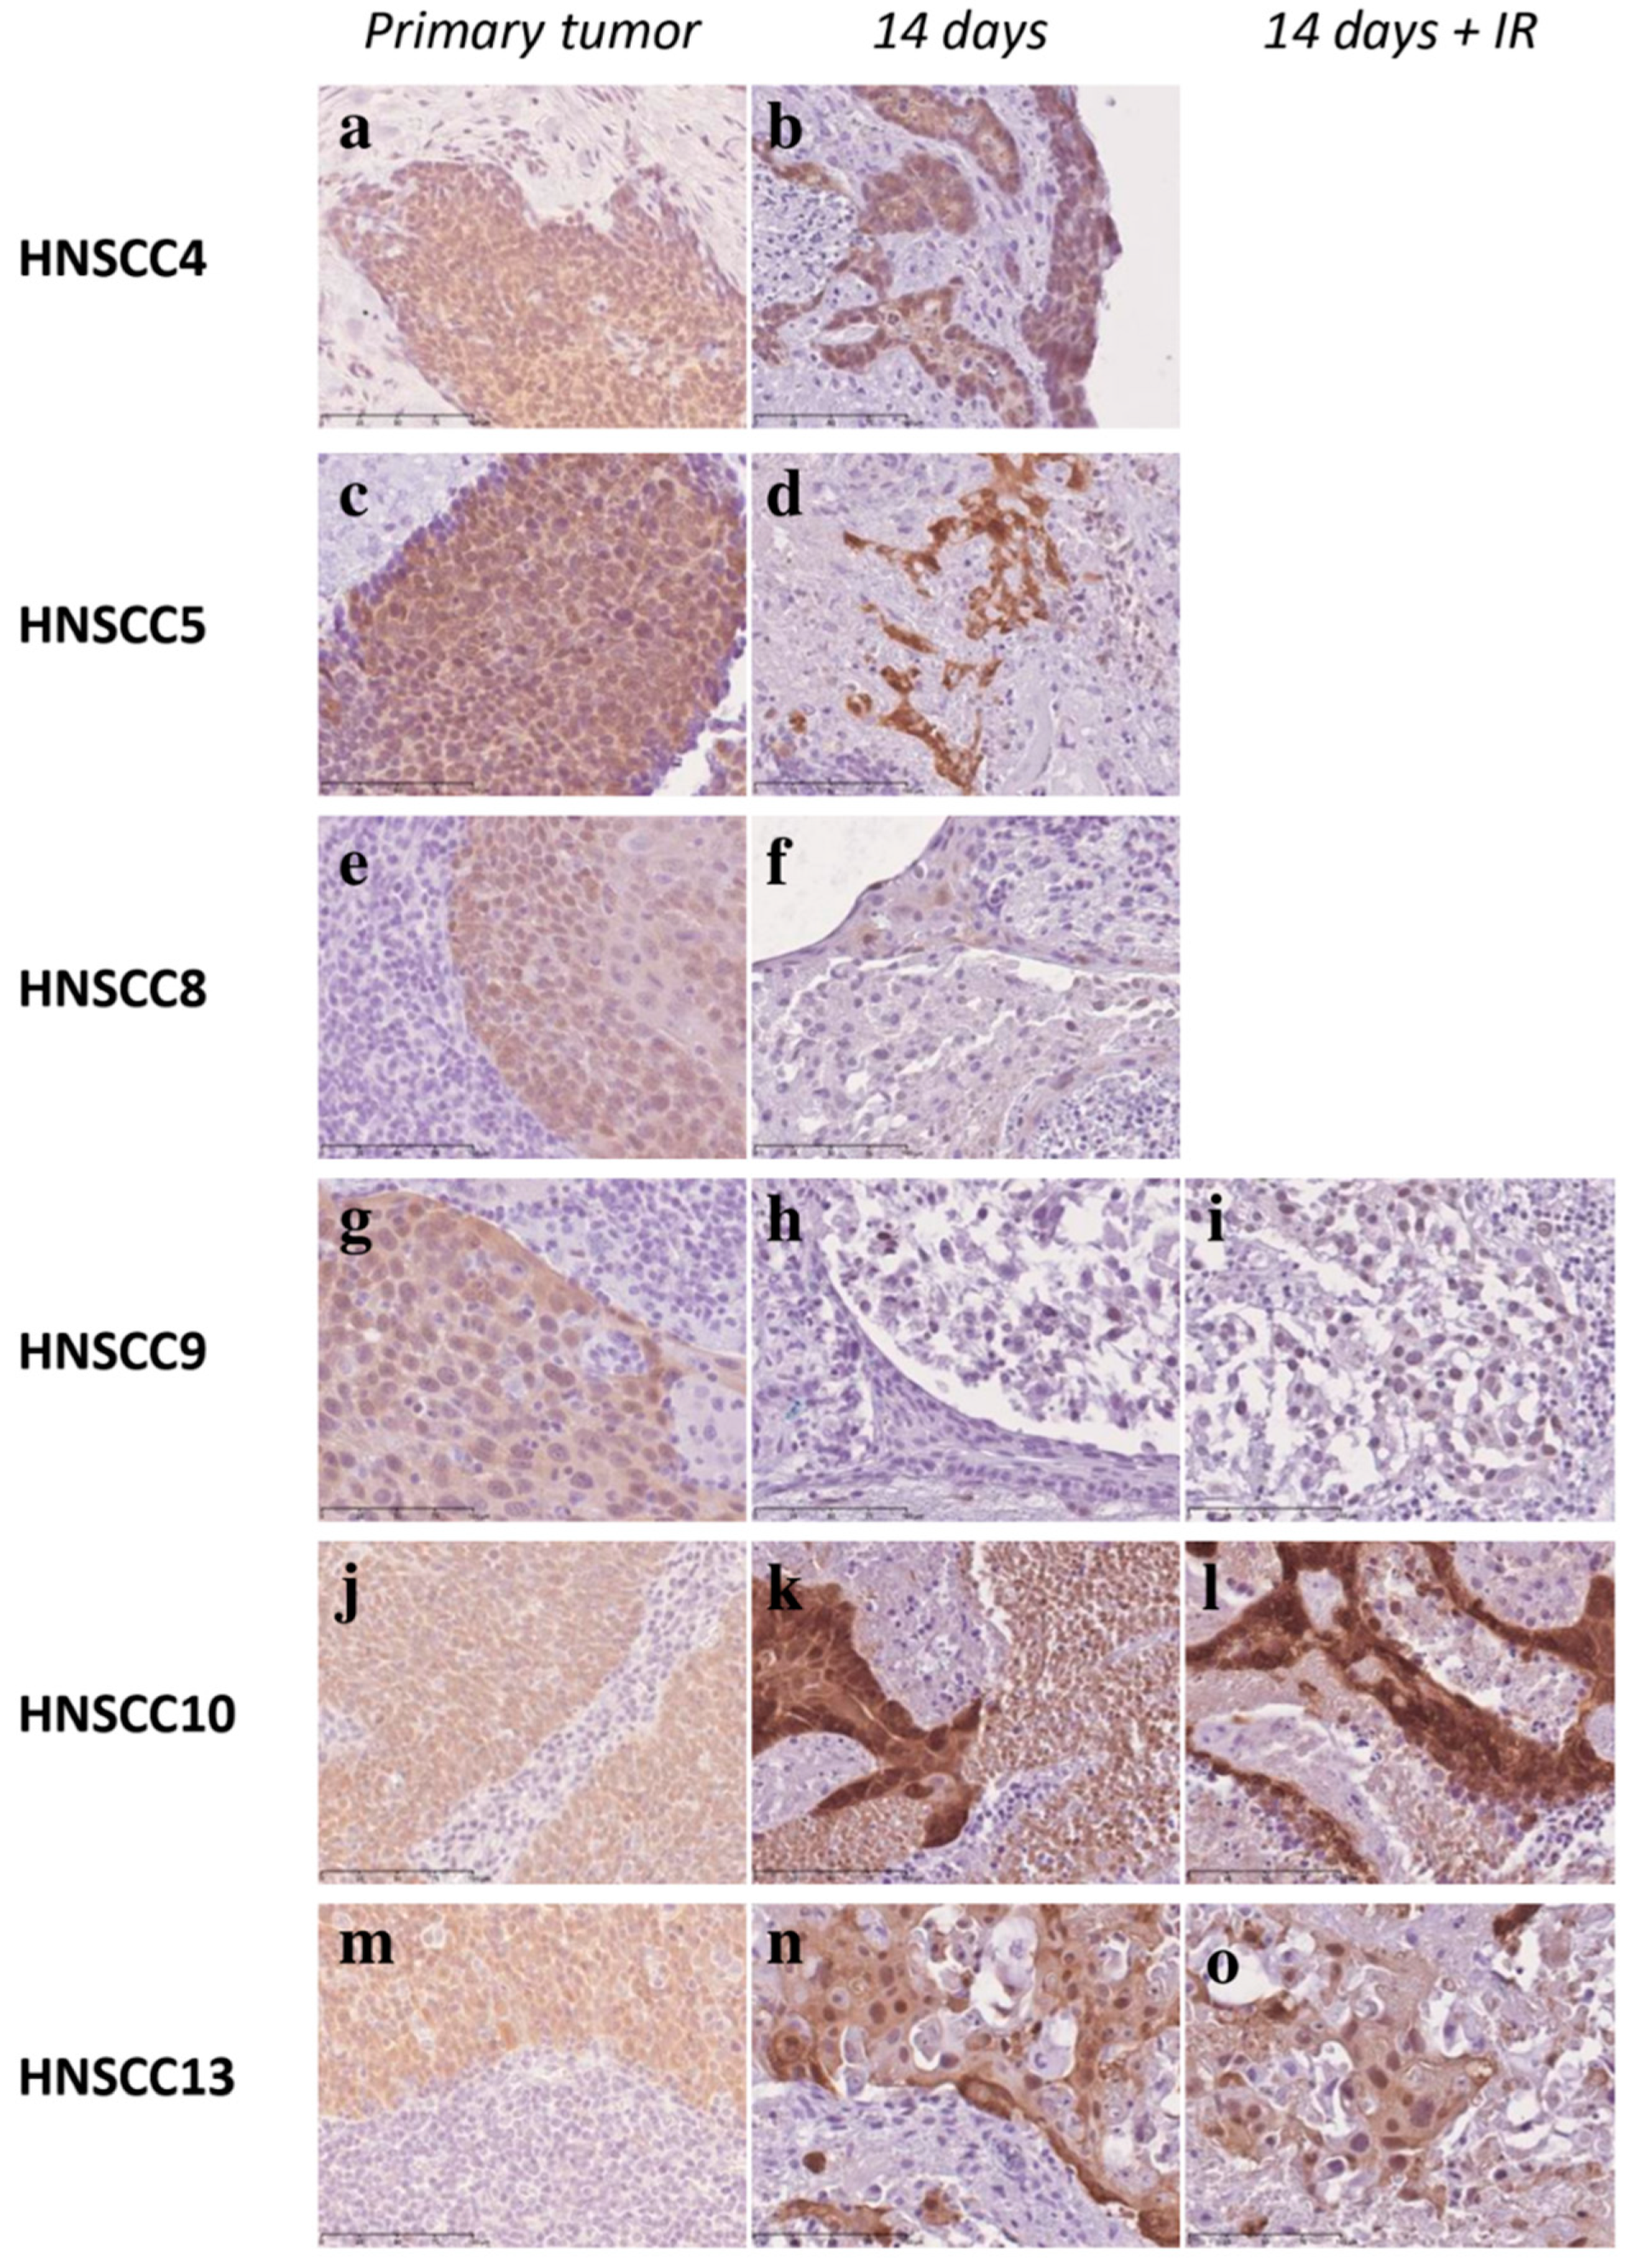
3.3. Fractionated IR of 3D-OTCs
3.4. Correlation of Patient Relapse and Growth Patterns of 3D-HNSCC OTC
4. Discussion
5. Conclusions
Supplementary Materials
Author Contributions
Funding
Acknowledgments
Conflicts of Interest
Additional Information
References
- Mroz, E.A.; Rocco, J.W. Intra-tumor heterogeneity in head and neck cancer and its clinical implications. World J. Otorhinolaryngol. Head Neck Surg. 2016, 2, 60–67. [Google Scholar] [CrossRef] [PubMed] [Green Version]
- Gatta, G.; Botta, L.; Sanchez, M.J.; Anderson, L.A.; Pierannunzio, D.; Licitra, L.; Group, E.W. Prognoses and improvement for head and neck cancers diagnosed in Europe in early 2000s: The EUROCARE-5 population-based study. Eur. J. Cancer 2015, 51, 2130–2143. [Google Scholar] [CrossRef] [PubMed]
- Giraldi, L.; Leoncini, E.; Pastorino, R.; Wunsch-Filho, V.; de Carvalho, M.; Lopez, R.; Cadoni, G.; Arzani, D.; Petrelli, L.; Matsuo, K.; et al. Alcohol and cigarette consumption predict mortality in patients with head and neck cancer: A pooled analysis within the International Head and Neck Cancer Epidemiology (INHANCE) Consortium. Ann. Oncol. 2017, 28, 2843–2851. [Google Scholar] [CrossRef] [PubMed]
- Gillison, M.L.; Chaturvedi, A.K.; Anderson, W.F.; Fakhry, C. Epidemiology of Human Papillomavirus-Positive Head and Neck Squamous Cell Carcinoma. J. Clin. Oncol. 2015, 33, 3235–3242. [Google Scholar] [CrossRef] [Green Version]
- Miller, D.L.; Davis, J.W.; Taylor, K.H.; Johnson, J.; Shi, Z.; Williams, R.; Atasoy, U.; Lewis, J.S., Jr.; Stack, M.S. Identification of a human papillomavirus-associated oncogenic miRNA panel in human oropharyngeal squamous cell carcinoma validated by bioinformatics analysis of the Cancer Genome Atlas. Am. J. Pathol. 2015, 185, 679–692. [Google Scholar] [CrossRef] [Green Version]
- Spence, T.; Bruce, J.; Yip, K.W.; Liu, F.F. HPV Associated Head and Neck Cancer. Cancers 2016, 8, 75. [Google Scholar] [CrossRef] [Green Version]
- Dahiya, K.; Dhankhar, R. Updated overview of current biomarkers in head and neck carcinoma. World J. Methodol. 2016, 6, 77–86. [Google Scholar] [CrossRef]
- Affolter, A.; Schmidtmann, I.; Mann, W.J.; Brieger, J. Cancer-associated fibroblasts do not respond to combined irradiation and kinase inhibitor treatment. Oncol. Rep. 2013, 29, 785–790. [Google Scholar] [CrossRef] [Green Version]
- Fischer, H.; Taylor, N.; Allerstorfer, S.; Grusch, M.; Sonvilla, G.; Holzmann, K.; Setinek, U.; Elbling, L.; Cantonati, H.; Grasl-Kraupp, B.; et al. Fibroblast growth factor receptor-mediated signals contribute to the malignant phenotype of non-small cell lung cancer cells: Therapeutic implications and synergism with epidermal growth factor receptor inhibition. Mol. Cancer Ther. 2008, 7, 3408–3419. [Google Scholar] [CrossRef] [Green Version]
- Guleng, B.; Tateishi, K.; Ohta, M.; Kanai, F.; Jazag, A.; Ijichi, H.; Tanaka, Y.; Washida, M.; Morikane, K.; Fukushima, Y.; et al. Blockade of the stromal cell-derived factor-1/CXCR4 axis attenuates in vivo tumor growth by inhibiting angiogenesis in a vascular endothelial growth factor-independent manner. Cancer Res. 2005, 65, 5864–5871. [Google Scholar] [CrossRef] [Green Version]
- Kim, S.Y.; Lee, C.H.; Midura, B.V.; Yeung, C.; Mendoza, A.; Hong, S.H.; Ren, L.; Wong, D.; Korz, W.; Merzouk, A.; et al. Inhibition of the CXCR4/CXCL12 chemokine pathway reduces the development of murine pulmonary metastases. Clin. Exp. Metastasis 2008, 25, 201–211. [Google Scholar] [CrossRef] [Green Version]
- Tanaka, N.; Osman, A.A.; Takahashi, Y.; Lindemann, A.; Patel, A.A.; Zhao, M.; Takahashi, H.; Myers, J.N. Head and neck cancer organoids established by modification of the CTOS method can be used to predict in vivo drug sensitivity. Oral Oncol. 2018, 87, 49–57. [Google Scholar] [CrossRef] [PubMed]
- Russo, M.V.; Faversani, A.; Gatti, S.; Ricca, D.; Del Gobbo, A.; Ferrero, S.; Palleschi, A.; Vaira, V.; Bosari, S. A new mouse avatar model of non-small cell lung cancer. Front. Oncol. 2015, 5, 52. [Google Scholar] [CrossRef] [PubMed] [Green Version]
- Daniel, V.C.; Marchionni, L.; Hierman, J.S.; Rhodes, J.T.; Devereux, W.L.; Rudin, C.M.; Yung, R.; Parmigiani, G.; Dorsch, M.; Peacock, C.D.; et al. A primary xenograft model of small-cell lung cancer reveals irreversible changes in gene expression imposed by culture in vitro. Cancer Res. 2009, 69, 3364–3373. [Google Scholar] [CrossRef] [PubMed] [Green Version]
- Morgan, K.M.; Riedlinger, G.M.; Rosenfeld, J.; Ganesan, S.; Pine, S.R. Patient-Derived Xenograft Models of Non-Small Cell Lung Cancer and Their Potential Utility in Personalized Medicine. Front. Oncol. 2017, 7, 2. [Google Scholar] [CrossRef] [PubMed] [Green Version]
- Tang, A.L.; Hauff, S.J.; Owen, J.H.; Graham, M.P.; Czerwinski, M.J.; Park, J.J.; Walline, H.; Papagerakis, S.; Stoerker, J.; McHugh, J.B.; et al. UM-SCC-104: A new human papillomavirus-16-positive cancer stem cell-containing head and neck squamous cell carcinoma cell line. Head Neck 2012, 34, 1480–1491. [Google Scholar] [CrossRef] [PubMed] [Green Version]
- Forslund, O.; Sugiyama, N.; Wu, C.; Ravi, N.; Jin, Y.; Swoboda, S.; Andersson, F.; Bzhalava, D.; Hultin, E.; Paulsson, K.; et al. A novel human in vitro papillomavirus type 16 positive tonsil cancer cell line with high sensitivity to radiation and cisplatin. BMC Cancer 2019, 19, 265. [Google Scholar] [CrossRef] [Green Version]
- Facompre, N.D.; Sahu, V.; Montone, K.T.; Harmeyer, K.M.; Nakagawa, H.; Rustgi, A.K.; Weinstein, G.S.; Gimotty, P.A.; Basu, D. Barriers to generating PDX models of HPV-related head and neck cancer. Laryngoscope 2017, 127, 2777–2783. [Google Scholar] [CrossRef]
- Klinghammer, K.; Raguse, J.D.; Plath, T.; Albers, A.E.; Joehrens, K.; Zakarneh, A.; Brzezicha, B.; Wulf-Goldenberg, A.; Keilholz, U.; Hoffmann, J.; et al. A comprehensively characterized large panel of head and neck cancer patient-derived xenografts identifies the mTOR inhibitor everolimus as potential new treatment option. Int. J. Cancer 2015, 136, 2940–2948. [Google Scholar] [CrossRef]
- Affolter, A.; Muller, M.F.; Sommer, K.; Stenzinger, A.; Zaoui, K.; Lorenz, K.; Wolf, T.; Sharma, S.; Wolf, J.; Perner, S.; et al. Targeting irradiation-induced mitogen-activated protein kinase activation in vitro and in an ex vivo model for human head and neck cancer. Head Neck 2016, 38 (Suppl. S1), 2049–2061. [Google Scholar] [CrossRef]
- Freudlsperger, C.; Horn, D.; Weissfuss, S.; Weichert, W.; Weber, K.J.; Saure, D.; Sharma, S.; Dyckhoff, G.; Grabe, N.; Plinkert, P.; et al. Phosphorylation of AKT(Ser473) serves as an independent prognostic marker for radiosensitivity in advanced head and neck squamous cell carcinoma. Int. J. Cancer 2015, 136, 2775–2785. [Google Scholar] [CrossRef] [PubMed]
- Burnworth, B.; Popp, S.; Stark, H.J.; Steinkraus, V.; Brocker, E.B.; Hartschuh, W.; Birek, C.; Boukamp, P. Gain of 11q/cyclin D1 overexpression is an essential early step in skin cancer development and causes abnormal tissue organization and differentiation. Oncogene 2006, 25, 4399–4412. [Google Scholar] [CrossRef] [PubMed] [Green Version]
- Nischt, R.; Schmidt, C.; Mirancea, N.; Baranowsky, A.; Mokkapati, S.; Smyth, N.; Woenne, E.C.; Stark, H.J.; Boukamp, P.; Breitkreutz, D. Lack of nidogen-1 and -2 prevents basement membrane assembly in skin-organotypic coculture. J. Investig. Dermatol. 2007, 127, 545–554. [Google Scholar] [CrossRef] [PubMed] [Green Version]
- Stark, H.J.; Willhauck, M.J.; Mirancea, N.; Boehnke, K.; Nord, I.; Breitkreutz, D.; Pavesio, A.; Boukamp, P.; Fusenig, N.E. Authentic fibroblast matrix in dermal equivalents normalises epidermal histogenesis and dermoepidermal junction in organotypic co-culture. Eur. J. Cell Biol. 2004, 83, 631–645. [Google Scholar] [CrossRef] [PubMed]
- Boehnke, K.; Mirancea, N.; Pavesio, A.; Fusenig, N.E.; Boukamp, P.; Stark, H.J. Effects of fibroblasts and microenvironment on epidermal regeneration and tissue function in long-term skin equivalents. Eur. J. Cell Biol. 2007, 86, 731–746. [Google Scholar] [CrossRef]
- Pinto, S.; Stark, H.J.; Martin, I.; Boukamp, P.; Kyewski, B. 3D Organotypic Co-culture Model Supporting Medullary Thymic Epithelial Cell Proliferation, Differentiation and Promiscuous Gene Expression. J. Vis. Exp. 2015, e52614. [Google Scholar] [CrossRef] [Green Version]
- Thierauf, J.; Weissinger, S.E.; Veit, J.A.; Affolter, A.; Laureano, N.K.; Beutner, D.; Heiduschka, G.; Kadletz, L.; Meyer, M.; Quaas, A.; et al. Low SOX2 expression marks a distinct subset of adenoid cystic carcinoma of the head and neck and is associated with an advanced tumor stage. PLoS ONE 2018, 13, e0194989. [Google Scholar] [CrossRef] [Green Version]
- Schmitt, M.; Dondog, B.; Waterboer, T.; Pawlita, M. Homogeneous amplification of genital human alpha papillomaviruses by PCR using novel broad-spectrum GP5+ and GP6+ primers. J. Clin. Microbiol. 2008, 46, 1050–1059. [Google Scholar] [CrossRef] [Green Version]
- Perri, F.; Pacelli, R.; Della Vittoria Scarpati, G.; Cella, L.; Giuliano, M.; Caponigro, F.; Pepe, S. Radioresistance in head and neck squamous cell carcinoma: Biological bases and therapeutic implications. Head Neck 2015, 37, 763–770. [Google Scholar] [CrossRef]
- Psyrri, A.; Seiwert, T.Y.; Jimeno, A. Molecular pathways in head and neck cancer: EGFR, PI3K, and more. Am. Soc. Clin. Oncol. Educ. Book 2013, 246–255. [Google Scholar] [CrossRef]
- Smiraglia, D.J.; Rush, L.J.; Fruhwald, M.C.; Dai, Z.; Held, W.A.; Costello, J.F.; Lang, J.C.; Eng, C.; Li, B.; Wright, F.A.; et al. Excessive CpG island hypermethylation in cancer cell lines versus primary human malignancies. Hum. Mol. Genet. 2001, 10, 1413–1419. [Google Scholar] [CrossRef] [PubMed] [Green Version]
- Suter, C.M.; Norrie, M.; Ku, S.L.; Cheong, K.F.; Tomlinson, I.; Ward, R.L. CpG island methylation is a common finding in colorectal cancer cell lines. Br. J. Cancer 2003, 88, 413–419. [Google Scholar] [CrossRef] [PubMed] [Green Version]
- Carey, T.E. Atlas of Human Tumor Cell Lines; Hay, R.J., Park, J.-G., Gazdar, A., Eds.; Academic Press: San Diego, CA, USA, 1994; Volume 1, Chapter 4; pp. 70–120. [Google Scholar]
- Easty, D.M.; Easty, G.C.; Carter, R.L.; Monaghan, P.; Butler, L.J. Ten human carcinoma cell lines derived from squamous carcinomas of the head and neck. Br. J. Cancer 1981, 43, 772–785. [Google Scholar] [CrossRef] [PubMed] [Green Version]
- Kim, S.Y.; Chu, K.C.; Lee, H.R.; Lee, K.S.; Carey, T.E. Establishment and characterization of nine new head and neck cancer cell lines. Acta Otolaryngol. 1997, 117, 775–784. [Google Scholar] [CrossRef] [PubMed]
- Sacks, P.G.; Parnes, S.M.; Gallick, G.E.; Mansouri, Z.; Lichtner, R.; Satya-Prakash, K.L.; Pathak, S.; Parsons, D.F. Establishment and characterization of two new squamous cell carcinoma cell lines derived from tumors of the head and neck. Cancer Res. 1988, 48, 2858–2866. [Google Scholar] [PubMed]
- White, J.S.; Weissfeld, J.L.; Ragin, C.C.; Rossie, K.M.; Martin, C.L.; Shuster, M.; Ishwad, C.S.; Law, J.C.; Myers, E.N.; Johnson, J.T.; et al. The influence of clinical and demographic risk factors on the establishment of head and neck squamous cell carcinoma cell lines. Oral Oncol. 2007, 43, 701–712. [Google Scholar] [CrossRef] [Green Version]
- Dohmen, A.J.; Swartz, J.E.; Van Den Brekel, M.W.; Willems, S.M.; Spijker, R.; Neefjes, J.; Zuur, C.L. Feasibility of Primary Tumor Culture Models and Preclinical Prediction Assays for Head and Neck Cancer: A Narrative Review. Cancers 2015, 7, 1716–1742. [Google Scholar] [CrossRef] [Green Version]
- Choi, S.Y.; Lin, D.; Gout, P.W.; Collins, C.C.; Xu, Y.; Wang, Y. Lessons from patient-derived xenografts for better in vitro modeling of human cancer. Adv. Drug Deliv. Rev. 2014, 79–80, 222–237. [Google Scholar] [CrossRef] [Green Version]
- Peng, S.; Creighton, C.J.; Zhang, Y.; Sen, B.; Mazumdar, T.; Myers, J.N.; Lai, S.Y.; Woolfson, A.; Lorenzi, M.V.; Bell, D.; et al. Tumor grafts derived from patients with head and neck squamous carcinoma authentically maintain the molecular and histologic characteristics of human cancers. J. Transl. Med. 2013, 11, 198. [Google Scholar] [CrossRef] [Green Version]
- Cassidy, J.W.; Caldas, C.; Bruna, A. Maintaining Tumor Heterogeneity in Patient-Derived Tumor Xenografts. Cancer Res 2015, 75, 2963–2968. [Google Scholar] [CrossRef] [Green Version]
- Morton, J.J.; Bird, G.; Keysar, S.B.; Astling, D.P.; Lyons, T.R.; Anderson, R.T.; Glogowska, M.J.; Estes, P.; Eagles, J.R.; Le, P.N.; et al. XactMice: Humanizing mouse bone marrow enables microenvironment reconstitution in a patient-derived xenograft model of head and neck cancer. Oncogene 2016, 35, 290–300. [Google Scholar] [CrossRef] [PubMed] [Green Version]
- Hoffman, R.M. Patient-derived orthotopic xenografts: Better mimic of metastasis than subcutaneous xenografts. Nat. Rev. Cancer 2015, 15, 451–452. [Google Scholar] [CrossRef] [PubMed]
- Nitschinsk, K.; Idris, A.; McMillan, N. Patient derived xenografts as models for head and neck cancer. Cancer Lett. 2018, 434, 114–119. [Google Scholar] [CrossRef] [PubMed]
- Roerink, S.F.; Sasaki, N.; Lee-Six, H.; Young, M.D.; Alexandrov, L.B.; Behjati, S.; Mitchell, T.J.; Grossmann, S.; Lightfoot, H.; Egan, D.A.; et al. Intra-tumour diversification in colorectal cancer at the single-cell level. Nature 2018, 556, 457–462. [Google Scholar] [CrossRef] [PubMed]
- Mery, B.; Rancoule, C.; Guy, J.B.; Espenel, S.; Wozny, A.S.; Battiston-Montagne, P.; Ardail, D.; Beuve, M.; Alphonse, G.; Rodriguez-Lafrasse, C.; et al. Preclinical models in HNSCC: A comprehensive review. Oral Oncol. 2017, 65, 51–56. [Google Scholar] [CrossRef] [PubMed]
- Bryne, M.; Koppang, H.S.; Lilleng, R.; Kjaerheim, A. Malignancy grading of the deep invasive margins of oral squamous cell carcinomas has high prognostic value. J. Pathol. 1992, 166, 375–381. [Google Scholar] [CrossRef] [PubMed]
- Odell, E.W.; Jani, P.; Sherriff, M.; Ahluwalia, S.M.; Hibbert, J.; Levison, D.A.; Morgan, P.R. The prognostic value of individual histologic grading parameters in small lingual squamous cell carcinomas. The importance of the pattern of invasion. Cancer 1994, 74, 789–794. [Google Scholar] [CrossRef]
- Zhu, Y.; Liu, H.; Xie, N.; Liu, X.; Huang, H.; Wang, C.; Hou, J. Impact of tumor budding in head and neck squamous cell carcinoma: A meta-analysis. Head Neck 2019, 41, 542–550. [Google Scholar] [CrossRef]
- Ziemann, F.; Arenz, A.; Preising, S.; Wittekindt, C.; Klussmann, J.P.; Engenhart-Cabillic, R.; Wittig, A. Increased sensitivity of HPV-positive head and neck cancer cell lines to x-irradiation +/− Cisplatin due to decreased expression of E6 and E7 oncoproteins and enhanced apoptosis. Am. J. Cancer Res. 2015, 5, 1017–1031. [Google Scholar]


© 2020 by the authors. Licensee MDPI, Basel, Switzerland. This article is an open access article distributed under the terms and conditions of the Creative Commons Attribution (CC BY) license (http://creativecommons.org/licenses/by/4.0/).
Share and Cite
Engelmann, L.; Thierauf, J.; Koerich Laureano, N.; Stark, H.-J.; Prigge, E.-S.; Horn, D.; Freier, K.; Grabe, N.; Rong, C.; Federspil, P.; et al. Organotypic Co-Cultures as a Novel 3D Model for Head and Neck Squamous Cell Carcinoma. Cancers 2020, 12, 2330. https://doi.org/10.3390/cancers12082330
Engelmann L, Thierauf J, Koerich Laureano N, Stark H-J, Prigge E-S, Horn D, Freier K, Grabe N, Rong C, Federspil P, et al. Organotypic Co-Cultures as a Novel 3D Model for Head and Neck Squamous Cell Carcinoma. Cancers. 2020; 12(8):2330. https://doi.org/10.3390/cancers12082330
Chicago/Turabian StyleEngelmann, Luca, Julia Thierauf, Natalia Koerich Laureano, Hans-Juergen Stark, Elena-Sophie Prigge, Dominik Horn, Kolja Freier, Niels Grabe, Chao Rong, Philippe Federspil, and et al. 2020. "Organotypic Co-Cultures as a Novel 3D Model for Head and Neck Squamous Cell Carcinoma" Cancers 12, no. 8: 2330. https://doi.org/10.3390/cancers12082330