Unique Role of Histone Methyltransferase PRDM8 in the Tumorigenesis of Virus-Negative Merkel Cell Carcinoma

 , and
, and 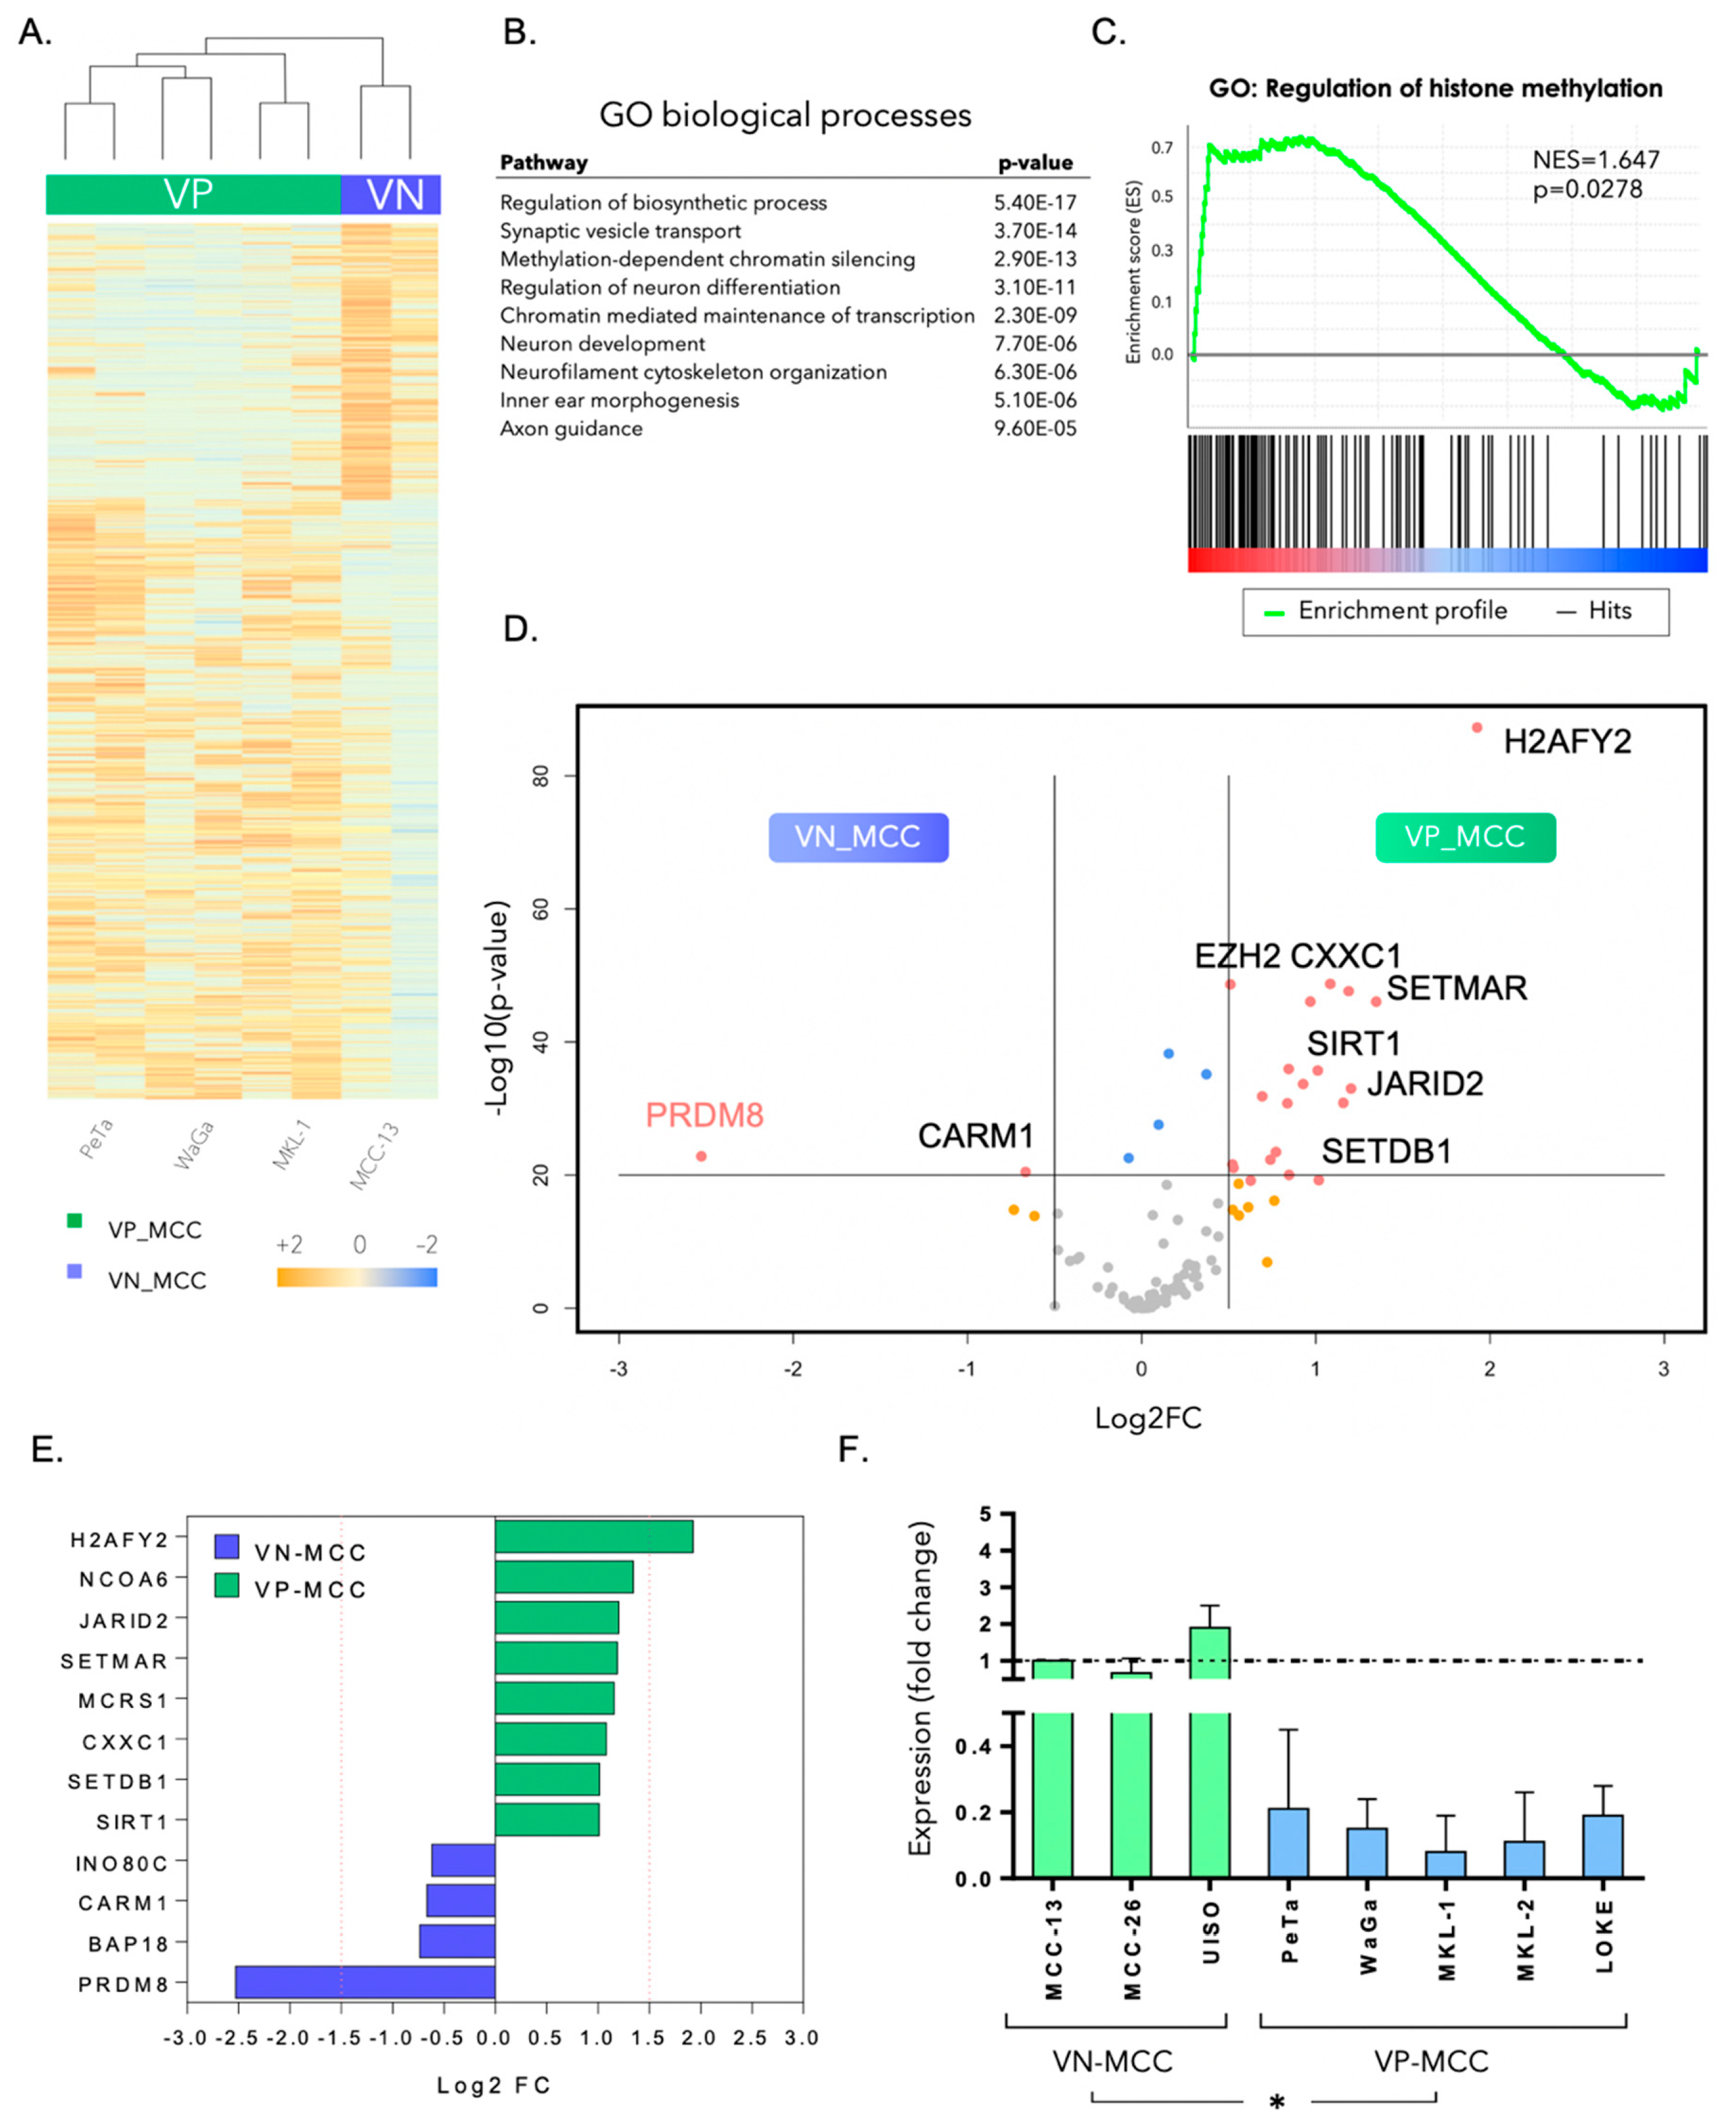
Abstract
:1. Introduction
2. Methods
2.1. Patient Samples and MCC Cell Lines
2.2. Immunohistochemistry (IHC), Immunocytochemistry, and Western Blot
2.3. mRNA and miRNA Expression Analyses
2.4. CRISPR-Cas9-Mediated Gene Silencing
2.5. Chromatin Immunoprecipitation Sequencing (ChIP-seq) and ChIP-qPCR
2.6. ChIP-seq Visualization Using IGV Browser
2.7. Quantitative PCR
2.8. Colony Formation Assay
2.9. miRNA Overexpression
2.10. Analysis of ChIP-seq Data from ENCODE Database
3. Results
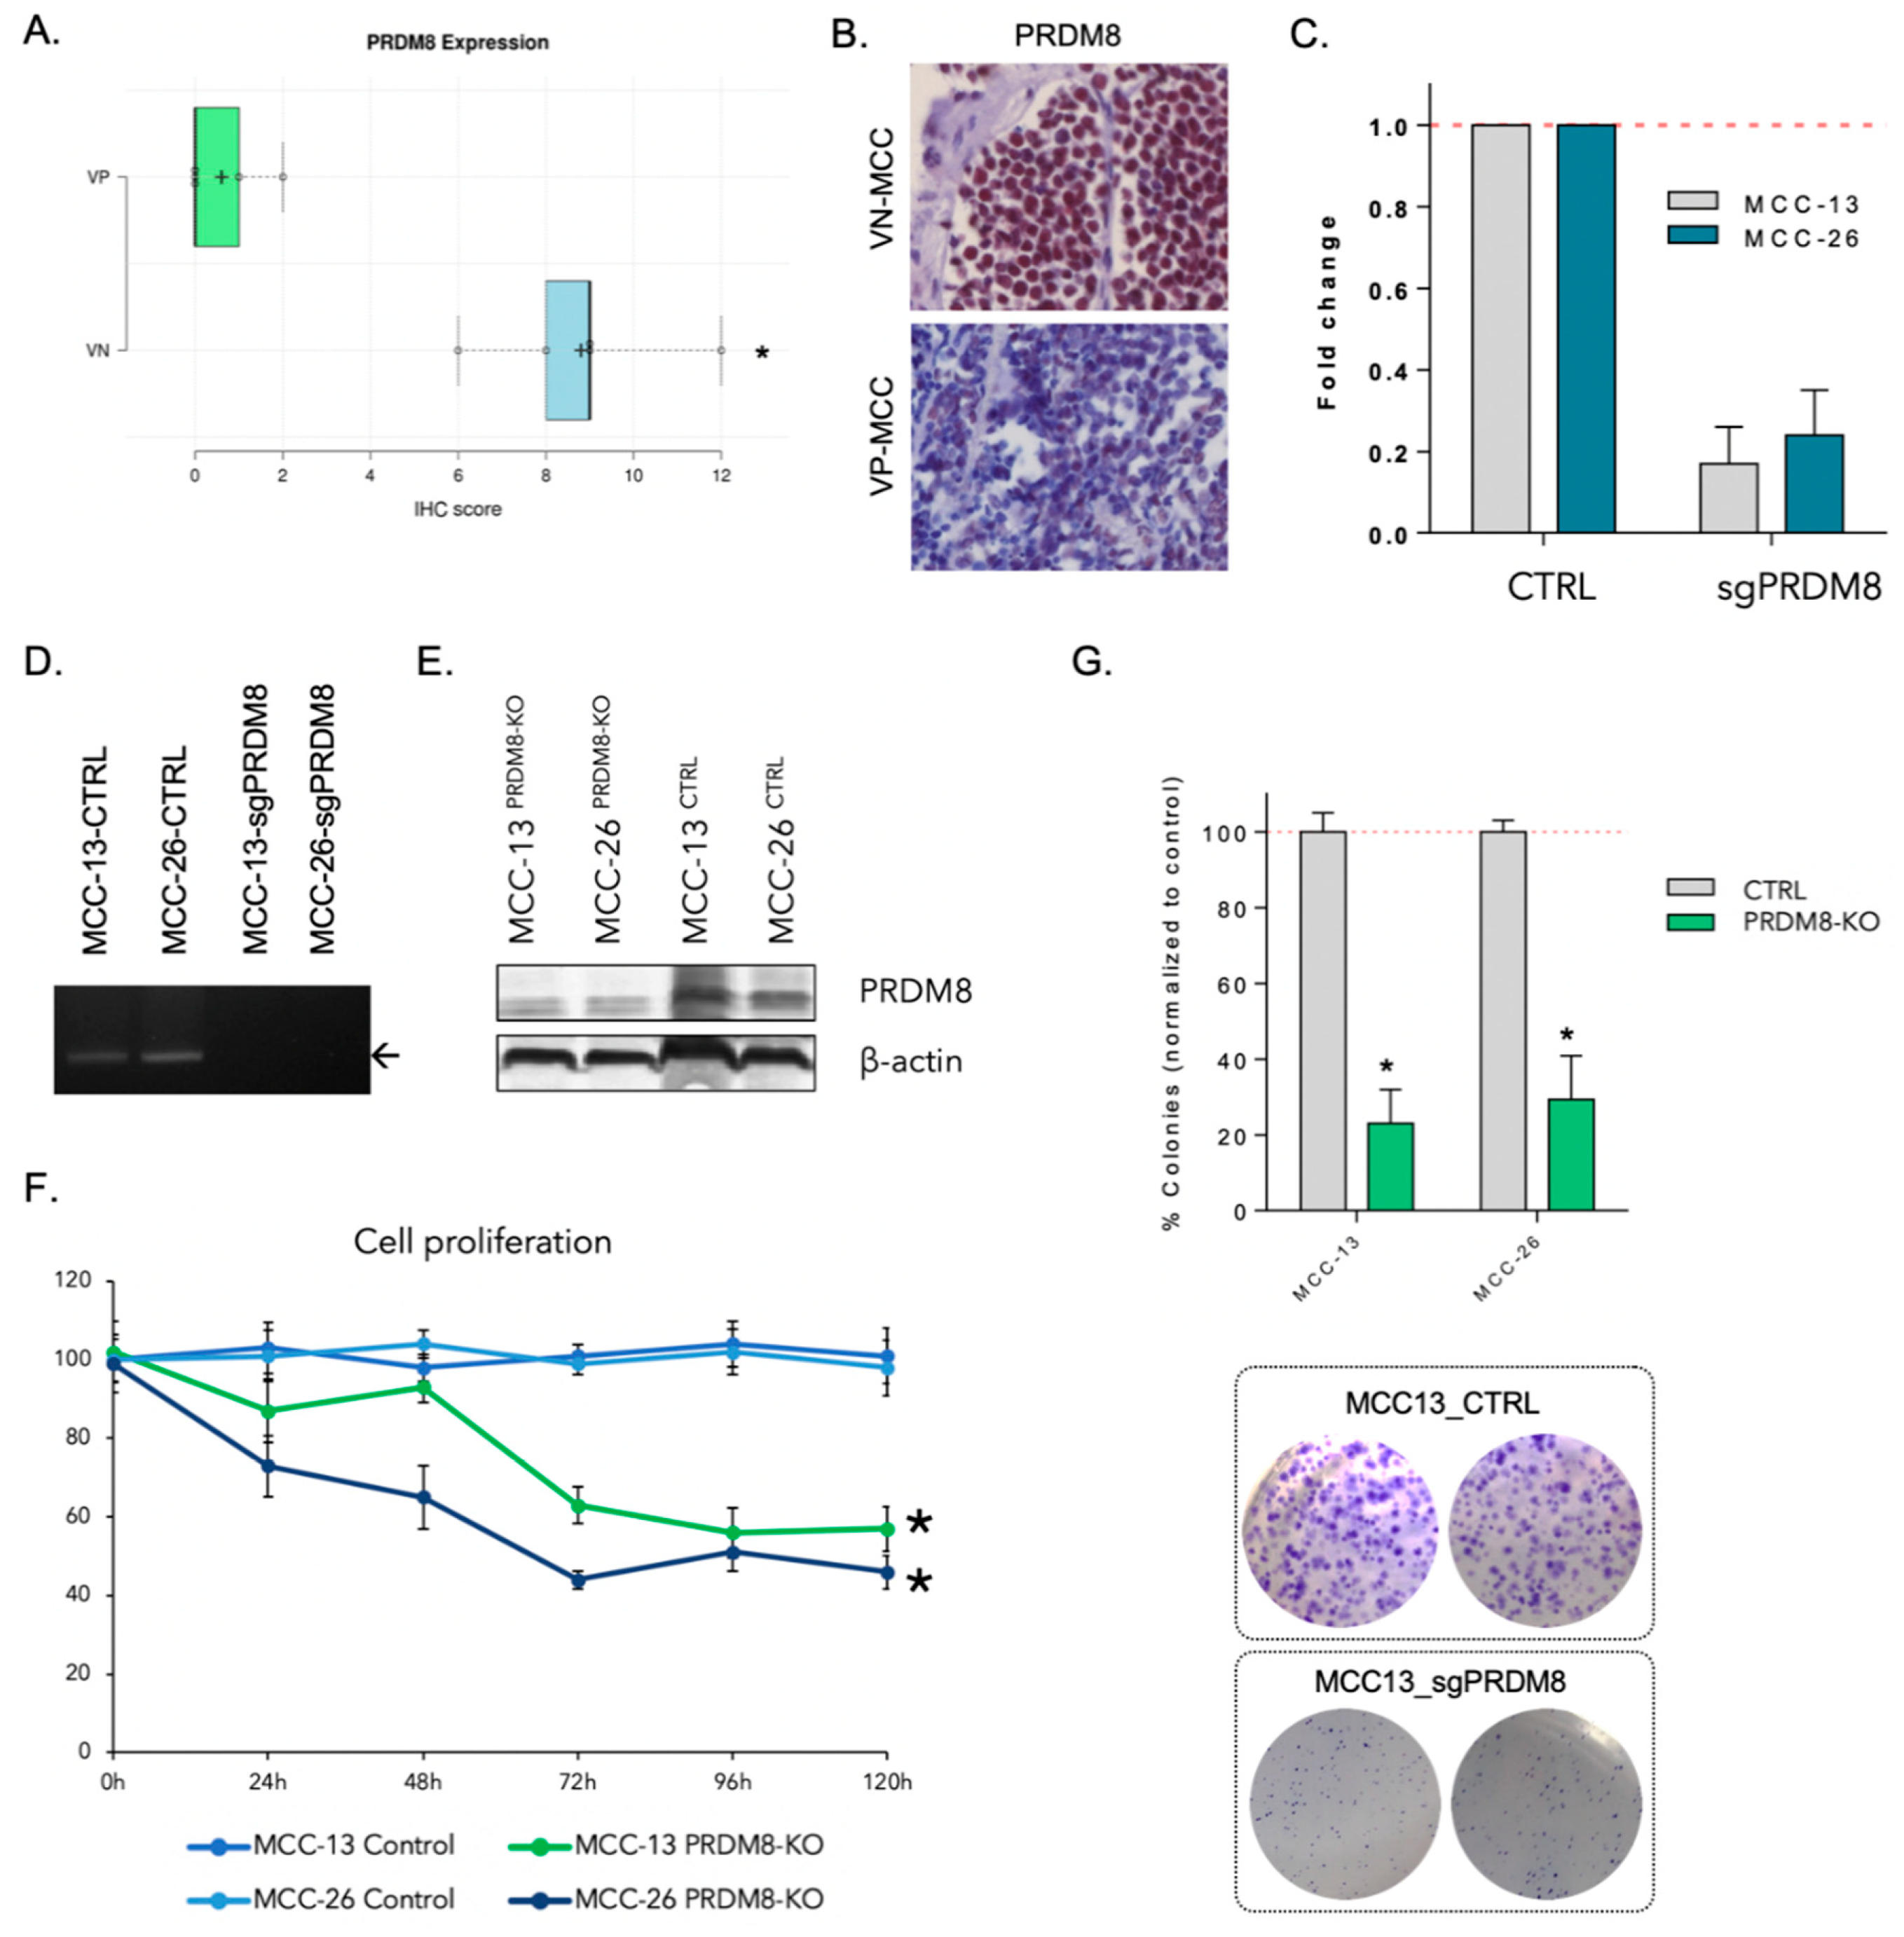
3.1. PRDM8 Is Highly Expressed in Virus-Negative Merkel Cell Carcinoma Cells and Is Correlated with Tumor Proliferation and Clonogenicity
3.2. PRDM8 Expression Was Correlated with Global H3K9me3 Level in VN-MCC
3.3. miR-20a-5p Regulated PRDM8 in VN-MCC
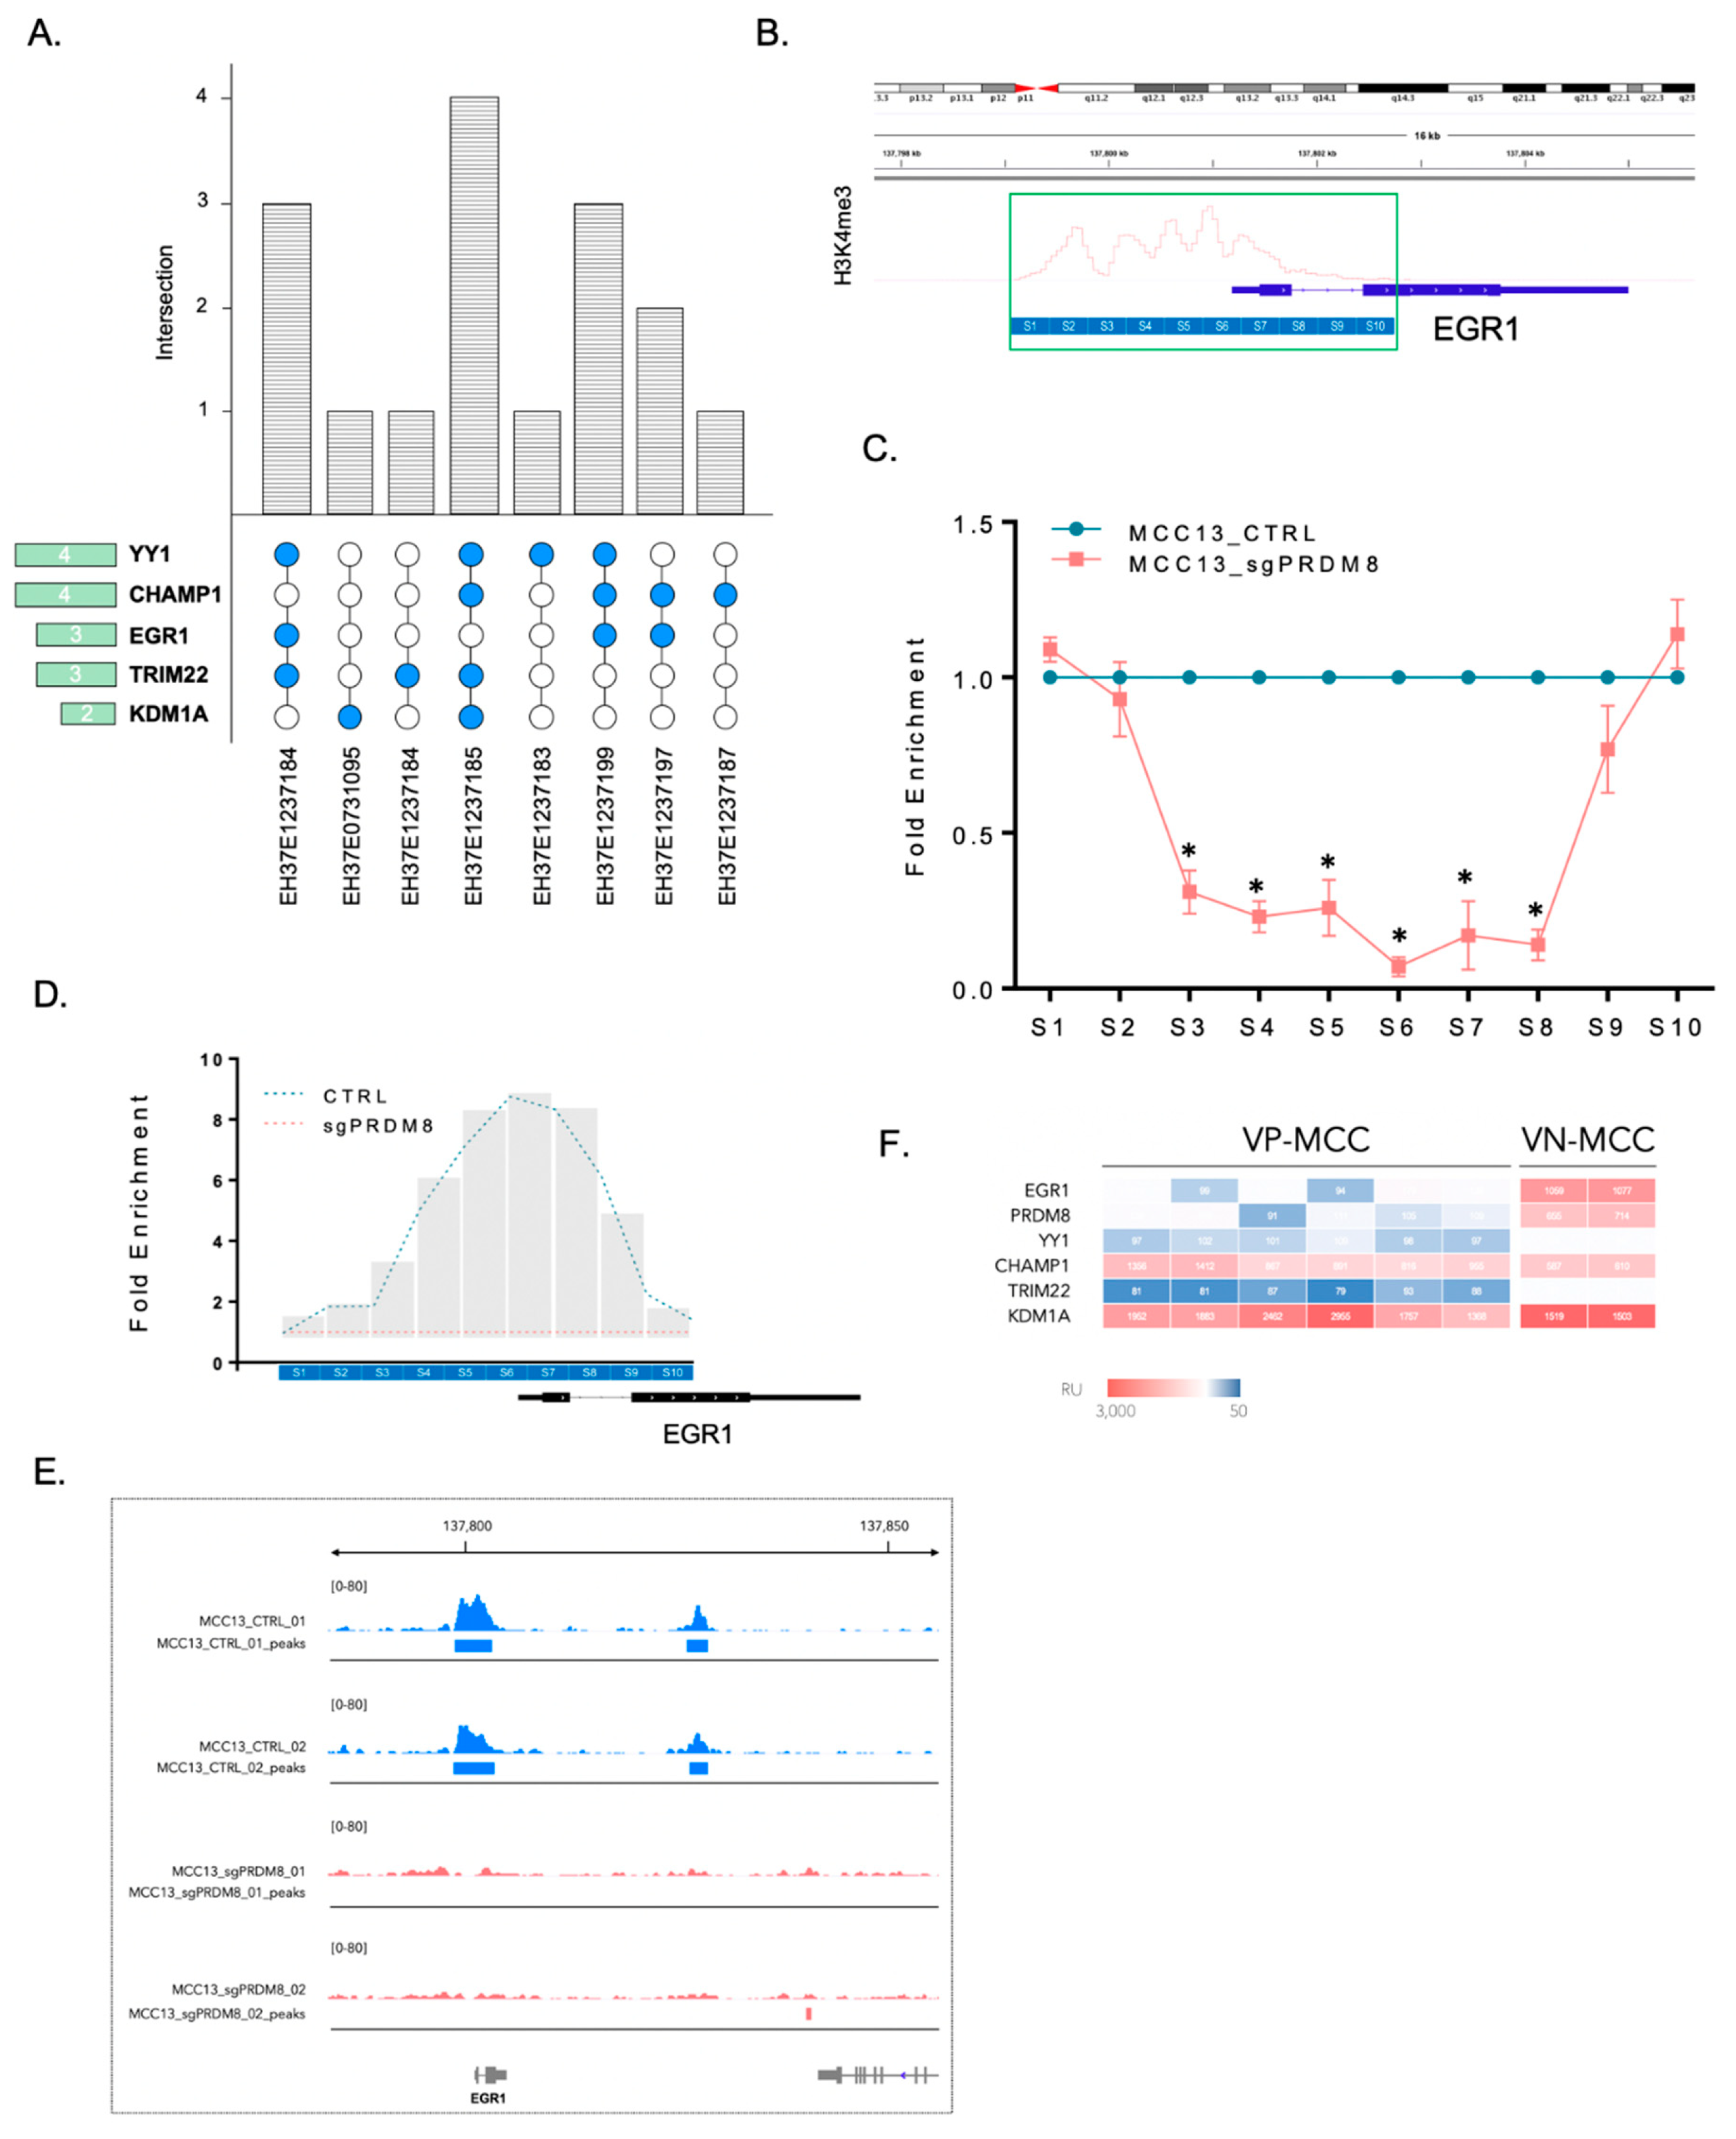
3.4. PRDM8 Acted through Its Partnership with EGR1
4. Discussion
5. Conclusions
Supplementary Materials
Author Contributions
Funding
Acknowledgments
Conflicts of Interest
Abbreviations
| ChIP | Chromatin immunoprecipitation |
| DEG | Differentially expressed gene |
| ENCODE | Encyclopedia of DNA Elements |
| FDR | False discovery rate |
| FFPE | Formalin-fixed paraffin-embedded |
| GO | Gene Ontology |
| GSEA | Gene set enrichment analysis |
| IGV | Integrative Genomics Viewer |
| IHC | Immunohistochemistry |
| MCC | Merkel cell carcinoma |
| MCPyV | Merkel cell polyomavirus |
| MCV | Merkel cell polyomavirus |
| NES | Normalized enrichment score |
| TMA | Tissue microarray |
| VP-MCC | Virus-positive Merkel cell carcinoma |
| VN-MCC | Virus-negative Merkel cell carcinoma |
References
- Feng, H.; Shuda, M.; Chang, Y.; Moore, P.S. Clonal integration of a polyomavirus in human Merkel cell carcinoma. Science 2008, 319, 1096–1100. [Google Scholar] [CrossRef] [PubMed] [Green Version]
- Schadendorf, D.; Lebbe, C.; Zur Hausen, A.; Avril, M.F.; Hariharan, S.; Bharmal, M.; Becker, J.C. Merkel cell carcinoma: Epidemiology, prognosis, therapy and unmet medical needs. Eur. J. Cancer 2017, 71, 53–69. [Google Scholar] [CrossRef] [Green Version]
- Wong, S.Q.; Waldeck, K.; Vergara, I.A.; Schroder, J.; Madore, J.; Wilmott, J.S.; Colebatch, A.J.; De Paoli-Iseppi, R.; Li, J.; Lupat, R.; et al. UV-Associated Mutations Underlie the Etiology of MCV-Negative Merkel Cell Carcinomas. Cancer Res. 2015, 75, 5228–5234. [Google Scholar] [CrossRef] [Green Version]
- Goh, G.; Walradt, T.; Markarov, V.; Blom, A.; Riaz, N.; Doumani, R.; Stafstrom, K.; Moshiri, A.; Yelistratova, L.; Levinsohn, J.; et al. Mutational landscape of MCPyV-positive and MCPyV-negative Merkel cell carcinomas with implications for immunotherapy. Oncotarget 2016, 7, 3403–3415. [Google Scholar] [CrossRef] [PubMed]
- Harms, P.W.; Vats, P.; Verhaegen, M.E.; Robinson, D.R.; Wu, Y.M.; Dhanasekaran, S.M.; Palanisamy, N.; Siddiqui, J.; Cao, X.; Su, F.; et al. The Distinctive Mutational Spectra of Polyomavirus-Negative Merkel Cell Carcinoma. Cancer Res. 2015, 75, 3720–3727. [Google Scholar] [CrossRef] [PubMed] [Green Version]
- Sunshine, J.C.; Jahchan, N.S.; Sage, J.; Choi, J. Are there multiple cells of origin of Merkel cell carcinoma? Oncogene 2018, 37, 1409–1416. [Google Scholar] [CrossRef] [PubMed]
- Mertz, K.D.; Junt, T.; Schmid, M.; Pfaltz, M.; Kempf, W. Inflammatory monocytes are a reservoir for Merkel cell polyomavirus. J. Investig. Derm. 2010, 130, 1146–1151. [Google Scholar] [CrossRef] [Green Version]
- Liu, W.; Yang, R.; Payne, A.S.; Schowalter, R.M.; Spurgeon, M.E.; Lambert, P.F.; Xu, X.; Buck, C.B.; You, J. Identifying the Target Cells and Mechanisms of Merkel Cell Polyomavirus Infection. Cell Host Microbe 2016, 19, 775–787. [Google Scholar] [CrossRef] [Green Version]
- Becker, J.C.; Stang, A.; DeCaprio, J.A.; Cerroni, L.; Lebbe, C.; Veness, M.; Nghiem, P. Merkel cell carcinoma. Nat. Rev. Dis. Primers 2017, 3, 17077. [Google Scholar] [CrossRef]
- Tilling, T.; Wladykowski, E.; Failla, A.V.; Houdek, P.; Brandner, J.M.; Moll, I. Immunohistochemical analyses point to epidermal origin of human Merkel cells. Histochem. Cell Biol. 2014, 141, 407–421. [Google Scholar] [CrossRef]
- Zur Hausen, A.; Rennspiess, D.; Winnepenninckx, V.; Speel, E.J.; Kurz, A.K. Early B-cell differentiation in Merkel cell carcinomas: Clues to cellular ancestry. Cancer Res. 2013, 73, 4982–4987. [Google Scholar] [CrossRef] [PubMed] [Green Version]
- Cimino, P.J.; Robirds, D.H.; Tripp, S.R.; Pfeifer, J.D.; Abel, H.J.; Duncavage, E.J. Retinoblastoma gene mutations detected by whole exome sequencing of Merkel cell carcinoma. Mod. Pathol. 2014, 27, 1073–1087. [Google Scholar] [CrossRef] [PubMed] [Green Version]
- Orouji, E.; Utikal, J. Tackling malignant melanoma epigenetically: Histone lysine methylation. Clin. Epigenet. 2018, 10, 145. [Google Scholar] [CrossRef] [PubMed]
- Eom, G.H.; Kim, K.; Kim, S.M.; Kee, H.J.; Kim, J.Y.; Jin, H.M.; Kim, J.R.; Kim, J.H.; Choe, N.; Kim, K.B.; et al. Histone methyltransferase PRDM8 regulates mouse testis steroidogenesis. Biochem. Biophys. Res. Commun. 2009, 388, 131–136. [Google Scholar] [CrossRef]
- Houben, R.; Grimm, J.; Willmes, C.; Weinkam, R.; Becker, J.C.; Schrama, D. Merkel cell carcinoma and Merkel cell polyomavirus: Evidence for hit-and-run oncogenesis. J. Investig. Dermatol. 2012, 132, 254–256. [Google Scholar] [CrossRef] [Green Version]
- Houben, R.; Shuda, M.; Weinkam, R.; Schrama, D.; Feng, H.; Chang, Y.; Moore, P.S.; Becker, J.C. Merkel cell polyomavirus-infected Merkel cell carcinoma cells require expression of viral T antigens. J. Virol. 2010, 84, 7064–7072. [Google Scholar] [CrossRef] [Green Version]
- Shuda, M.; Feng, H.; Kwun, H.J.; Rosen, S.T.; Gjoerup, O.; Moore, P.S.; Chang, Y. T antigen mutations are a human tumor-specific signature for Merkel cell polyomavirus. Proc. Natl. Acad. Sci. USA 2008, 105, 16272–16277. [Google Scholar] [CrossRef] [Green Version]
- Van Gele, M.; Kaghad, M.; Leonard, J.H.; Van Roy, N.; Naeyaert, J.M.; Geerts, M.L.; Van Belle, S.; Cocquyt, V.; Bridge, J.; Sciot, R.; et al. Mutation analysis of P73 and TP53 in Merkel cell carcinoma. Br. J. Cancer 2000, 82, 823–826. [Google Scholar] [CrossRef] [Green Version]
- Leonard, J.H.; Dash, P.; Holland, P.; Kearsley, J.H.; Bell, J.R. Characterisation of four Merkel cell carcinoma adherent cell lines. Int. J. Cancer 1995, 60, 100–107. [Google Scholar] [CrossRef]
- Ronan, S.G.; Green, A.D.; Shilkaitis, A.; Huang, T.S.; Das Gupta, T.K. Merkel cell carcinoma: In vitro and in vivo characteristics of a new cell line. J. Am. Acad. Dermatol. 1993, 29, 715–722. [Google Scholar] [CrossRef]
- Houben, R.; Dreher, C.; Angermeyer, S.; Borst, A.; Utikal, J.; Haferkamp, S.; Peitsch, W.K.; Schrama, D.; Hesbacher, S. Mechanisms of p53 restriction in Merkel cell carcinoma cells are independent of the Merkel cell polyoma virus T antigens. J. Investig. Dermatol. 2013, 133, 2453–2460. [Google Scholar] [CrossRef] [PubMed] [Green Version]
- Orouji, E.; Orouji, A.; Gaiser, T.; Larribère, L.; Gebhardt, C.; Utikal, J. MAP kinase pathway gene copy alterations in NRAS/BRAF wild-type advanced melanoma. Int. J. Cancer 2016, 138, 2257–2262. [Google Scholar] [CrossRef] [PubMed] [Green Version]
- Terranova, C.; Tang, M.; Orouji, E.; Maitituoheti, M.; Raman, A.; Amin, S.; Liu, Z.; Rai, K. An Integrated Platform for Genome-wide Mapping of Chromatin States Using High-throughput ChIP-sequencing in Tumor Tissues. J. Vis. Exp. 2018, 134, 56972. [Google Scholar] [CrossRef] [PubMed]
- Vlachos, I.S.; Zagganas, K.; Paraskevopoulou, M.D.; Georgakilas, G.; Karagkouni, D.; Vergoulis, T.; Dalamagas, T.; Hatzigeorgiou, A.G. DIANA-miRPath v3.0: Deciphering microRNA function with experimental support. Nucleic Acids Res. 2015, 43, W460–W466. [Google Scholar] [CrossRef]
- Dweep, H.; Gretz, N. miRWalk2.0: A comprehensive atlas of microRNA-target interactions. Nat. Methods 2015, 12, 697. [Google Scholar] [CrossRef] [PubMed]
- Moshiri, A.S.; Doumani, R.; Yelistratova, L.; Blom, A.; Lachance, K.; Shinohara, M.M.; Delaney, M.; Chang, O.; McArdle, S.; Thomas, H.; et al. Polyomavirus-Negative Merkel Cell Carcinoma: A More Aggressive Subtype Based on Analysis of 282 Cases Using Multimodal Tumor Virus Detection. J. Investig. Derm. 2017, 137, 819–827. [Google Scholar] [CrossRef] [Green Version]
- Starrett, G.J.; Thakuria, M.; Chen, T.; Marcelus, C.; Cheng, J.; Nomburg, J.; Thorner, A.R.; Slevin, M.K.; Powers, W.; Burns, R.T.; et al. Clinical and molecular characterization of virus-positive and virus-negative Merkel cell carcinoma. Genome Med. 2020, 12, 1–22. [Google Scholar] [CrossRef] [Green Version]
- Sahi, H.; Savola, S.; Sihto, H.; Koljonen, V.; Bohling, T.; Knuutila, S. RB1 gene in Merkel cell carcinoma: Hypermethylation in all tumors and concurrent heterozygous deletions in the polyomavirus-negative subgroup. Apmis 2014, 122, 1157–1166. [Google Scholar] [CrossRef]
- Kumar, S.; Xie, H.; Scicluna, P.; Lee, L.; Bjornhagen, V.; Hoog, A.; Larsson, C.; Lui, W.O. MiR-375 Regulation of LDHB Plays Distinct Roles in Polyomavirus-Positive and -Negative Merkel Cell Carcinoma. Cancers 2018, 10, 443. [Google Scholar] [CrossRef] [Green Version]
- Kumar, S.; Xie, H.; Shi, H.; Gao, J.; Juhlin, C.C.; Bjornhagen, V.; Hoog, A.; Lee, L.; Larsson, C.; Lui, W.O. Merkel cell polyomavirus oncoproteins induce microRNAs that suppress multiple autophagy genes. Int. J. Cancer 2019, 146, 1652–1666. [Google Scholar] [CrossRef] [Green Version]
- Lee, S.; Paulson, K.G.; Murchison, E.P.; Afanasiev, O.K.; Alkan, C.; Leonard, J.H.; Byrd, D.R.; Hannon, G.J.; Nghiem, P. Identification and validation of a novel mature microRNA encoded by the Merkel cell polyomavirus in human Merkel cell carcinomas. J. Clin. Virol. 2011, 52, 272–275. [Google Scholar] [CrossRef] [PubMed] [Green Version]
- Chteinberg, E.; Sauer, C.M.; Rennspiess, D.; Beumers, L.; Schiffelers, L.; Eben, J.; Haugg, A.; Winnepenninckx, V.; Kurz, A.K.; Speel, E.J.; et al. Neuroendocrine Key Regulator Gene Expression in Merkel Cell Carcinoma. Neoplasia 2018, 20, 1227–1235. [Google Scholar] [CrossRef] [PubMed]
- Abernathy, D.G.; Kim, W.K.; McCoy, M.J.; Lake, A.M.; Ouwenga, R.; Lee, S.W.; Xing, X.; Li, D.; Lee, H.J.; Heuckeroth, R.O.; et al. MicroRNAs Induce a Permissive Chromatin Environment that Enables Neuronal Subtype-Specific Reprogramming of Adult Human Fibroblasts. Cell Stem Cell 2017, 21, 332–348.e9. [Google Scholar] [CrossRef] [PubMed] [Green Version]


© 2020 by the authors. Licensee MDPI, Basel, Switzerland. This article is an open access article distributed under the terms and conditions of the Creative Commons Attribution (CC BY) license (http://creativecommons.org/licenses/by/4.0/).
Share and Cite
Orouji, E.; Peitsch, W.K.; Orouji, A.; Houben, R.; Utikal, J. Unique Role of Histone Methyltransferase PRDM8 in the Tumorigenesis of Virus-Negative Merkel Cell Carcinoma. Cancers 2020, 12, 1057. https://doi.org/10.3390/cancers12041057
Orouji E, Peitsch WK, Orouji A, Houben R, Utikal J. Unique Role of Histone Methyltransferase PRDM8 in the Tumorigenesis of Virus-Negative Merkel Cell Carcinoma. Cancers. 2020; 12(4):1057. https://doi.org/10.3390/cancers12041057
Chicago/Turabian StyleOrouji, Elias, Wiebke K. Peitsch, Azadeh Orouji, Roland Houben, and Jochen Utikal. 2020. "Unique Role of Histone Methyltransferase PRDM8 in the Tumorigenesis of Virus-Negative Merkel Cell Carcinoma" Cancers 12, no. 4: 1057. https://doi.org/10.3390/cancers12041057