Article

Unsupervised Hierarchical Clustering of Pancreatic Adenocarcinoma Dataset from TCGA Defines a Mucin Expression Profile that Impacts Overall Survival

1
Univ. Lille, CNRS, Inserm, CHU Lille, UMR9020-U1277-CANTHER—Cancer Heterogeneity Plasticity and Resistance to Therapies, F-59000 Lille, France
2
Laboratoire de Physiologie Cellulaire et Moléculaire-UR UPJV 4667, UFR Sciences, Université de Picardie Jules Verne (UPJV), 80039 Amiens, France
3
Cátedra de Bioinformática, Escuela de Medicina, Tecnologico de Monterrey, Monterrey 64710, Nuevo León, Mexico
*
Author to whom correspondence should be addressed.
Cancers 2020, 12(11), 3309; https://doi.org/10.3390/cancers12113309
Submission received: 11 September 2020 / Revised: 2 November 2020 / Accepted: 4 November 2020 / Published: 9 November 2020
(This article belongs to the Collection Application of Bioinformatics in Cancers)

Abstract

:

Simple Summary

Pancreatic cancer has a dramatic outcome (survival curve < 6 months) that is the consequence of late diagnosis and the lack of efficient therapy. We investigated the relationship between the 22 mucin gene expression and the patient survival in pancreatic cancer datasets that provide a comprehensive mapping of transcriptomic alterations occurring during carcinogenesis. Using unsupervised hierarchical clustering analysis of mucin gene expression patterns, we identified two major clusters of patients: atypical mucin signature (#1; MUC15, MUC14/EMCN, and MUC18/MCAM) and membrane-bound mucin signature (#2; MUC1, -4, -16, -17, -20, and -21). The signature #2 is associated with shorter overall survival, suggesting that the pattern of membrane-bound mucin expression could be a new prognostic marker for PDAC patients.

Abstract

Mucins are commonly associated with pancreatic ductal adenocarcinoma (PDAC) that is a deadly disease because of the lack of early diagnosis and efficient therapies. There are 22 mucin genes encoding large O-glycoproteins divided into two major subgroups: membrane-bound and secreted mucins. We investigated mucin expression and their impact on patient survival in the PDAC dataset from The Cancer Genome Atlas (PAAD-TCGA). We observed a statistically significant increased messenger RNA (mRNA) relative level of most of the membrane-bound mucins (MUC1/3A/4/12/13/16/17/20), secreted mucins (MUC5AC/5B), and atypical mucins (MUC14/18) compared to normal pancreas. We show that MUC1/4/5B/14/17/20/21 mRNA levels are associated with poorer survival in the high-expression group compared to the low-expression group. Using unsupervised clustering analysis of mucin gene expression patterns, we identified two major clusters of patients. Cluster #1 harbors a higher expression of MUC15 and atypical MUC14/MUC18, whereas cluster #2 is characterized by a global overexpression of membrane-bound mucins (MUC1/4/16/17/20/21). Cluster #2 is associated with shorter overall survival. The patient stratification appears to be independent of usual clinical features (tumor stage, differentiation grade, lymph node invasion) suggesting that the pattern of membrane-bound mucin expression could be a new prognostic marker for PDAC patients.

1. Introduction

Pancreatic cancer, with its major form pancreatic ductal adenocarcinoma (PDAC), is projected to become the second cause of death by cancer and the first among digestive cancer worldwide by 2030 [1]. The short survival curve (6 months) and low 5 year survival rate (9%) is the consequence of late diagnosis and the lack of efficient therapy [2,3]. Interpatient heterogeneity and phenotypic differences between PDAC were reported and stratified as basal or quasi mesenchymal [4,5,6,7]. The daily clinical impact of this classification remains to be fully demonstrated, but the obvious differences regarding patient survival suggest the possibility to use prognostic expression signatures and may determine the relationship between signature and efficacy of therapies [8]. The Cancer Genome Atlas (TCGA) provides a comprehensive mapping of the key genomic changes, transcriptomic and proteomic alterations occurring during carcinogenesis. Notably, the pancreatic adenocarcinoma (PAAD) dataset contains DNA alterations or methylation, and messenger RNA (mRNA), microRNA (miRNA), long noncoding RNA (lncRNA), and protein expression profiles of 184 patients (including 168 with available mRNA data) that can be used to investigate the involvement of genes of interest [9].
Mucins are large O-glycoproteins that are classified into two subgroups: (i) secreted mucins (MUC2, -5AC, -5B, -6, -7, -8, -9/OVGP1 and -19), which are the main components of mucus covering the different epithelia [10,11,12,13], and (ii) membrane-bound or transmembrane mucins (MUC1, -3A/B, -4, -12, -13, -15, -16, -17, -20, -21, and -22), which are bound to cell surface and are involved in interactions with the microenvironment and regulate cell signaling [11,14]. Most of the cytoplasmic tails of membrane-bound mucins can be phosphorylated and, thus, regulate signaling pathways involved in cell–cell interactions, differentiation, and apoptosis [15].
Among the best-known membrane-bound mucins, MUC1 and MUC4 have been extensively proposed as drivers of pancreatic carcinogenesis because they promote tumor growth, proliferation, oncogenic signaling, cell metabolism, epithelial–mesenchymal transition (EMT), and metastasis [14,16,17]. MUC1 is overexpressed in pancreatic cancer. MUC4, as well as MUC5AC and MUC16, is neoexpressed in early neoplastic lesions (PanINs) that progress toward adenocarcinoma [16,17]. MUC16, best known as the ovarian cancer biomarker CA125, also promotes cell proliferation, alters Focal adhesion kinase (FAK)/ Mitogen-Activated Protein Kinases (MAPK) signaling, and facilitates metastasis in pancreatic cancer cells [18,19,20]. Other variants of mucin glycosylated forms such as CA15-3 or CA19.9 are potential PDAC biomarkers but with a limited specificity or sensitivity balance [21,22]. Circulating MUC5AC has also been proposed as a potential biomarker, alone or in combination with CA19-9, to discriminate PDAC, chronic pancreatitis, and normal pancreas [23]. We recently proposed the high expression of MUC4/MUC16/MUC20 signature as a marker of poor prognosis for pancreatic cancers [24].
Two additional atypical endothelial mucins (MUC14/EMCN and MUC18/MCAM) have been described in cancer [25,26]. MUC14, also known as endomucin (EMCN), is an endothelial sialomucin that inhibits endothelial–leukocyte interaction and has been reported to be a poor prognosis marker in gastric cancer [27]. MUC18 also called melanoma cell adhesion molecule (MCAM) or CD146, is a glycoprotein that is associated with gallbladder cancer and melanoma and that is also detected in pancreatic cancer stroma [28].
In the present manuscript, we used web-tools such as GEPIA, cBioPortal, SurvExpress, and PROGgeneV2 to investigate the expression pattern of every mucin gene in the pancreatic cancer PAAD dataset available from the TCGA consortium. We analyzed the impact of their expression on patient survival and the correlation of mucin gene expression, and we performed a hierarchical clustering analysis of PAAD cohort. We identified two major subgroups: one with a membrane-bound mucin signature (MUC1, -4, -16, -17, -20, and -21; signature #2) and the other one with an atypical mucin signature (MUC15, MUC14/EMCN, and MUC18/MCAM, signature #1). Signature #2 is associated with shorter overall survival and is proposed as a poor prognosis signature.

2. Results

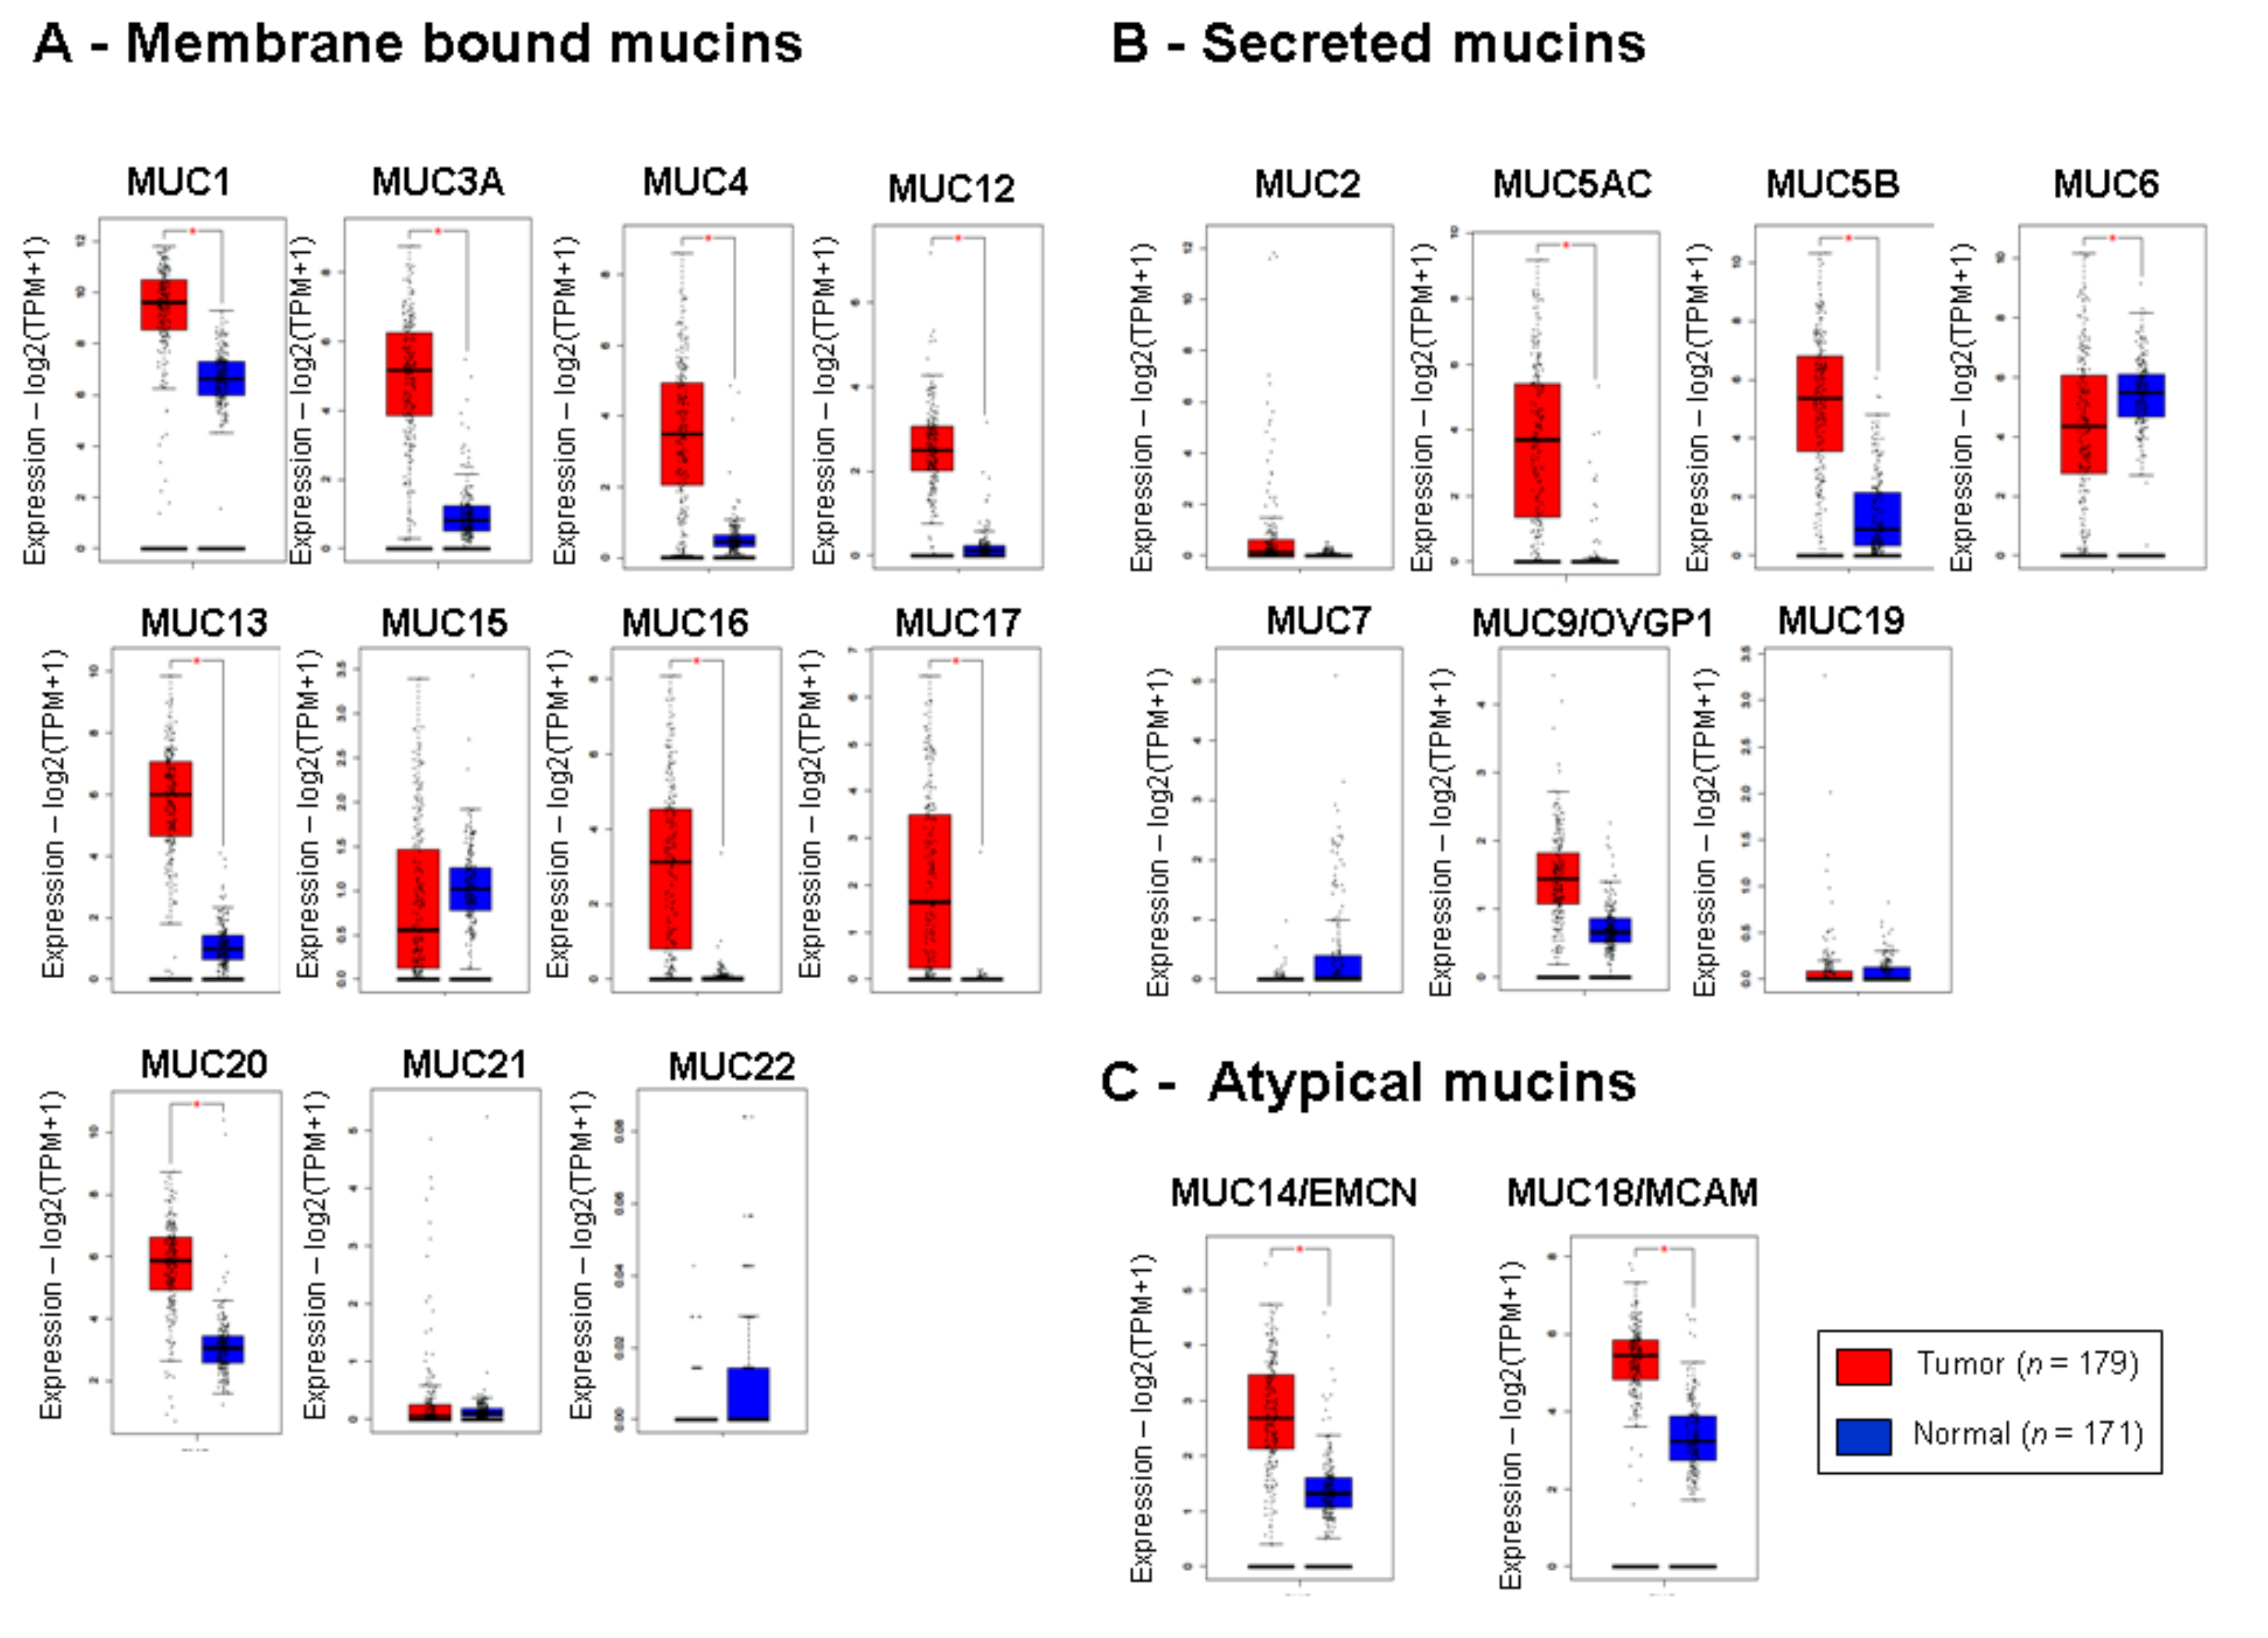
2.1. Mucin Expression Patterns in Pancreatic Adenocarcinoma

In order to study mucin gene expression, we took advantage of publicly available datasets. We analyzed the expression of every mucin gene in pancreatic adenocarcinoma samples compared to normal pancreas tissues using GEPIA to compile Genome Tissue Expression (GTEX) (normal) and TCGA (tumor) datasets. We generated boxplots for genes encoding membrane-bound mucins (MUC1, MUC3A, MUC4, MUC12, MUC13, MUC15, MUC16, MUC17, MUC20, MUC21 and MUC22) (Figure 1A), genes encoding secreted mucins (MUC2, MUC5AC, MUC5B, MUC6, MUC7, MUC9/OVGP1, and MUC19) (Figure 1B), and the two atypical mucin genes MUC14/EMCN and MUC18/MCAM (Figure 1C).
We observed a statistically significant increased expression in tumor samples for a majority of the genes encoding membrane-bound mucins (MUC1, -3A, 4, -12, -13, -16, -17, and -20) (p < 0.01) (Figure 1A). Only MUC15, MUC21, and MUC22 mRNA did not harbor any significant expression variation. Two secreted mucin mRNA (MUC5AC and MUC5B) were also increased in tumor samples (p < 0.01), whereas MUC6 was decreased in tumor samples compared to the normal pancreas (Figure 1B). The atypical mucins mRNA (MUC14/EMCN and MUC18/MCAM) were also increased in tumor samples (p < 0.01) (Figure 1C). Moreover, our analysis of the GSE28735 dataset, which contains 45 tumor samples and 45 paired adjacent nontumoral samples, showed a similar pattern with a significant increase in membrane-bound MUC1, MUC3, MUC4, MUC13, MUC16, MUC17, MUC20, and MUC21 mucin mRNA (Figure S1A) and the MUC5B secreted mucin mRNA (Figure S1B). We observed a decrease in the expression of genes encoding membrane-bound MUC15 (Figure S1A) and secreted MUC7 and MUC19 in tumor samples (Figure S1B) (p < 0.01). A decrease in MUC6 expression was also close to statistical significance (p = 0.059). On the contrary, the increase in MUC14/EMCN and MUC18/MCAM was not confirmed in this dataset (Figure S1C).
Altogether, we observed a dramatic change of the mucin gene expression pattern in PDAC notably characterized by a global increase in the genes encoding membrane-bound mucin burden.

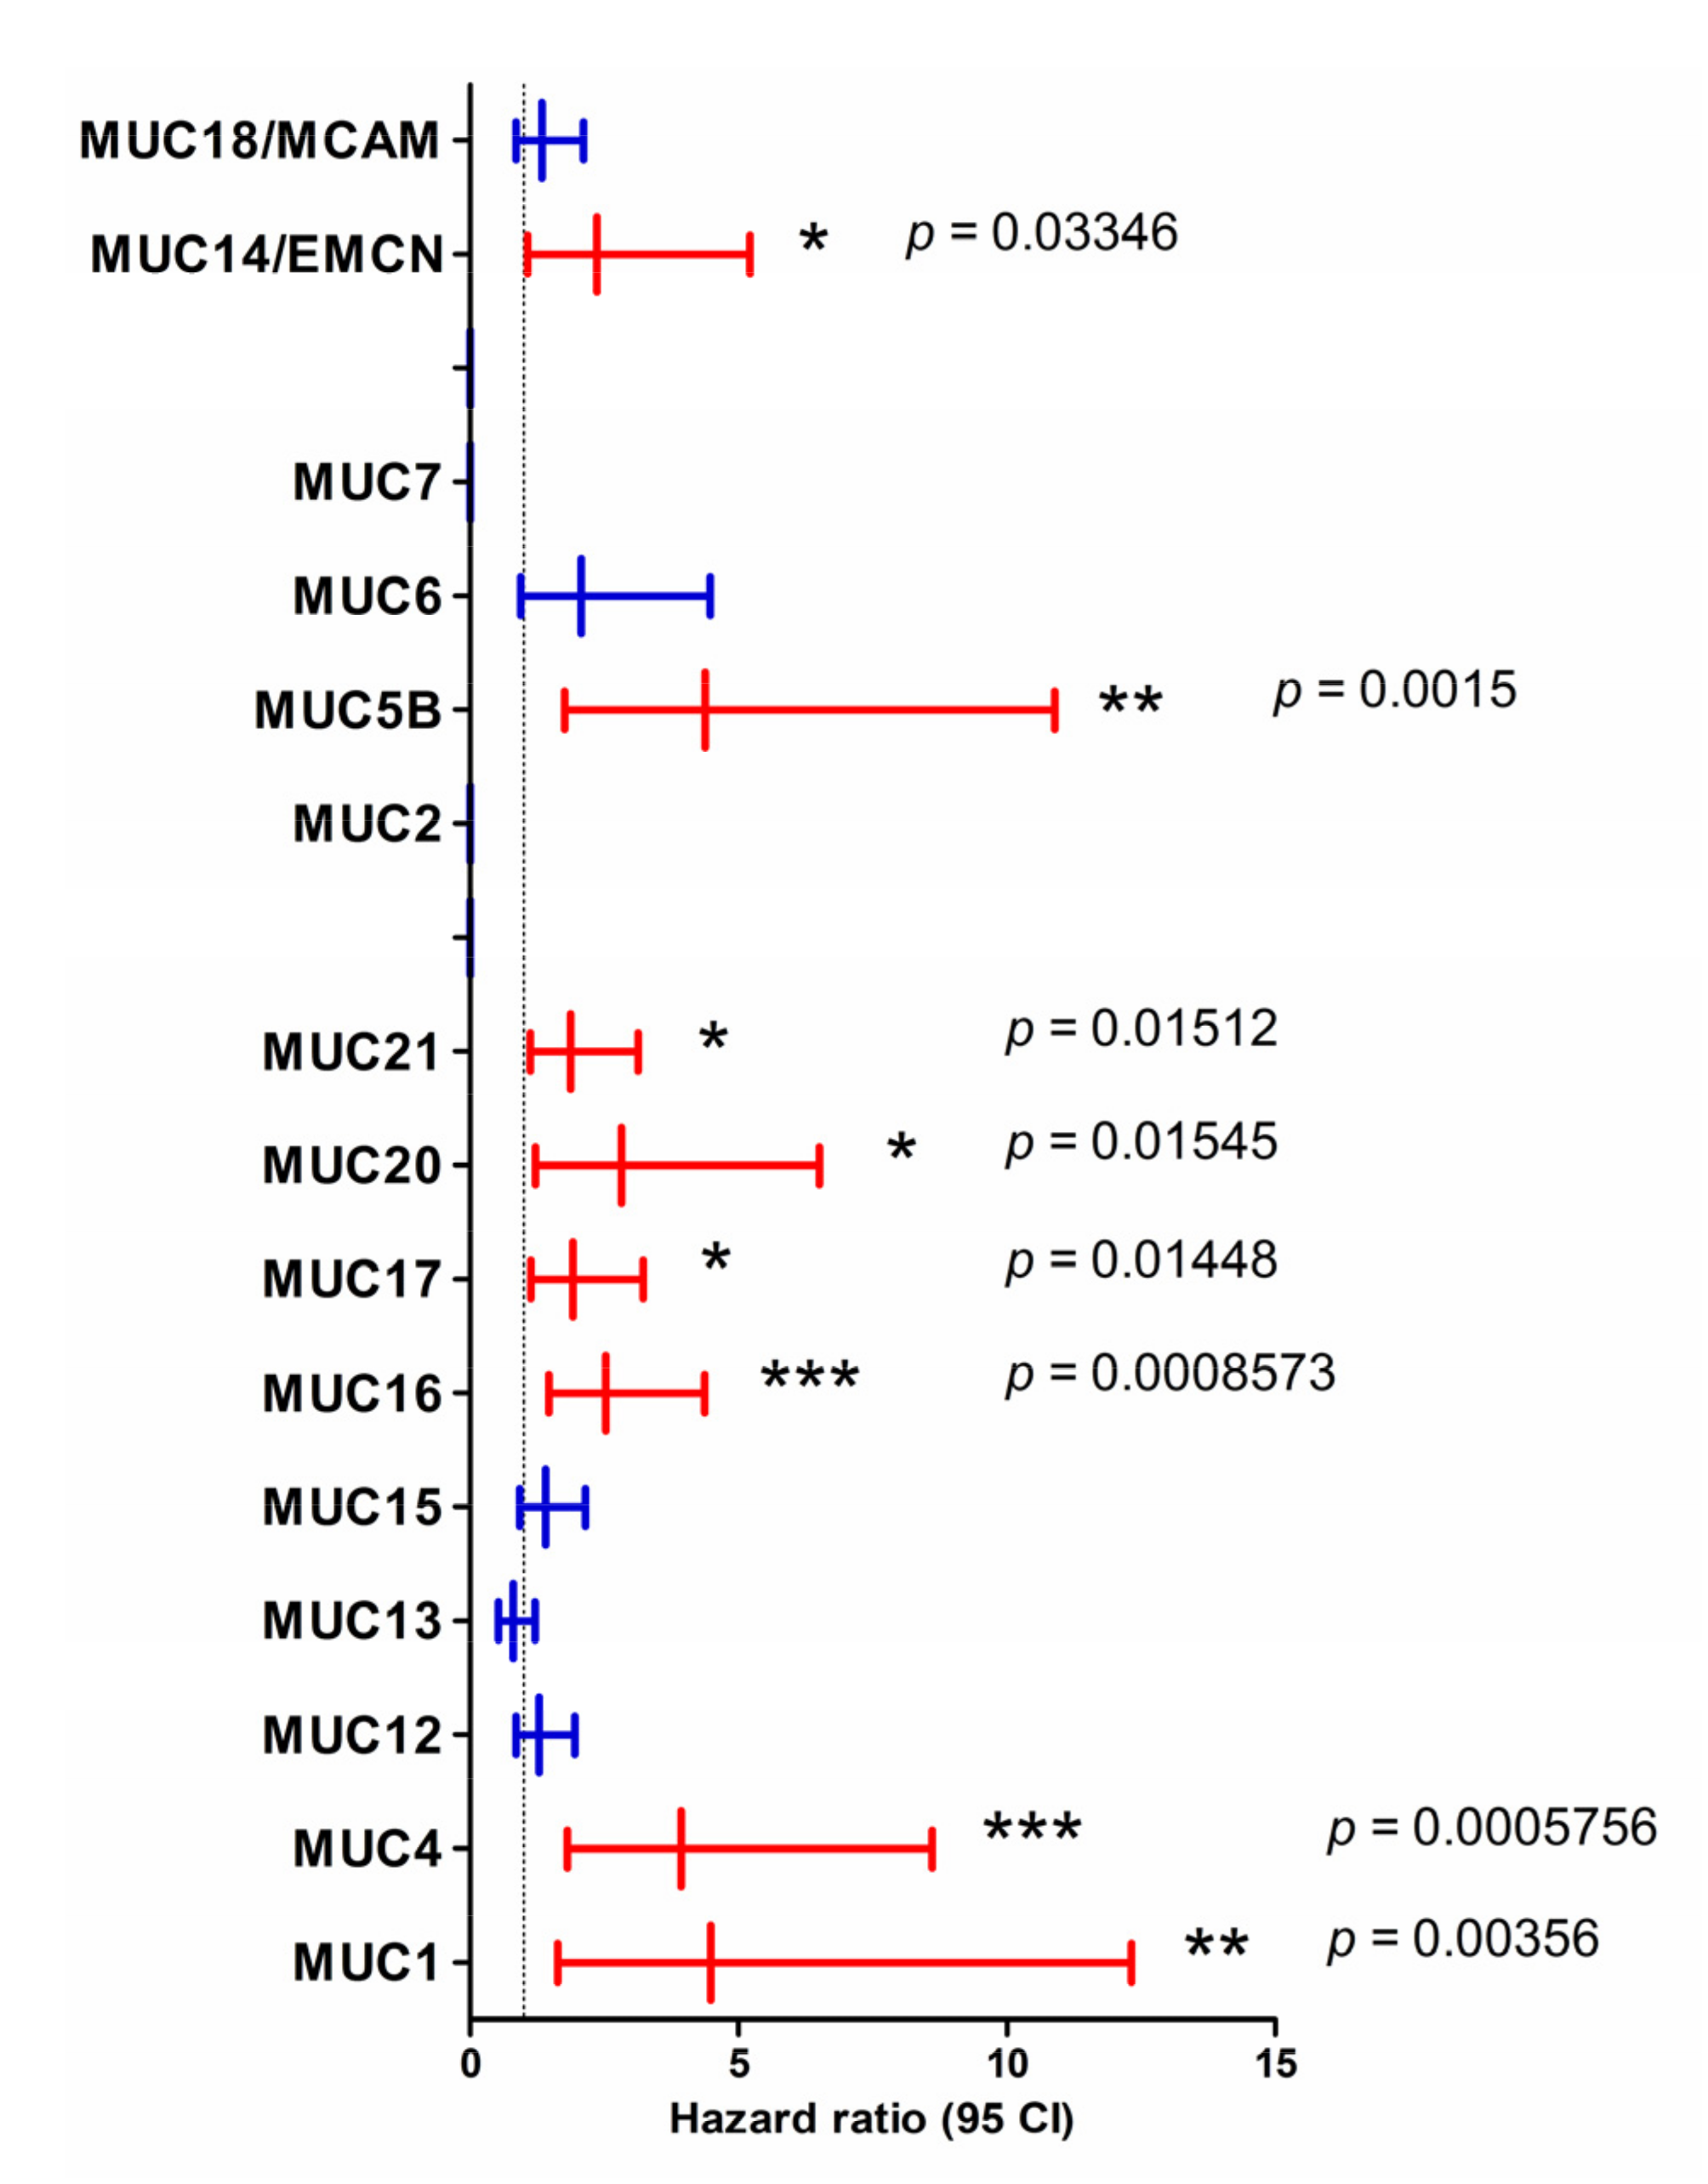
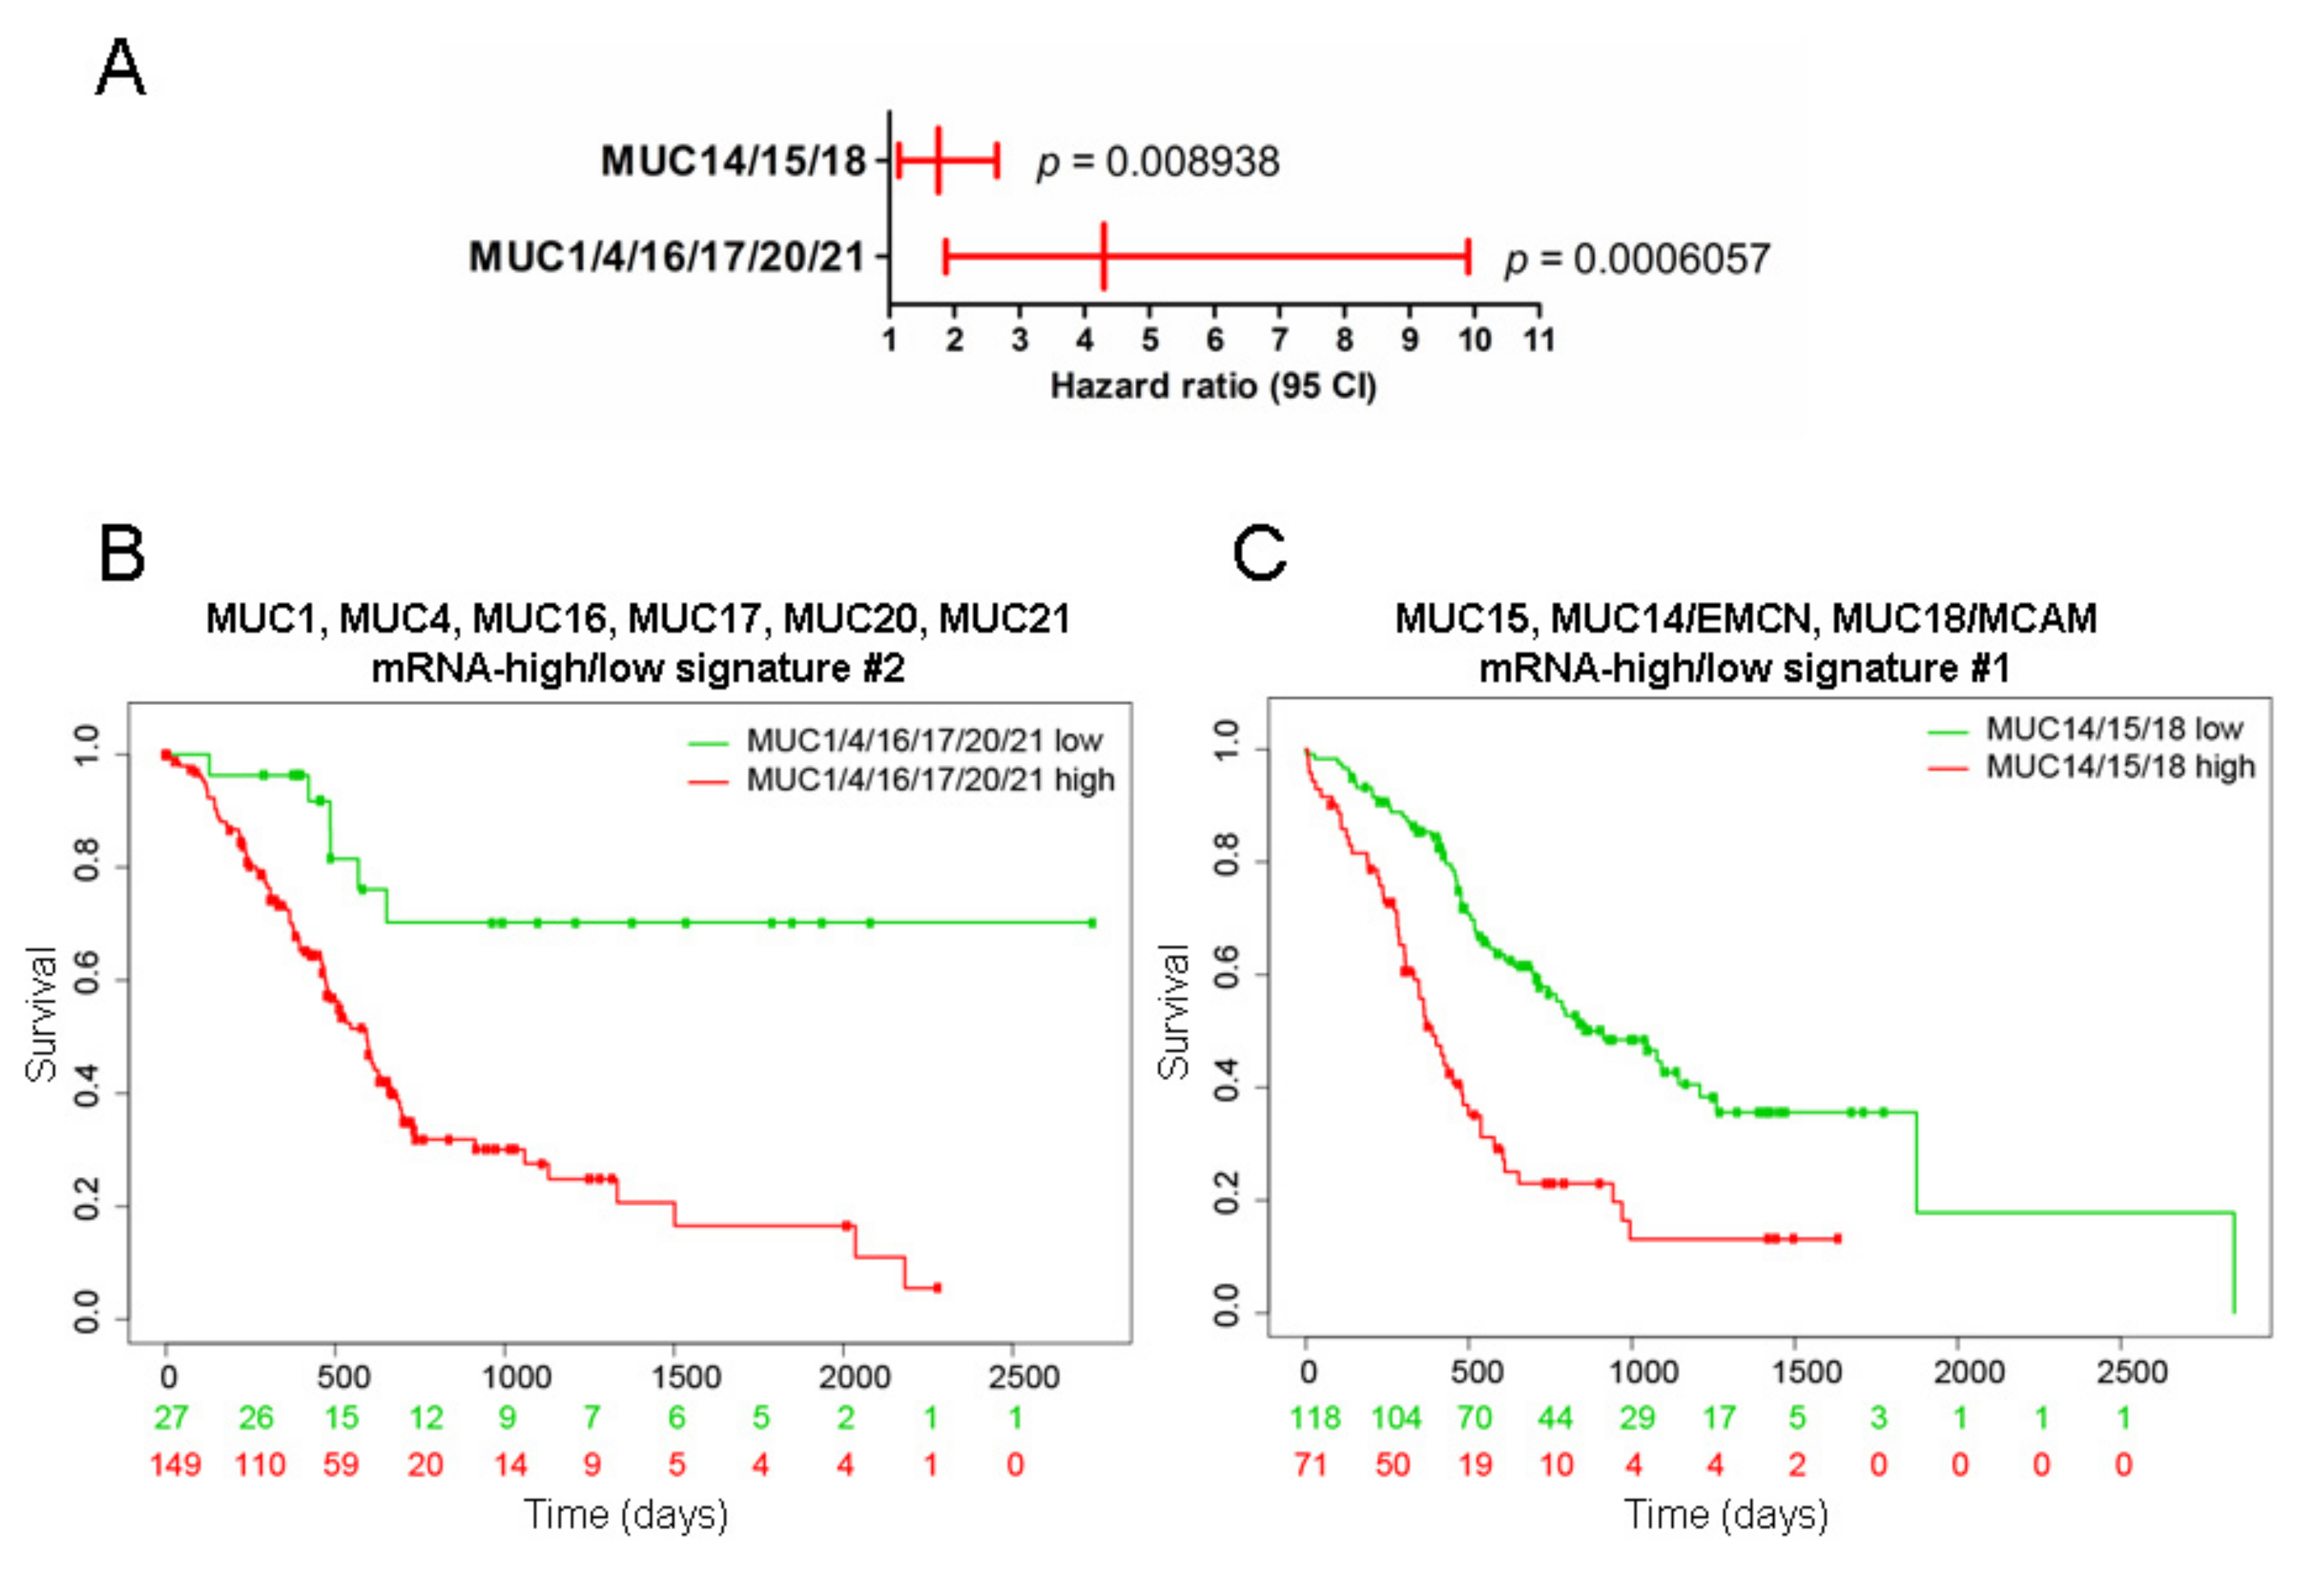
2.2. Mucins and Patient Survival

We then searched for a possible association between the mucin gene expression and patient survival using the SurvExpress tool. We extracted hazard ratios (HR) from the PAAD-TCGA cohort using the optimized algorithm that splits patients into two cohorts where the p-value is minimal. We observed that poorer patient survival is strongly associated with the high expression of MUC1 (hazard ratio (HR) = 4.49, confidence interval (CI) 1.64–12.33), MUC4 (HR = 3.94, CI 1.81–8.61), and MUC5B (HR = 4.38, CI 1.76–10.9) (Figure 2). High expression of MUC16 (HR = 2.53, p = 0.0008573), MUC17 (HR = 1.92, p = 0.01448), MUC20 (HR = 2.82, p = 0.01545), and MUC21 (HR = 1.88, p = 0.01512) mRNA was also associated with worse overall survival. MUC14/EMCN atypical high expression was associated with lower survival (HR = 2.36, p = 0.03346).
We then conducted a similar analysis using PROGgeneV2 that splits the PAAD cohort into two cohorts on the basis of the median of expression. We confirmed a similar association between high expression of MUC1, MUC4, MUC16, MUC17, MUC20, and MUC21 and shorter patient survival (Figure S2). In addition, high expression of MUC2 and MUC5B was also associated with a worse prognosis in this analysis. On the contrary, MUC9 high expression was correlated with a better outcome of PAAD patients. Finally, the analysis of GSE57495 containing 63 patients showed a trend toward an association of MUC1, MUC4, MUC16, MUC17, and MUC20 with a worse outcome that was close to statistical significance (Figure S2).

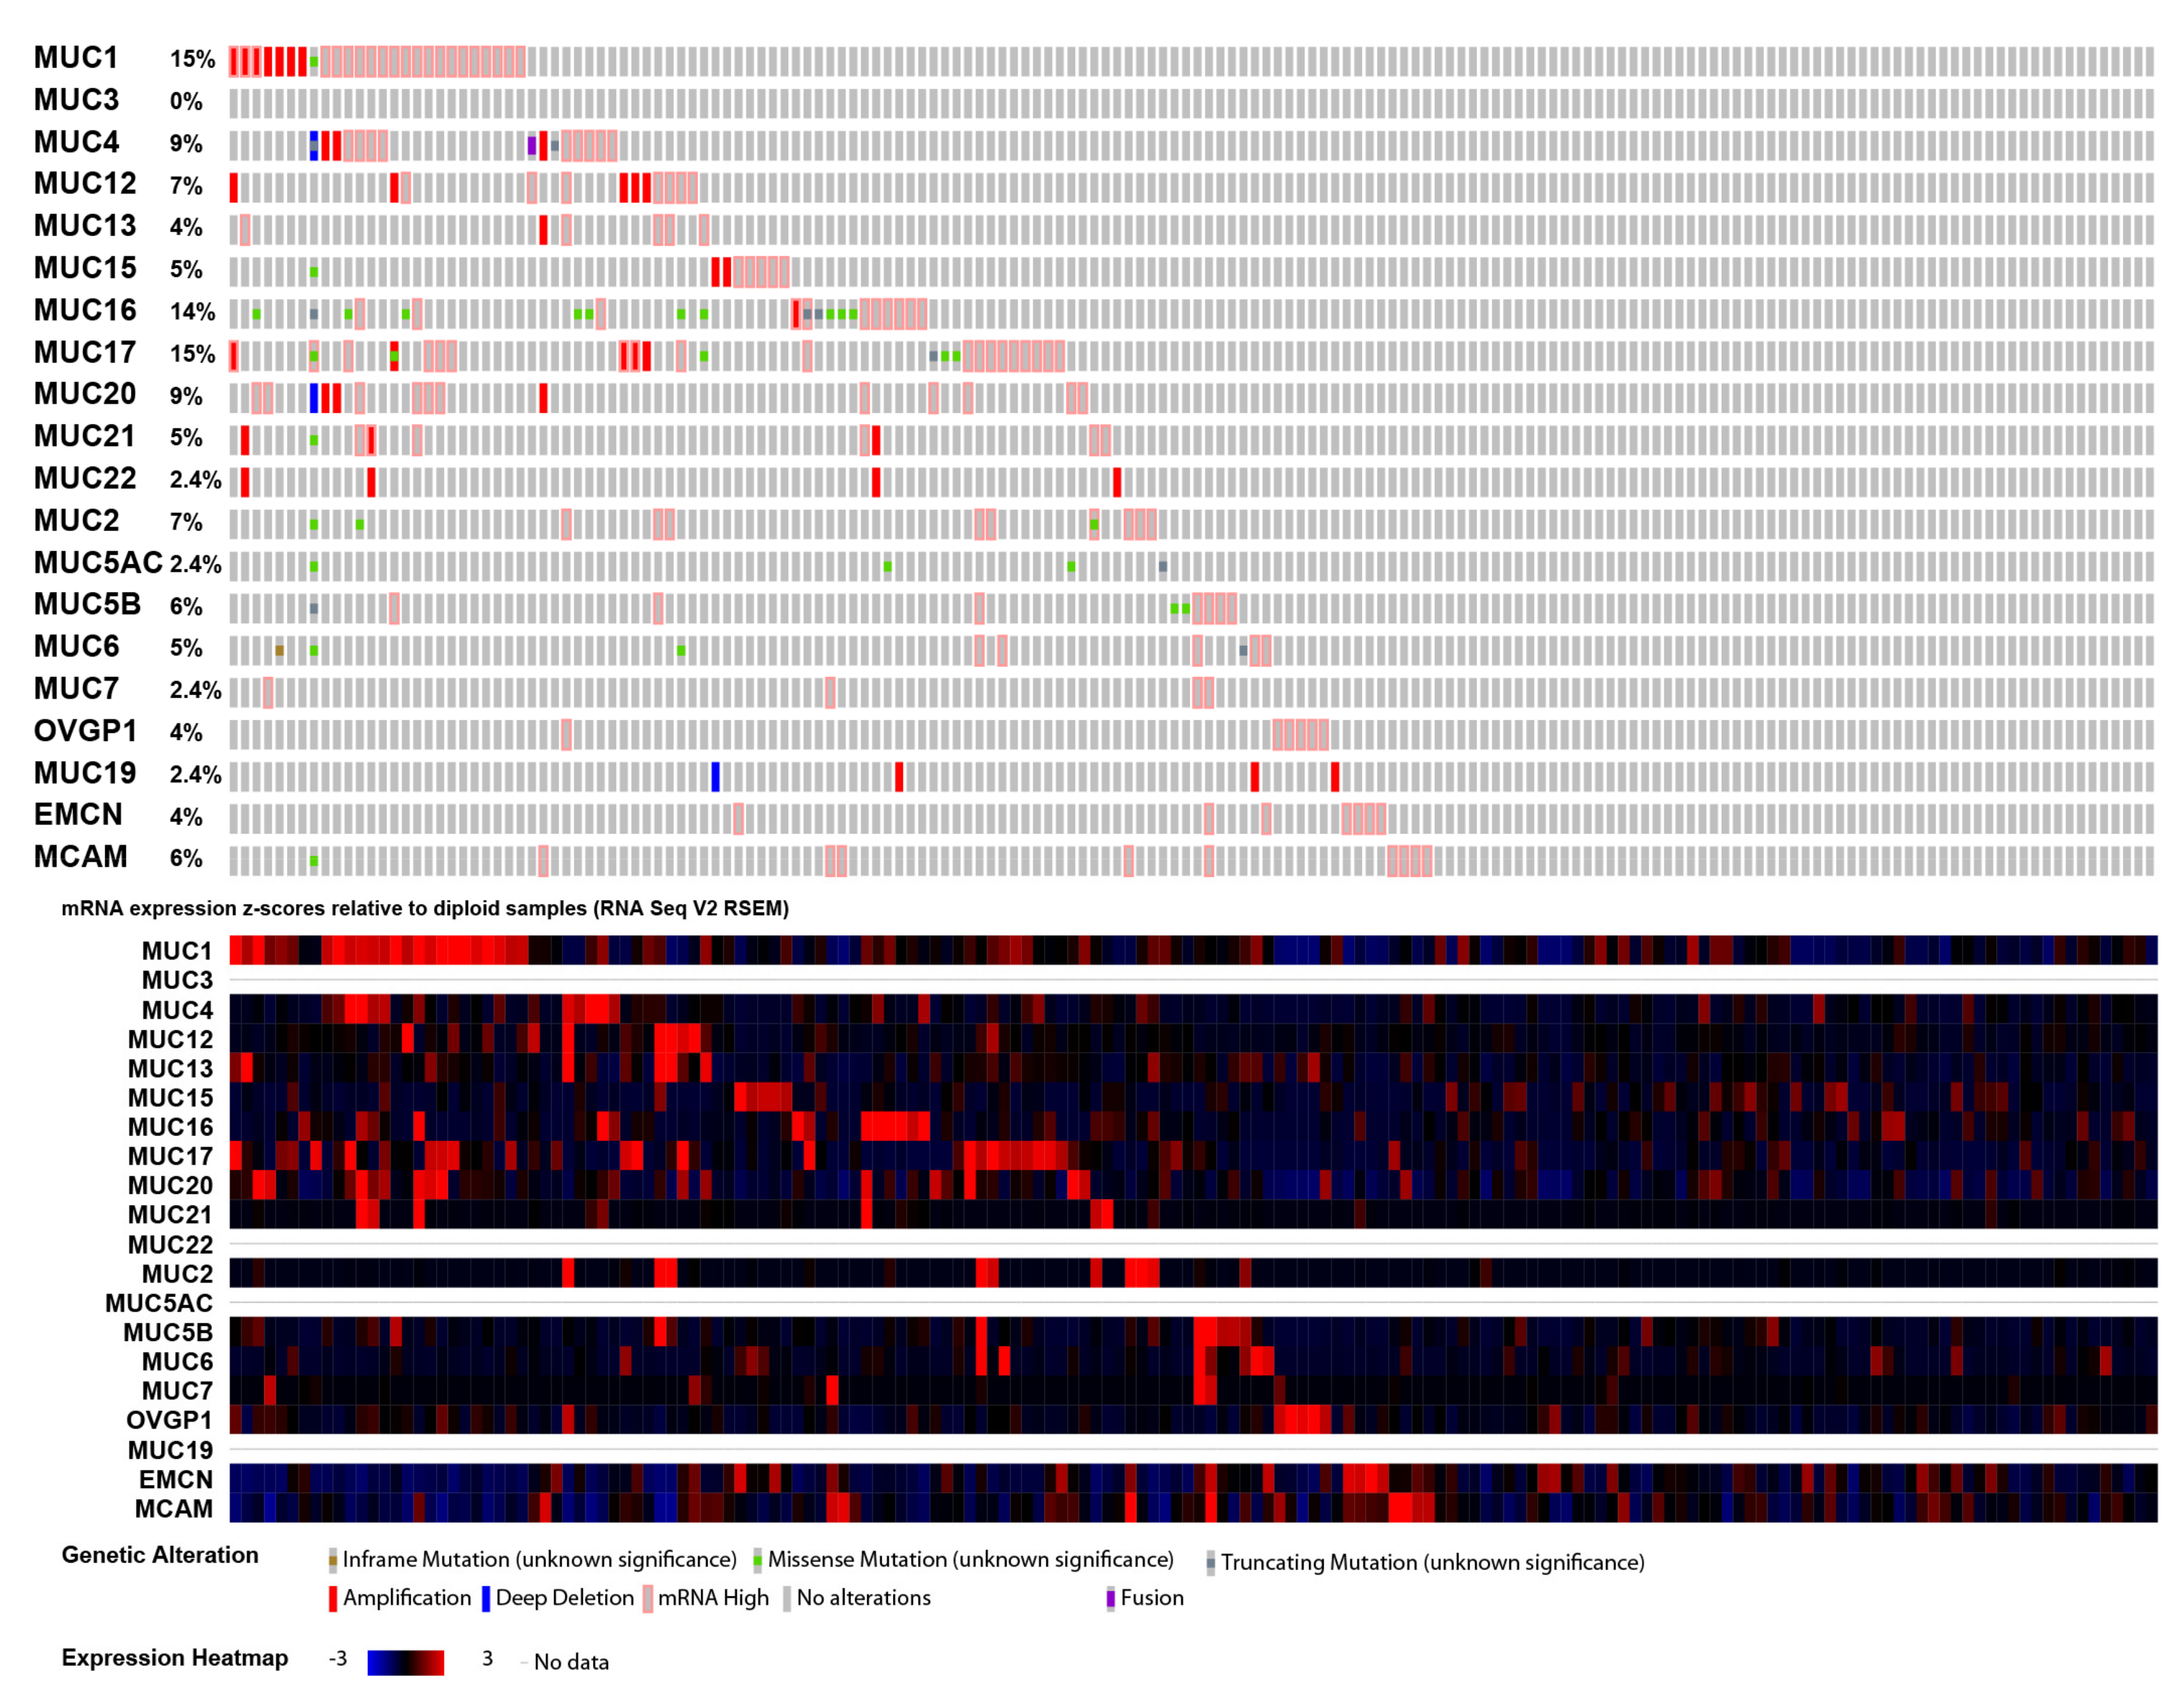
2.3. Mucin Genomic Alterations in Pancreatic Adenocarcinoma

We extracted genomic alterations and RNA-Seq by Expectation-Maximization (RSEM) values for every mucin gene in the PAAD-TCGA cohort using quantification data from RNAseq available with the cBioPortal tool. We could not retrieve any RSEM values for MUC3, MUC5AC, MUC8, MUC19, and MUC22. For the following analyses, we focused our work on available mucin data. The oncoprint is presented in Figure 3. In total, 63% of PDAC samples (105/168) harbored at least one mucin gene alteration event (amplification, deletion, mRNA high, or mutation) with MUC1, MUC17, MUC16, and MUC4 being the most frequently altered genes (15%, 15%, 14%, and 9%, respectively). There was no significant statistical difference in survival between altered and nonaltered groups (Figure S3A). We performed a similar analysis for individual mucins. Only MUC16 alterations were associated with worse overall survival and shorter progression-free survival (Figure S3C,D). We also investigated the most frequent gene mutations in altered and nonaltered groups. Interestingly, we observed an enrichment of the cornerstone V-Ki-ras2 Kirsten rat sarcoma viral oncogene homolog (KRAS) mutation in the mucin gene-altered group (70.48% vs. 57.14%, p = 0.0564). Furthermore, Titin (TTN) (23.81% vs. 1.59%, p < 0.001), Ras-responsive element-binding protein 1 (RREB1) (6.67% vs. 0%, p = 0.0345), and cyclin-dependent kinase inhibitor 2A (CDKN2A) (24.76% vs. 12.7%, p = 0.0435) were the most enriched gene mutations occurring in the mucin altered group (Figure S3B).

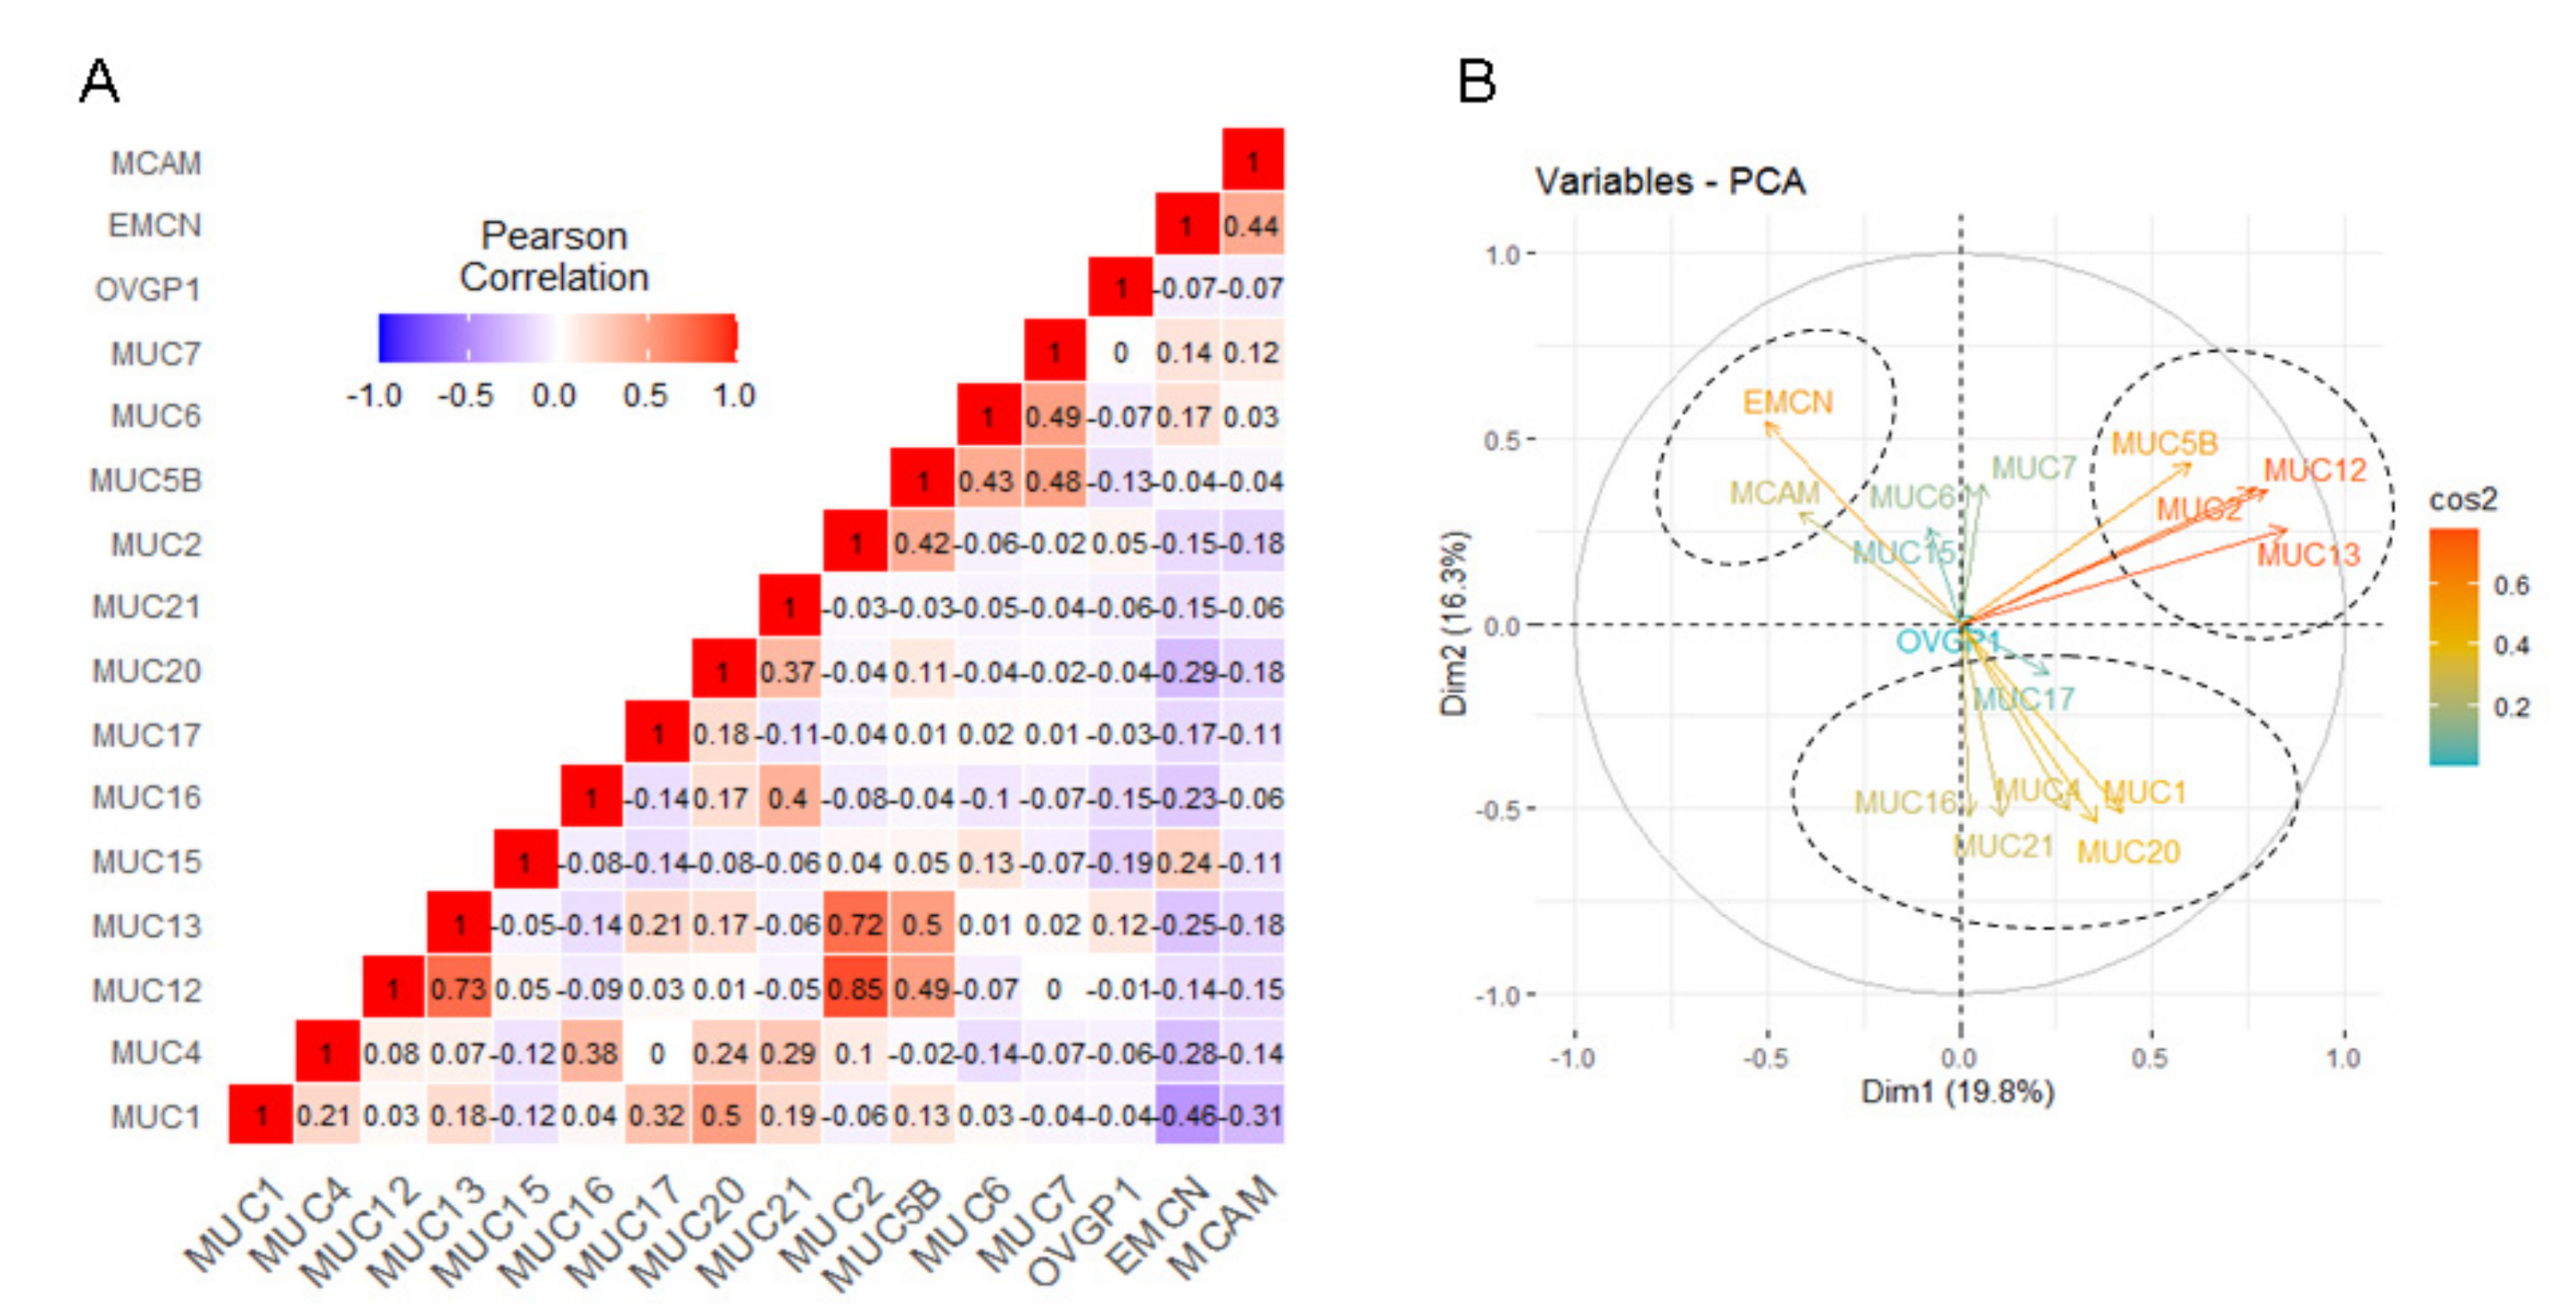
2.4. Correlation among Mucin Gene Expression in Pancreatic Adenocarcinoma

We analyzed Pearson correlation coefficient for each combination of mucin genes and realized a principal component analysis (PCA). We identified 26 combinations of mucin genes with a positive correlation (0.17 < r < 0.85, p < 0.05) and 11 with a negative correlation (−0.46 < r < −0.17, p < 0.05) (Figure 4A and Table 1). Among positive correlations, we observed a very strong correlation among MUC2, MUC12, and MUC13 (r = 0.72–0.85). Membrane-bound mucins mRNA (MUC1, MUC4, MUC16, MUC17, MUC20, and MUC21) were also frequently correlated suggesting a global membrane-bound mucin pattern. On the contrary, we observed that atypical mucin mRNAs (MUC14/EMCN and MUC18/MCAM) were correlated with each other (r = 0.44) but were negatively correlated with most membrane-bound mucins (MUC1, MUC4, MUC13, MUC16, MUC17, and MUC20; −0.17 < r < −0.44). Results of PCA confirmed that the membrane-bound mucin cluster was negatively correlated with the EMCN/MCAM cluster (Figure 4B). These two clusters appear to be independent of MUC2, MUC5B, MUC12, and MUC13 expression as illustrated on the PCA plot (Figure 4B). Similar analysis was conducted using the independent Queensland Centre for Medical Genomics (QCMG) pancreatic cancer dataset containing 96 transcriptomes [4] (Figure S4). We observed a similar correlation of membrane-bound mucins MUC1, MUC4, MUC13, MUC16, MUC17, and MUC20 (0.42 < r < 0.64) (Figure S4A,B) (Table S1, Supplementary Materials). MUC14/EMCN and MUC18/MCAM mRNAs were also correlated with each other (r = 0.34) (Figure S4B).

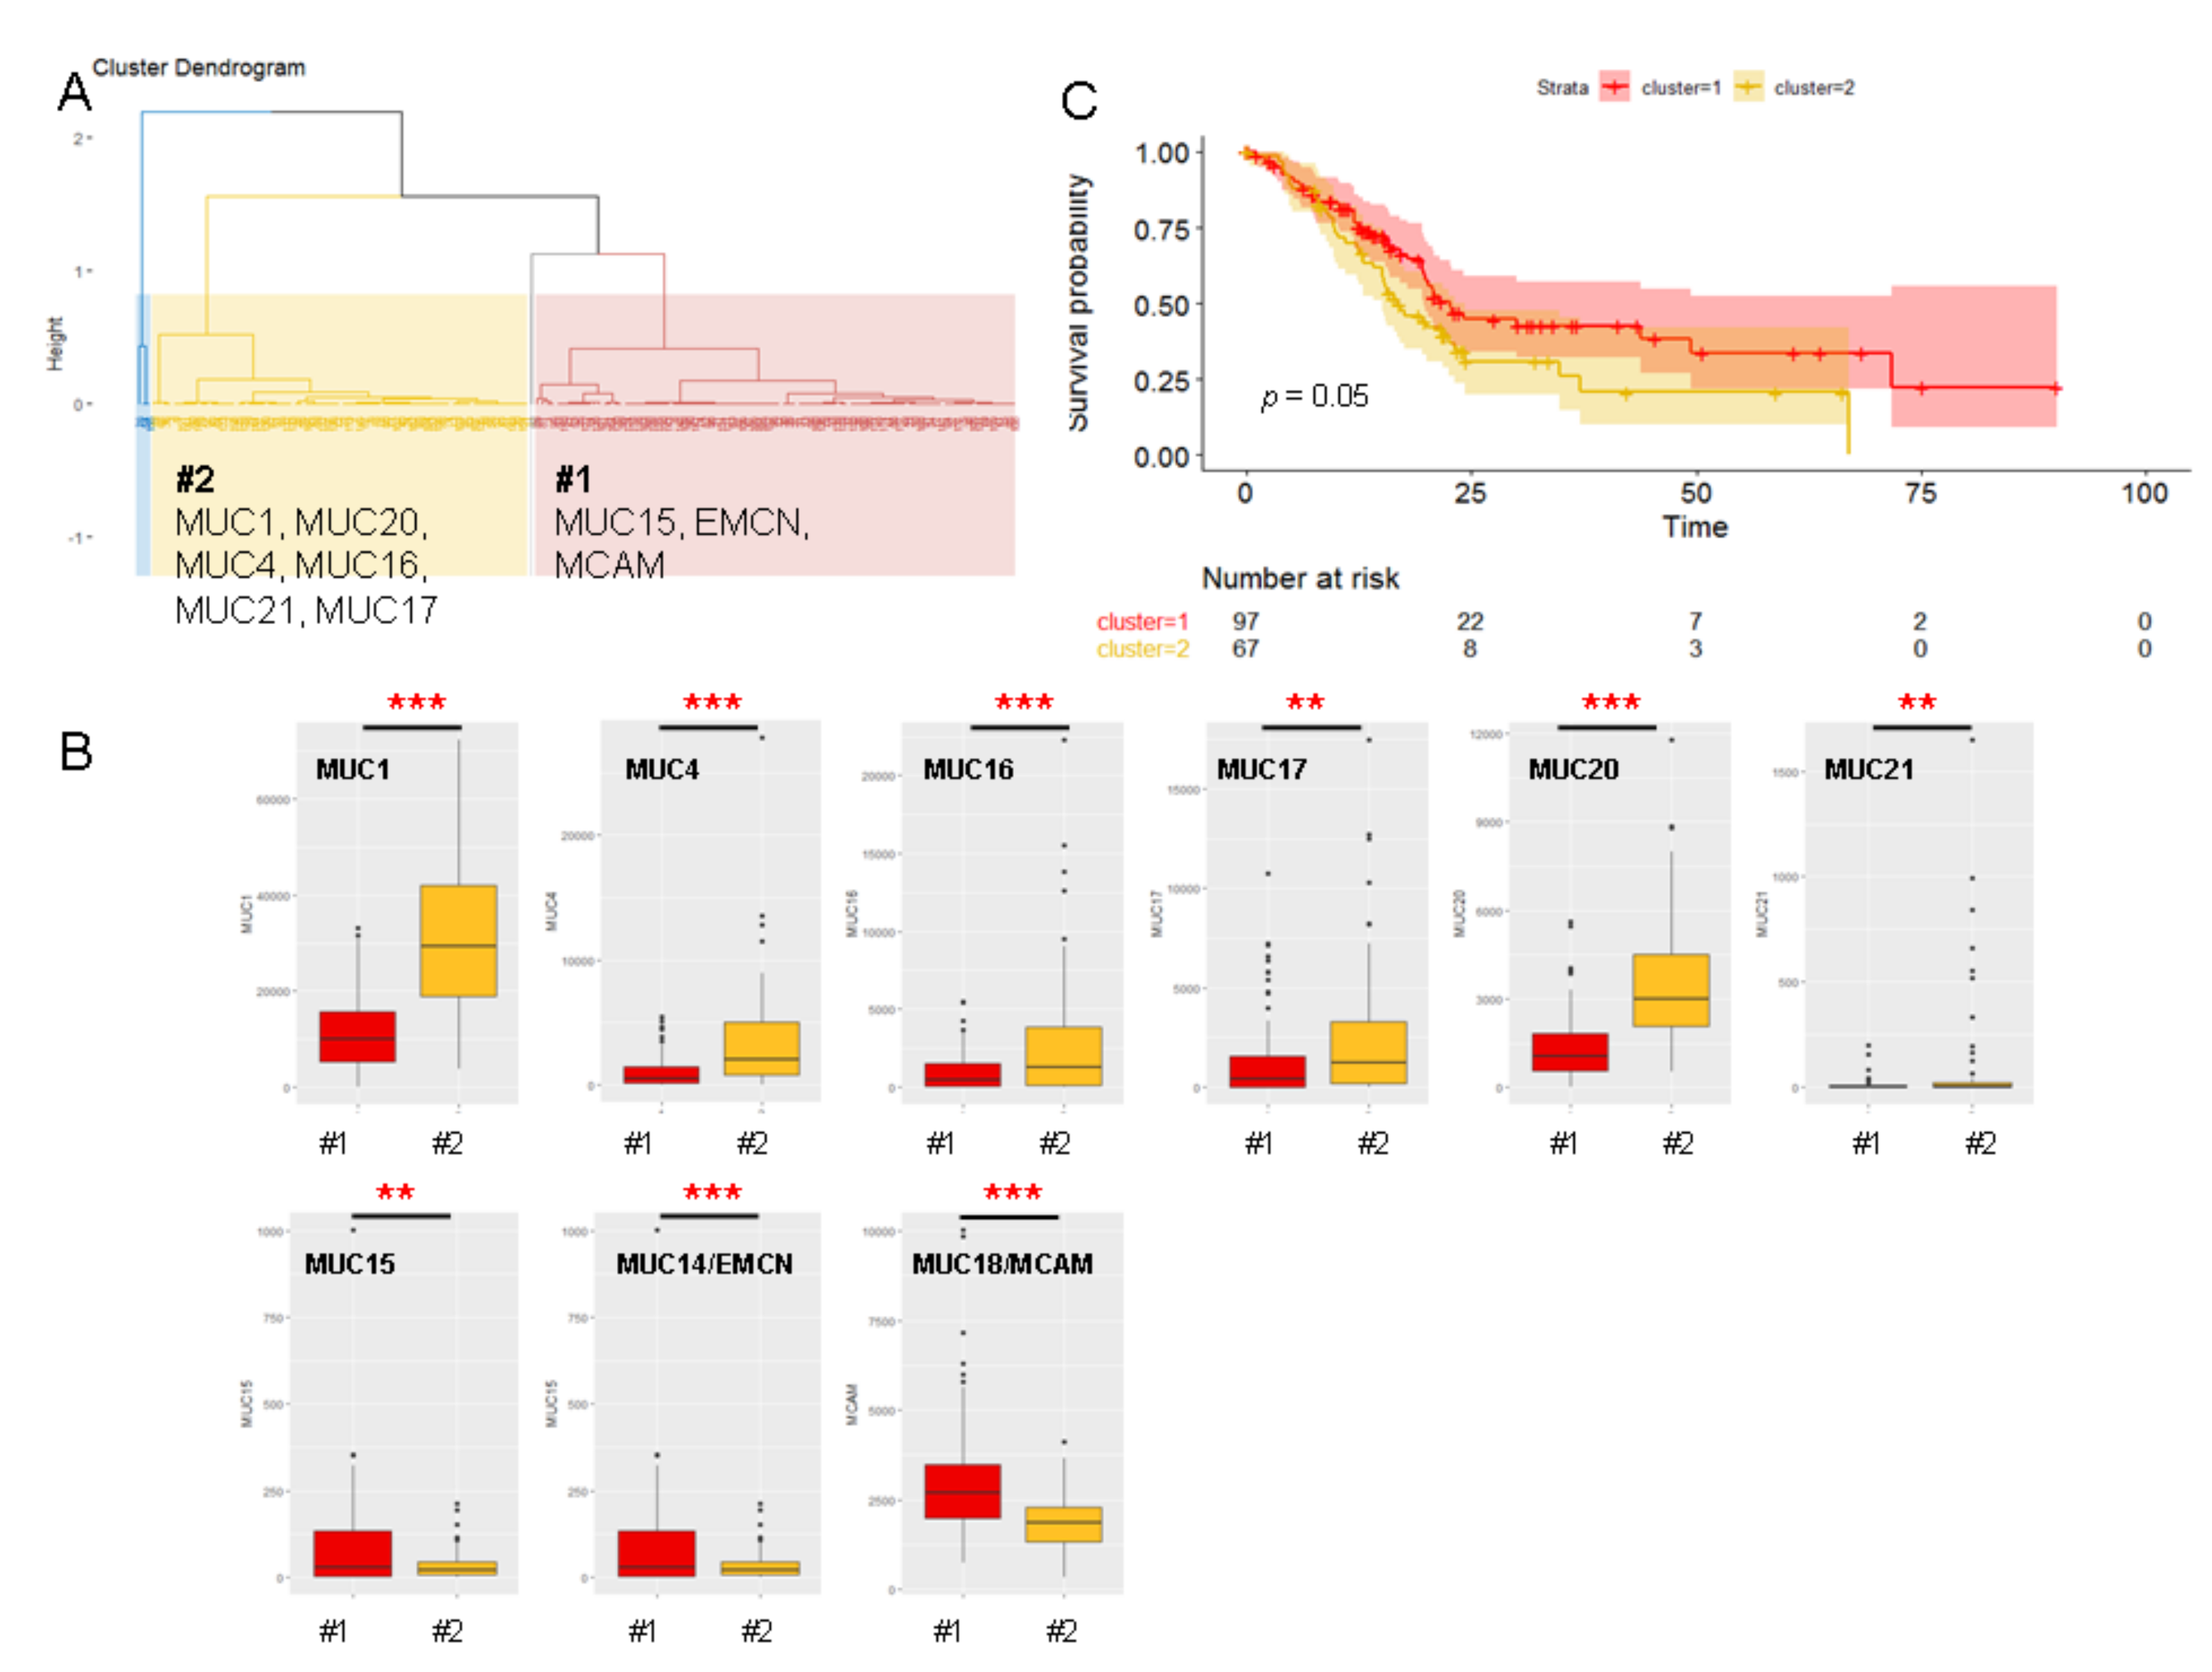
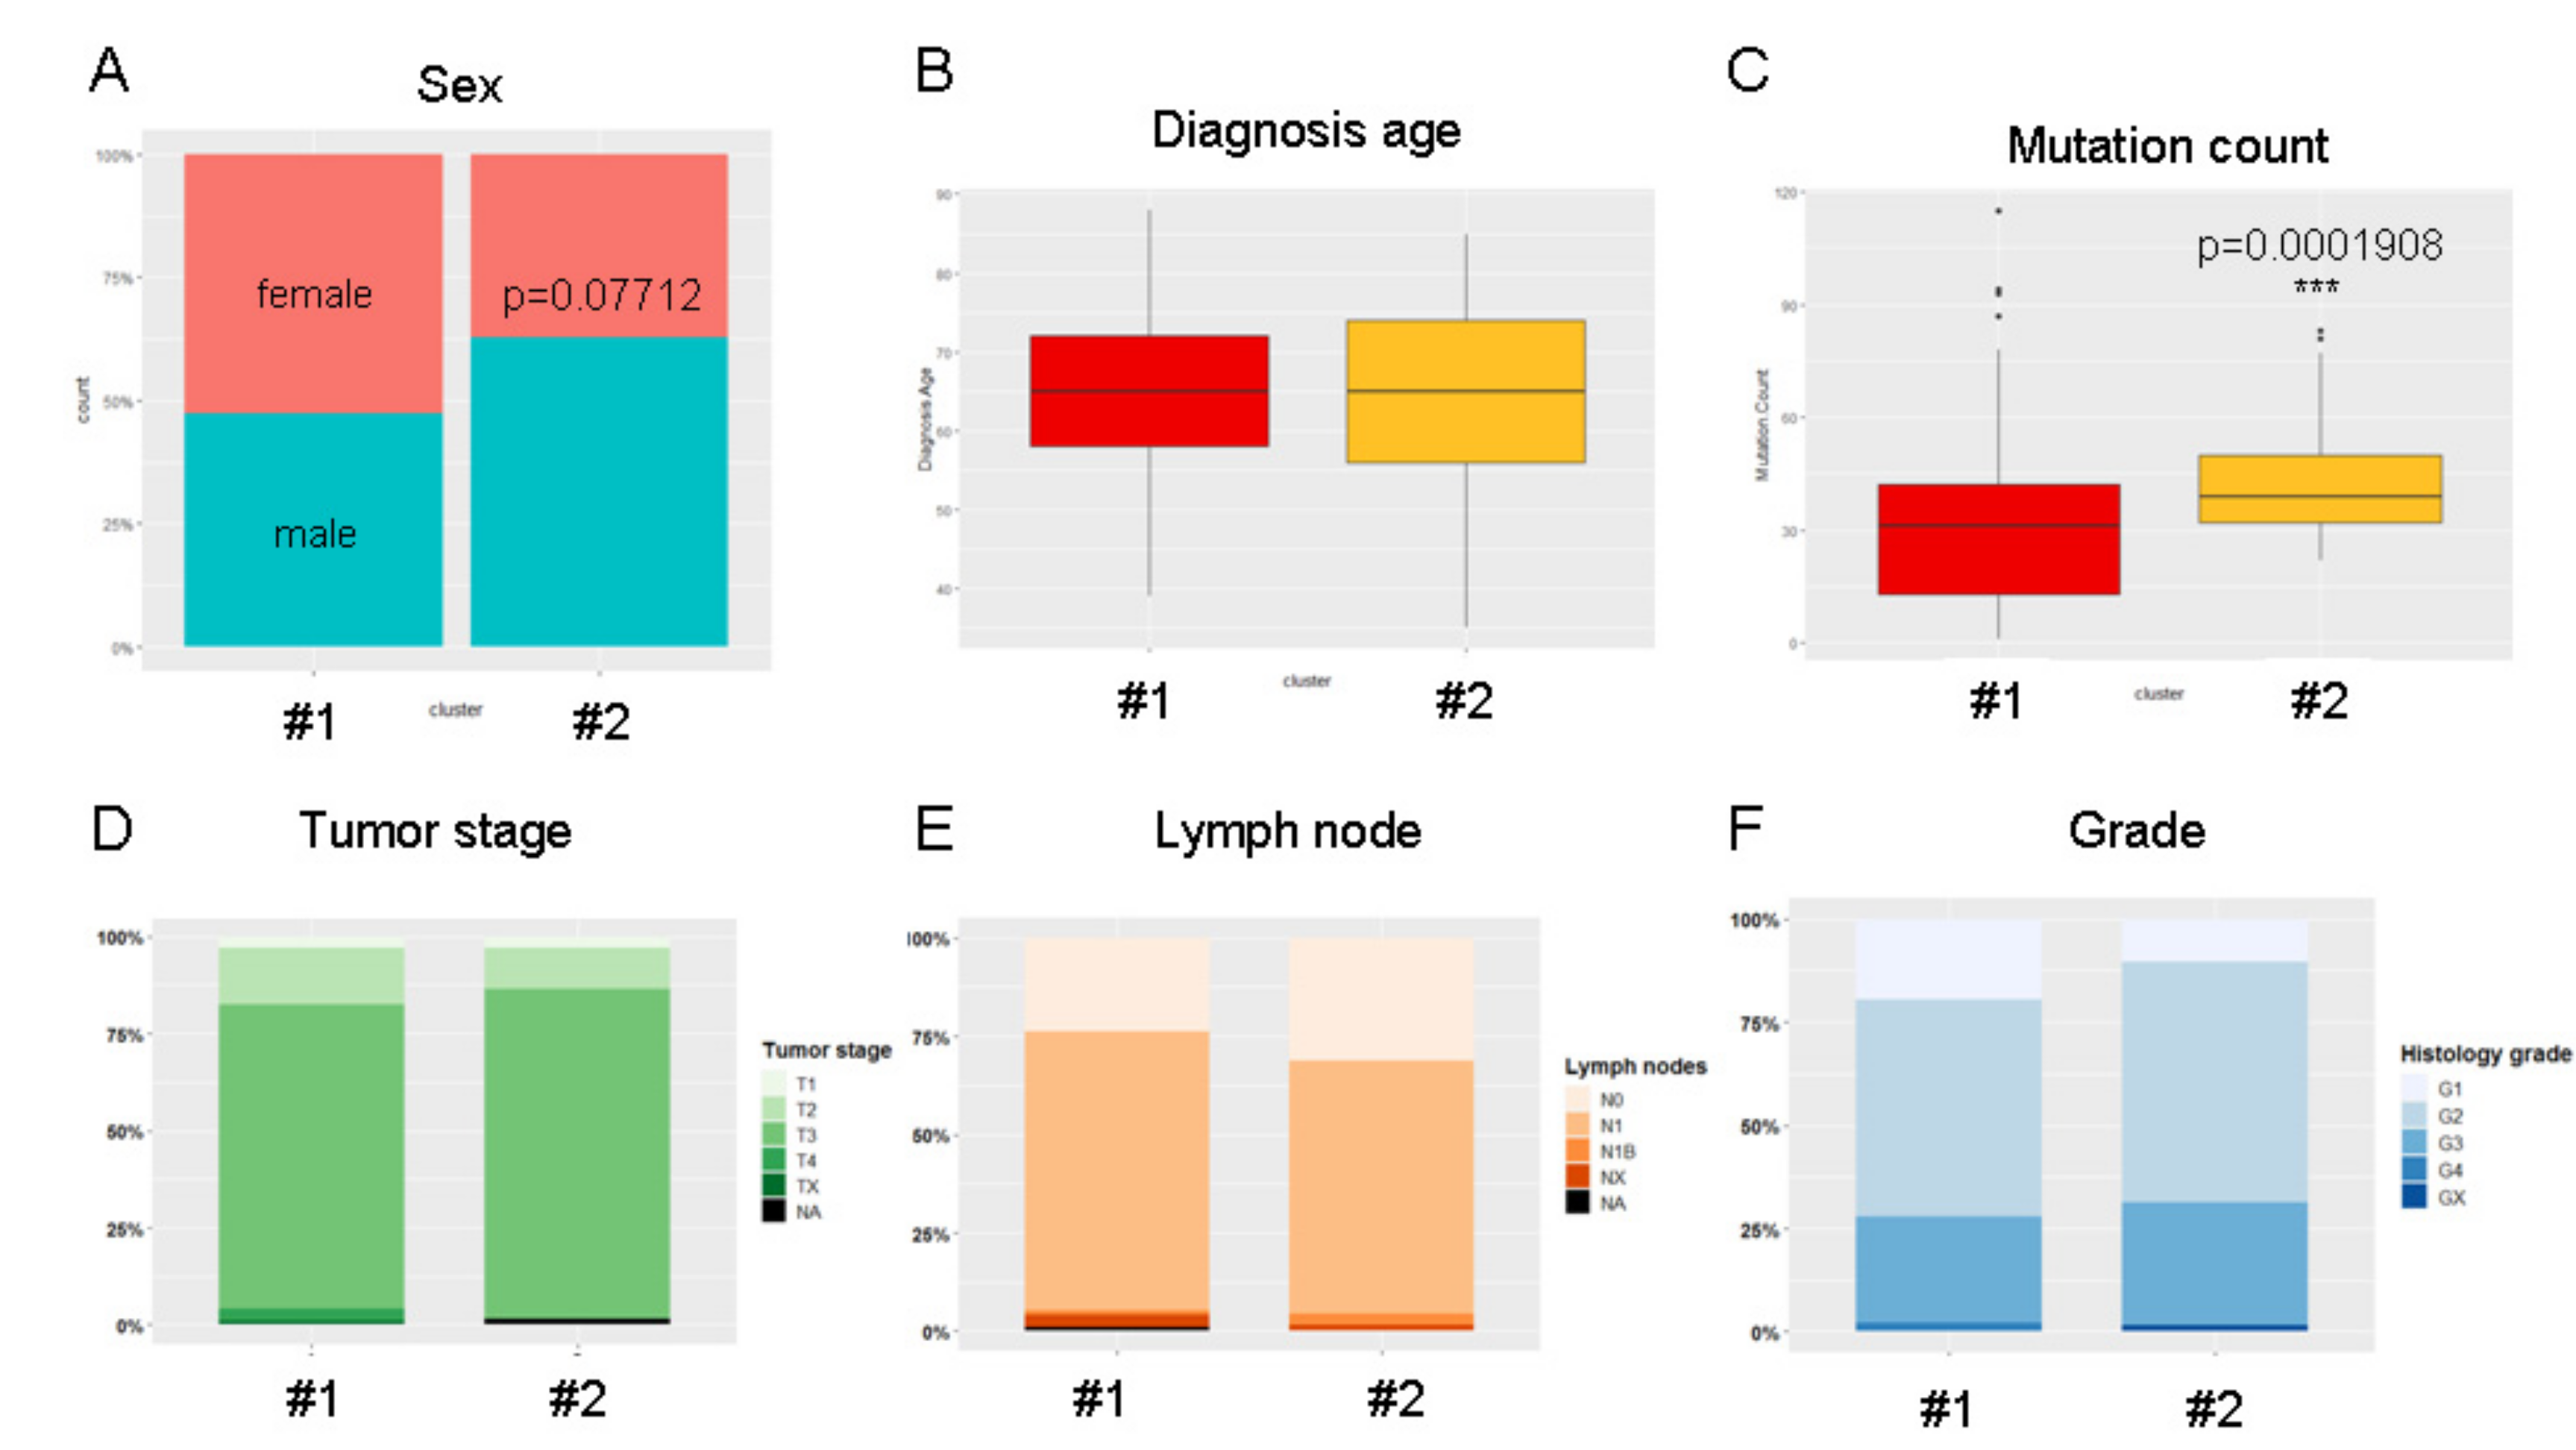
2.5. Unsupervised Hierarchical Clustering of the PAAD Cohort

We used an unsupervised hierarchical clustering algorithm on the PAAD cohort data according to the relative mucin gene mRNA levels. The unsupervised hierarchical clustering analysis grouped patients with similar mucin characteristics. We obtained four groups of patient samples as illustrated on the dendrogram (Figure 5A).
The major clusters #1 (red) and #2 (yellow) contained 97 and 67 patients, respectively. We also obtained two small groups of patients that contained only one and three patients (#3 and #4, respectively). Therefore, we focused on clusters #1 and #2 for further analyses. Cluster #1 was characterized by a higher expression of MUC14/EMCN, MUC15, and MUC18/MCAM mucin mRNAs (Figure 5B). Cluster #2 was characterized by a global overexpression of genes encoding membrane-bound mucins (MUC1, -4, -16, -17, -20, and -21) (Figure 5B). All these differences in expression were statistically significant (p < 0.01). Interestingly, Kaplan–Meier curves showed that cluster #2 was associated with shorter overall survival than cluster #1 (p = 0.05, HR = 1.5, CI 1–2.34) (Figure 5C) but did not impact the progression-free survival (p = 0.15) (not shown). Similar hierarchical clustering analysis was realized using the PAAD cohort without the four patients belonging to clusters #3 and #4. We obtained four new clusters (not shown). In total, 139 patients out of 164 were sorted into corresponding groups (84% concordance). Cluster #2 was divided into two clusters characterized by two membrane-bound mucin signatures (MUC1/13/17/20/12 or MUC4/16/20/21). An independent unsupervised hierarchical clustering algorithm on the QCMG dataset was also performed. We obtained three clusters as illustrated in Figure S4C (Supplementary Materials). Cluster #1′ was characterized by a higher expression of MCAM. Clusters #2′ and #3′ were more related and were characterized by a higher expression of membrane-bound mucins (MUC1 and MUC17 for cluster #2′; MUC4, MUC16, and MUC20 for cluster #3′).
We then analyzed the clinical characteristics of patients belonging to clusters #1 and #2. We observed a trend toward male enrichment in the cluster #2 (p = 0.077) (Figure 6A). Age of diagnosis was equivalent in both groups (65 years old, Figure 6B). Additionally, we observed a significant increase in whole-genome gene mutation counts in patients from cluster #2 (p < 0.001) (Figure 6C). We did not obtain evidence for significant differences in clinical features (tumor stage, differentiation grade, lymph node invasion) (Figure 6D–F) suggesting that the mucin expression pattern could be an independent prognostic biomarker in PDAC.
We also investigated the survival of PDAC patients in relation to the relative expression levels of the two clusters using SurvExpress that splits the cohort where the p-value is minimal and PROGgeneV2 that separates the two cohorts depending on the median of expression of the genes of interest. We also investigated the GSE57495 independent dataset that contains relative mRNA levels and survival of 63 PDAC patients. Using the SurvExpress tool, we observed that signature #2 was associated with a higher hazard ratio (HR = 4.3) than signature #1 (HR = 1.75) in the PAAD-TCGA dataset (Figure 7A). Indeed, the high mRNA expression of MUC1, MUC4, MUC16, MUC17, MUC20, and MUC21 was correlated with shorter overall survival (p = 0.000195) (Figure 7B). The high mRNA expression of MUC14/EMCN, MUC15, and MUC18/MCAM was also associated, to a lower extent, with shorter survival in the PAAD dataset (Figure 7C). Using PROGgeneV2, we confirmed that the high expression of signature #2 was associated with a worse outcome compared to signature #2 low-expression tumors in both TCGA-PAAD and GSE57495 (HR = 1.18–1.45, p < 0.001) (Figure S5A). On the contrary, signature #1 did not reach statistical significance in the TCGA-PAAD (p = 0.055) or in the GSE57495 dataset (p = 0.43) (Figure S5B). Altogether, this suggests that signature #2 could be useful in the stratification of patients with worse prognosis in pancreatic cancer.

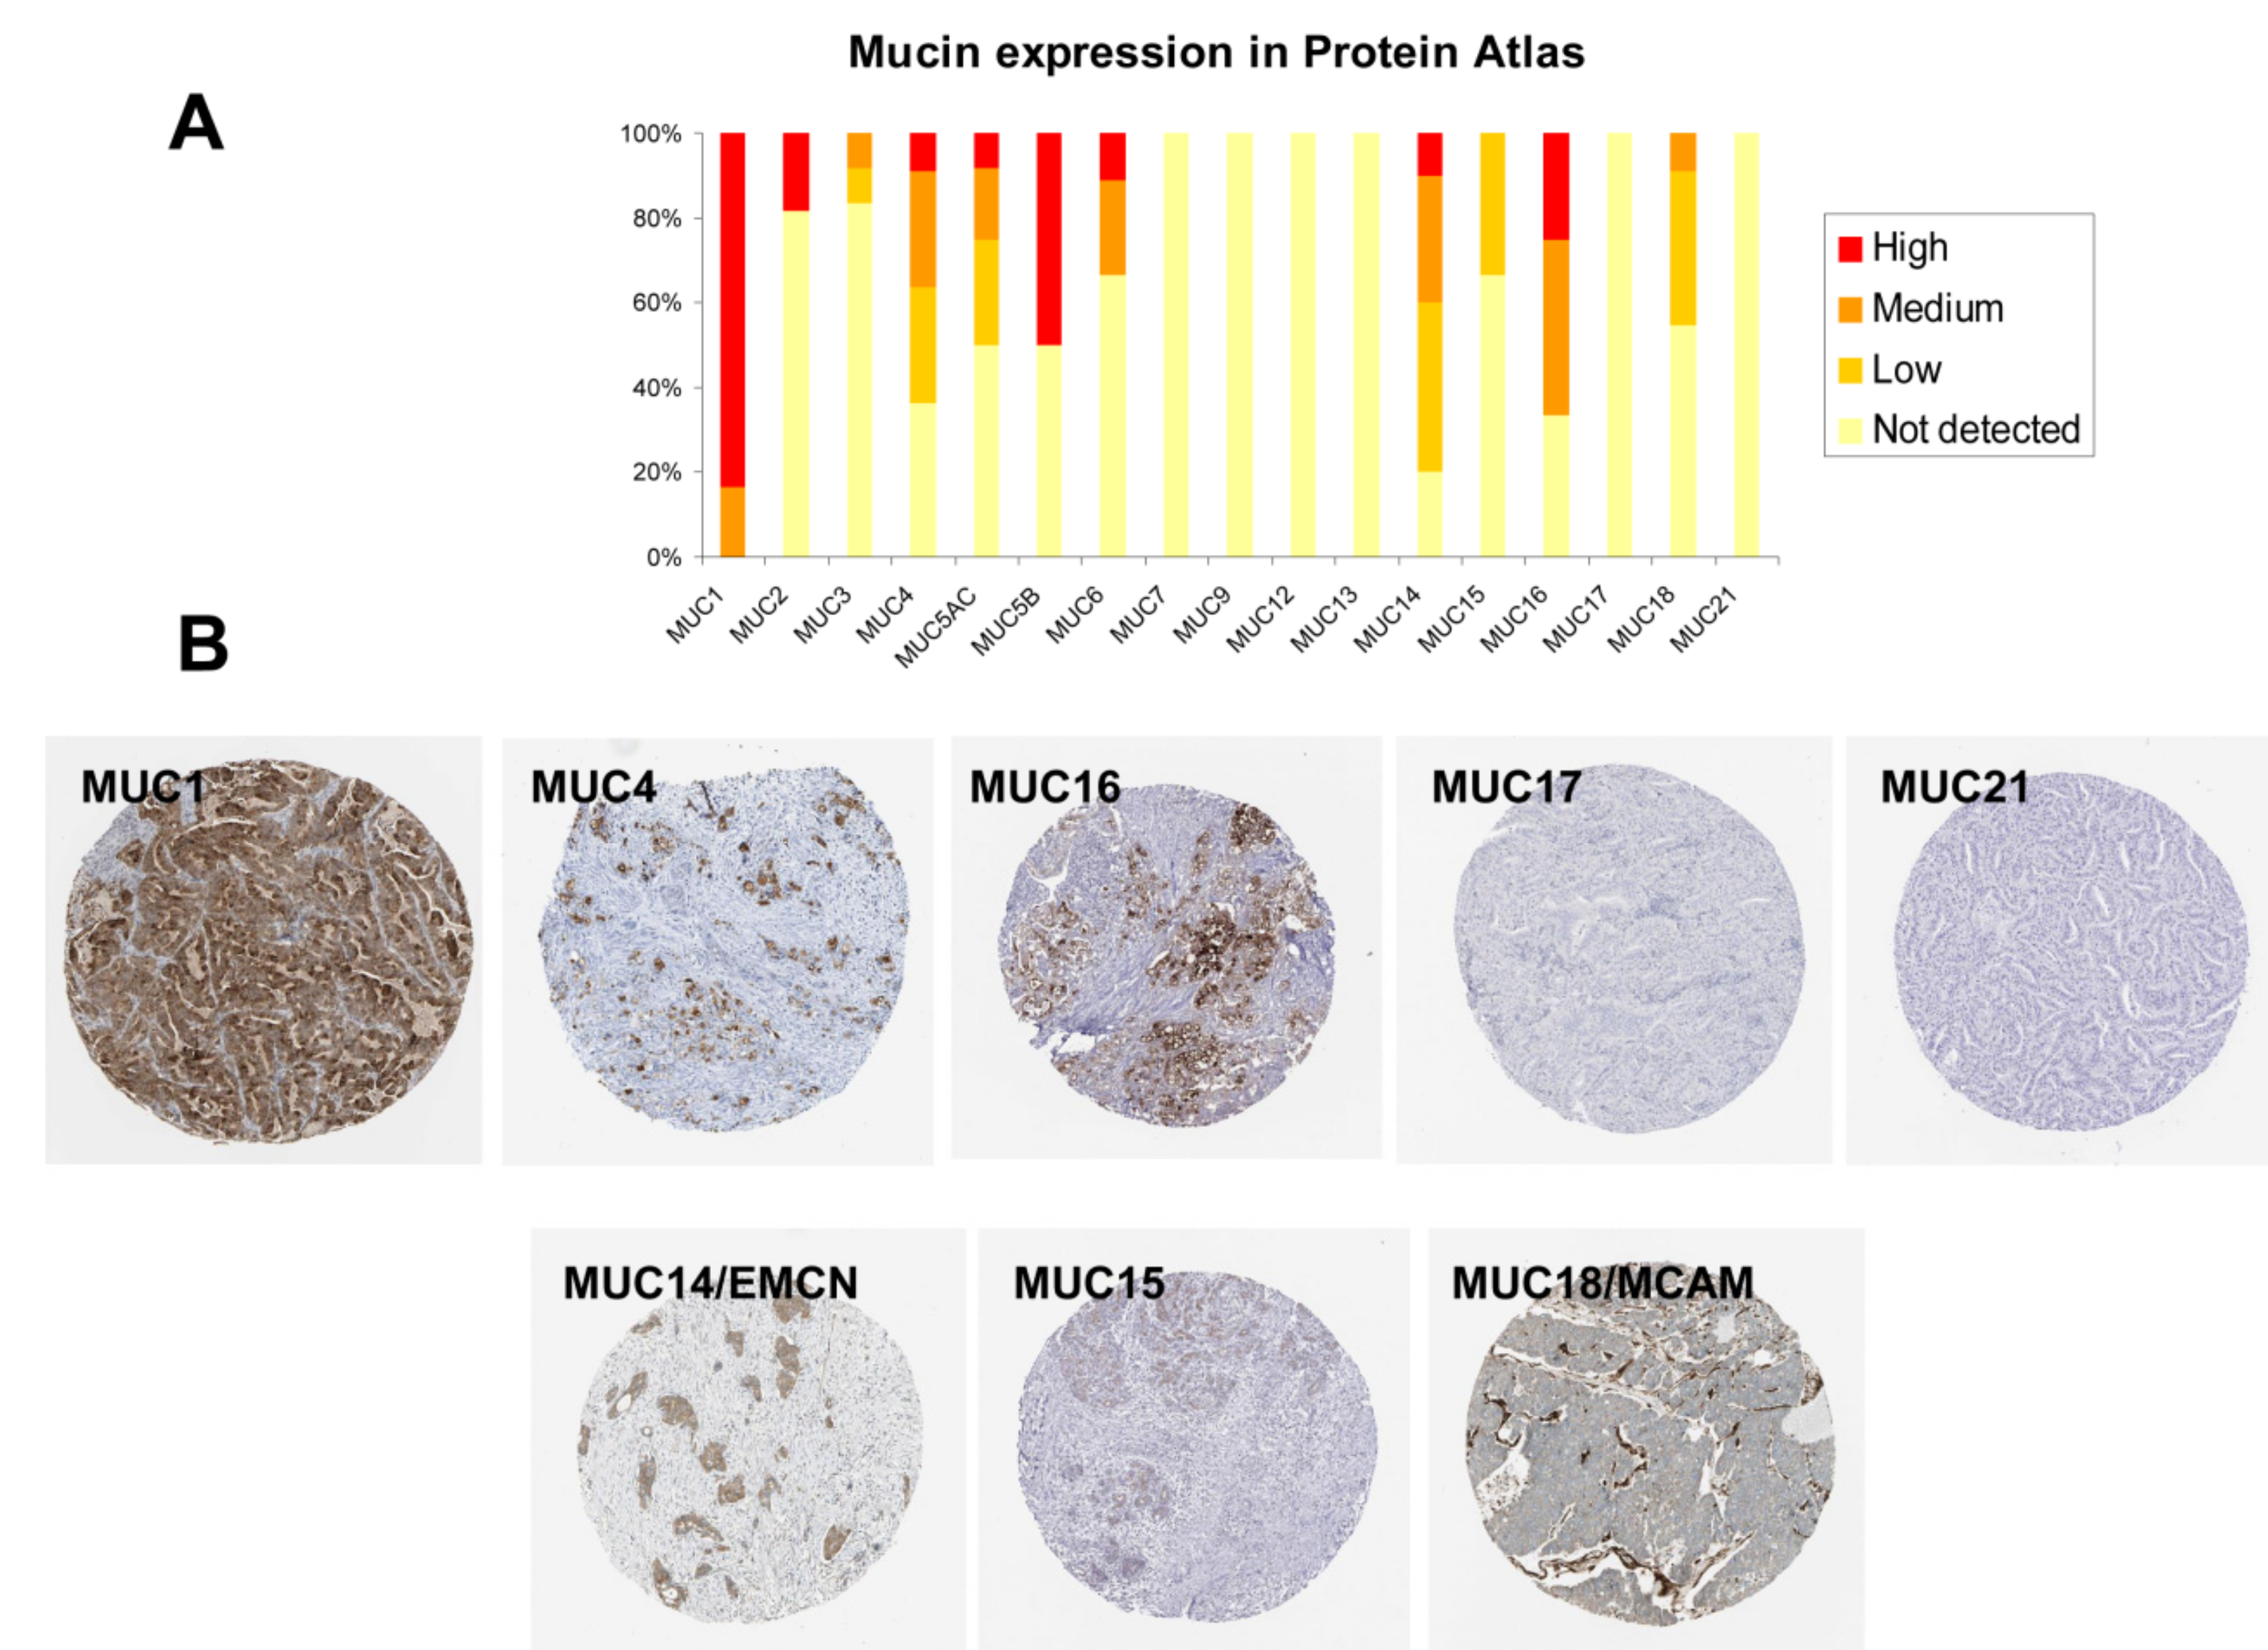
2.6. Immunohistochemistry (IHC) Analysis of Mucin Expression in Human PDAC Samples

Lastly, in order to investigate the cellular distribution of the different mucin proteins in human PDAC samples, we retrieved IHC data from Protein Atlas that were performed on tissue macro-arrays containing 10 to 12 different PDAC samples. Regarding the membrane-bound signature (#2), we observed that 12/12 and 7/11 samples expressed MUC1 and MUC4 membrane-bound mucins, respectively (Figure 8A). We observed strong cytoplasmic and/or membrane staining (Figure 8B). Only 3/12 samples harbored MUC16 expression. MUC17 and MUC21 were not detected in any PDAC samples. MUC20 was not evaluated. Mucins that belong to signature #1 were also investigated. MUC14/EMCN, MUC15, and MUC18/MCAM were detected in 8/10, 4/12, and 5/11 PDAC samples, respectively. Interestingly, MUC14/EMCN, which is described as an endothelial mucin, was expressed by tumor cells (Figure 8B). On the contrary, MUC18/MCAM staining was only observed in the stroma surrounding the tumor cells.

3. Discussion

In the present study, we analyzed the PAAD cohort of the TCGA and identified a mucin signature that correlates with a worse outcome for patient survival, suggesting its potential usefulness as a prognostic marker. TCGA helps the scientific community to decipher the molecular landscape of PDAC and provides a roadmap for precision medicine [9]. PDAC is a dramatic disease with interpatient heterogeneity [8]; therefore, a better understanding of each tumor is mandatory for better healthcare and precision medicine.
We identified a patient cluster characterized by a higher expression of 6 membrane-bound mucin genes in the tumor cells. Membrane-bound mucins are commonly associated with increased tumor progression. Among them, MUC1 and MUC4 have been extensively demonstrated to be oncomucins promoting tumor aggressiveness, proliferation, and metastasis [1,29,30,31], suggesting the potential use of their expression and methylation status as independent prognosis markers [32,33,34]. MUC16 and MUC20 have also been implicated in the malignant phenotype (cell viability, migration, and invasion) of PDAC cells [18,35]. MUC17 has been previously proposed as a potential prognosis molecular marker of PDAC [36]. MUC21 was more recently discovered in lung adenocarcinoma [37] and has not been described in pancreatic pathologies. Interestingly, MUC1 and MUC4 may regulate the response to chemotherapy. Notably, MUC1 and MUC4 silencing promote gemcitabine sensitivity [38,39,40]. There are limited chemotherapy protocols (gemcitabine/S1, FOLFIRINOX, Nab-Paclitaxel) highlighting the importance of transcriptomic research to orientate patients toward the best individual protocol for each patient. We hypothesize that mucin expression combination (notably MUC1 and MUC4) could also serve as a prognostic biomarker to tailor chemotherapy.
Global alteration (amplification/deletion/increased mRNA) of mucin pattern was not associated with overall survival in our analysis, but we observed that the patients showing individual MUC16 mRNA alteration had a worse outcome than the nonaltered patients. This was contradictory with previous work that showed that PDAC long-term survivors harbor neoantigens in the tumor antigen MUC16/CA125 [41]. The presence of neoantigens was proposed as a biomarker for immunogenic tumors. This is consistent with the finding that patients belonging to cluster #2 harbored a lower whole-genome mutation count. The alteration of neoantigen formation remains to be demonstrated between the two clusters. Additionally, we also observed an enrichment of TTN, RREB1, and CDKN2A gene mutation within the patient harboring at least one mucin gene alteration. TTN has been previously shown to be independently correlated with the overall survival of PDAC patients. TTN expression is significantly lower in PDAC cell lines compared to human pancreatic ductal epithelial (HPDE) cells [42]. On the contrary, RREB1 is upregulated in PDAC tissues and regulates the proliferation and migration of PDAC cells [43]. CDKN2A that encodes the tumor suppressor p16/INK4 is well known as CDKN2A germline mutations have been reported in familial forms of pancreatic cancer [44]. The meaning of the correlation between mucin gene alteration and these three gene mutations remains to be fully understood.
Most mucins are epithelial markers, but MUC14, also classified as a mucin because of its O-glycosylated structure, is designated as an endomucin (EMCN) and is a biomarker of endothelial cells [44]. MUC18/MCAM/CD146 is expressed in cancer-associated fibroblasts that are enriched in PDAC stroma [28]. We observed for the first time a patient subgroup that is characterized by a higher expression of MUC14/EMCN, MUC18/MCAM, and MUC15 in their tumor tissue. According to Moffitt’s previous work, two stromal subtypes (normal and activated) were defined and harbor independent prognostic characteristics [6]. We hypothesize that the MUC14/MUC18/MUC15 subgroup could overlap with the different stromal populations. Recent work also showed that the expression levels of MUC14/EMCN, MUC18/MCAM, and MUC15 individually showed significant correlations with worse overall survival in stomach adenocarcinoma (STAD) from TCGA dataset [27] suggesting that these genes could also be prognostic biomarkers in other digestive cancers. However, this could be specific to gastric cancer since we observed that MUC14 and MUC18 are associated with better survival in the PDAC cohort. MUC5AC and MUC6 gastric-type mucin expressions are detected in PDAC and their neoplastic lesions [16]. MUC5AC is also expressed in other types of pancreatic lesions such as the intestinal type of intraductal papillary mucinous neoplasm (IPMN) [45]. Previous work showed that MUC5AC could be a therapeutic target in PDAC (using NPC-1 or clivatuzumab/PAM4 antibodies) and a potential biomarker (as circulating marker and combined with CA19.9) [23,46]. However, in the present analysis, the expression of these two mucins was not associated with the patient clustering. MUC5B has been shown to regulate migration and survival in AsPC-1 PDAC cells [47]. Interestingly, we observed that MUC5B is aberrantly expressed in tumor samples and that MUC5B high expression is associated with poorer survival. Globally, all the genes encoding secreted mucins appeared to be grouped together but were independent regarding the two mucin signatures (as illustrated on Figure 4B).
A recent unsupervised clustering analysis as a function of MUC1, MUC2, and MUC4 identified a patient cluster, characterized by a higher expression level of the three mucin genes harboring a significantly poorer prognosis. Further machine learning analysis showed that the methylation status of these three mucin genes could be potential prognostic biomarkers [48]. The correlation between mucin gene expression and the two identified signatures suggests a concerted regulation of these mucin genes as previously suggested for secreted mucins [13,49]. Among possible cellular mechanisms driving concerted regulation, hyper or hypomethylation of the membrane-bound mucins could explain the overall increased expression of these genes [50]. MUC1 and MUC4 hypomethylation status were shown to be correlated with expression of DNA demethylation factors (TET1, TET2) and DNMT3 DNA methyltransferase [33]. We also observed a nearly significant enrichment of KRAS mutation in patients harboring at least one mucin gene alteration. Interestingly, MUC4 and MUC16 were shown to be direct target genes of K-ras [51,52]. Further analyses are necessary regarding MUC17, MUC20, and MUC21 regulation by K-ras or methylation to confirm this hypothesis. It was also suggested that mucin mRNAs share common mechanisms of stabilization that may participate to their singularity as hyperstable transcripts [53] and to their co-expression. In addition, this unusually long half-life supports the relevance of using transcriptomics data to unravel mucin signatures of cancers of different subtypes.
In addition to the interpatient heterogeneity that we observed in the present manuscript, intratumor heterogeneity (ITH) within a single tumor is characteristic of PDAC. Genomic and epigenomic diversity of PDAC tumor cells leads to diversity of transcriptome and proteome between tumor PDAC subclones [21]. Desmoplasia is a major feature in PDAC with an important extracellular matrix (ECM) deposition surrounding tumor cells and high content of cancer-associated fibroblasts and immune cells. This ITH should be taken into account and suggests that the proposed mucin signature should be validated by IHC in order to decipher the cell type involved in the different mucin expression. Despite being described as an endothelial marker, we mainly observed a MUC14/EMCN staining in tumor cells. On the contrary, MUC18/MCAM staining was mainly localized in the stroma. These surprising patterns will have to be confirmed and compared to the grade of desmoplasia. However, we hypothesize that the higher expression of CAF-MUC18 in some PDAC patients could be correlated with the patients showing the highest grade of desmoplasia.
In the near future, we propose to explore the extent and clinical implications of ITH and decipher the mucin signature between patients and tumor regions and discuss how profiling the mucin expression pattern could help clinicians for precision medicine, lead to new prognostic signatures, and notably participate in assigning the best therapy regimen for each patient.

4. Materials and Methods

4.1. Expression Data Retrieval and Analysis

MUC1, MUC2, MUC3A, MUC4, MUC5AC, MUC5B, MUC6, MUC8, MUC9, MUC12, MUC13, MUC14/EMCN, MUC15, MUC16, MUC17, MUC18/MCAM, MUC19, MUC20, and MUC21 expression was extracted from GEPIA [54]. The normal (n = 171) vs. tumor (n = 179) patterns of expression were analyzed using GEPIA that recomputes the Genome Tissue Expression (GTEX) and TCGA gene expression data.
The GSE28735 microarray was analyzed using the National Center for Biotechnology Information (NCBI) Gene Expression Omnibus (GEO) database (http://www.ncbi.nml.nih.gov/geo/). GSE28735 is a dataset containing 45 normal pancreas (adjacent non tumoral, ANT) and 45 tumor (T) tissues from PDAC cases. The mRNA expression in tumor and ANT samples was analyzed using R studio.
All queries for each mucin gene were also realized in pancreatic adenocarcinoma PAAD dataset from TCGA (http://cancergenome.nih.gov/)) and QCMG [4] using the cBioPortal website [55,56]. The mRNA expression values were retrieved as RSEM (batch-normalized from Illumina HiSeq_RNASeqV2). Gene expression and clinical information were filtered for missing values.
All TCGA data analyses were processed using R studio. The complete R script is available at https://github.com/NicolasJonckheere/Mucin-script. The Pearson correlation coefficients (r-values) and p-values were calculated for each combination of mucin genes. Principal component analysis (PCA) and unsupervised hierarchical clustering (HC) were performed using the FactoMiner package in R studio. The number of clusters is automatically determined by HCPC {FactoMineR}. The default partition in four clusters is the one with the higher relative loss of inertia. Survival analyses of patient clusters were conducted using the survival and SurvMiner packages. Only major clusters #1 and #2 were further analyzed. Clusters #3 and #4 were excluded from the following analyses due to a low number of cases (one and three patients, respectively).

4.2. Survival Analysis

Survival analysis was conducted using the SurvExpress and PROGgeneV2 online tools [57,58]. Individual mucin gene analysis and the signature combination analysis were performed using SurvExpress with the optimized Maximize algorithm that attributes a minimal p-value to a risk group. Hazard ratio (95% confidence interval (CI)) was also evaluated. Combinations of mucins (#1: MUC15, EMCN, and MCAM; #2: MUC1, MUC4, MUC16, MUC17, MUC20, and MUC21) were also analyzed using PROGgeneV2 in TCGA-PAAD and GSE57495 datasets. GSE57495 is an independent microarray analysis of 63 patients with pancreatic cancer tissues used to predict overall survival [59].

4.3. Immunohistochemistry (IHC)

Mucin expression was analyzed by IHC using the available scanned tumor macro array staining from ProteinAtlas database (www.proteinatlas.org/) [36]. In total, 10 to 12 PDAC samples were analyzed for MUC1 (HPA004179), MUC2 (CAB016275), MUC3A (HPA010871), MUC4 (HPA005895), MUC5AC (HPA040615), MUC5B (HPA008246), MUC6 (CAB002165), MUC7 (HPA006411), MUC9 (HPA062205), MUC12 (HPA023835), MUC13 (HPA045163), MUC14 (HPA005928), MUC15 (HPA026110), MUC16 (CAB055172), MUC17 (HPA031634), MUC18 (HPA008848), and MUC21 (HPA052028). No information could be retrieved for MUC19, MUC20, and MUC22. IHC staining was automatically determined and eventually manually adjusted by Protein Atlas experts and was indicated as high/medium/low staining or not detected.

4.4. Statistical Analysis

Chi-square, ANOVA, and Student t-test statistical analyses were performed using R studio (https://rstudio.com/) and Graphpad Prism 6.0 software (Graphpad softwares Inc., La Jolla, CA, USA). A p-value <0.05 was considered statistically significant. The GEPIA tool also provided t-test analysis. SurvExpress and PROGgeneV2 tools provided statistical analyses of hazard ratios and overall survival. A log-rank test was used to evaluate the equality of survival curves between the high- and low-risk groups.

5. Conclusions

In the present work, we investigated available PDAC datasets combining mRNA expression and patient clinical features. We observed that PDAC is globally associated with an increase in the mRNA relative level of most membrane-bound mucins. We performed an unsupervised hierarchical clustering analysis that allowed us to identify a mucin signature, characterized by an increased MUC1/4/16/17/20/21 mRNA level that correlates with a worse outcome for patient survival, suggesting its potential usefulness as a prognostic marker. We hypothesize that a better knowledge of the mucin expression pattern could help clinicians for precision medicine.

Supplementary Materials

The following are available online at https://www.mdpi.com/2072-6694/12/11/3309/s1: Figure S1. Mucin mRNA level in human tumor (T) and adjacent nontumor (ANT) tissues; Figure S2. Mucin mRNA levels and hazard ratio in pancreatic adenocarcinoma PAAD and GSE57495 cohorts; Figure S3. Analysis of overall survival and gene mutation in PAAD-TCGA patients with alterations of mucin genes; Figure S4. Correlation analysis of relative mucin mRNA levels in independent QCMG pancreatic adenocarcinoma dataset, Figure S5. Analysis of overall survival of the #1 and #2 mucin signatures in pancreatic cancer datasets using PROGgeneV2, Table S1. Correlation of mucin gene expression in pancreatic adenocarcinoma QCMG dataset (p < 0.05). A total of 96 mRNA transcriptome samples were available. The R script is publicly available at https://github.com/NicolasJonckheere/Mucin-script, The csv files and R script are available as supplemental materials (R script and csv files for MUCINS PAAD.zip file). All data are available and are based upon public data extracted from TCGA Research Network (http://cancergenome.nih.gov/), Genome Tissue Expression (GTEX) project (http://www.GTEXportal.org/), and Gene Expression Omnibus (GEO) database (http://www.ncbi.nml.nih.gov/geo/).

Author Contributions

Conceptualization, N.J.; formal analysis, N.J., J.A., E.H.B., and V.T.; funding acquisition, N.J. and I.V.S.; investigation, N.J.; methodology, N.J. and V.T.; software, V.T.; supervision, I.V.S.; writing—original draft, N.J.; writing—review and editing, N.J., J.A., E.H.B., L.C., N.B., A.V., B.N., M.G., V.T., and I.V.S. All authors reviewed the results and approved the final version of the manuscript.

Funding

This research was funded by the “Institut National de la Santé et de la Recherche Médicale” (Inserm), “Centre National de la Recherche Scientifique” (CNRS), and “la Ligue Nationale contre le Cancer” (Comité 59, 80 NJ).

Acknowledgments

We are grateful to Michael Genin and Evgeniya Babykina (EA 2694, CERIM, Univ Lille) for their tremendous teaching regarding R studio tools and Yves Clément (UMR7592, Institut Jacques Monod) for his insightful advice.

Conflicts of Interest

The authors declare no conflict of interest. The funders had no role in the design of the study; in the collection, analyses, or interpretation of data; in the writing of the manuscript, and in the decision to publish the results.

References

  1. Rahib, L.; Smith, B.D.; Aizenberg, R.; Rosenzweig, A.B.; Fleshman, J.M.; Matrisian, L.M. Projecting cancer incidence and deaths to 2030: The unexpected burden of thyroid, liver, and pancreas cancers in the United States. Cancer Res. 2014, 74, 2913–2921. [Google Scholar] [CrossRef] [PubMed] [Green Version]
  2. Vincent, A.; Herman, J.; Schulick, R.; Hruban, R.H.; Goggins, M. Pancreatic cancer. Lancet 2011, 378, 607–620. [Google Scholar] [CrossRef]
  3. Siegel, R.L.; Miller, K.D.; Jemal, A. Cancer statistics, 2020. CA Cancer J. Clin. 2020, 70, 7–30. [Google Scholar] [CrossRef] [PubMed]
  4. Bailey, P.; Chang, D.K.; Nones, K.; Johns, A.L.; Patch, A.M.; Gingras, M.C.; Miller, D.K.; Christ, A.N.; Bruxner, T.J.; Quinn, M.C.; et al. Genomic analyses identify molecular subtypes of pancreatic cancer. Nature 2016, 531, 47–52. [Google Scholar] [CrossRef] [PubMed]
  5. Collisson, E.A.; Sadanandam, A.; Olson, P.; Gibb, W.J.; Truitt, M.; Gu, S.; Cooc, J.; Weinkle, J.; Kim, G.E.; Jakkula, L.; et al. Subtypes of pancreatic ductal adenocarcinoma and their differing responses to therapy. Nat. Med. 2011, 17, 500–503. [Google Scholar] [CrossRef]
  6. Moffitt, R.A.; Marayati, R.; Flate, E.L.; Volmar, K.E.; Loeza, S.G.; Hoadley, K.A.; Rashid, N.U.; Williams, L.A.; Eaton, S.C.; Chung, A.H.; et al. Virtual microdissection identifies distinct tumor- and stroma-specific subtypes of pancreatic ductal adenocarcinoma. Nat. Genet. 2015, 47, 1168–1178. [Google Scholar] [CrossRef]
  7. Puleo, F.; Nicolle, R.; Blum, Y.; Cros, J.; Marisa, L.; Demetter, P.; Quertinmont, E.; Svrcek, M.; Elarouci, N.; Iovanna, J.; et al. Stratification of Pancreatic Ductal Adenocarcinomas Based on Tumor and Microenvironment Features. Gastroenterology 2018, 155, 1999–2013.e1993. [Google Scholar] [CrossRef] [Green Version]
  8. Makohon-Moore, A.; Iacobuzio-Donahue, C.A. Pancreatic cancer biology and genetics from an evolutionary perspective. Nat. Rev. Cancer 2016. [Google Scholar] [CrossRef] [Green Version]
  9. TCGA-Network. Integrated Genomic Characterization of Pancreatic Ductal Adenocarcinoma. Cancer Cell 2017, 32, 185–203.e113. [Google Scholar] [CrossRef]
  10. Thornton, D.J.; Rousseau, K.; McGuckin, M.A. Structure and function of the polymeric mucins in airways mucus. Annu. Rev. Physiol. 2008, 70, 459–486. [Google Scholar] [CrossRef]
  11. Dhanisha, S.S.; Guruvayoorappan, C.; Drishya, S.; Abeesh, P. Mucins: Structural diversity, biosynthesis, its role in pathogenesis and as possible therapeutic targets. Crit. Rev. Oncol. Hematol. 2018, 122, 98–122. [Google Scholar] [CrossRef] [PubMed]
  12. Bergstrom, K.S.; Xia, L. Mucin-type O-glycans and their roles in intestinal homeostasis. Glycobiology 2013, 23, 1026–1037. [Google Scholar] [CrossRef] [PubMed]
  13. Van Seuningen, I.; Pigny, P.; Perrais, M.; Porchet, N.; Aubert, J.P. Transcriptional regulation of the 11p15 mucin genes. Towards new biological tools in human therapy, in inflammatory diseases and cancer? Front. Biosci. 2001, 6, D1216–D1234. [Google Scholar] [PubMed]
  14. Jonckheere, N.; Van Seuningen, I. The membrane-bound mucins: How large O-glycoproteins play key roles in epithelial cancers and hold promise as biological tools for gene-based and immunotherapies. Crit. Rev. Oncog. 2008, 14, 177–196. [Google Scholar] [CrossRef] [PubMed]
  15. Van Putten, J.P.M.; Strijbis, K. Transmembrane Mucins: Signaling Receptors at the Intersection of Inflammation and Cancer. J. Innate Immun. 2017, 9, 281–299. [Google Scholar] [CrossRef]
  16. Jonckheere, N.; Skrypek, N.; Van Seuningen, I. Mucins and pancreatic cancer. Cancers 2010, 2, 1794–1812. [Google Scholar] [CrossRef] [Green Version]
  17. Kaur, S.; Kumar, S.; Momi, N.; Sasson, A.R.; Batra, S.K. Mucins in pancreatic cancer and its microenvironment. Nat. Rev. Gastroenterol. Hepatol. 2013, 10, 607–620. [Google Scholar] [CrossRef] [Green Version]
  18. Das, S.; Rachagani, S.; Torres-Gonzalez, M.P.; Lakshmanan, I.; Majhi, P.D.; Smith, L.M.; Wagner, K.U.; Batra, S.K. Carboxyl-terminal domain of MUC16 imparts tumorigenic and metastatic functions through nuclear translocation of JAK2 to pancreatic cancer cells. Oncotarget 2015, 6, 5772–5787. [Google Scholar] [CrossRef] [Green Version]
  19. Muniyan, S.; Haridas, D.; Chugh, S.; Rachagani, S.; Lakshmanan, I.; Gupta, S.; Seshacharyulu, P.; Smith, L.M.; Ponnusamy, M.P.; Batra, S.K. MUC16 contributes to the metastasis of pancreatic ductal adenocarcinoma through focal adhesion mediated signaling mechanism. Genes Cancer 2016, 7, 110–124. [Google Scholar] [CrossRef] [Green Version]
  20. Streppel, M.M.; Vincent, A.; Mukherjee, R.; Campbell, N.R.; Chen, S.H.; Konstantopoulos, K.; Goggins, M.G.; Van Seuningen, I.; Maitra, A.; Montgomery, E.A. Mucin 16 (cancer antigen 125) expression in human tissues and cell lines and correlation with clinical outcome in adenocarcinomas of the pancreas, esophagus, stomach, and colon. Hum. Pathol. 2012, 43, 1755–1763. [Google Scholar] [CrossRef] [Green Version]
  21. O’Brien, D.P.; Sandanayake, N.S.; Jenkinson, C.; Gentry-Maharaj, A.; Apostolidou, S.; Fourkala, E.O.; Camuzeaux, S.; Blyuss, O.; Gunu, R.; Dawnay, A.; et al. Serum CA19-9 is significantly upregulated up to 2 years before diagnosis with pancreatic cancer: Implications for early disease detection. Clin. Cancer Res. 2015, 21, 622–631. [Google Scholar] [CrossRef] [PubMed] [Green Version]
  22. Hogendorf, P.; Skulimowski, A.; Durczynski, A.; Kumor, A.; Poznanska, G.; Olesna, A.; Rut, J.; Strzelczyk, J. A Panel of CA19-9, Ca125, and Ca15-3 as the Enhanced Test for the Differential Diagnosis of the Pancreatic Lesion. Dis. Markers 2017, 2017, 8629712. [Google Scholar] [CrossRef] [PubMed]
  23. Kaur, S.; Smith, L.M.; Patel, A.; Menning, M.; Watley, D.C.; Malik, S.S.; Krishn, S.R.; Mallya, K.; Aithal, A.; Sasson, A.R.; et al. A Combination of MUC5AC and CA19-9 Improves the Diagnosis of Pancreatic Cancer: A Multicenter Study. Am. J. Gastroenterol. 2017, 112, 172–183. [Google Scholar] [CrossRef] [PubMed] [Green Version]
  24. Jonckheere, N.; Van Seuningen, I. Integrative analysis of the cancer genome atlas and cancer cell lines encyclopedia large-scale genomic databases: MUC4/MUC16/MUC20 signature is associated with poor survival in human carcinomas. J. Transl. Med. 2018, 16, 259. [Google Scholar] [CrossRef] [PubMed]
  25. Kinoshita, M.; Nakamura, T.; Ihara, M.; Haraguchi, T.; Hiraoka, Y.; Tashiro, K.; Noda, M. Identification of human endomucin-1 and -2 as membrane-bound O-sialoglycoproteins with anti-adhesive activity. FEBS Lett. 2001, 499, 121–126. [Google Scholar] [CrossRef] [Green Version]
  26. Johnson, J.P.; Rummel, M.M.; Rothbacher, U.; Sers, C. MUC18: A cell adhesion molecule with a potential role in tumor growth and tumor cell dissemination. Curr. Top. Microbiol. Immunol. 1996, 213, 95–105. [Google Scholar] [PubMed]
  27. Dai, W.; Liu, J.; Liu, B.; Li, Q.; Sang, Q.; Li, Y.Y. Systematical Analysis of the Cancer Genome Atlas Database Reveals EMCN/MUC15 Combination as a Prognostic Signature for Gastric Cancer. Front. Mol. Biosci. 2020, 7, 19. [Google Scholar] [CrossRef] [Green Version]
  28. Zheng, B.; Ohuchida, K.; Chijiiwa, Y.; Zhao, M.; Mizuuchi, Y.; Cui, L.; Horioka, K.; Ohtsuka, T.; Mizumoto, K.; Oda, Y.; et al. CD146 attenuation in cancer-associated fibroblasts promotes pancreatic cancer progression. Mol. Carcinog. 2016, 55, 1560–1572. [Google Scholar] [CrossRef]
  29. Jonckheere, N.; Skrypek, N.; Merlin, J.; Dessein, A.F.; Dumont, P.; Leteurtre, E.; Harris, A.; Desseyn, J.L.; Susini, C.; Frenois, F.; et al. The mucin MUC4 and its membrane partner ErbB2 regulate biological properties of human CAPAN-2 pancreatic cancer cells via different signalling pathways. PLoS ONE 2012, 7, e32232. [Google Scholar] [CrossRef] [Green Version]
  30. Chaturvedi, P.; Singh, A.P.; Moniaux, N.; Senapati, S.; Chakraborty, S.; Meza, J.L.; Batra, S.K. MUC4 mucin potentiates pancreatic tumor cell proliferation, survival, and invasive properties and interferes with its interaction to extracellular matrix proteins. Mol. Cancer Res. 2007, 5, 309–320. [Google Scholar] [CrossRef] [Green Version]
  31. Roy, L.D.; Sahraei, M.; Subramani, D.B.; Besmer, D.; Nath, S.; Tinder, T.L.; Bajaj, E.; Shanmugam, K.; Lee, Y.Y.; Hwang, S.I.; et al. MUC1 enhances invasiveness of pancreatic cancer cells by inducing epithelial to mesenchymal transition. Oncogene 2011, 30, 1449–1459. [Google Scholar] [CrossRef] [PubMed] [Green Version]
  32. Saitou, M.; Goto, M.; Horinouchi, M.; Tamada, S.; Nagata, K.; Hamada, T.; Osako, M.; Takao, S.; Batra, S.K.; Aikou, T.; et al. MUC4 expression is a novel prognostic factor in patients with invasive ductal carcinoma of the pancreas. J. Clin. Pathol. 2005, 58, 845–852. [Google Scholar] [CrossRef]
  33. Yokoyama, S.; Higashi, M.; Kitamoto, S.; Oeldorf, M.; Knippschild, U.; Kornmann, M.; Maemura, K.; Kurahara, H.; Wiest, E.; Hamada, T.; et al. Aberrant methylation of MUC1 and MUC4 promoters are potential prognostic biomarkers for pancreatic ductal adenocarcinomas. Oncotarget 2016, 7, 42553–42565. [Google Scholar] [CrossRef] [PubMed] [Green Version]
  34. Yonezawa, S.; Higashi, M.; Yamada, N.; Yokoyama, S.; Goto, M. Significance of mucin expression in pancreatobiliary neoplasms. J. Hepatobiliary Pancreat. Sci. 2010, 17, 108–124. [Google Scholar] [CrossRef] [PubMed]
  35. Chen, S.T.; Kuo, T.C.; Liao, Y.Y.; Lin, M.C.; Tien, Y.W.; Huang, M.C. Silencing of MUC20 suppresses the malignant character of pancreatic ductal adenocarcinoma cells through inhibition of the HGF/MET pathway. Oncogene 2018, 37, 6041–6053. [Google Scholar] [CrossRef] [PubMed] [Green Version]
  36. Hirono, S.; Yamaue, H.; Hoshikawa, Y.; Ina, S.; Tani, M.; Kawai, M.; Ushijima, M.; Matsuura, M.; Saiki, Y.; Saiura, A.; et al. Molecular markers associated with lymph node metastasis in pancreatic ductal adenocarcinoma by genome-wide expression profiling. Cancer Sci. 2010, 101, 259–266. [Google Scholar] [CrossRef]
  37. Itoh, Y.; Kamata-Sakurai, M.; Denda-Nagai, K.; Nagai, S.; Tsuiji, M.; Ishii-Schrade, K.; Okada, K.; Goto, A.; Fukayama, M.; Irimura, T. Identification and expression of human epiglycanin/MUC21: A novel transmembrane mucin. Glycobiology 2008, 18, 74–83. [Google Scholar] [CrossRef]
  38. Bafna, S.; Kaur, S.; Momi, N.; Batra, S.K. Pancreatic cancer cells resistance to gemcitabine: The role of MUC4 mucin. Br. J. Cancer 2009, 101, 1155–1161. [Google Scholar] [CrossRef]
  39. Nath, S.; Daneshvar, K.; Roy, L.D.; Grover, P.; Kidiyoor, A.; Mosley, L.; Sahraei, M.; Mukherjee, P. MUC1 induces drug resistance in pancreatic cancer cells via upregulation of multidrug resistance genes. Oncogenesis 2013, 2, e51. [Google Scholar] [CrossRef] [Green Version]
  40. Skrypek, N.; Duchene, B.; Hebbar, M.; Leteurtre, E.; van Seuningen, I.; Jonckheere, N. The MUC4 mucin mediates gemcitabine resistance of human pancreatic cancer cells via the Concentrative Nucleoside Transporter family. Oncogene 2013, 32, 1714–1723. [Google Scholar] [CrossRef] [Green Version]
  41. Balachandran, V.P.; Luksza, M.; Zhao, J.N.; Makarov, V.; Moral, J.A.; Remark, R.; Herbst, B.; Askan, G.; Bhanot, U.; Senbabaoglu, Y.; et al. Identification of unique neoantigen qualities in long-term survivors of pancreatic cancer. Nature 2017, 551, 512–516. [Google Scholar] [CrossRef] [PubMed]
  42. Wu, Y.; Wei, J.; Ming, Y.; Chen, Z.; Yu, J.; Mao, R.; Chen, H.; Zhou, G.; Fan, Y. Orchestrating a biomarker panel with lncRNAs and mRNAs for predicting survival in pancreatic ductal adenocarcinoma. J. Cell Biochem. 2018, 119, 7696–7706. [Google Scholar] [CrossRef] [PubMed]
  43. Hui, B.; Ji, H.; Xu, Y.; Wang, J.; Ma, Z.; Zhang, C.; Wang, K.; Zhou, Y. RREB1-induced upregulation of the lncRNA AGAP2-AS1 regulates the proliferation and migration of pancreatic cancer partly through suppressing ANKRD1 and ANGPTL4. Cell Death Dis. 2019, 10, 207. [Google Scholar] [CrossRef] [Green Version]
  44. McWilliams, R.R.; Wieben, E.D.; Rabe, K.G.; Pedersen, K.S.; Wu, Y.; Sicotte, H.; Petersen, G.M. Prevalence of CDKN2A mutations in pancreatic cancer patients: Implications for genetic counseling. Eur. J. Hum. Genet. 2011, 19, 472–478. [Google Scholar] [CrossRef] [PubMed] [Green Version]
  45. Ban, S.; Naitoh, Y.; Mino-Kenudson, M.; Sakurai, T.; Kuroda, M.; Koyama, I.; Lauwers, G.Y.; Shimizu, M. Intraductal papillary mucinous neoplasm (IPMN) of the pancreas: Its histopathologic difference between 2 major types. Am. J. Surg. Pathol. 2006, 30, 1561–1569. [Google Scholar] [CrossRef]
  46. Krishn, S.R.; Ganguly, K.; Kaur, S.; Batra, S.K. Ramifications of secreted mucin MUC5AC in malignant journey: A holistic view. Carcinogenesis 2018, 39, 633–651. [Google Scholar] [CrossRef]
  47. Lee, J.; Yun, J.H.; Jeong, D.G.; Kim, J.H. DUSP28 links regulation of Mucin 5B and Mucin 16 to migration and survival of AsPC-1 human pancreatic cancer cells. Tumour Biol. 2016, 37, 12193–12202. [Google Scholar] [CrossRef]
  48. Yokoyama, S.; Hamada, T.; Higashi, M.; Matsuo, K.; Maemura, K.; Kurahara, H.; Horinouchi, M.; Hiraki, T.; Sugimoto, T.; Akahane, T.; et al. Predicted Prognosis of Patients with Pancreatic Cancer by Machine Learning. Clin. Cancer Res. 2020, 26, 2411–2421. [Google Scholar] [CrossRef] [Green Version]
  49. Andrianifahanana, M.; Moniaux, N.; Batra, S.K. Regulation of mucin expression: Mechanistic aspects and implications for cancer and inflammatory diseases. Biochim. Biophys. Acta 2006, 1765, 189–222. [Google Scholar] [CrossRef]
  50. Van Seuningen, I.; Vincent, A. Mucins: A new family of epigenetic biomarkers in epithelial cancers. Expert Opin. Med. Diagn. 2009, 3, 411–427. [Google Scholar] [CrossRef]
  51. Liang, C.; Qin, Y.; Zhang, B.; Ji, S.; Shi, S.; Xu, W.; Liu, J.; Xiang, J.; Liang, D.; Hu, Q.; et al. Oncogenic KRAS Targets MUC16/CA125 in Pancreatic Ductal Adenocarcinoma. Mol. Cancer Res. 2017, 15, 201–212. [Google Scholar] [CrossRef] [PubMed] [Green Version]
  52. Vasseur, R.; Skrypek, N.; Duchene, B.; Renaud, F.; Martinez-Maqueda, D.; Vincent, A.; Porchet, N.; Van Seuningen, I.; Jonckheere, N. The mucin MUC4 is a transcriptional and post-transcriptional target of K-ras oncogene in pancreatic cancer. Implication of MAPK/AP-1, NF-kappaB and RalB signaling pathways. Biochim. Biophys. Acta 2015, 1849, 1375–1384. [Google Scholar] [CrossRef] [PubMed]
  53. Coppin, L.; Vincent, A.; Frenois, F.; Duchene, B.; Lahdaoui, F.; Stechly, L.; Renaud, F.; Villenet, C.; Van Seuningen, I.; Leteurtre, E.; et al. Galectin-3 is a non-classic RNA binding protein that stabilizes the mucin MUC4 mRNA in the cytoplasm of cancer cells. Sci. Rep. 2017, 7, 43927. [Google Scholar] [CrossRef] [PubMed] [Green Version]
  54. Tang, Z.; Li, C.; Kang, B.; Gao, G.; Zhang, Z. GEPIA: A web server for cancer and normal gene expression profiling and interactive analyses. Nucleic Acids Res. 2017, 45, W98–W102. [Google Scholar] [CrossRef] [Green Version]
  55. Cerami, E.; Gao, J.; Dogrusoz, U.; Gross, B.E.; Sumer, S.O.; Aksoy, B.A.; Jacobsen, A.; Byrne, C.J.; Heuer, M.L.; Larsson, E.; et al. The cBio cancer genomics portal: An open platform for exploring multidimensional cancer genomics data. Cancer Discov. 2012, 2, 401–404. [Google Scholar] [CrossRef] [PubMed] [Green Version]
  56. Gao, J.; Aksoy, B.A.; Dogrusoz, U.; Dresdner, G.; Gross, B.; Sumer, S.O.; Sun, Y.; Jacobsen, A.; Sinha, R.; Larsson, E.; et al. Integrative analysis of complex cancer genomics and clinical profiles using the cBioPortal. Sci. Signal 2013, 6, pl1. [Google Scholar] [CrossRef] [Green Version]
  57. Aguirre-Gamboa, R.; Gomez-Rueda, H.; Martinez-Ledesma, E.; Martinez-Torteya, A.; Chacolla-Huaringa, R.; Rodriguez-Barrientos, A.; Tamez-Pena, J.G.; Trevino, V. SurvExpress: An online biomarker validation tool and database for cancer gene expression data using survival analysis. PLoS ONE 2013, 8, e74250. [Google Scholar] [CrossRef] [Green Version]
  58. Goswami, C.P.; Nakshatri, H. PROGgene: Gene expression based survival analysis web application for multiple cancers. J. Clin. Bioinform. 2013, 3, 22. [Google Scholar] [CrossRef] [Green Version]
  59. Chen, D.T.; Davis-Yadley, A.H.; Huang, P.Y.; Husain, K.; Centeno, B.A.; Permuth-Wey, J.; Pimiento, J.M.; Malafa, M. Prognostic Fifteen-Gene Signature for Early Stage Pancreatic Ductal Adenocarcinoma. PLoS ONE 2015, 10, e0133562. [Google Scholar] [CrossRef]
Figure 1. Relative mucin messenger RNA (mRNA) levels in pancreatic adenocarcinoma and normal pancreas tissues. The whisker boxplots for the mRNA of membrane-bound mucins (MUC1, MUC3, MUC4, MUC12, MUC13, MUC15, MUC16, MUC17, MUC20, MUC21, and MUC22) (A), secreted mucins (MUC2, MUC5AC, MUC5B, MUC6, MUC7, MUC8, MUC9/OVGP1, and MUC19) (B), or atypical mucins (MUC14/EMCN, MUC18/MCAM) (C) were generated using GEPIA in The Cancer Genome Atlas (TCGA) and Genome Tissue Expression (GTEX) samples. Mucin mRNA relative levels are expressed as log2 transcripts per million bases (TPM). Statistical analyses were performed using an unpaired t-test (* = p < 0.05).
Cancers 12 03309 g001
Figure 2. Hazard ratio in high and low expression levels of mucin genes in pancreatic adenocarcinoma (PAAD) cohort. Hazard ratio (HR) was calculated in population designated as high risk and low risk (higher value of mucin gene of interest for higher risk) on the basis of individual mucin expression by the SurvExpress optimized algorithm in PAAD from TCGA datasets. Statistically significant hazard ratios (p < 0.05) are represented in red. The p-value is indicated on the graph (***, p < 0.001; **, p < 0.01; *, p < 0.05).
Cancers 12 03309 g002
Figure 3. cBioPortal oncoprint of mucin genes in pancreatic adenocarcinoma PAAD cohort of the TCGA dataset. Mucin genes data were extracted using cBioPortal to illustrate every mucin gene alteration (gene amplification, deletion, mutations, and mRNA high levels) for each patient of the PAAD cohort. The heatmap illustrates the mRNA level for each patient.
Cancers 12 03309 g003
Figure 4. Correlation analysis of relative mucin mRNA levels in pancreatic adenocarcinoma (PAAD) cohort of the TCGA. (A) Correlation Pearson r values were calculated for each mucin mRNA combination from PAAD cohort. (B) Principal component analysis (PCA) of mucin mRNA relative expression in PAAD cohort. Positively correlated variables are grouped together, whereas negatively correlated variables are on opposite sides. A 90° angle, formed by two arrows, illustrates independency of variables. Cos2 (square cosine, squared coordinates) indicates the quality of representation of the variables on factor map.
Cancers 12 03309 g004
Figure 5. Unsupervised hierarchical clustering analysis of PDAC patients according to their relative mucin mRNA expression. (A) Mucin-based dendrogram that displays clustering analysis between patients. The dendrogram shows four hierarchical clusters according to the expression pattern of mucins. (B) Boxplot of mucin expression in major clusters #1 and #2. Statistical analyses were performed using an unpaired t-test (***, p < 0.001; **, p < 0.01). (C) Kaplan–Meier curves of clusters #1 and #2.
Cancers 12 03309 g005
Figure 6. The mucin-based stratification is independent of clinical features and is associated with the mutation count in PDAC patients. (A) Percentage-staked bar plot of sex distribution in PAAD-TCGA cohort of clusters #1 and #2. Boxplots showing age of diagnosis (B) and mutation counts (C) for clusters #1 and #2 (***, p < 0.001). Percentage-staked bar plot showing tumor stage (T1/T2/T3/T4/TX/NA) (D), lymph node status (N0/N1/N1B/NX/NA) (E), and differentiation grades (G1/G2/G3/G4/GX) (F) in clusters #1 and #2.
Cancers 12 03309 g006
Figure 7. Analysis of overall survival of the #1 and #2 mucin signatures in pancreatic cancer datasets using SurvExpress. (A) Hazard ratio according to signature #1 (MUC1, MUC4, MUC16, MUC17, MUC20, and MUC21) and #2 (MUC14/EMCN, MUC15, and MUC18) high and low expression in the pancreatic adenocarcinoma PAAD cohort. (B) PAAD patients were stratified using a gene signature combining MUC1, MUC4, MUC16, MUC17, MUC20, and MUC21. Kaplan–Meier curves were analyzed using the optimized SurvExpress Maximize algorithm. The number of analyzed patients across time (days) is indicated below the horizontal axis for both conditions. (C) PAAD patients were stratified using a gene signature combining MUC15, MUC14/EMCN, and MUC18/MCAM using the Maximize algorithm.
Cancers 12 03309 g007
Figure 8. Detection of mucin expression by immunochemistry in human pancreatic cancer human tissue. (A) Histogram of mucin expression in PDAC samples from Protein Atlas (www.proteinatlas.org/). In total, 11–12 samples were analyzed for MUC1, MUC2, MUC3A, MUC4, MUC5AC, MUC5B, MUC6, MUC7, MUC9, MUC12, MUC13, MUC14, MUC15, MUC16, MUC17, MUC18, and MUC21. Immunohistochemistry (IHC) staining was evaluated as high/medium/low staining or not detected. No information could be retrieved for MUC19, MUC20, and MUC22. (B) Representative IHC stainings for MUC1, MUC4, MUC16, MUC17, and MUC21 (signature #2) and MUC14/EMCN, MUC15, and MUC18 (signature #1). All mucins showed a membrane and/or cytoplasmic staining in tumor cells except MUC18/EMCN, which was detected in the stroma.
Cancers 12 03309 g008
Table 1. Correlation of Mucin gene expression in PAAD-TCGA (p < 0.05).
Positive Correlation
Gene AGene BPearson rp-Value
MUC12MUC20.85<0.00001
MUC12MUC130.73<0.00001
MUC13MUC20.72<0.00001
MUC1MUC200.50<0.00001
MUC13MUC5B0.50<0.00001
MUC12MUC5B0.49<0.00001
MUC6MUC70.49<0.00001
MUC5BMUC70.48<0.00001
EMCNMCAM0.44<0.00001
MUC5BMUC60.43<0.00001
MUC2MUC5B0.42<0.00001
MUC16MUC210.40<0.00001
MUC4MUC160.38<0.00001
MUC20MUC210.37<0.00001
MUC1MUC170.320.00003
MUC4MUC210.290.00016
MUC15EMCN0.240.00170
MUC4MUC200.240.00202
MUC13MUC170.210.00579
MUC1MUC40.210.00623
MUC1MUC210.190.01578
MUC1MUC130.180.01768
MUC17MUC200.180.02016
MUC16MUC200.170.02416
MUC13MUC200.170.02598
MUC6EMCN0.170.02798
Negative correlation
MUC1EMCN−0.46<0.00001
MUC1MCAM−0.310.00004
MUC20EMCN−0.290.00018
MUC4EMCN−0.280.00029
MUC13EMCN−0.250.00087
MUC16EMCN−0.230.00272
OVGP1MUC15−0.190.01240
MUC13MCAM−0.180.01819
MUC2MCAM−0.180.01860
MUC20MCAM−0.180.01888
MUC17EMCN−0.170.02811
Publisher’s Note: MDPI stays neutral with regard to jurisdictional claims in published maps and institutional affiliations.

