Interleukin4Rα (IL4Rα) and IL13Rα1 Are Associated with the Progress of Renal Cell Carcinoma through Janus Kinase 2 (JAK2)/Forkhead Box O3 (FOXO3) Pathways


 , and
, and
Abstract
:1. Introduction
2. Results
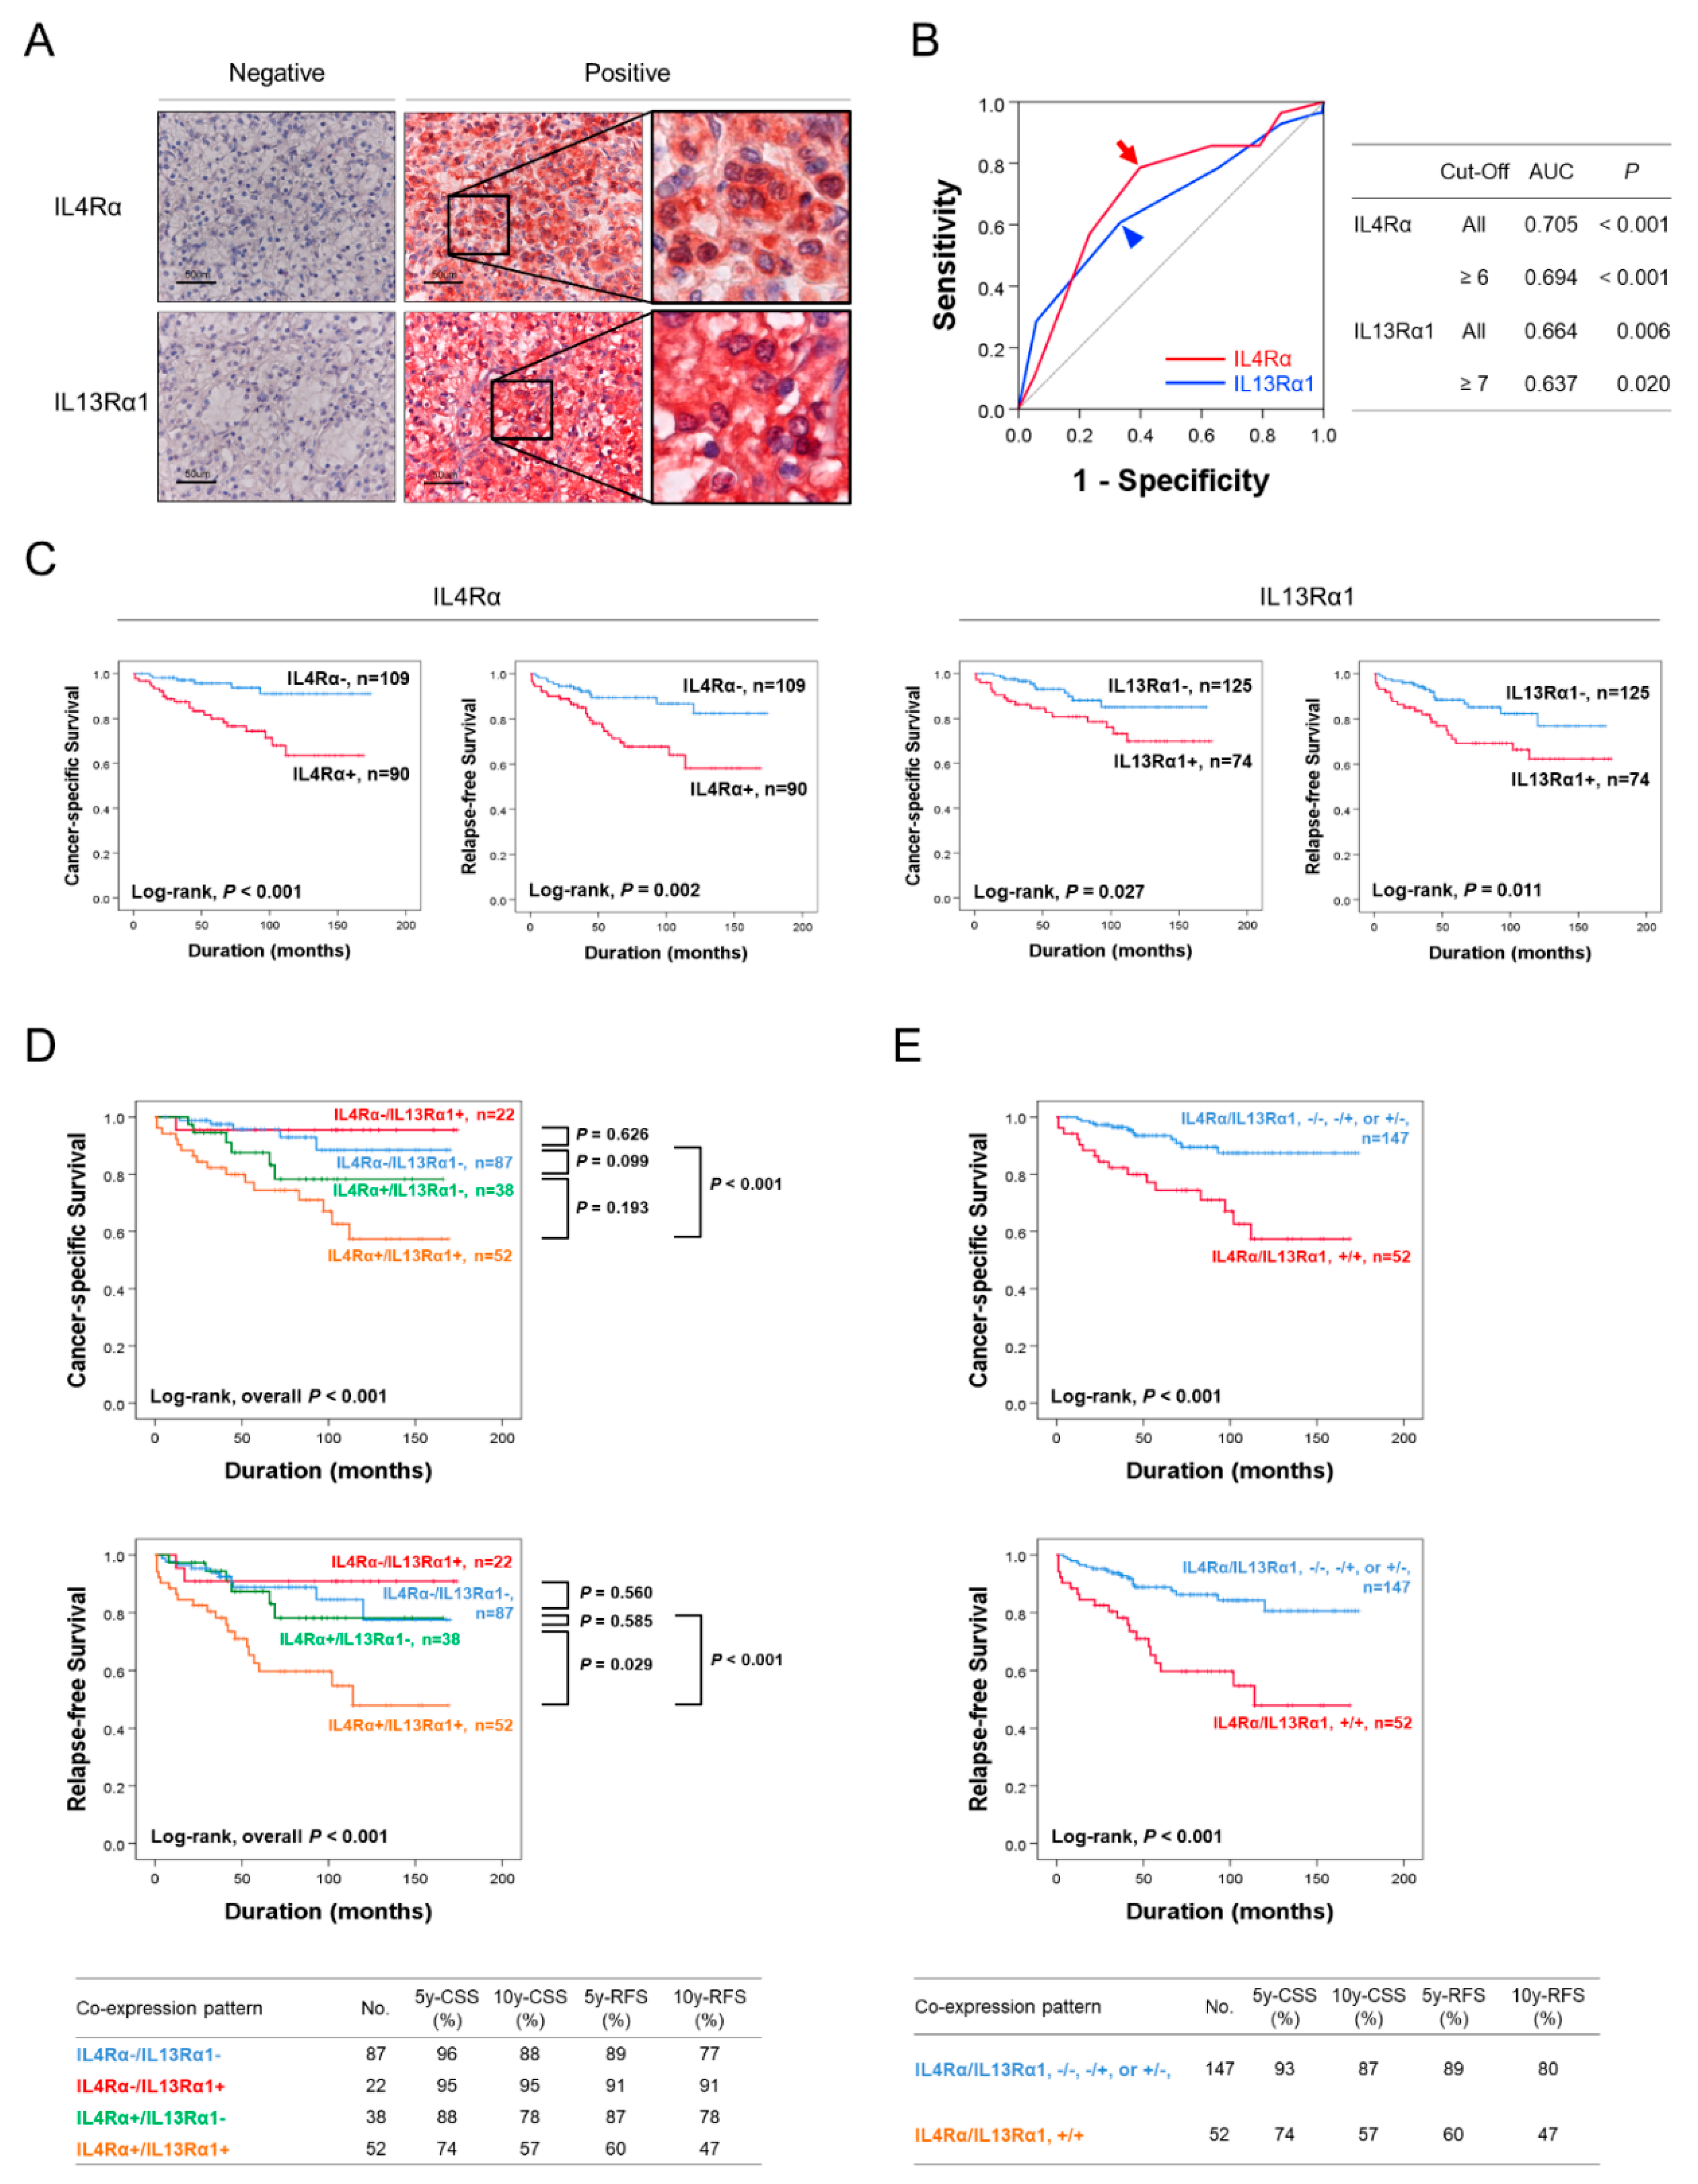
2.1. Immunohistochemical Expression of IL4Rα and IL13Rα1 Are Associated with Poor Prognosis of CCRCC Patients
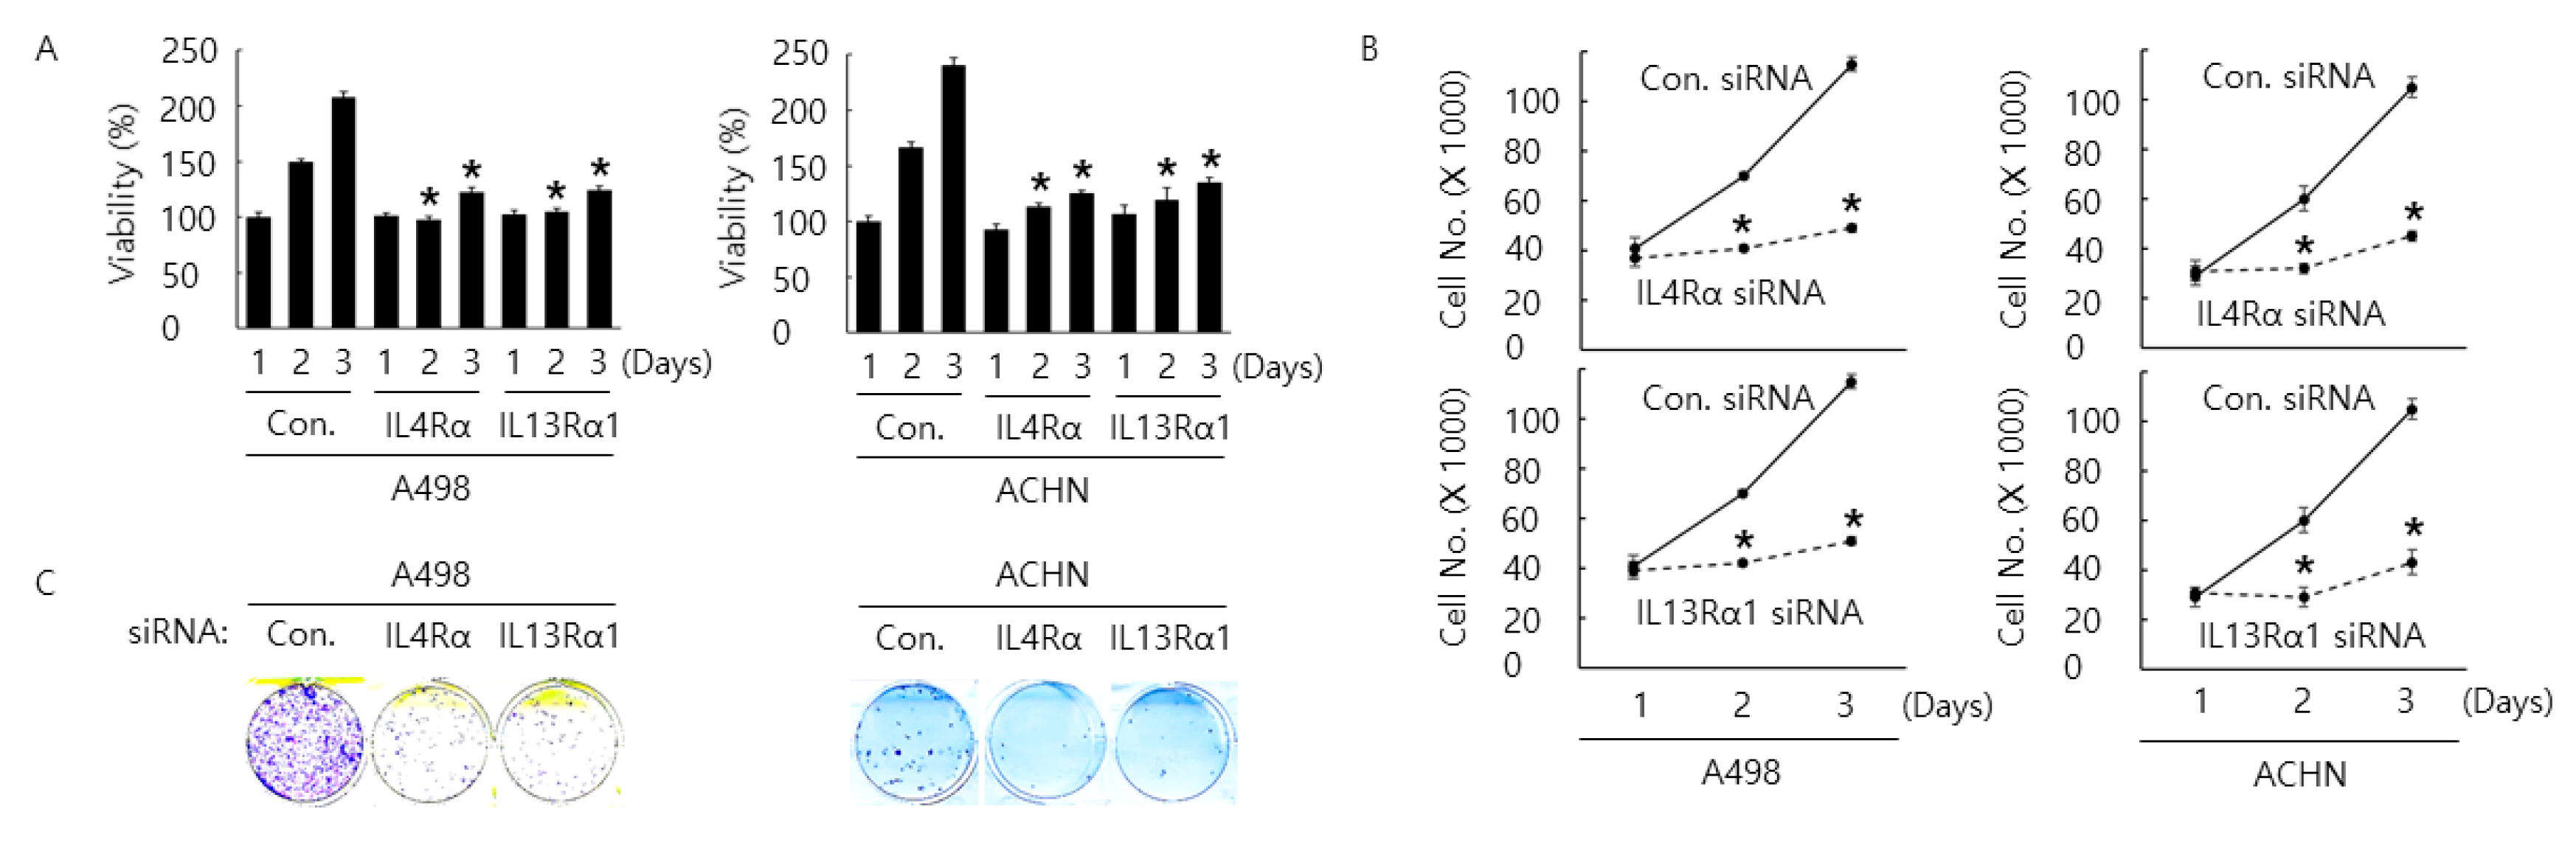
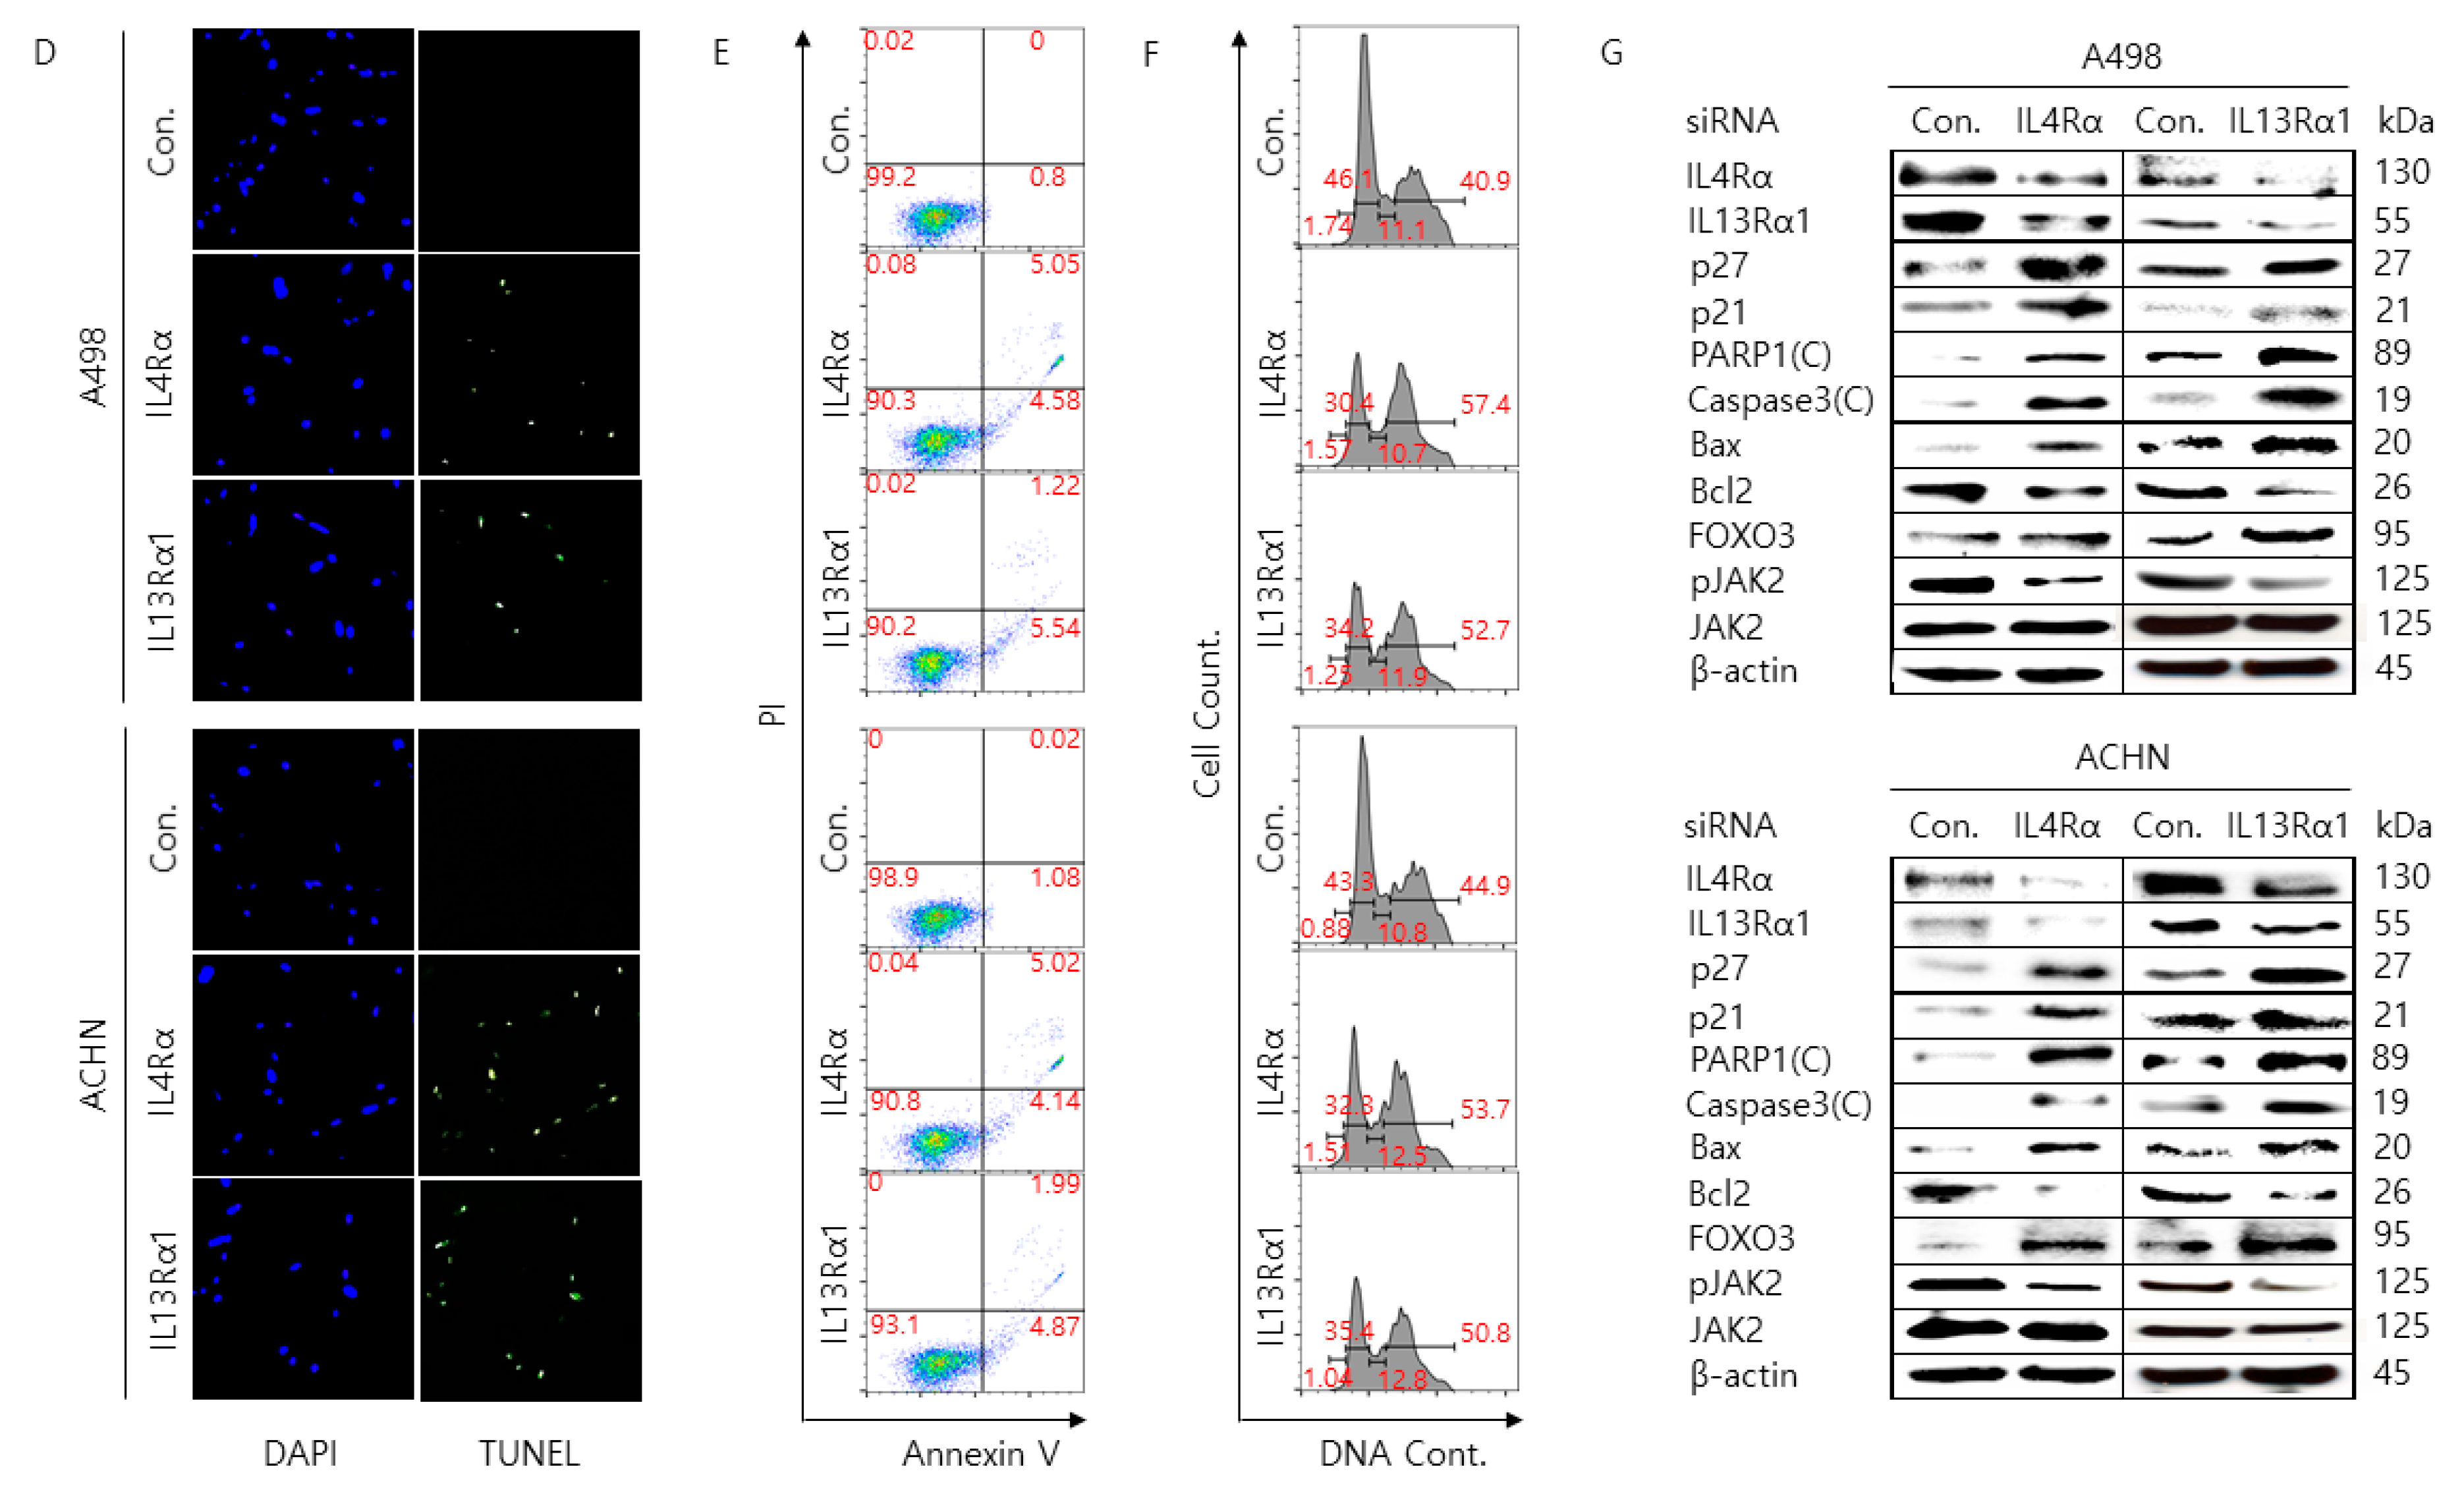
2.2. Silencing of IL4Rα or IL13Rα1 Decreases Cell Proliferation Rate and Increases Cell Cycle Arrest and Apoptosis in A498 and ACHN Cells
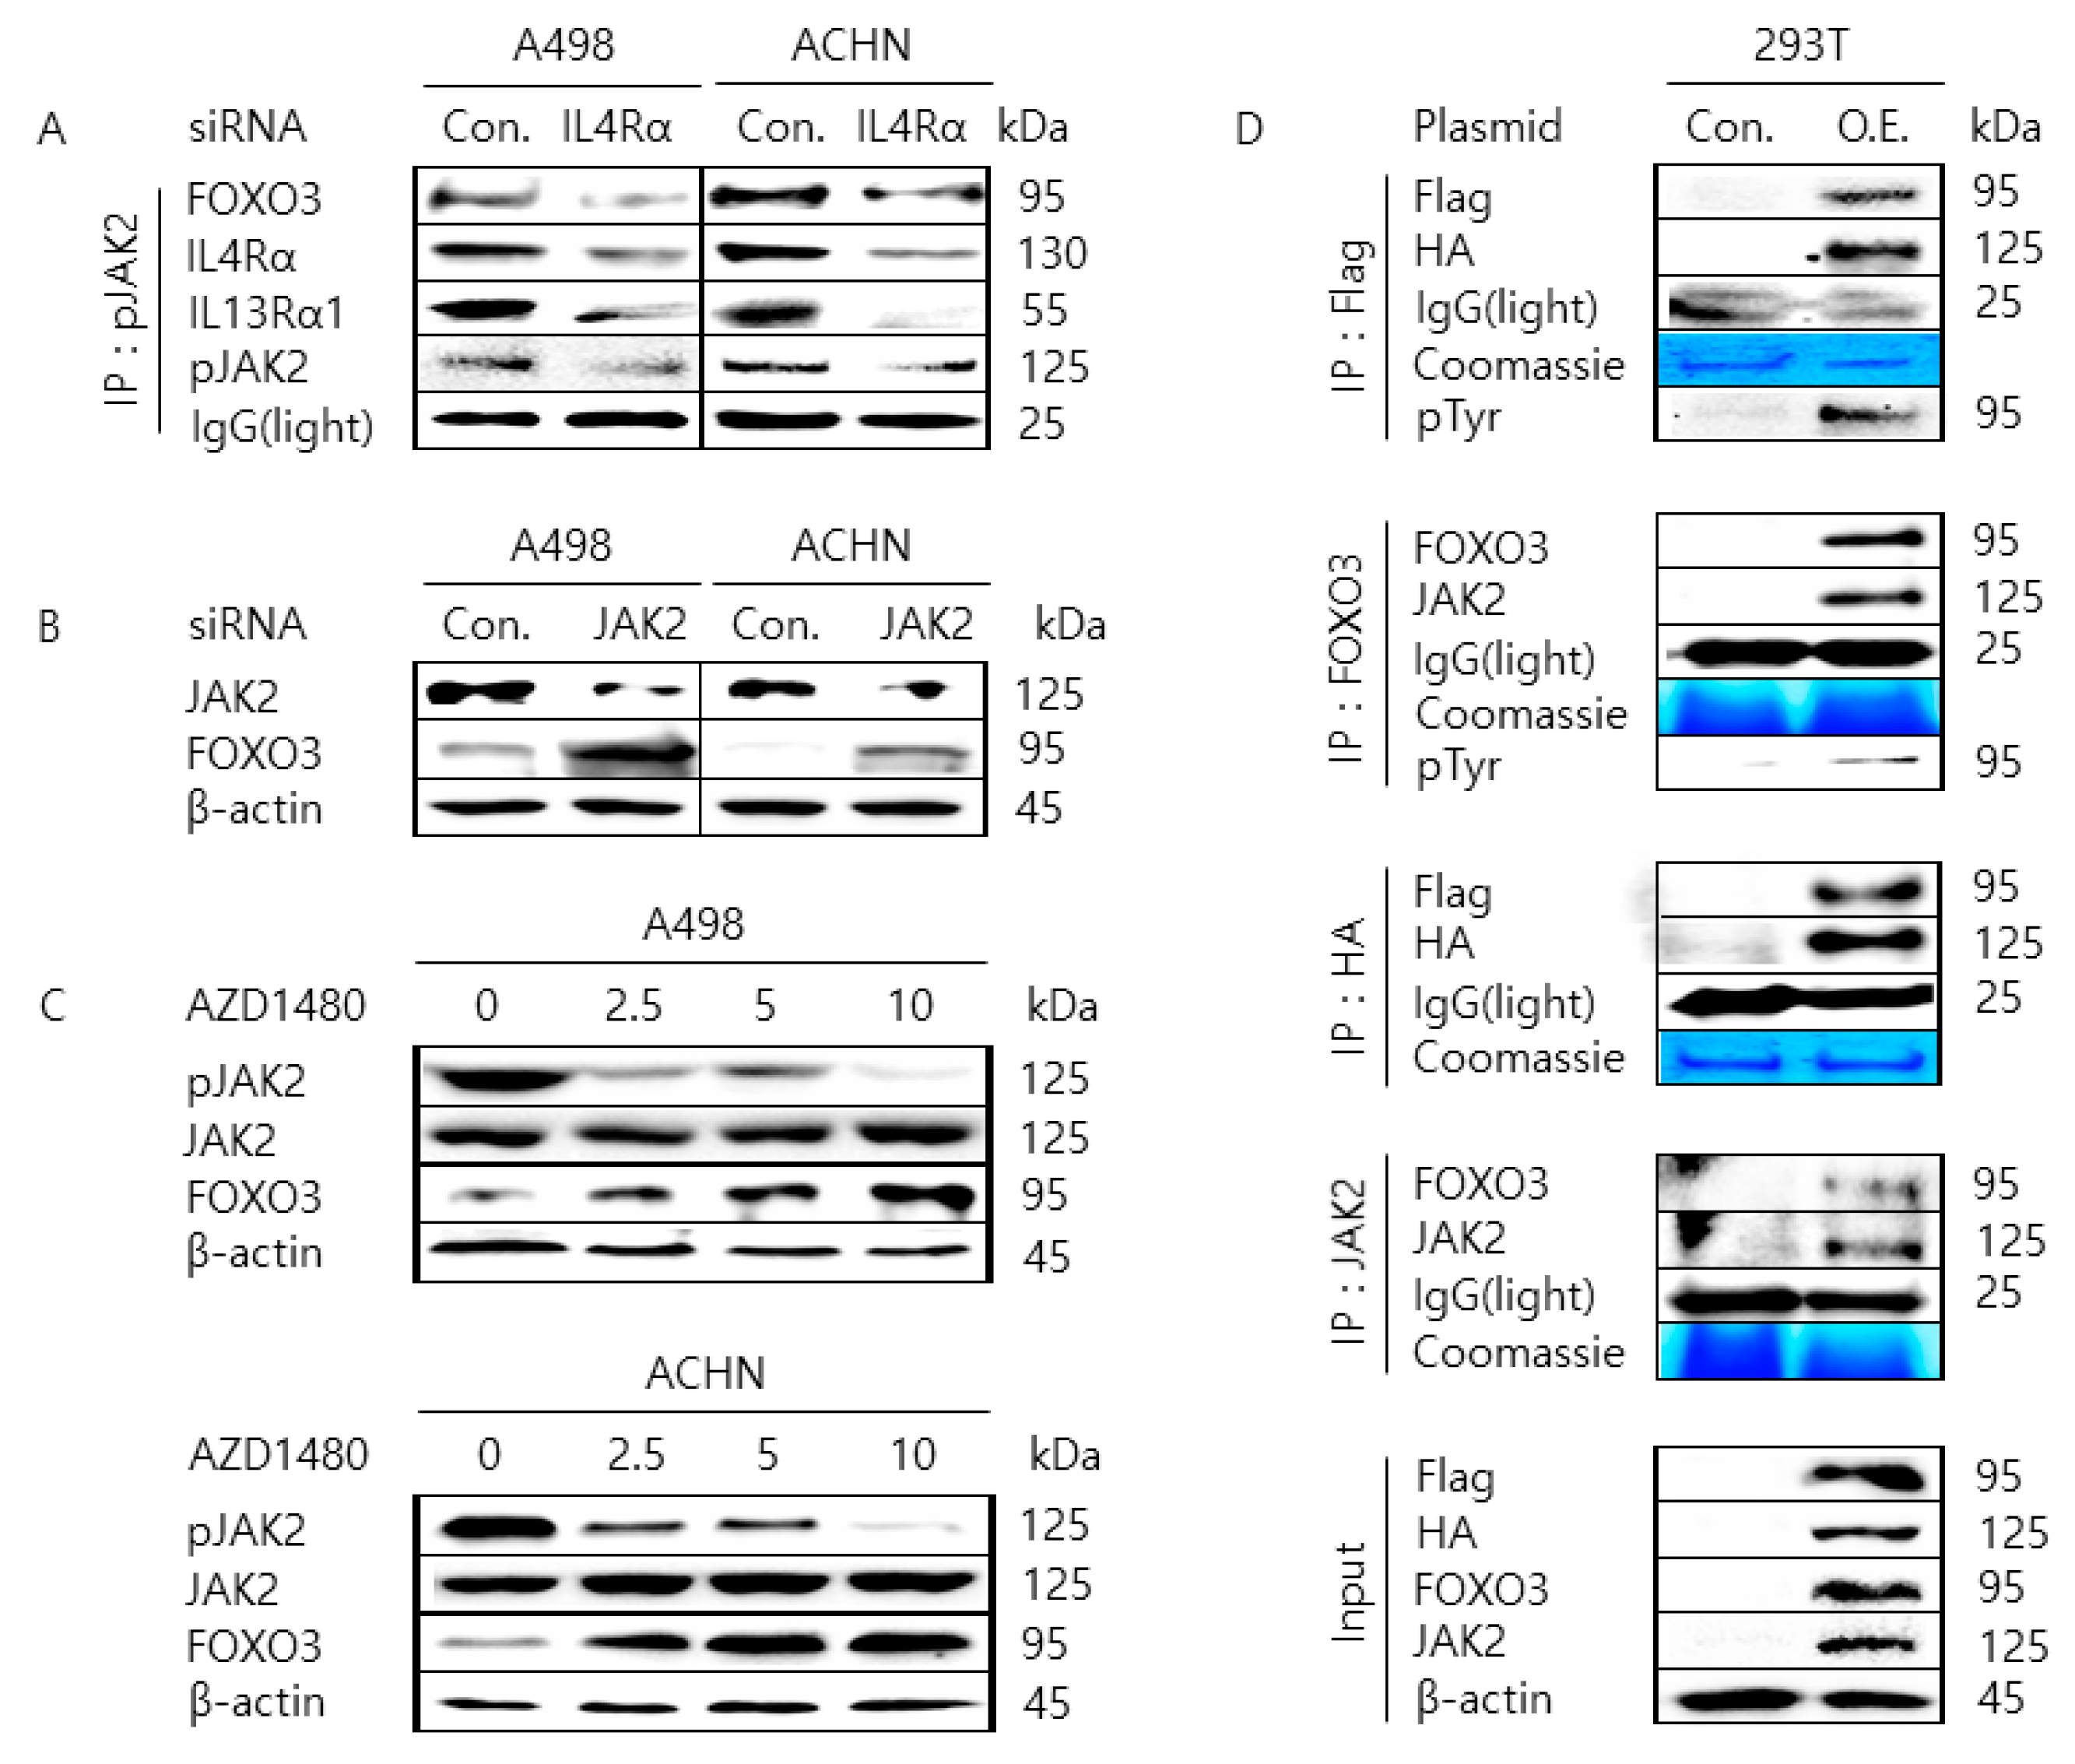
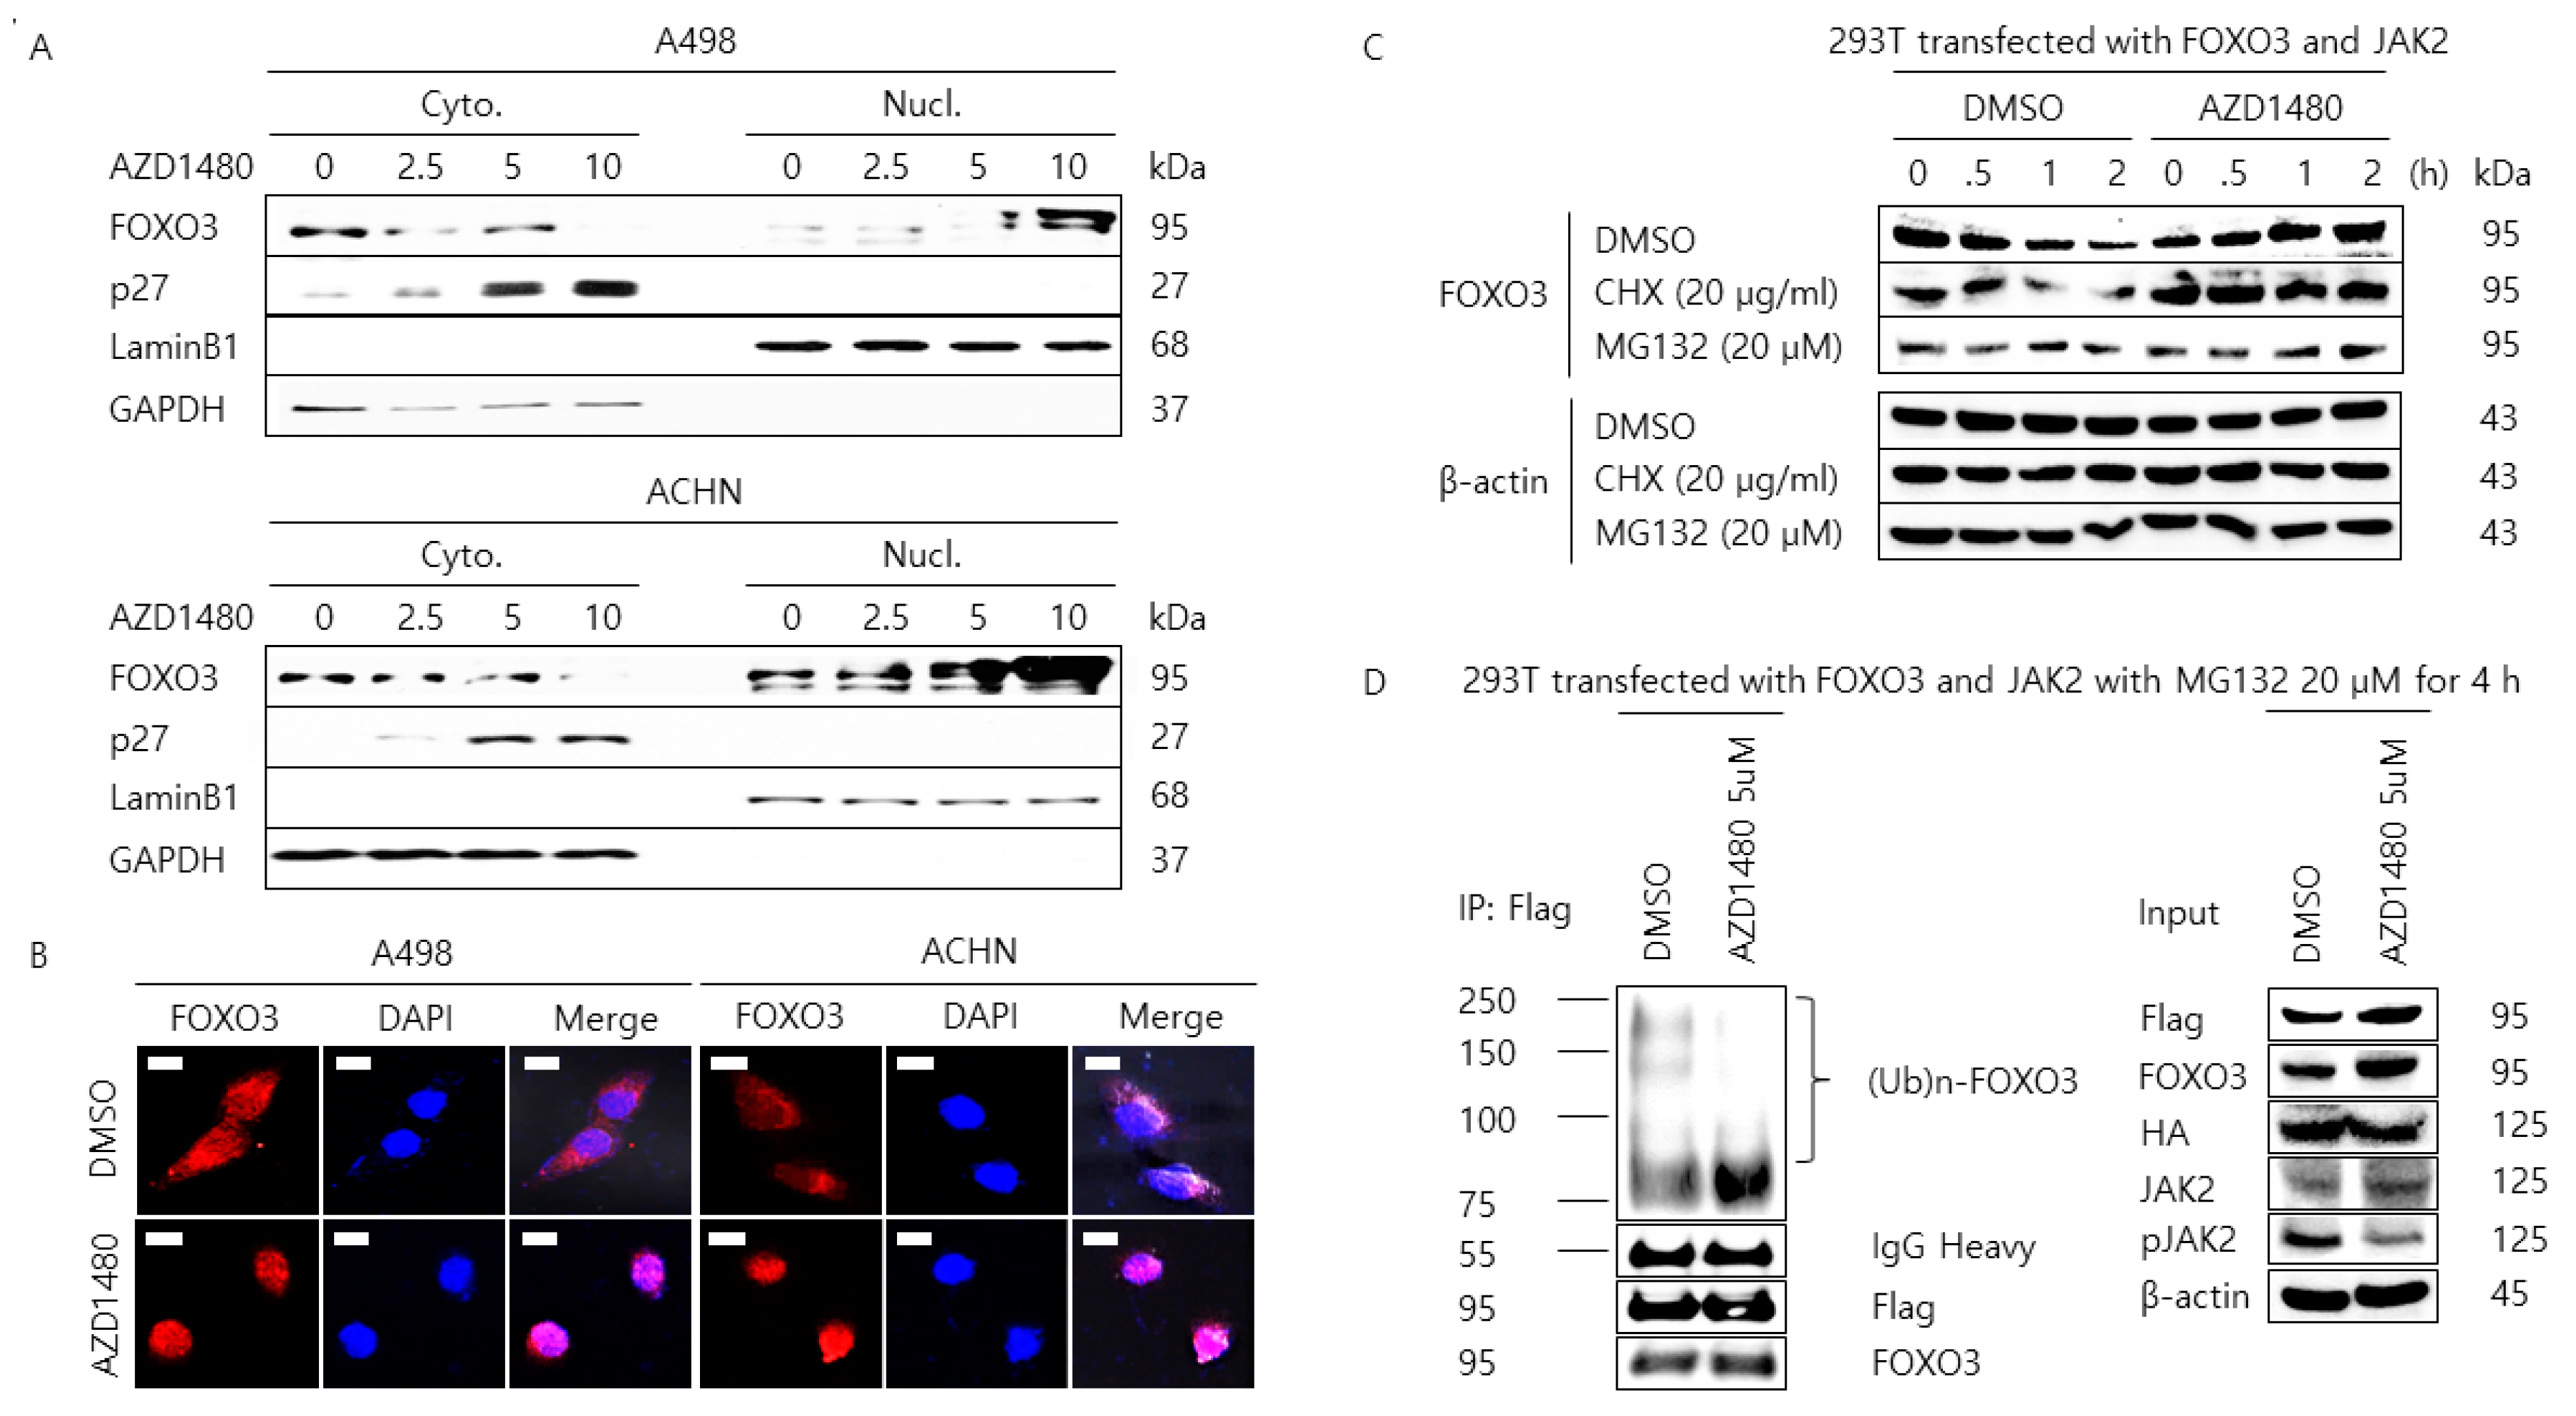
2.3. JAK2 Interacts with FOXO3 to Cause Tyrosine-Phosphorylation of FOXO3
2.4. Pharmacological Inhibition of JAK2 Induces the Nuclear Localization of FOXO3 and Increases FOXO3 Protein Stability
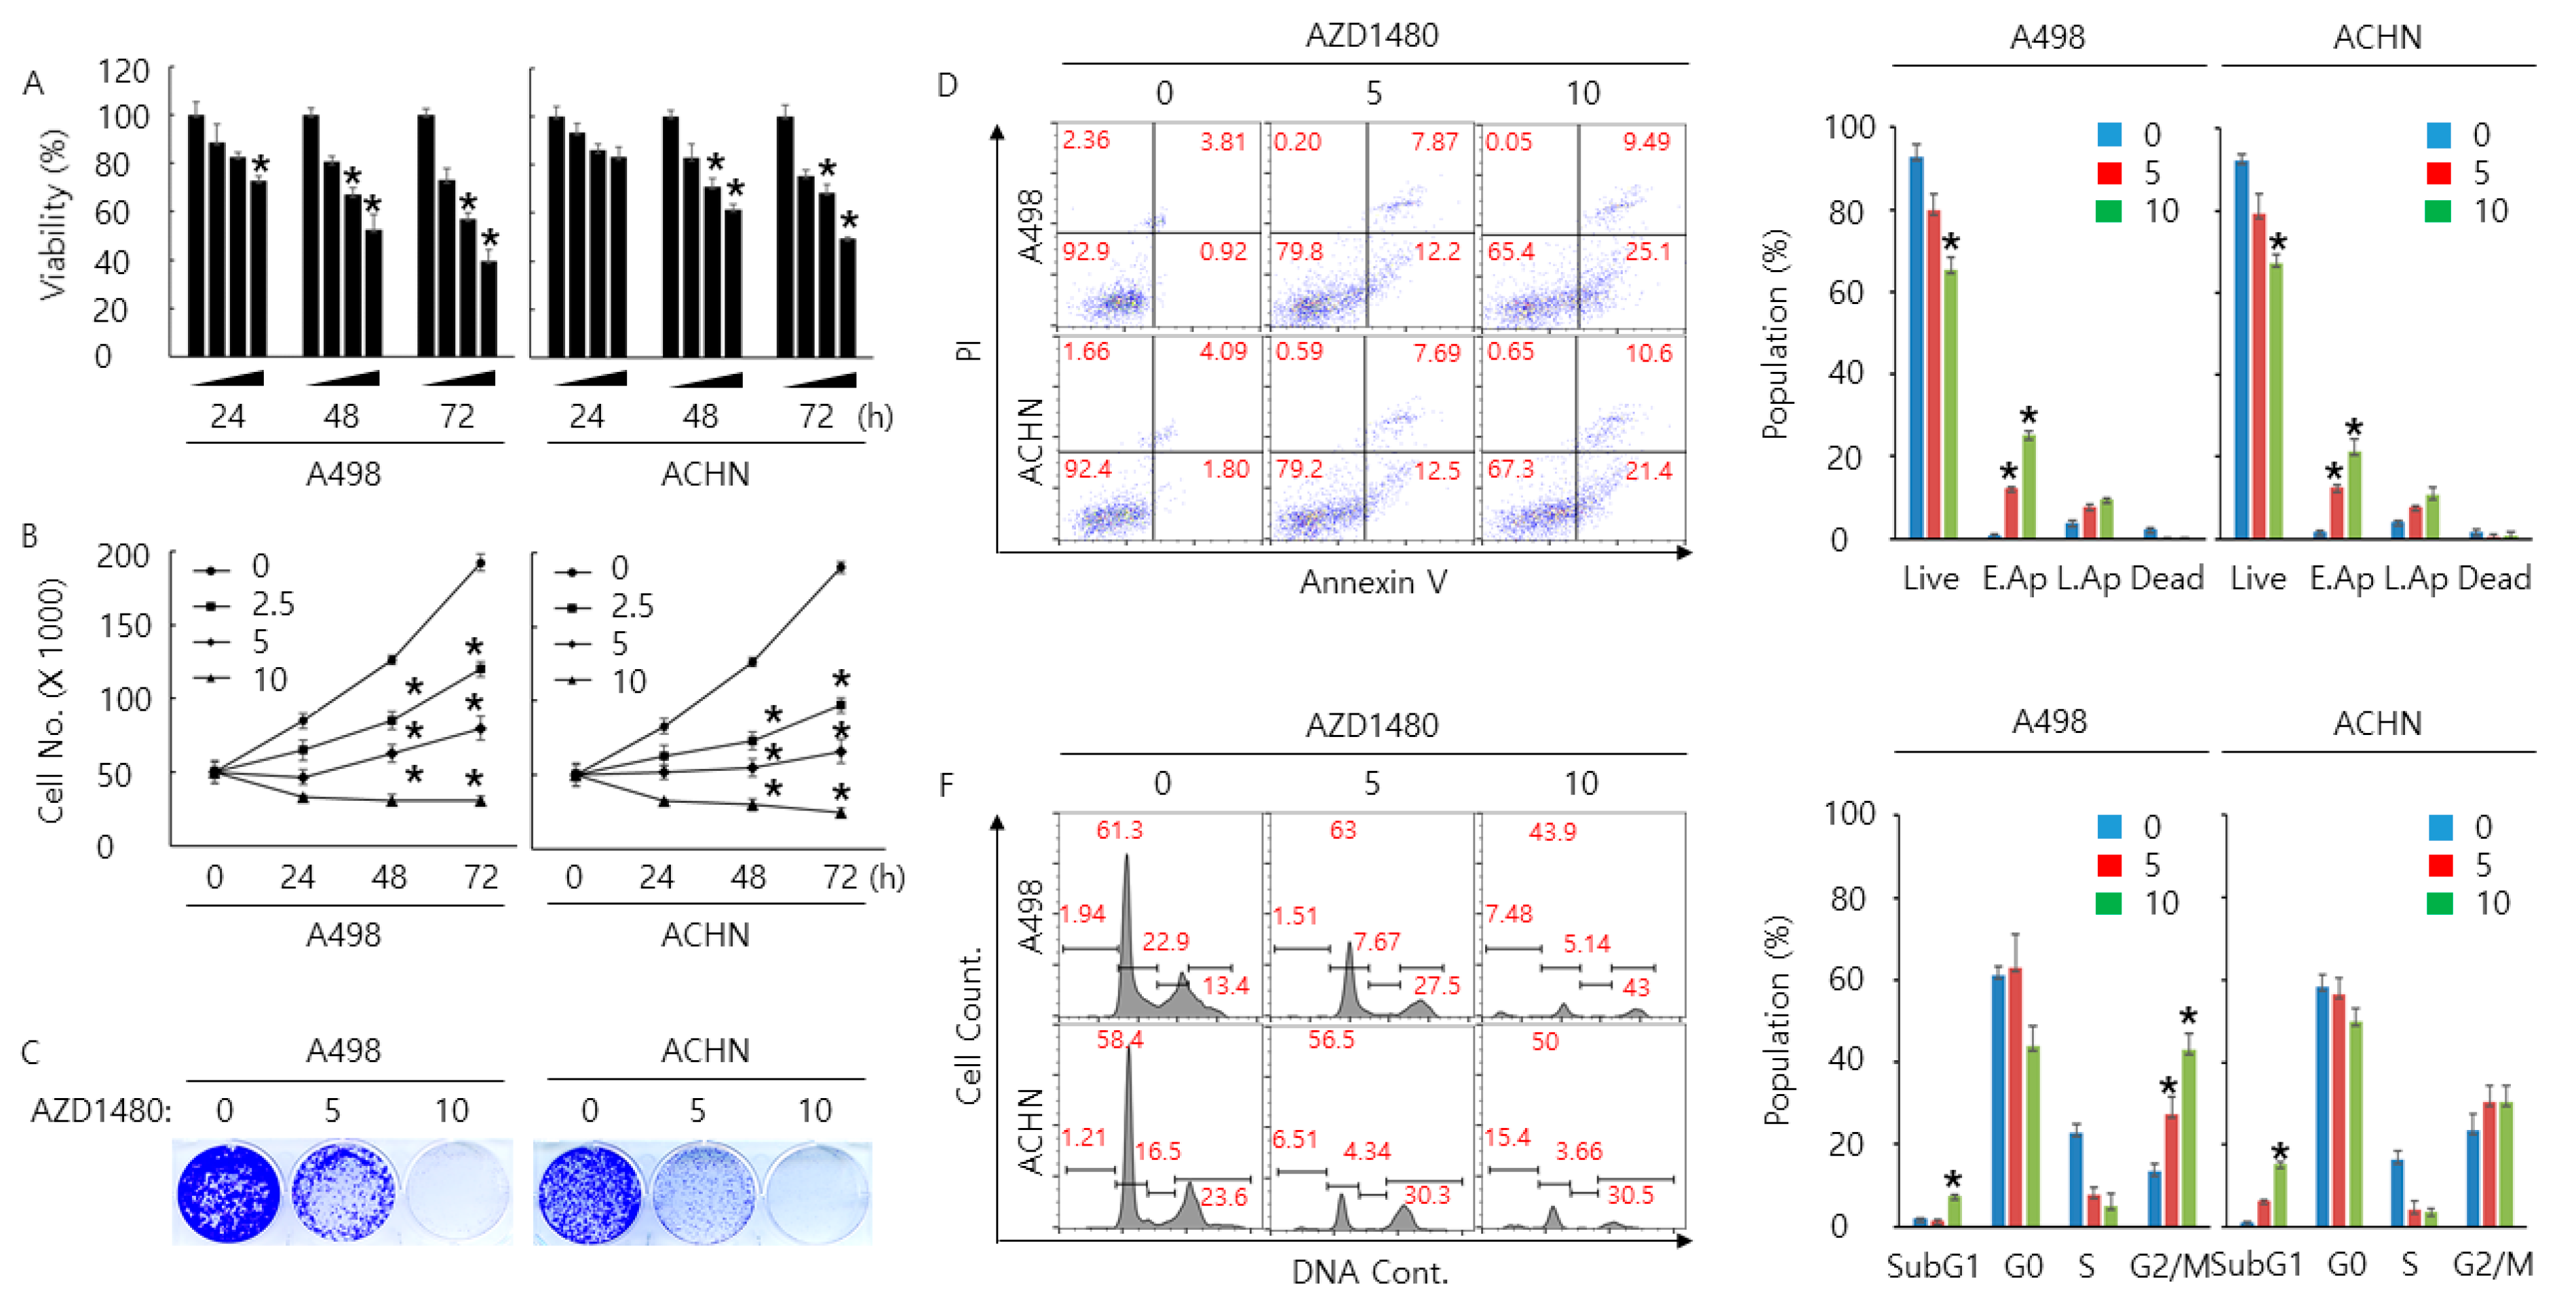
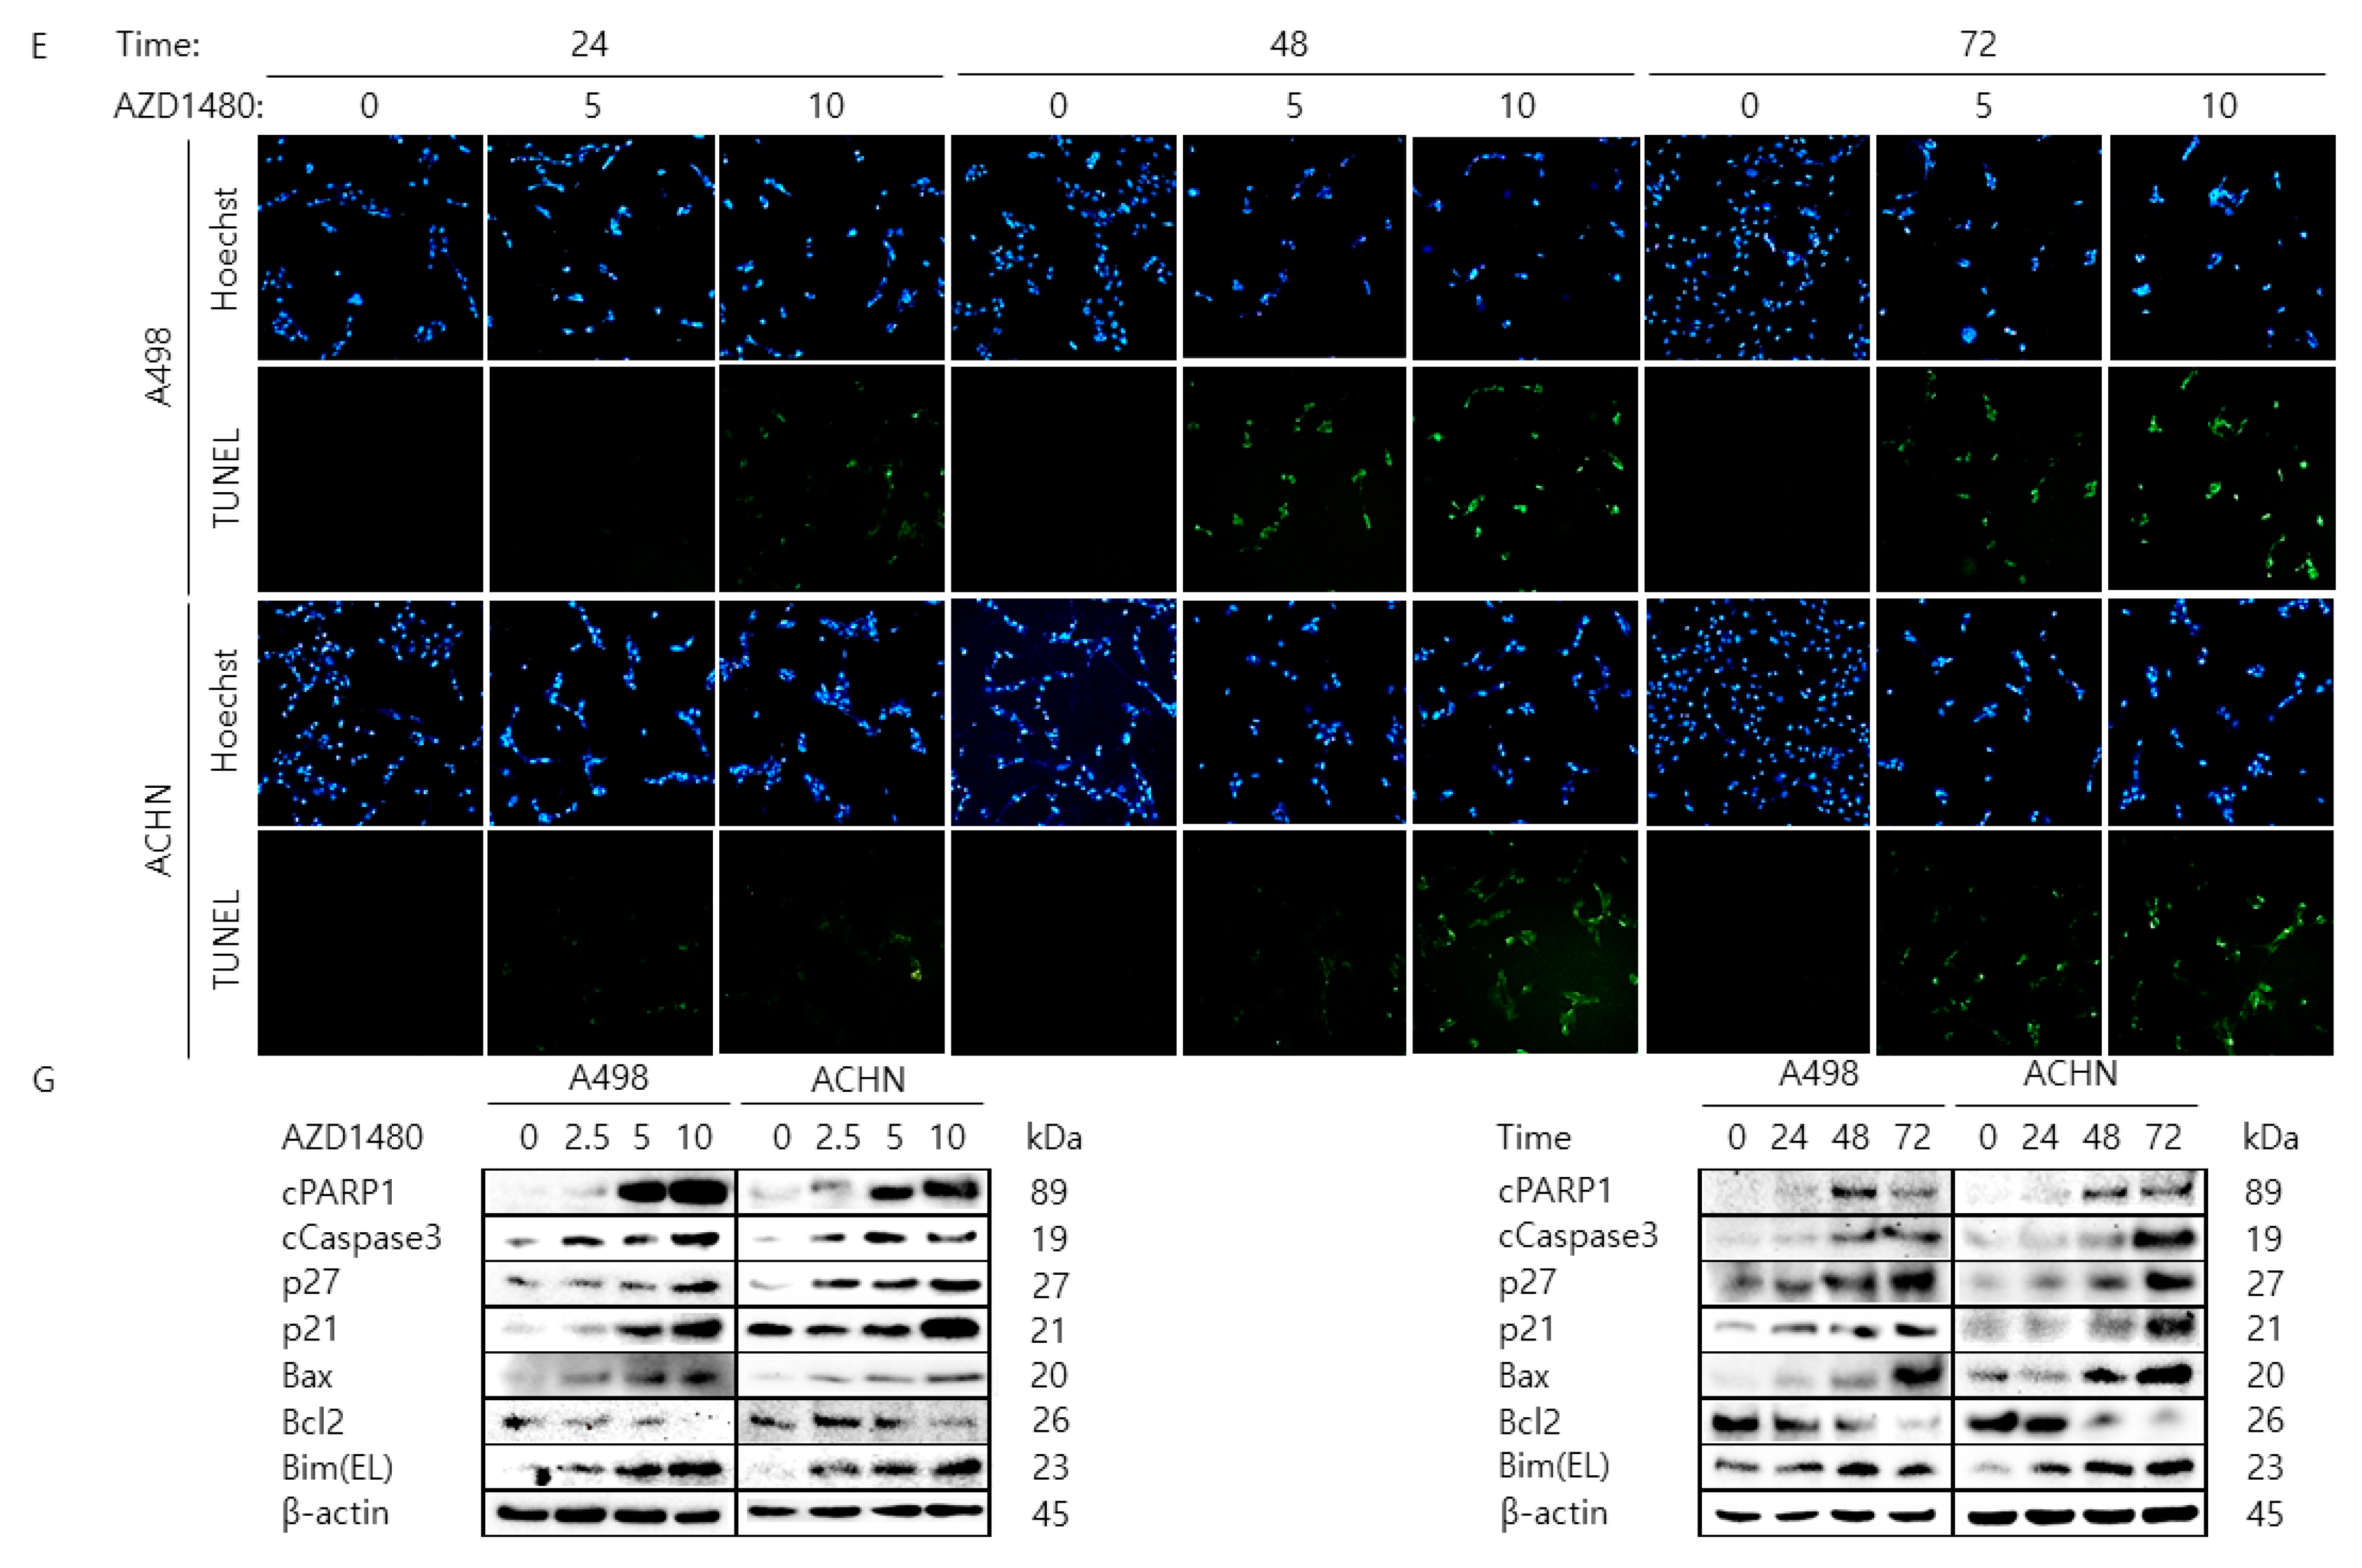
2.5. Pharmacological Inhibition of JAK2 Decreases Cell Proliferation Rate and Increases Cell Cycle Arrest and Apoptosis in A498 and ACHN Cells
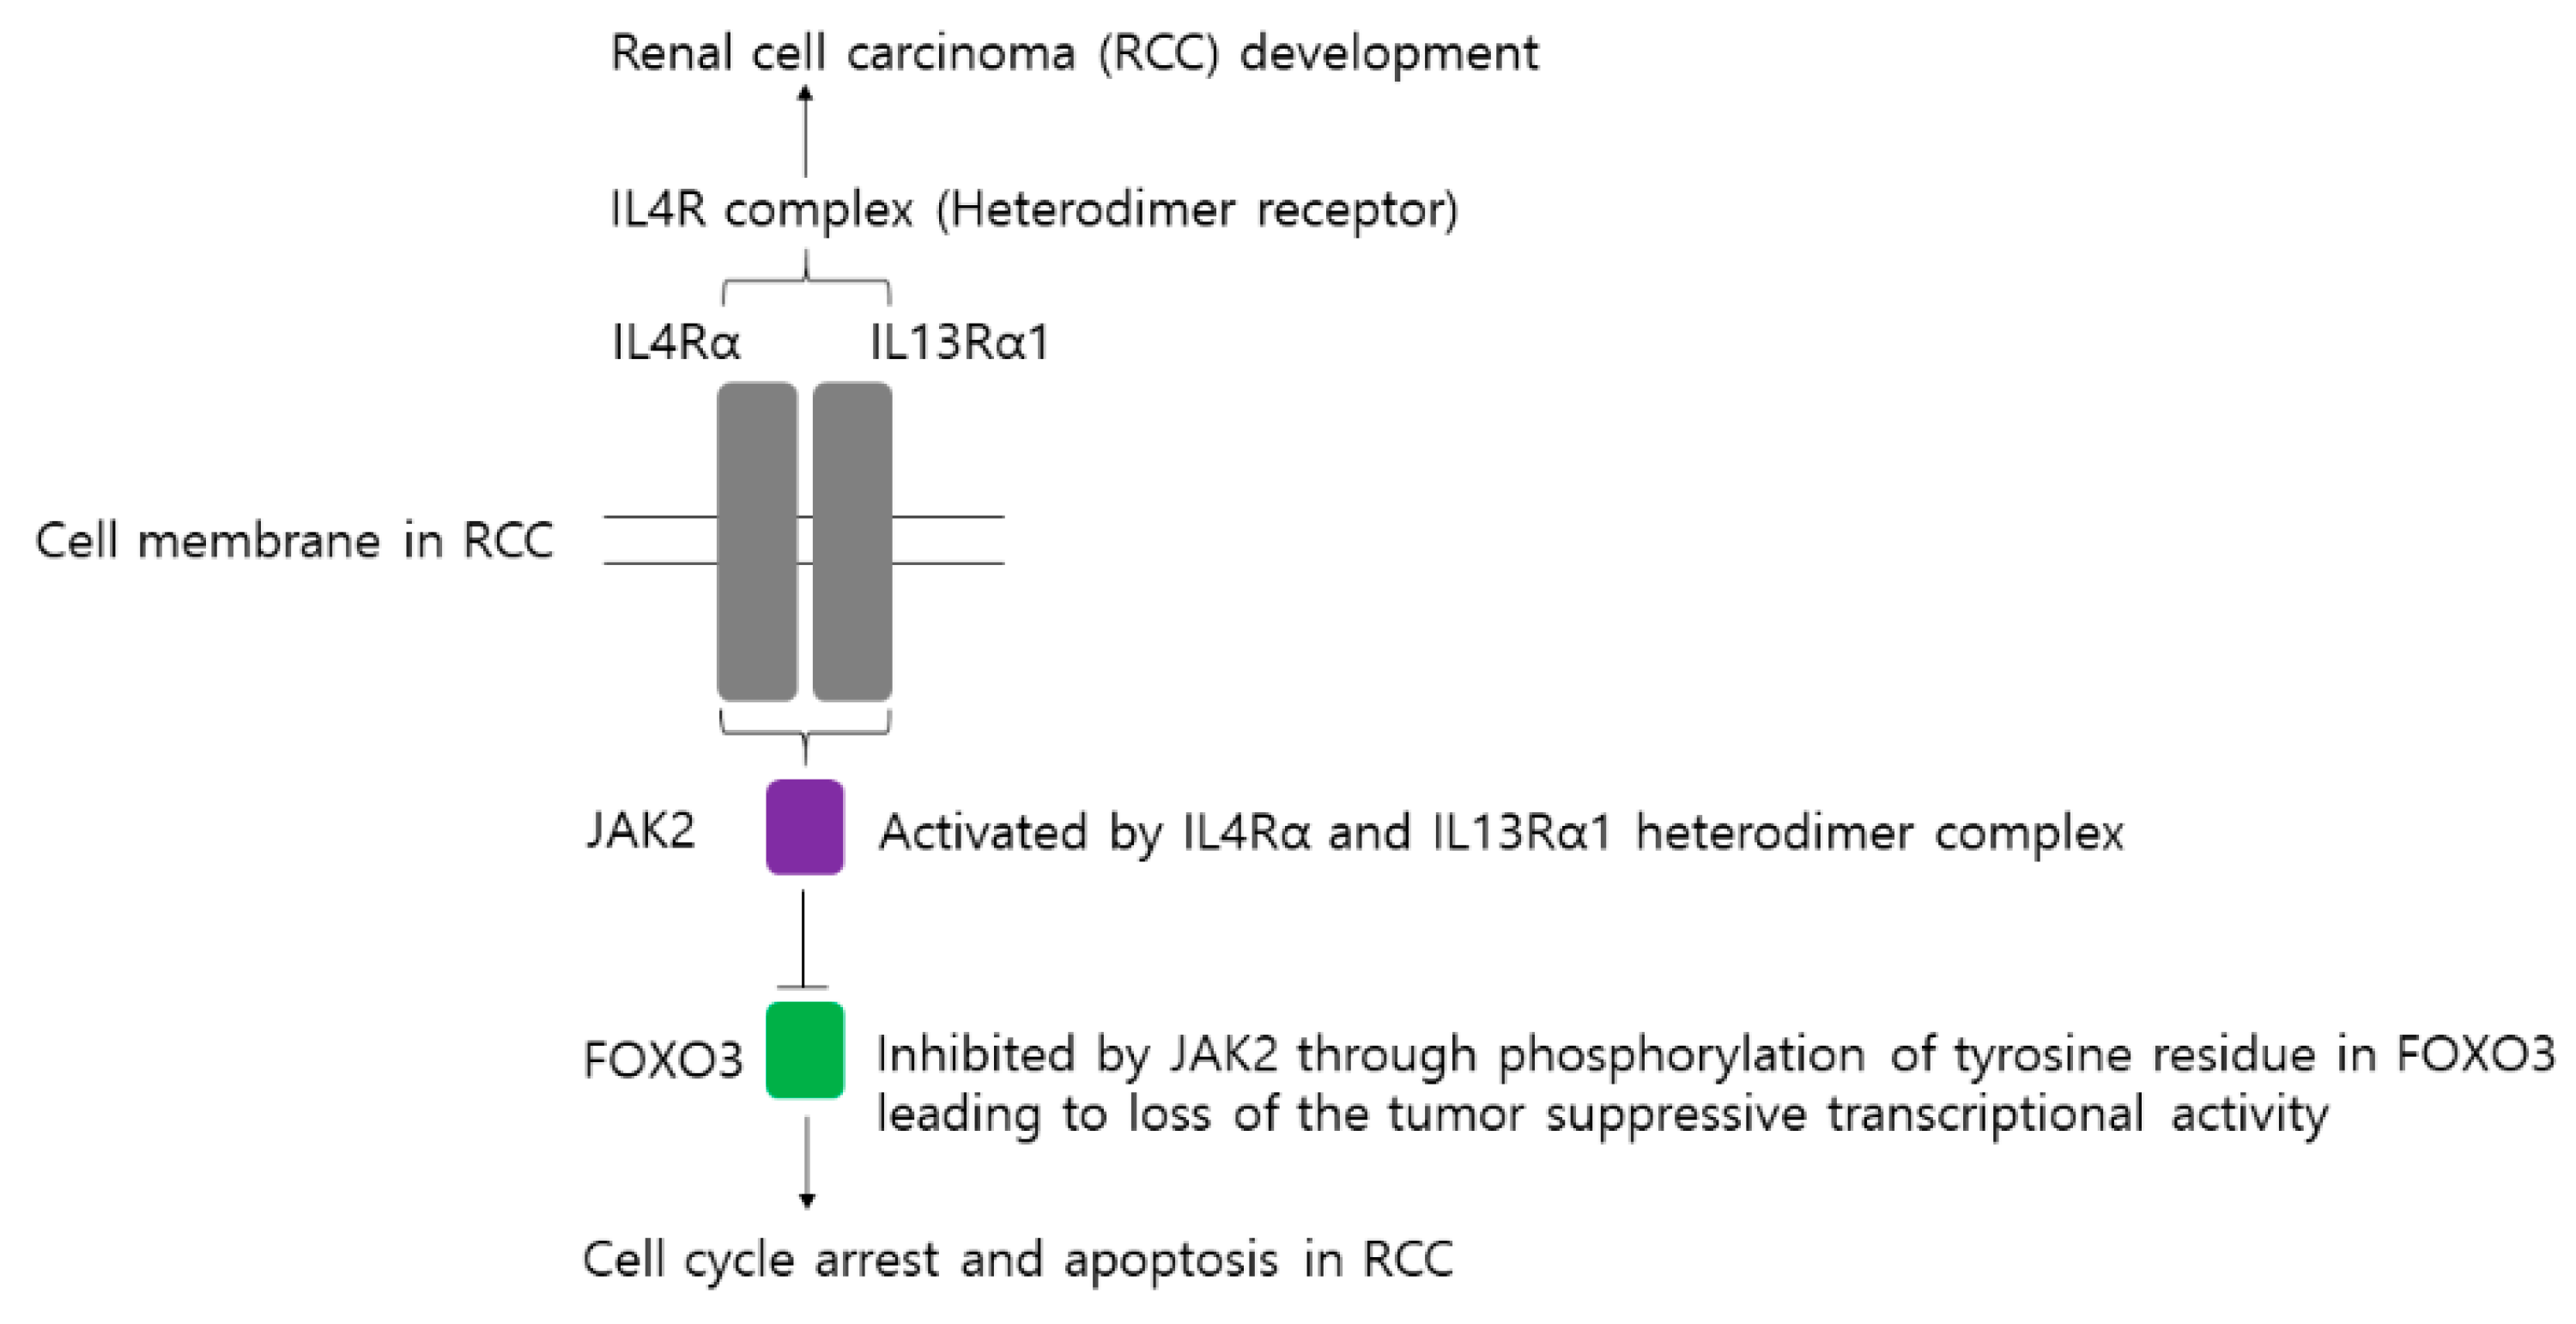
3. Discussion
4. Materials and Methods
4.1. Clear Cell Renal Cell Carcinoma Patients and Tissue Samples
4.2. Immunohistochemical Staining and Scoring
4.3. Cell Culture
4.4. Chemical Reagents, Antibodies, and Plasmid DNAs
4.5. Water Soluble Tetrazolium Salts 1 (WST-1) Assay
4.6. Colony Formation Assay
4.7. Western Blotting Analysis
4.8. Cytoplasmic and Nuclear Protein Fractionation
4.9. Immunofluorescence Analysis
4.10. Immunoprecipitation Analysis
4.11. TUNEL Assay
4.12. Annexin V Staining Analysis
4.13. Cell Cycle Analysis
4.14. Transfection of siRNA and Plasmid DNA
4.15. Statistical Analysis
5. Conclusions
Supplementary Materials
Author Contributions
Funding
Acknowledgments
Conflicts of Interest
References
- Siegel, R.L.; Miller, K.D.; Jemal, A. Cancer statistics, 2018. CA Cancer J. Clin. 2018, 68, 7–30. [Google Scholar] [CrossRef]
- Moch, H.; Gasser, T.; Amin, M.B.; Torhorst, J.; Sauter, G.; Mihatsch, M.J. Prognostic utility of the recently recommended histologic classification and revised TNM staging system of renal cell carcinoma: A Swiss experience with 588 tumors. Cancer 2000, 89, 604–614. [Google Scholar] [CrossRef]
- Leibovich, B.C.; Lohse, C.M.; Crispen, P.L.; Boorjian, S.A.; Thompson, R.H.; Blute, M.L.; Cheville, J.C. Histological subtype is an independent predictor of outcome for patients with renal cell carcinoma. J. Urol. 2010, 183, 1309–1315. [Google Scholar] [CrossRef] [PubMed]
- Wersall, P.J.; Blomgren, H.; Lax, I.; Kalkner, K.M.; Linder, C.; Lundell, G.; Nilsson, B.; Nilsson, S.; Naslund, I.; Pisa, P.; et al. Extracranial stereotactic radiotherapy for primary and metastatic renal cell carcinoma. Radiother. Oncol. 2005, 77, 88–95. [Google Scholar] [CrossRef] [PubMed]
- Ljungberg, B.; Campbell, S.C.; Choi, H.Y.; Jacqmin, D.; Lee, J.E.; Weikert, S.; Kiemeney, L.A. The epidemiology of renal cell carcinoma. Eur. Urol. 2011, 60, 615–621. [Google Scholar] [CrossRef] [PubMed]
- Escudier, B.; Szczylik, C.; Porta, C.; Gore, M. Treatment selection in metastatic renal cell carcinoma: Expert consensus. Nat. Rev. Clin. Oncol. 2012, 9, 327–337. [Google Scholar] [CrossRef] [PubMed]
- Vignali, D.; Monti, P. Targeting homeostatic T cell proliferation to control beta-cell autoimmunity. Curr. Diab. Rep. 2016, 16, 40. [Google Scholar] [CrossRef] [PubMed]
- Dinarello, C.A.; Mier, J.W. Interleukins. Annu. Rev. Med. 1986, 37, 173–178. [Google Scholar] [CrossRef] [PubMed]
- Rosser, E.C.; Mauri, C. Regulatory B cells: Origin, phenotype, and function. Immunity 2015, 42, 607–612. [Google Scholar] [CrossRef] [PubMed]
- McCormick, S.M.; Heller, N.M. Commentary: IL-4 and IL-13 receptors and signaling. Cytokine 2015, 75, 38–50. [Google Scholar] [CrossRef] [PubMed] [Green Version]
- Vadevoo, S.M.P.; Kim, J.E.; Gunassekaran, G.R.; Jung, H.K.; Chi, L.; Kim, D.E.; Lee, S.H.; Im, S.H.; Lee, B. IL4 Receptor-Targeted Proapoptotic Peptide Blocks Tumor Growth and Metastasis by Enhancing Antitumor Immunity. Mol. Cancer Ther. 2017, 16, 2803–2816. [Google Scholar] [CrossRef] [PubMed]
- LaPorte, S.L.; Juo, Z.S.; Vaclavikova, J.; Colf, L.A.; Qi, X.; Heller, N.M.; Keegan, A.D.; Garcia, K.C. Molecular and structural basis of cytokine receptor pleiotropy in the interleukin-4/13 system. Cell 2008, 132, 259–272. [Google Scholar] [CrossRef] [PubMed]
- Hershey, G.K. IL-13 receptors and signaling pathways: An evolving web. J. Allergy Clin. Immunol. 2003, 111, 677–690. [Google Scholar] [CrossRef] [PubMed]
- Suzuki, A.; Leland, P.; Joshi, B.H.; Puri, R.K. Targeting of IL-4 and IL-13 receptors for cancer therapy. Cytokine 2015, 75, 79–88. [Google Scholar] [CrossRef] [PubMed]
- Todaro, M.; Perez Alea, M.; Scopelliti, A.; Medema, J.P.; Stassi, G. IL-4-mediated drug resistance in colon cancer stem cells. Cell Cycle 2008, 7, 309–313. [Google Scholar] [CrossRef] [PubMed]
- Joshi, B.H.; Leland, P.; Lababidi, S.; Varrichio, F.; Puri, R.K. Interleukin-4 receptor alpha overexpression in human bladder cancer correlates with the pathological grade and stage of the disease. Cancer Med. 2014, 3, 1615–1628. [Google Scholar] [CrossRef] [PubMed]
- Prokopchuk, O.; Liu, Y.; Henne-Bruns, D.; Kornmann, M. Interleukin-4 enhances proliferation of human pancreatic cancer cells: evidence for autocrine and paracrine actions. Br. J. Cancer 2005, 92, 921–928. [Google Scholar] [CrossRef] [Green Version]
- Park, M.H.; Kwon, H.J.; Kim, J.R.; Lee, B.; Lee, S.J.; Bae, Y.K. Elevated Interleukin-13 Receptor Alpha 1 Expression in Tumor Cells Is Associated with Poor Prognosis in Patients with Invasive Breast Cancer. Ann. Surg. Oncol. 2017, 24, 3780–3787. [Google Scholar] [CrossRef]
- Puri, S.; Joshi, B.H.; Sarkar, C.; Mahapatra, A.K.; Hussain, E.; Sinha, S. Expression and structure of interleukin 4 receptors in primary meningeal tumors. Cancer 2005, 103, 2132–2142. [Google Scholar] [CrossRef]
- Malek, E.; de Lima, M.; Letterio, J.J.; Kim, B.G.; Finke, J.H.; Driscoll, J.J.; Giralt, S.A. Myeloid-derived suppressor cells: The green light for myeloma immune escape. Blood Rev. 2016, 30, 341–348. [Google Scholar] [CrossRef]
- Wang, H.W.; Joyce, J.A. Alternative activation of tumor-associated macrophages by IL-4: priming for protumoral functions. Cell Cycle 2010, 9, 4824–4835. [Google Scholar] [CrossRef] [PubMed]
- Ostrand-Rosenberg, S. Immune surveillance: A balance between protumor and antitumor immunity. Curr. Opin. Genet. Dev. 2008, 18, 11–18. [Google Scholar] [CrossRef] [PubMed]
- Cho, Y.A.; Kim, J. Association of IL4, IL13, and IL4R polymorphisms with gastrointestinal cancer risk: A meta-analysis. J. Epidemiol. 2017, 27, 215–220. [Google Scholar] [CrossRef] [PubMed]
- Landi, S.; Bottari, F.; Gemignani, F.; Gioia-Patricola, L.; Guino, E.; Osorio, A.; de Oca, J.; Capella, G.; Canzian, F.; Moreno, V.; et al. Interleukin-4 and interleukin-4 receptor polymorphisms and colorectal cancer risk. Eur. J. Cancer 2007, 43, 762–768. [Google Scholar] [CrossRef]
- Bankaitis, K.V.; Fingleton, B. Targeting IL4/IL4R for the treatment of epithelial cancer metastasis. Clin. Exp. Metastasis 2015, 32, 847–856. [Google Scholar] [CrossRef] [PubMed]
- Izuhara, K.; Harada, N. Interleukin-4 activates two distinct pathways of phosphatidylinositol-3 kinase in the same cells. Biochem. Biophys. Res. Commun. 1996, 229, 624–629. [Google Scholar] [CrossRef] [PubMed]
- Ruckerl, D.; Jenkins, S.J.; Laqtom, N.N.; Gallagher, I.J.; Sutherland, T.E.; Duncan, S.; Buck, A.H.; Allen, J.E. Induction of IL-4Ralpha-dependent microRNAs identifies PI3K/Akt signaling as essential for IL-4-driven murine macrophage proliferation in vivo. Blood 2012, 120, 2307–2316. [Google Scholar] [CrossRef] [PubMed]
- Mukthavaram, R.; Ouyang, X.; Saklecha, R.; Jiang, P.; Nomura, N.; Pingle, S.C.; Guo, F.; Makale, M.; Kesari, S. Effect of the JAK2/STAT3 inhibitor SAR317461 on human glioblastoma tumorspheres. J. Transl. Med. 2015, 13, 269. [Google Scholar] [CrossRef] [PubMed]
- Wu, L.; Guo, L.; Liang, Y.; Liu, X.; Jiang, L.; Wang, L. Curcumin suppresses stem-like traits of lung cancer cells via inhibiting the JAK2/STAT3 signaling pathway. Oncol. Rep. 2015, 34, 3311–3317. [Google Scholar] [CrossRef]
- Liu, Y.F.; Lu, Y.M.; Qu, G.Q.; Liu, Y.; Chen, W.X.; Liao, X.H.; Kong, W.M. Ponicidin induces apoptosis via JAK2 and STAT3 signaling pathways in gastric carcinoma. Int. J. Mol. Sci. 2015, 16, 1576–1589. [Google Scholar] [CrossRef]
- Jorvig, J.E.; Chakraborty, A. Zerumbone inhibits growth of hormone refractory prostate cancer cells by inhibiting JAK2/STAT3 pathway and increases paclitaxel sensitivity. Anticancer Drugs 2015, 26, 160–166. [Google Scholar] [CrossRef] [PubMed]
- Du, W.W.; Yang, W.; Chen, Y.; Wu, Z.K.; Foster, F.S.; Yang, Z.; Li, X.; Yang, B.B. Foxo3 circular RNA promotes cardiac senescence by modulating multiple factors associated with stress and senescence responses. Eur. Heart J. 2017, 38, 1402–1412. [Google Scholar] [CrossRef] [PubMed]
- Hagenbuchner, J.; Lungkofler, L.; Kiechl-Kohlendorfer, U.; Viola, G.; Ferlin, M.G.; Ausserlechner, M.J.; Obexer, P. The tubulin inhibitor MG-2477 induces autophagy-regulated cell death, ROS accumulation and activation of FOXO3 in neuroblastoma. Oncotarget 2017, 8, 32009–32026. [Google Scholar] [CrossRef] [PubMed] [Green Version]
- Kumazoe, M.; Takai, M.; Bae, J.; Hiroi, S.; Huang, Y.; Takamatsu, K.; Won, Y.; Yamashita, M.; Hidaka, S.; Yamashita, S.; et al. FOXO3 is essential for CD44 expression in pancreatic cancer cells. Oncogene 2017, 36, 2643–2654. [Google Scholar] [CrossRef] [PubMed]
- Kumazoe, M.; Takai, M.; Hiroi, S.; Takeuchi, C.; Kadomatsu, M.; Nojiri, T.; Onda, H.; Bae, J.; Huang, Y.; Takamatsu, K.; et al. The FOXO3/PGC-1beta signaling axis is essential for cancer stem cell properties of pancreatic ductal adenocarcinoma. J. Biol. Chem. 2017, 292, 10813–10823. [Google Scholar] [CrossRef] [PubMed]
- Coomans de Brachene, A.; Demoulin, J.B. FOXO transcription factors in cancer development and therapy. Cell Mol. Life Sci. 2016, 73, 1159–1172. [Google Scholar] [CrossRef] [PubMed]
- Liang, R.; Ghaffari, S. Mitochondria and FOXO3 in stem cell homeostasis, a window into hematopoietic stem cell fate determination. J. Bioenerg. Biomembr. 2017, 49, 343–346. [Google Scholar] [CrossRef] [PubMed]
- Natarajan, S.K.; Stringham, B.A.; Mohr, A.M.; Wehrkamp, C.J.; Lu, S.; Phillippi, M.A.; Harrison-Findik, D.; Mott, J.L. FoxO3 increases miR-34a to cause palmitate-induced cholangiocyte lipoapoptosis. J. Lipid Res. 2017, 58, 866–875. [Google Scholar] [CrossRef] [PubMed] [Green Version]
- Peng, X.L.; So, K.K.; He, L.; Zhao, Y.; Zhou, J.; Li, Y.; Yao, M.; Xu, B.; Zhang, S.; Yao, H.; et al. MyoD- and FoxO3-mediated hotspot interaction orchestrates super-enhancer activity during myogenic differentiation. Nucleic Acids Res. 2017, 45, 8785–8805. [Google Scholar] [CrossRef] [PubMed] [Green Version]
- Sang, T.; Cao, Q.; Wang, Y.; Liu, F.; Chen, S. Overexpression or silencing of FOXO3a affects proliferation of endothelial progenitor cells and expression of cell cycle regulatory proteins. PLoS ONE 2014, 9, e101703. [Google Scholar] [CrossRef] [PubMed]
- Sunters, A.; Fernandez de Mattos, S.; Stahl, M.; Brosens, J.J.; Zoumpoulidou, G.; Saunders, C.A.; Coffer, P.J.; Medema, R.H.; Coombes, R.C.; Lam, E.W. FoxO3a transcriptional regulation of Bim controls apoptosis in paclitaxel-treated breast cancer cell lines. J. Biol. Chem. 2003, 278, 49795–49805. [Google Scholar] [CrossRef] [PubMed]
- Park, S.H.; Chung, Y.M.; Ma, J.; Yang, Q.; Berek, J.S.; Hu, M.C. Pharmacological activation of FOXO3 suppresses triple-negative breast cancer in vitro and in vivo. Oncotarget 2016, 7, 42110–42125. [Google Scholar] [CrossRef] [PubMed]
- Salcher, S.; Hagenbuchner, J.; Geiger, K.; Seiter, M.A.; Rainer, J.; Kofler, R.; Hermann, M.; Kiechl-Kohlendorfer, U.; Ausserlechner, M.J.; Obexer, P. C10ORF10/DEPP, a transcriptional target of FOXO3, regulates ROS-sensitivity in human neuroblastoma. Mol. Cancer 2014, 13, 224. [Google Scholar] [CrossRef] [PubMed] [Green Version]
- Song, D.; Ma, J.; Chen, L.; Guo, C.; Zhang, Y.; Chen, T.; Zhang, S.; Zhu, Z.; Tian, L.; Niu, P. FOXO3 promoted mitophagy via nuclear retention induced by manganese chloride in SH-SY5Y cells. Metallomics 2017, 9, 1251–1259. [Google Scholar] [CrossRef] [PubMed]
- Ni, D.; Ma, X.; Li, H.Z.; Gao, Y.; Li, X.T.; Zhang, Y.; Ai, Q.; Zhang, P.; Song, E.L.; Huang, Q.B.; et al. Downregulation of FOXO3a promotes tumor metastasis and is associated with metastasis-free survival of patients with clear cell renal cell carcinoma. Clin. Cancer Res. 2014, 20, 1779–1790. [Google Scholar] [CrossRef] [PubMed]
- Greer, E.L.; Brunet, A. FOXO transcription factors at the interface between longevity and tumor suppression. Oncogene 2005, 24, 7410–7425. [Google Scholar] [CrossRef] [Green Version]
- Vogt, P.K.; Jiang, H.; Aoki, M. Triple layer control: Phosphorylation, acetylation and ubiquitination of FOXO proteins. Cell Cycle 2005, 4, 908–913. [Google Scholar] [CrossRef]
- Fu, Z.; Tindall, D.J. FOXOs, cancer and regulation of apoptosis. Oncogene 2008, 27, 2312–2319. [Google Scholar] [CrossRef] [Green Version]
- Guo, L.; Hu-Li, J.; Paul, W.E. Probabilistic Regulation in TH2 Cells Accounts for Monoallelic Expression of IL-4 and IL-13. Immunity 2005, 23, 89–99. [Google Scholar] [CrossRef] [Green Version]
- Junttila, I.S. Tuning the Cytokine Responses: An Update on Interleukin (IL)-4 and IL-13 Receptor Complexes. Front. Immunol. 2018, 9. [Google Scholar] [CrossRef]
- Aversa, G.; Punnonen, J.; Cocks, B.G.; de Waal Malefyt, R.; Vega, F.; Zurawski, S.M.; Zurawski, G.; de Vries, J.E. An interleukin 4 (IL-4) mutant protein inhibits both IL-4 or IL-13-induced human immunoglobulin G4 (IgG4) and IgE synthesis and B cell proliferation: support for a common component shared by IL-4 and IL-13 receptors. J. Exp. Med. 1993, 178, 2213. [Google Scholar] [CrossRef] [PubMed]
- Lee, H.L.; Park, M.H.; Song, J.K.; Jung, Y.Y.; Kim, Y.; Kim, K.B.; Hwang, D.Y.; Yoon, D.Y.; Song, M.J.; Han, S.B.; et al. Tumor growth suppressive effect of IL-4 through p21-mediated activation of STAT6 in IL-4Rα overexpressed melanoma models. Oncotarget 2016, 7, 23425–23438. [Google Scholar] [CrossRef] [PubMed]
- Hallett, M.A.; Venmar, K.T.; Fingleton, B. Cytokine stimulation of epithelial cancer cells: The similar and divergent functions of IL-4 and IL-13. Cancer Res. 2012, 72, 6338–6343. [Google Scholar] [CrossRef] [PubMed]
- Mueller, T.D.; Zhang, J.-L.; Sebald, W.; Duschl, A. Structure, binding, and antagonists in the IL-4/IL-13 receptor system. BBA.-Mol. Cell Res. 2002, 1592, 237–250. [Google Scholar] [CrossRef] [Green Version]
- Umeshita-Suyama, R.; Sugimoto, R.; Akaiwa, M.; Arima, K.; Yu, B.; Wada, M.; Kuwano, M.; Nakajima, K.; Hamasaki, N.; Izuhara, K. Characterization of IL-4 and IL-13 signals dependent on the human IL-13 receptor α chain 1: redundancy of requirement of tyrosine residue for STAT3 activation. Int. Immunol. 2000, 12, 1499–1509. [Google Scholar] [CrossRef]
- Venmar, K.T.; Carter, K.J.; Hwang, D.G.; Dozier, E.A.; Fingleton, B. IL4 receptor ILR4alpha regulates metastatic colonization by mammary tumors through multiple signaling pathways. Cancer Res. 2014, 74, 4329–4340. [Google Scholar] [CrossRef] [PubMed]
- Koller, F.L.; Hwang, D.G.; Dozier, E.A.; Fingleton, B. Epithelial interleukin-4 receptor expression promotes colon tumor growth. Carcinogenesis 2010, 31, 1010–1017. [Google Scholar] [CrossRef]
- Olson, S.H.; Orlow, I.; Simon, J.; Tommasi, D.; Roy, P.; Bayuga, S.; Ludwig, E.; Zauber, A.G.; Kurtz, R.C. Allergies, variants in IL-4 and IL-4Rα genes, and risk of pancreatic cancer. Cancer Detect. Prev. 2007, 31, 345–351. [Google Scholar] [CrossRef]
- Venmar, K.T.; Fingleton, B. Lessons from immunology: IL4R directly promotes mammary tumor metastasis. Oncoimmunology 2014, 3, e955373. [Google Scholar] [CrossRef] [Green Version]
- Kawakami, K.; Kawakami, M.; Joshi, B.H.; Puri, R.K. Interleukin-13 receptor-targeted cancer therapy in an immunodeficient animal model of human head and neck cancer. Cancer Res. 2001, 61, 6194–6200. [Google Scholar]
- Shaik, A.P.; Shaik, A.S.; Majwal, A.A.; Faraj, A.A. Blocking interleukin-4 receptor α using polyethylene glycol functionalized superparamagnetic iron oxide nanocarriers to inhibit breast cancer cell proliferation. Cancer Res. Treat. 2017, 49, 322–329. [Google Scholar] [CrossRef] [PubMed]
- Todaro, M.; Lombardo, Y.; Francipane, M.G.; Alea, M.P.; Cammareri, P.; Iovino, F.; Di Stefano, A.B.; Di Bernardo, C.; Agrusa, A.; Condorelli, G.; et al. Apoptosis resistance in epithelial tumors is mediated by tumor-cell-derived interleukin-4. Cell Death Diff. 2008, 15, 762–772. [Google Scholar] [CrossRef] [PubMed] [Green Version]
- Roth, F.; De La Fuente, A.C.; Vella, J.L.; Zoso, A.; Inverardi, L.; Serafini, P. Aptamer-mediated blockade of IL4Ralpha triggers apoptosis of MDSCs and limits tumor progression. Cancer Res. 2012, 72, 1373–1383. [Google Scholar] [CrossRef] [PubMed]
- Joshi, B.H.; Suzuki, A.; Fujisawa, T.; Leland, P.; Varrichio, F.; Lababidi, S.; Lloyd, R.; Kasperbauer, J.; Puri, R.K. Identification, characterization, and targeting of IL-4 receptor by IL-4-Pseudomonas exotoxin in mouse models of anaplastic thyroid cancer. Discov. Med. 2015, 20, 273–284. [Google Scholar] [PubMed]
- Guo, C.; Ouyang, Y.; Cai, J.; Xiong, L.; Chen, Y.; Zeng, X.; Liu, A. High expression of IL-4R enhances proliferation and invasion of hepatocellular carcinoma cells. Int. J. Biol. Markers 2017, 32, 384–390. [Google Scholar] [CrossRef] [PubMed]
- Park, S.H.; Yoon, Y.I.; Moon, H.; Lee, G.H.; Lee, B.H.; Yoon, T.J.; Lee, H.J. Development of a novel microbubble-liposome complex conjugated with peptide ligands targeting IL4R on brain tumor cells. Oncol. Rep. 2016, 36, 131–136. [Google Scholar] [CrossRef] [PubMed] [Green Version]
- Kisseleva, T.; Bhattacharya, S.; Braunstein, J.; Schindler, C.W. Signaling through the JAK/STAT pathway, recent advances and future challenges. Gene 2002, 285, 1–24. [Google Scholar] [CrossRef]
- Brooks, A.J.; Dai, W.; O’Mara, M.L.; Abankwa, D.; Chhabra, Y.; Pelekanos, R.A.; Gardon, O.; Tunny, K.A.; Blucher, K.M.; Morton, C.J.; et al. Mechanism of activation of protein kinase JAK2 by the growth hormone receptor. Science 2014, 344, 1249783. [Google Scholar] [CrossRef] [PubMed]
- Wernig, G.; Kharas, M.G.; Okabe, R.; Moore, S.A.; Leeman, D.S.; Cullen, D.E.; Gozo, M.; McDowell, E.P.; Levine, R.L.; Doukas, J.; et al. Efficacy of TG101348, a selective JAK2 inhibitor, in treatment of a murine model of JAK2V617F-induced polycythemia vera. Cancer Cell 2008, 13, 311–320. [Google Scholar] [CrossRef] [PubMed]
- Carobbio, A.; Finazzi, G.; Guerini, V.; Spinelli, O.; Delaini, F.; Marchioli, R.; Borrelli, G.; Rambaldi, A.; Barbui, T. Leukocytosis is a risk factor for thrombosis in essential thrombocythemia: interaction with treatment, standard risk factors, and Jak2 mutation status. Blood 2007, 109, 2310–2313. [Google Scholar] [CrossRef]
- Tibes, R.; Bogenberger, J.M.; Geyer, H.L.; Mesa, R.A. JAK2 inhibitors in the treatment of myeloproliferative neoplasms. Expert. Opin. Investig. Drugs 2012, 21, 1755–1774. [Google Scholar] [CrossRef]
- LaFave, L.M.; Levine, R.L. JAK2 the future: Therapeutic strategies for JAK-dependent malignancies. Trends Pharmacol. Sci. 2012, 33, 574–582. [Google Scholar] [CrossRef]
- Mesa, R.A.; Yasothan, U.; Kirkpatrick, P. Ruxolitinib. Nat. Rev. Drug Discov. 2012, 11, 103. [Google Scholar] [CrossRef]
- Wu, P.; Nielsen, T.E.; Clausen, M.H. FDA-approved small-molecule kinase inhibitors. Trends Pharmacol. Sci. 2015, 36, 422–439. [Google Scholar] [CrossRef] [Green Version]
- Mascarenhas, J.; Hoffman, R. Ruxolitinib: The first FDA approved therapy for the treatment of myelofibrosis. Clin. Cancer Res. 2012, 18, 3008–3014. [Google Scholar] [CrossRef]
- Menghrajani, K.; Boonstra, P.S.; Mercer, J.A.; Perkins, C.; Gowin, K.L.; Weber, A.A.; Mesa, R.; Gotlib, J.R.; Wang, L.; Singer, J.W.; et al. Predictive models for splenic response to JAK-inhibitor therapy in patients with myelofibrosis. Leuk. Lymphoma. 2019, 60, 1036–1042. [Google Scholar] [CrossRef]
- Rawlings, J.S.; Rosler, K.M.; Harrison, D.A. The JAK/STAT signaling pathway. J. Cell Sci. 2004, 117, 1281–1283. [Google Scholar] [CrossRef] [Green Version]
- Marotta, L.L.; Almendro, V.; Marusyk, A.; Shipitsin, M.; Schemme, J.; Walker, S.R.; Bloushtain-Qimron, N.; Kim, J.J.; Choudhury, S.A.; Maruyama, R.; et al. The JAK2/STAT3 signaling pathway is required for growth of CD44(+)CD24(-) stem cell-like breast cancer cells in human tumors. J. Clin. Investig. 2011, 121, 2723–2735. [Google Scholar] [CrossRef]
- Yoshikawa, T.; Miyamoto, M.; Aoyama, T.; Soyama, H.; Goto, T.; Hirata, J.; Suzuki, A.; Nagaoka, I.; Tsuda, H.; Furuya, K.; et al. JAK2/STAT3 pathway as a therapeutic target in ovarian cancers. Oncol. Lett. 2018, 15, 5772–5780. [Google Scholar] [CrossRef]
- Kim, B.I.; Kim, J.H.; Sim, D.Y.; Nam, M.; Jung, J.H.; Shim, B.; Lee, J.; Kim, S.H. Inhibition of JAK2/STAT3 and activation of caspase9/3 are involved in KYS05090Sinduced apoptosis in ovarian cancer cells. Int. J. Oncol. 2019, 55, 203–210. [Google Scholar] [CrossRef]
- Judd, L.M.; Menheniott, T.R.; Ling, H.; Jackson, C.B.; Howlett, M.; Kalantzis, A.; Priebe, W.; Giraud, A.S. Inhibition of the JAK2/STAT3 pathway reduces gastric cancer growth in vitro and in vivo. PLoS ONE 2014, 9, e95993. [Google Scholar] [CrossRef]
- Wei, X.; Yu, L.; Li, Y. PBX1 promotes the cell proliferation via JAK2/STAT3 signaling in clear cell renal carcinoma. Biochem. Biophys. Res. Commun. 2018, 500, 650–657. [Google Scholar] [CrossRef]
- Xin, H.; Herrmann, A.; Reckamp, K.; Zhang, W.; Pal, S.; Hedvat, M.; Zhang, C.; Liang, W.; Scuto, A.; Weng, S.; et al. Antiangiogenic and antimetastatic activity of JAK inhibitor AZD1480. Cancer Res. 2011, 71, 6601–6610. [Google Scholar] [CrossRef]
- Li, S.; Priceman, S.J.; Xin, H.; Zhang, W.; Deng, J.; Liu, Y.; Huang, J.; Zhu, W.; Chen, M.; Hu, W.; et al. Icaritin inhibits JAK/STAT3 signaling and growth of renal cell carcinoma. PLoS ONE 2013, 8, e81657. [Google Scholar] [CrossRef]
- Myatt, S.S.; Lam, E.W. The emerging roles of forkhead box (Fox) proteins in cancer. Nat. Rev. Cancer 2007, 7, 847–859. [Google Scholar] [CrossRef]
- Cho, E.C.; Kuo, M.L.; Liu, X.; Yang, L.; Hsieh, Y.C.; Wang, J.; Cheng, Y.; Yen, Y. Tumor suppressor FOXO3 regulates ribonucleotide reductase subunit RRM2B and impacts on survival of cancer patients. Oncotarget 2014, 5, 4834–4844. [Google Scholar] [CrossRef] [Green Version]
- Wu, C.; Jin, B.; Chen, L.; Zhuo, D.; Zhang, Z.; Gong, K.; Mao, Z. MiR-30d induces apoptosis and is regulated by the Akt/FOXO pathway in renal cell carcinoma. Cell Signal 2013, 25, 1212–1221. [Google Scholar] [CrossRef]
- Hu, M.C.; Lee, D.F.; Xia, W.; Golfman, L.S.; Ou-Yang, F.; Yang, J.Y.; Zou, Y.; Bao, S.; Hanada, N.; Saso, H.; et al. IkappaB kinase promotes tumorigenesis through inhibition of forkhead FOXO3a. Cell 2004, 117, 225–237. [Google Scholar] [CrossRef]
- Bulow, M.H.; Bulow, T.R.; Hoch, M.; Pankratz, M.J.; Junger, M.A. Src tyrosine kinase signaling antagonizes nuclear localization of FOXO and inhibits its transcription factor activity. Sci. Rep. 2014, 4, 4048. [Google Scholar] [CrossRef] [Green Version]
- Ahn, J.S.; Li, J.; Chen, E.; Kent, D.G.; Park, H.J.; Green, A.R. JAK2V617F mediates resistance to DNA damage-induced apoptosis by modulating FOXO3A localization and Bcl-xL deamidation. Oncogene 2016, 35, 2235–2246. [Google Scholar] [CrossRef]
- Ma, W.; Fuentes, G.; Shi, X.; Verma, C.; Radda, G.K.; Han, W. FoxO1 negatively regulates leptin-induced POMC transcription through its direct interaction with STAT3. Biochem. J. 2015, 466, 291–298. [Google Scholar] [CrossRef]
- Oh, H.M.; Yu, C.R.; Dambuza, I.; Marrero, B.; Egwuagu, C.E. STAT3 protein interacts with Class O Forkhead transcription factors in the cytoplasm and regulates nuclear/cytoplasmic localization of FoxO1 and FoxO3a proteins in CD4(+) T cells. J. Biol. Chem. 2012, 287, 30436–30443. [Google Scholar] [CrossRef]
- Kim, K.M.; Hussein, U.K.; Bae, J.S.; Park, S.H.; Kwon, K.S.; Ha, S.H.; Park, H.S.; Lee, H.; Chung, M.J.; Moon, W.S.; et al. The expression patterns of FAM83H and PANX2 are associated with shorter survival of clear cell renal cell carcinoma patients. Front. Oncol. 2019, 9, 14. [Google Scholar] [CrossRef]
- Moch, H.; Humphrey, P.A.; Ulbright, T.M. Who Classification of Tumours of the Urinaryt System and Male Genital Organs, 4th ed.; World Health Organization: Washington, DC, USA, 2016. [Google Scholar]
- Amin, M.B.; Edge, S.B.; Gress, D.M.; Meyer, L.R. AJCC Cancer Staging Manual, 8th ed.; American Joint Committee on Cancer, Springer: Chicago, IL, USA, 2017; p. e1024. [Google Scholar]
- Allred, D.; Harvey, J.M.; Berardo, M.; Clark, G.M. Prognostic and predictive factors in breast cancer by immunohistochemical analysis. Mod. Pathol. 1998, 11, 155–168. [Google Scholar]
- Kim, K.M.; Hussein, U.K.; Park, S.H.; Kang, M.A.; Moon, Y.J.; Zhang, Z.; Song, Y.; Park, H.S.; Bae, J.S.; Park, B.H.; et al. FAM83H is involved in stabilization of beta-catenin and progression of osteosarcomas. J. Exp. Clin. Cancer Res. 2019, 38, 267. [Google Scholar] [CrossRef]
- Park, H.J.; Bae, J.S.; Kim, K.M.; Moon, Y.J.; Park, S.H.; Ha, S.H.; Hussein, U.K.; Zhang, Z.; Park, H.S.; Park, B.H.; et al. The PARP inhibitor olaparib potentiates the effect of the DNA damaging agent doxorubicin in osteosarcoma. J. Exp. Clin. Cancer Res. 2018, 37, 107. [Google Scholar] [CrossRef]
- Anaya, J. OncoLnc: Linking TCGA survival data to mRNAs, miRNAs, and lncRNAs. PeerJ Comp. Sci. 2016, 2, e67. [Google Scholar] [CrossRef]


| Characteristics | No. | IL4Rα | p | IL13Rα | p | IL4Rα/IL13Rα1 Pattern | p | ||
|---|---|---|---|---|---|---|---|---|---|
| Positive | Positive | −/−, +/−, −/+ | +/+ | ||||||
| Sex | Male | 140 | 67 (48%) | 0.251 | 56 (40%) | 0.206 | 101 (72%) | 39 (28%) | 0.393 |
| Female | 59 | 23 (39%) | 18 (31%) | 46 (78%) | 13 (22%) | ||||
| Age, y | ≤55 | 81 | 30 (37%) | 0.054 | 27 (33%) | 0.352 | 68 (84%) | 13 (16%) | 0.007 |
| >55 | 118 | 60 (51%) | 47 (40%) | 79 (67%) | 39 (33%) | ||||
| Tumor size, cm | ≤7 | 168 | 73 (43%) | 0.242 | 58 (35%) | 0.070 | 129 (77%) | 39 (23%) | 0.029 |
| >7 | 31 | 17 (55%) | 16 (52%) | 18 (58%) | 13 (42%) | ||||
| TNM stage | I | 162 | 70 (43%) | 0.232 | 54 (33%) | 0.019 | 125 (77%) | 37 (23%) | 0.027 |
| II–IV | 37 | 20 (54%) | 20 (54%) | 22 (59%) | 15 (41%) | ||||
| LN metastasis | Absence | 197 | 88 (45%) | 0.118 | 72 (37%) | 0.065 | 147 (75%) | 50 (25%) | 0.017 |
| Presence | 2 | 2 (100%) | 2 (100%) | 0 (0%) | 2 (100%) | ||||
| Nuclear grade | 1 | 36 | 18 (50%) | 0.055 | 10 (28%) | 0.108 | 29 (81%) | 7 (19%) | 0.053 |
| 2 | 121 | 47 (39%) | 43 (36%) | 93 (77%) | 28 (23%) | ||||
| 3 and 4 | 42 | 25 (60%) | 21 (50%) | 25 (60%) | 17 (40%) | ||||
| Necrosis | Absence | 172 | 76 (44%) | 0.457 | 61 (35%) | 0.205 | 131 (76%) | 41 (24%) | 0.063 |
| Presence | 27 | 14 (52%) | 13 (48%) | 16 (59%) | 11 (41%) | ||||
| IL13Rα1 | Negative | 125 | 38 (30%) | <0.001 | |||||
| Positive | 74 | 52 (70%) | |||||||
| Characteristics | No. | CSS | RFS | ||||
|---|---|---|---|---|---|---|---|
| HR | 95% CI | p | HR | 95% CI | p | ||
| Sex, male (vs. female) | 140 | 0.281 | 0.085–0.930 | 0.038 | 0.337 | 0.131–0.864 | 0.023 |
| Age, year, >55 (vs. ≤55) | 118 | 3.603 | 1.368–9.486 | 0.009 | 2.275 | 1.104–4.688 | 0.026 |
| Tumor size, >7 cm (vs. ≤7 cm) | 31 | 3.916 | 1.833–8.366 | <0.001 | 4.755 | 2.495–9.065 | <0.001 |
| TNM stage, I (vs. II–IV) | 37 | 4.044 | 1.922–8.509 | <0.001 | 5.354 | 2.831–10.124 | <0.001 |
| LN metastasis, presence (vs. absence) | 2 | 0.049 | 0–1.4 × 10⁶ | 0.049 | 15.801 | 1.956–127.649 | 0.010 |
| Nuclear grade, 1 | 36 | 1 | 0.095 | 1 | 0.012 | ||
| 2 | 121 | 1.223 | 0.352–4.257 | 0.751 | 1.296 | 0.441–3.808 | 0.638 |
| 3 and 4 | 42 | 2.761 | 0.759–10.047 | 0.123 | 3.337 | 1.097–10.148 | 0.034 |
| Necrosis, presence (vs. absence) | 27 | 2.502 | 1.062–5.894 | 0.036 | 1.598 | 0.703–3.631 | 0.263 |
| IL4Rα positive (vs. negative) | 90 | 4.560 | 1.848–11.250 | <0.001 | 2.806 | 1.413–5.570 | 0.003 |
| IL13Rα1 positive (vs. negative) | 74 | 2.310 | 1.076–4.961 | 0.032 | 2.260 | 1.185–4.314 | 0.013 |
| IL4Rα/IL13Rα1, +/+ (vs. −/−, −/+, or +/−) | 52 | 3.748 | 1.771–7.933 | <0.001 | 3.467 | 1.833–6.557 | <0.001 |
| Characteristics | CSS | RFS | ||||
|---|---|---|---|---|---|---|
| HR | 95% CI | p | HR | 95% CI | p | |
| Model 1 * | ||||||
| TNM stage, I (vs. I–IV) | 3.603 | 1.706–7.607 | <0.001 | 5.246 | 2.773–9.925 | <0.001 |
| Necrosis, presence (vs. absence) | 2.407 | 1.003–5.777 | 0.049 | |||
| IL4Rα positive (vs. negative) | 4.334 | 1.753–10.713 | 0.001 | 2.727 | 1.372–5.422 | 0.004 |
| Model 2 ** | ||||||
| TNM stage, I (vs. II–IV) | 3.507 | 1.656–7.423 | 0.001 | 4.961 | 2.617–9.404 | <0.001 |
| IL4Rα/IL13Rα1, +/+ (vs. −/−, −/+, or +/−) | 3.286 | 1.542–7.000 | 0.002 | 3.158 | 1.662–6.000 | <0.001 |
© 2019 by the authors. Licensee MDPI, Basel, Switzerland. This article is an open access article distributed under the terms and conditions of the Creative Commons Attribution (CC BY) license (http://creativecommons.org/licenses/by/4.0/).
Share and Cite
Kang, M.-A.; Lee, J.; Ha, S.H.; Lee, C.M.; Kim, K.M.; Jang, K.Y.; Park, S.-H. Interleukin4Rα (IL4Rα) and IL13Rα1 Are Associated with the Progress of Renal Cell Carcinoma through Janus Kinase 2 (JAK2)/Forkhead Box O3 (FOXO3) Pathways. Cancers 2019, 11, 1394. https://doi.org/10.3390/cancers11091394
Kang M-A, Lee J, Ha SH, Lee CM, Kim KM, Jang KY, Park S-H. Interleukin4Rα (IL4Rα) and IL13Rα1 Are Associated with the Progress of Renal Cell Carcinoma through Janus Kinase 2 (JAK2)/Forkhead Box O3 (FOXO3) Pathways. Cancers. 2019; 11(9):1394. https://doi.org/10.3390/cancers11091394
Chicago/Turabian StyleKang, Mi-Ae, Jongsung Lee, Sang Hoon Ha, Chang Min Lee, Kyoung Min Kim, Kyu Yun Jang, and See-Hyoung Park. 2019. "Interleukin4Rα (IL4Rα) and IL13Rα1 Are Associated with the Progress of Renal Cell Carcinoma through Janus Kinase 2 (JAK2)/Forkhead Box O3 (FOXO3) Pathways" Cancers 11, no. 9: 1394. https://doi.org/10.3390/cancers11091394