TIMP-1-Mediated Chemoresistance via Induction of IL-6 in NSCLC

 , and
, and 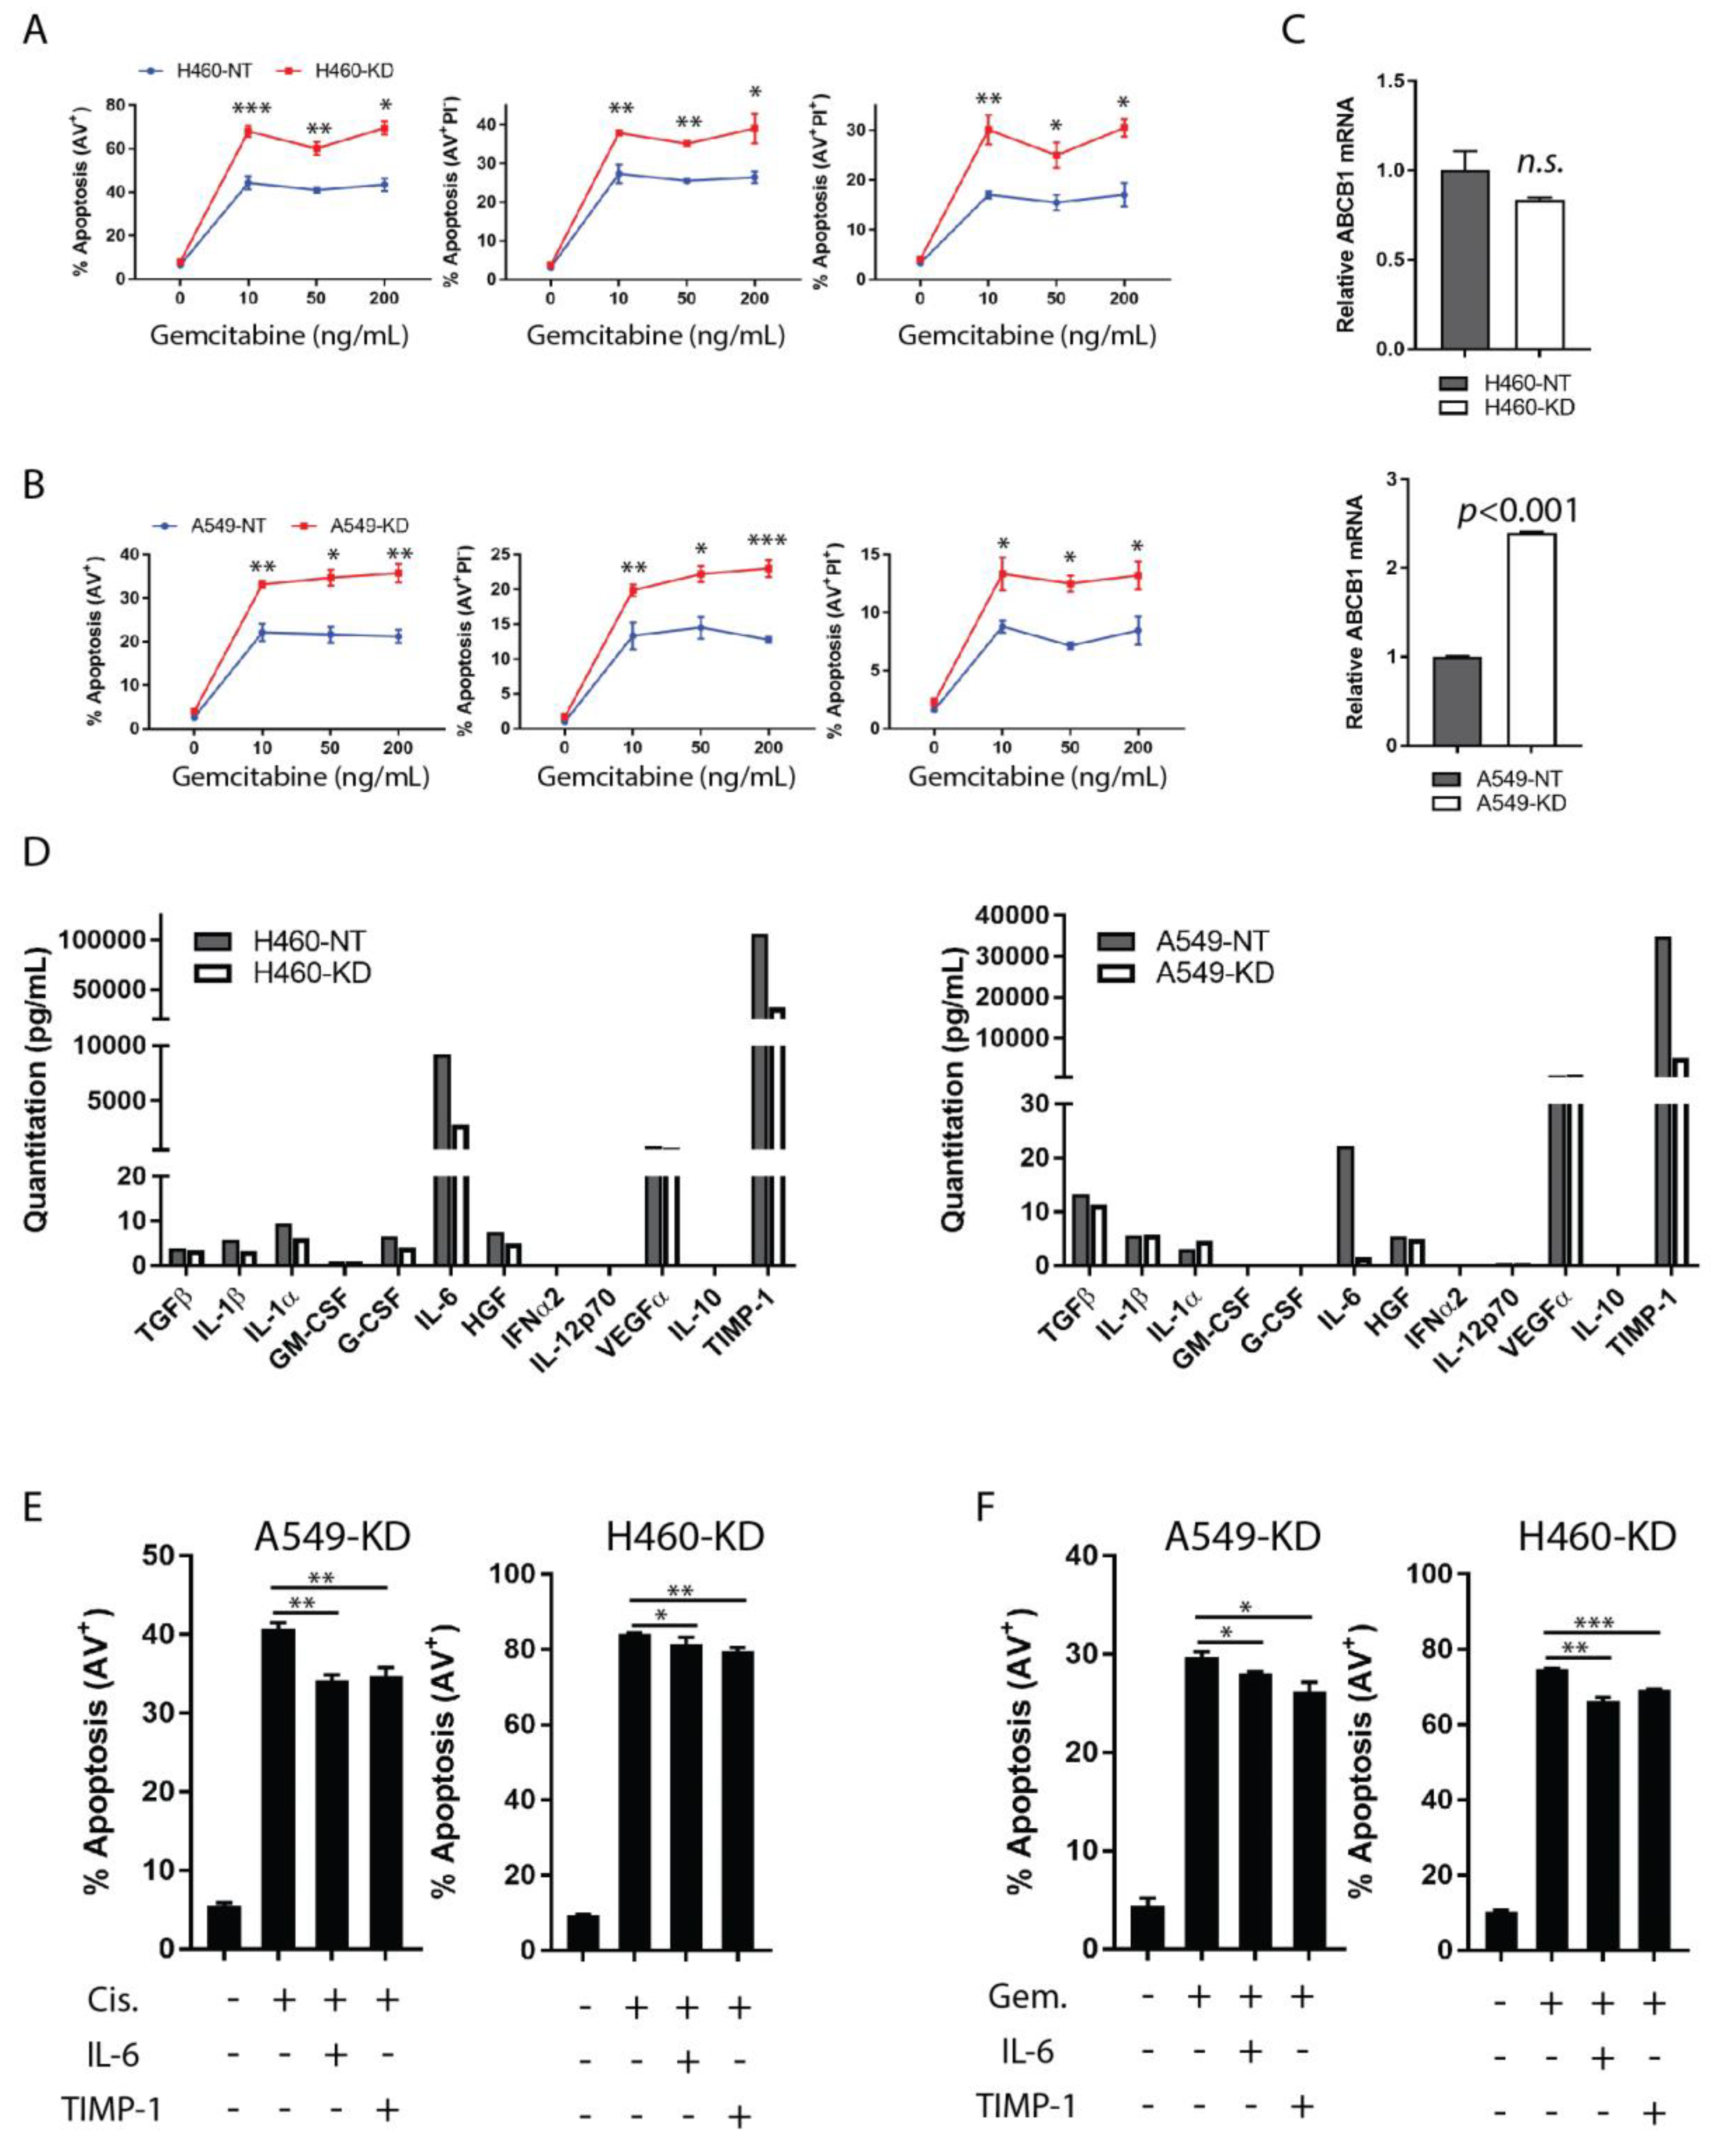
Abstract
:1. Introduction
2. Materials and Methods
2.1. Cell Culture
2.2. Preparation of Conditioned Media (CM)
2.3. Real-Time Quantitative RT-PCR (qRT-PCR)
2.4. Immunoblotting
2.5. Apoptosis Assay
2.6. ELISA
2.7. Bead-Based Cytokine Immunoassay
2.8. TCGA Analysis
2.9. Statistical Analysis
3. Results
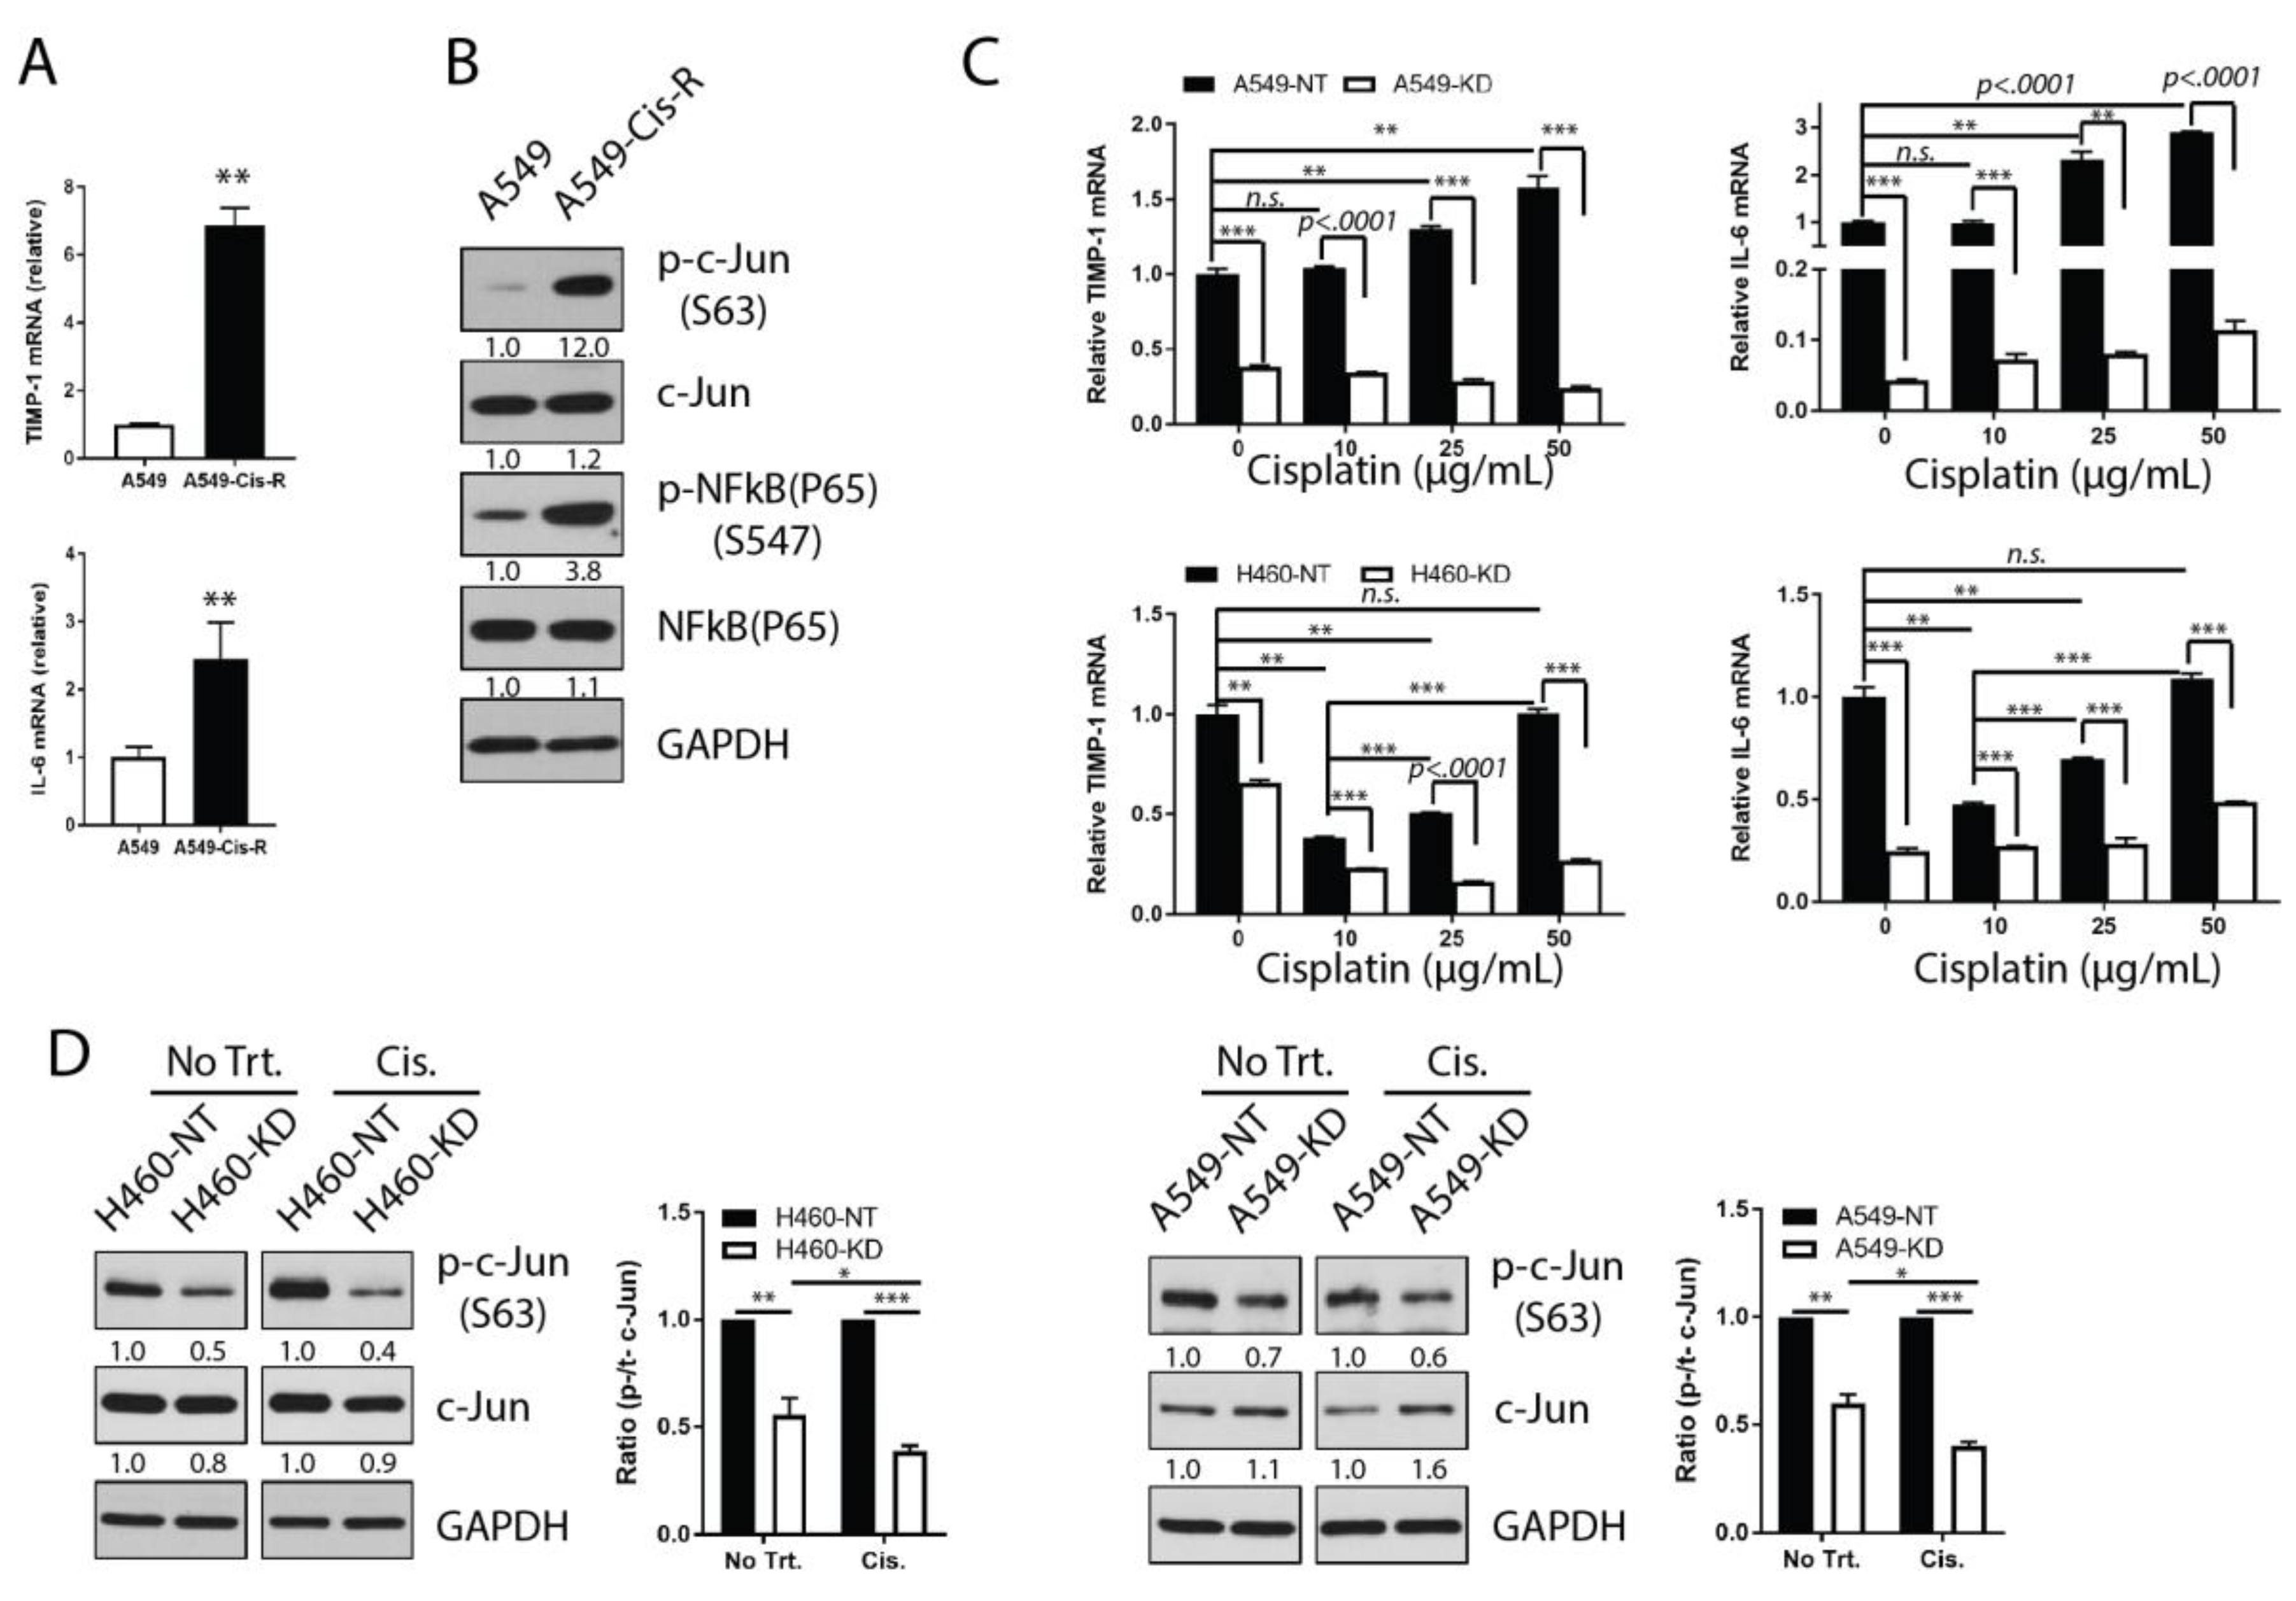
3.1. IL-6 Is a Determinant in TIMP-1-Mediated Chemoresistance
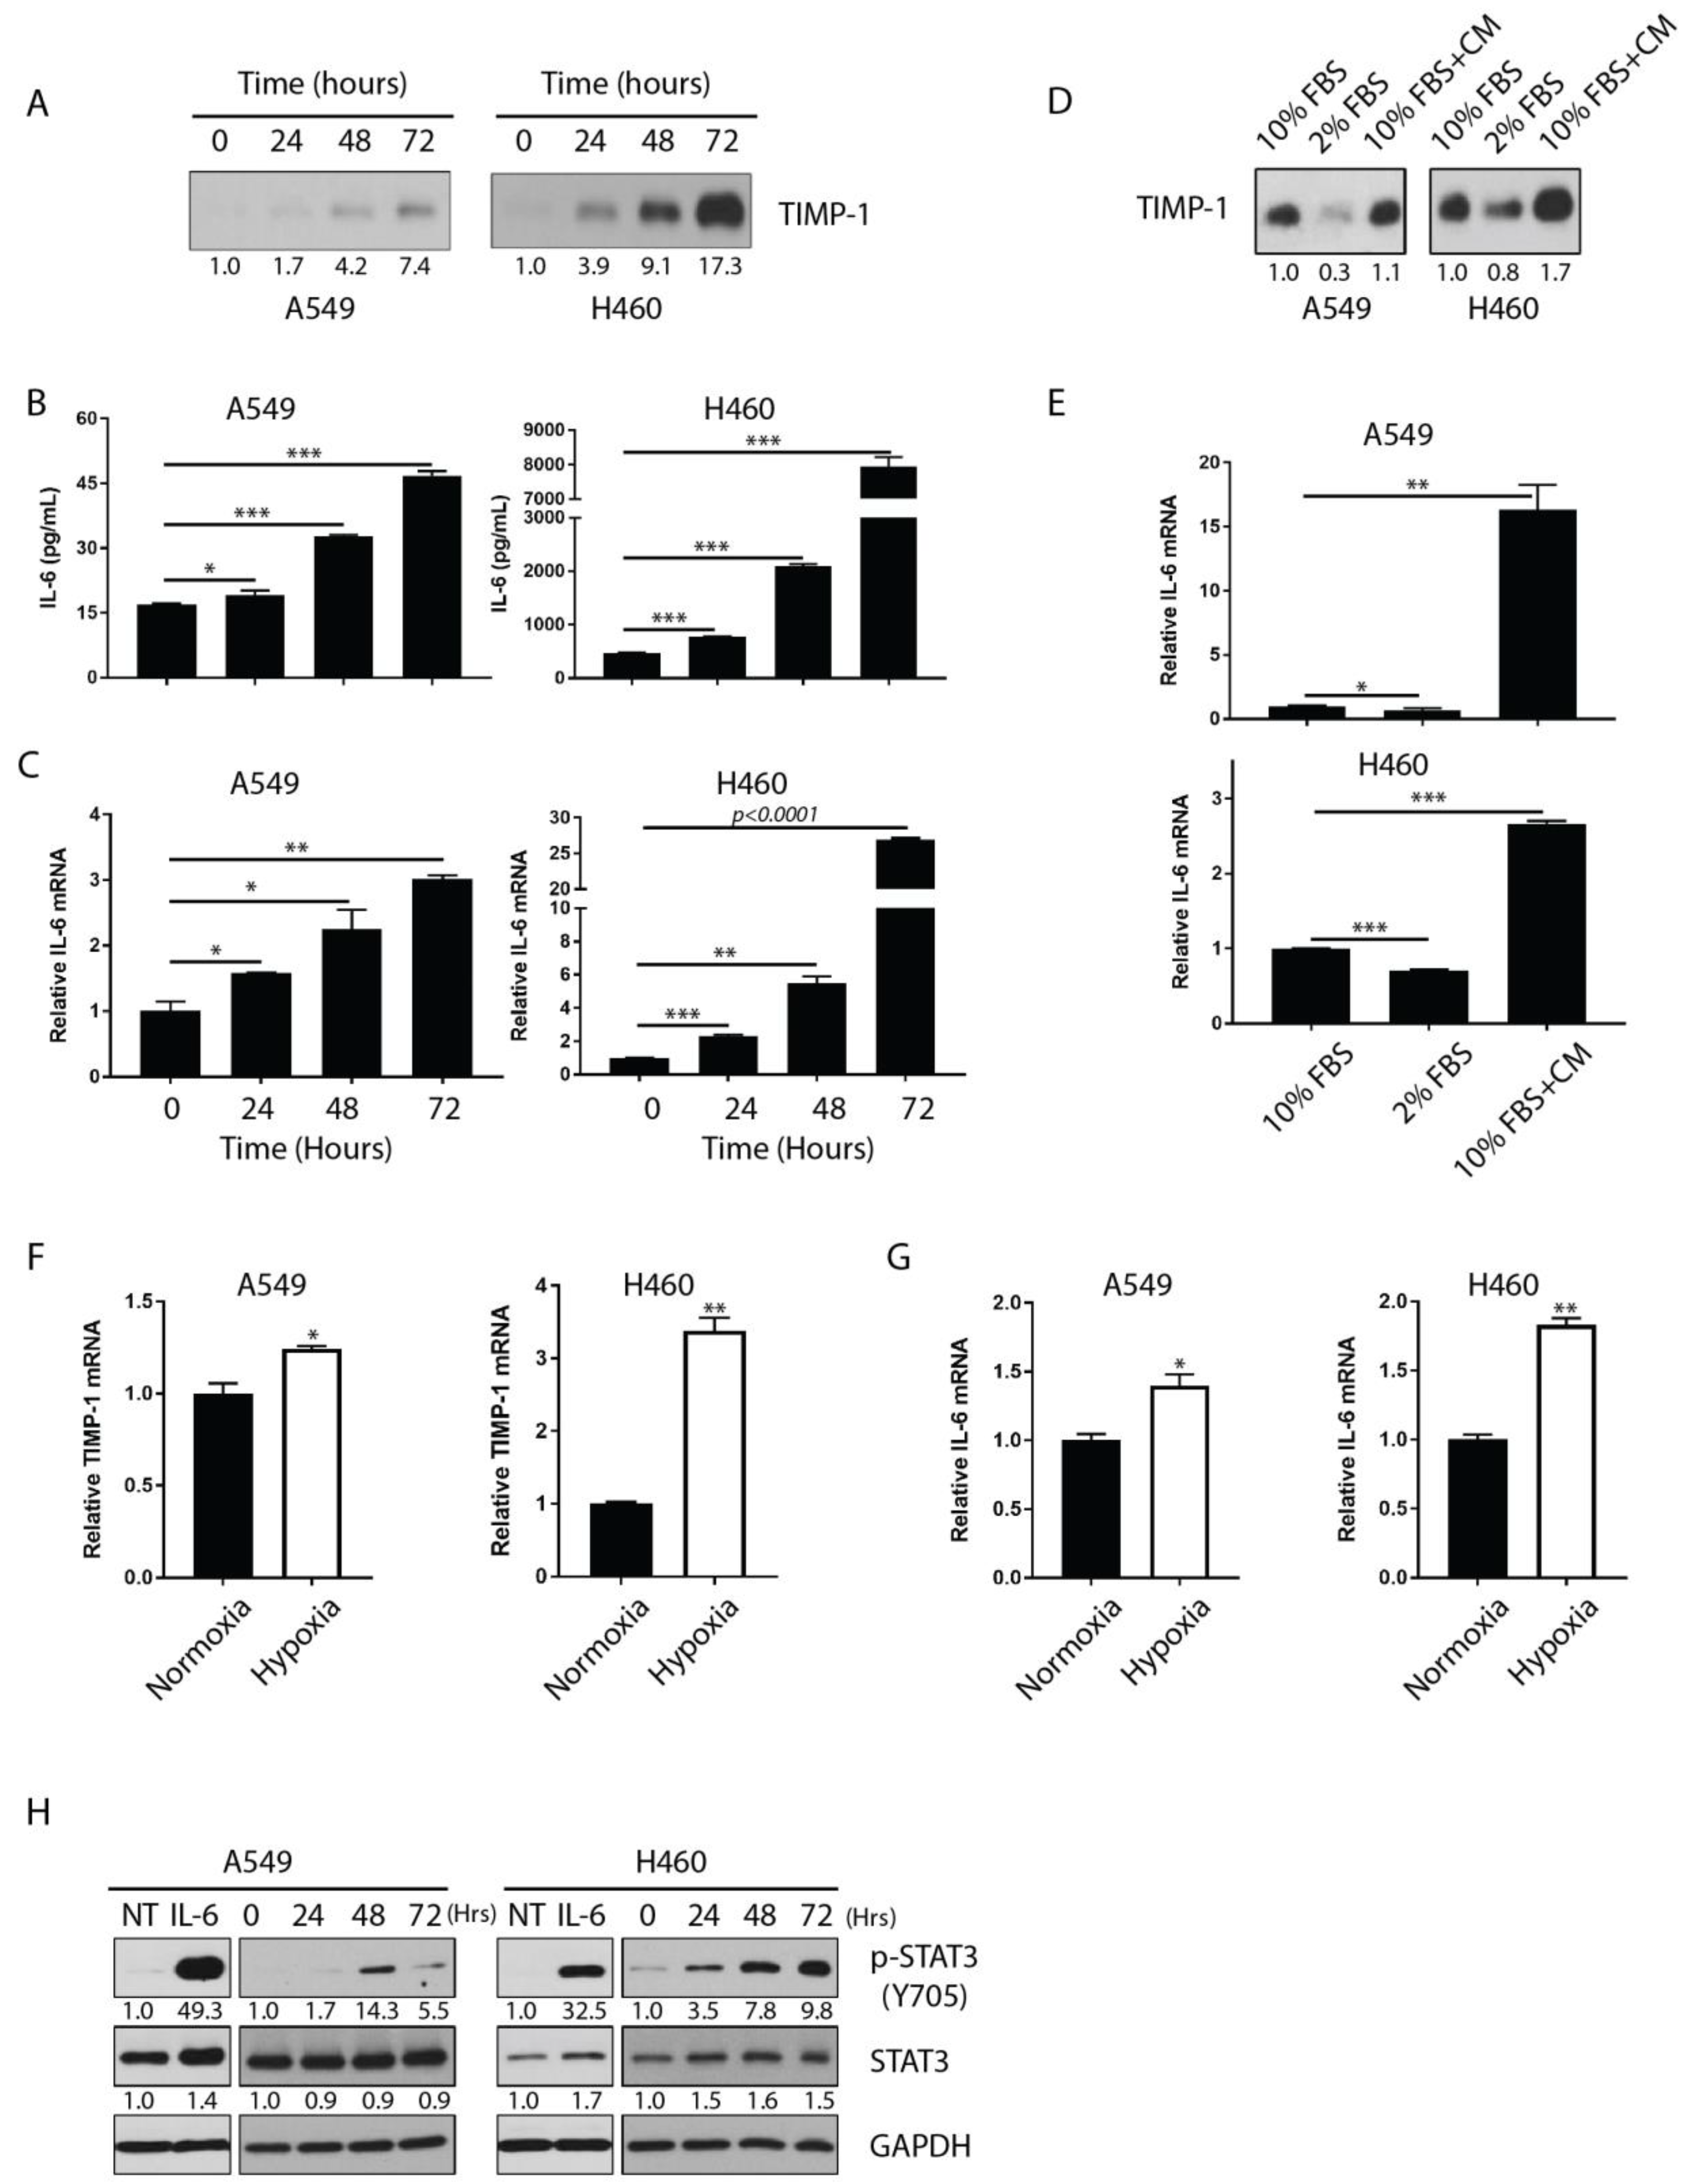
3.2. IL-6 Expression Correlates Closely with TIMP-1 Kinetics
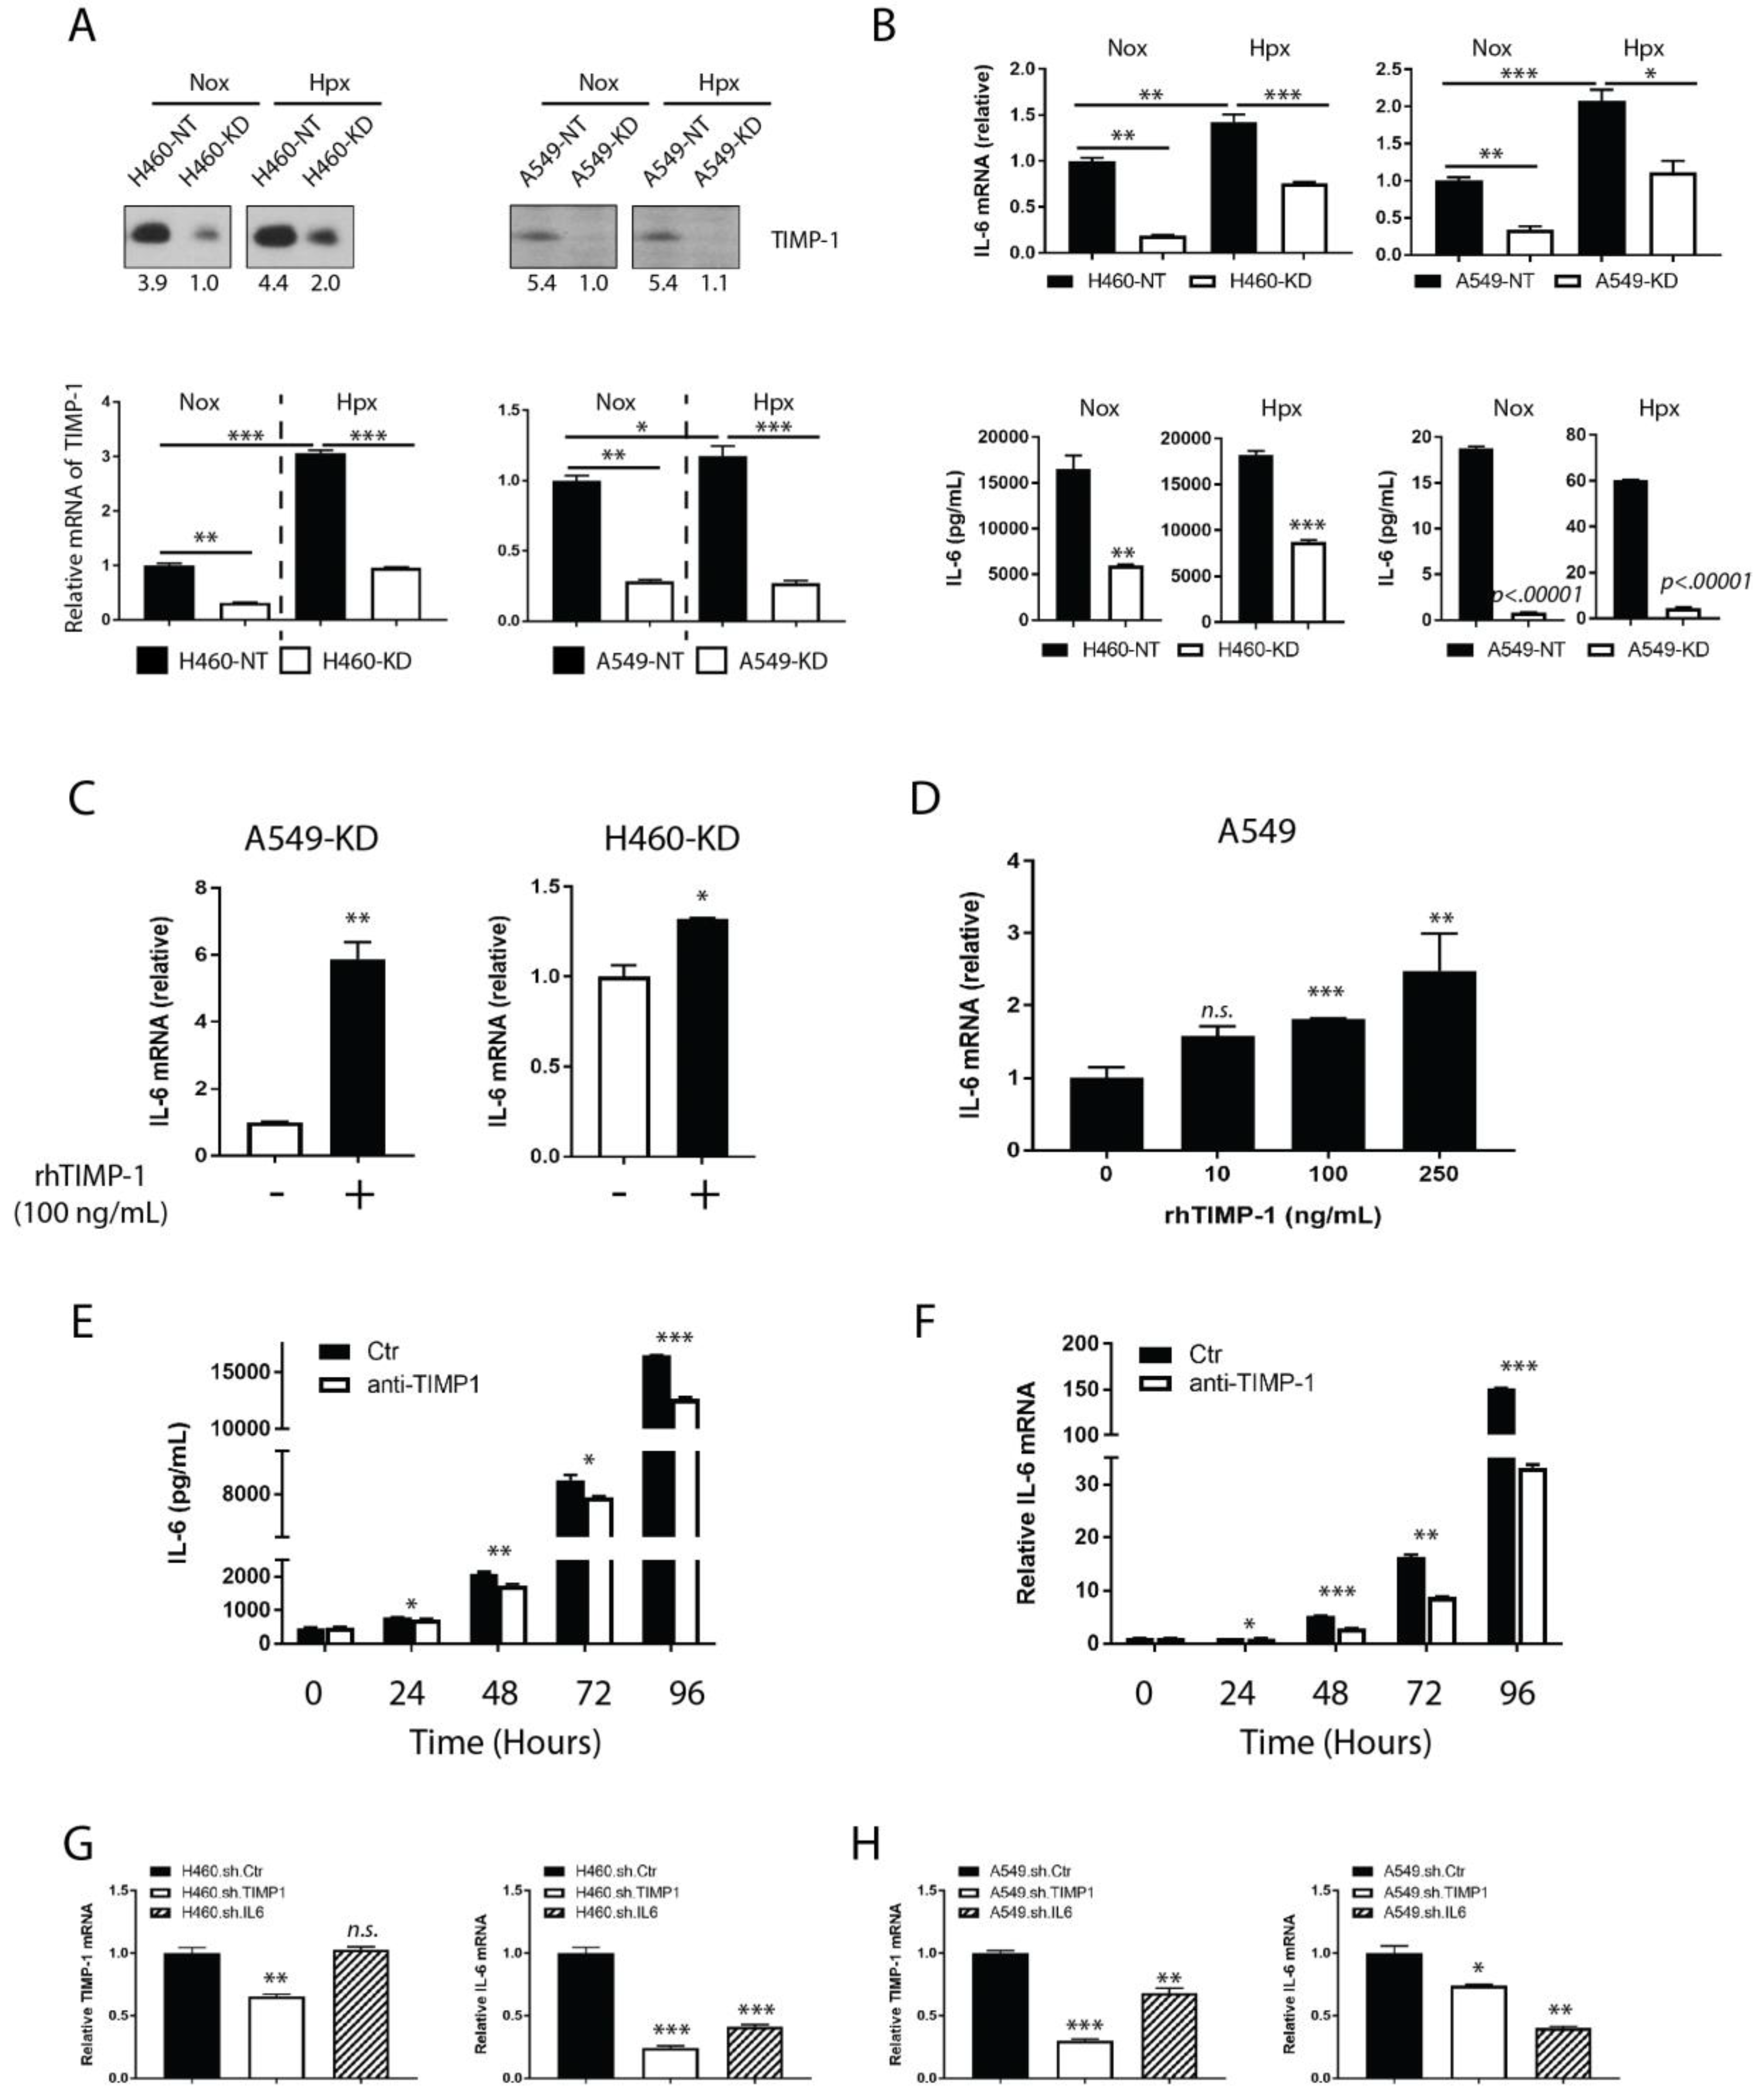
3.3. TIMP-1 Regulates IL-6 Expression in NSCLCs
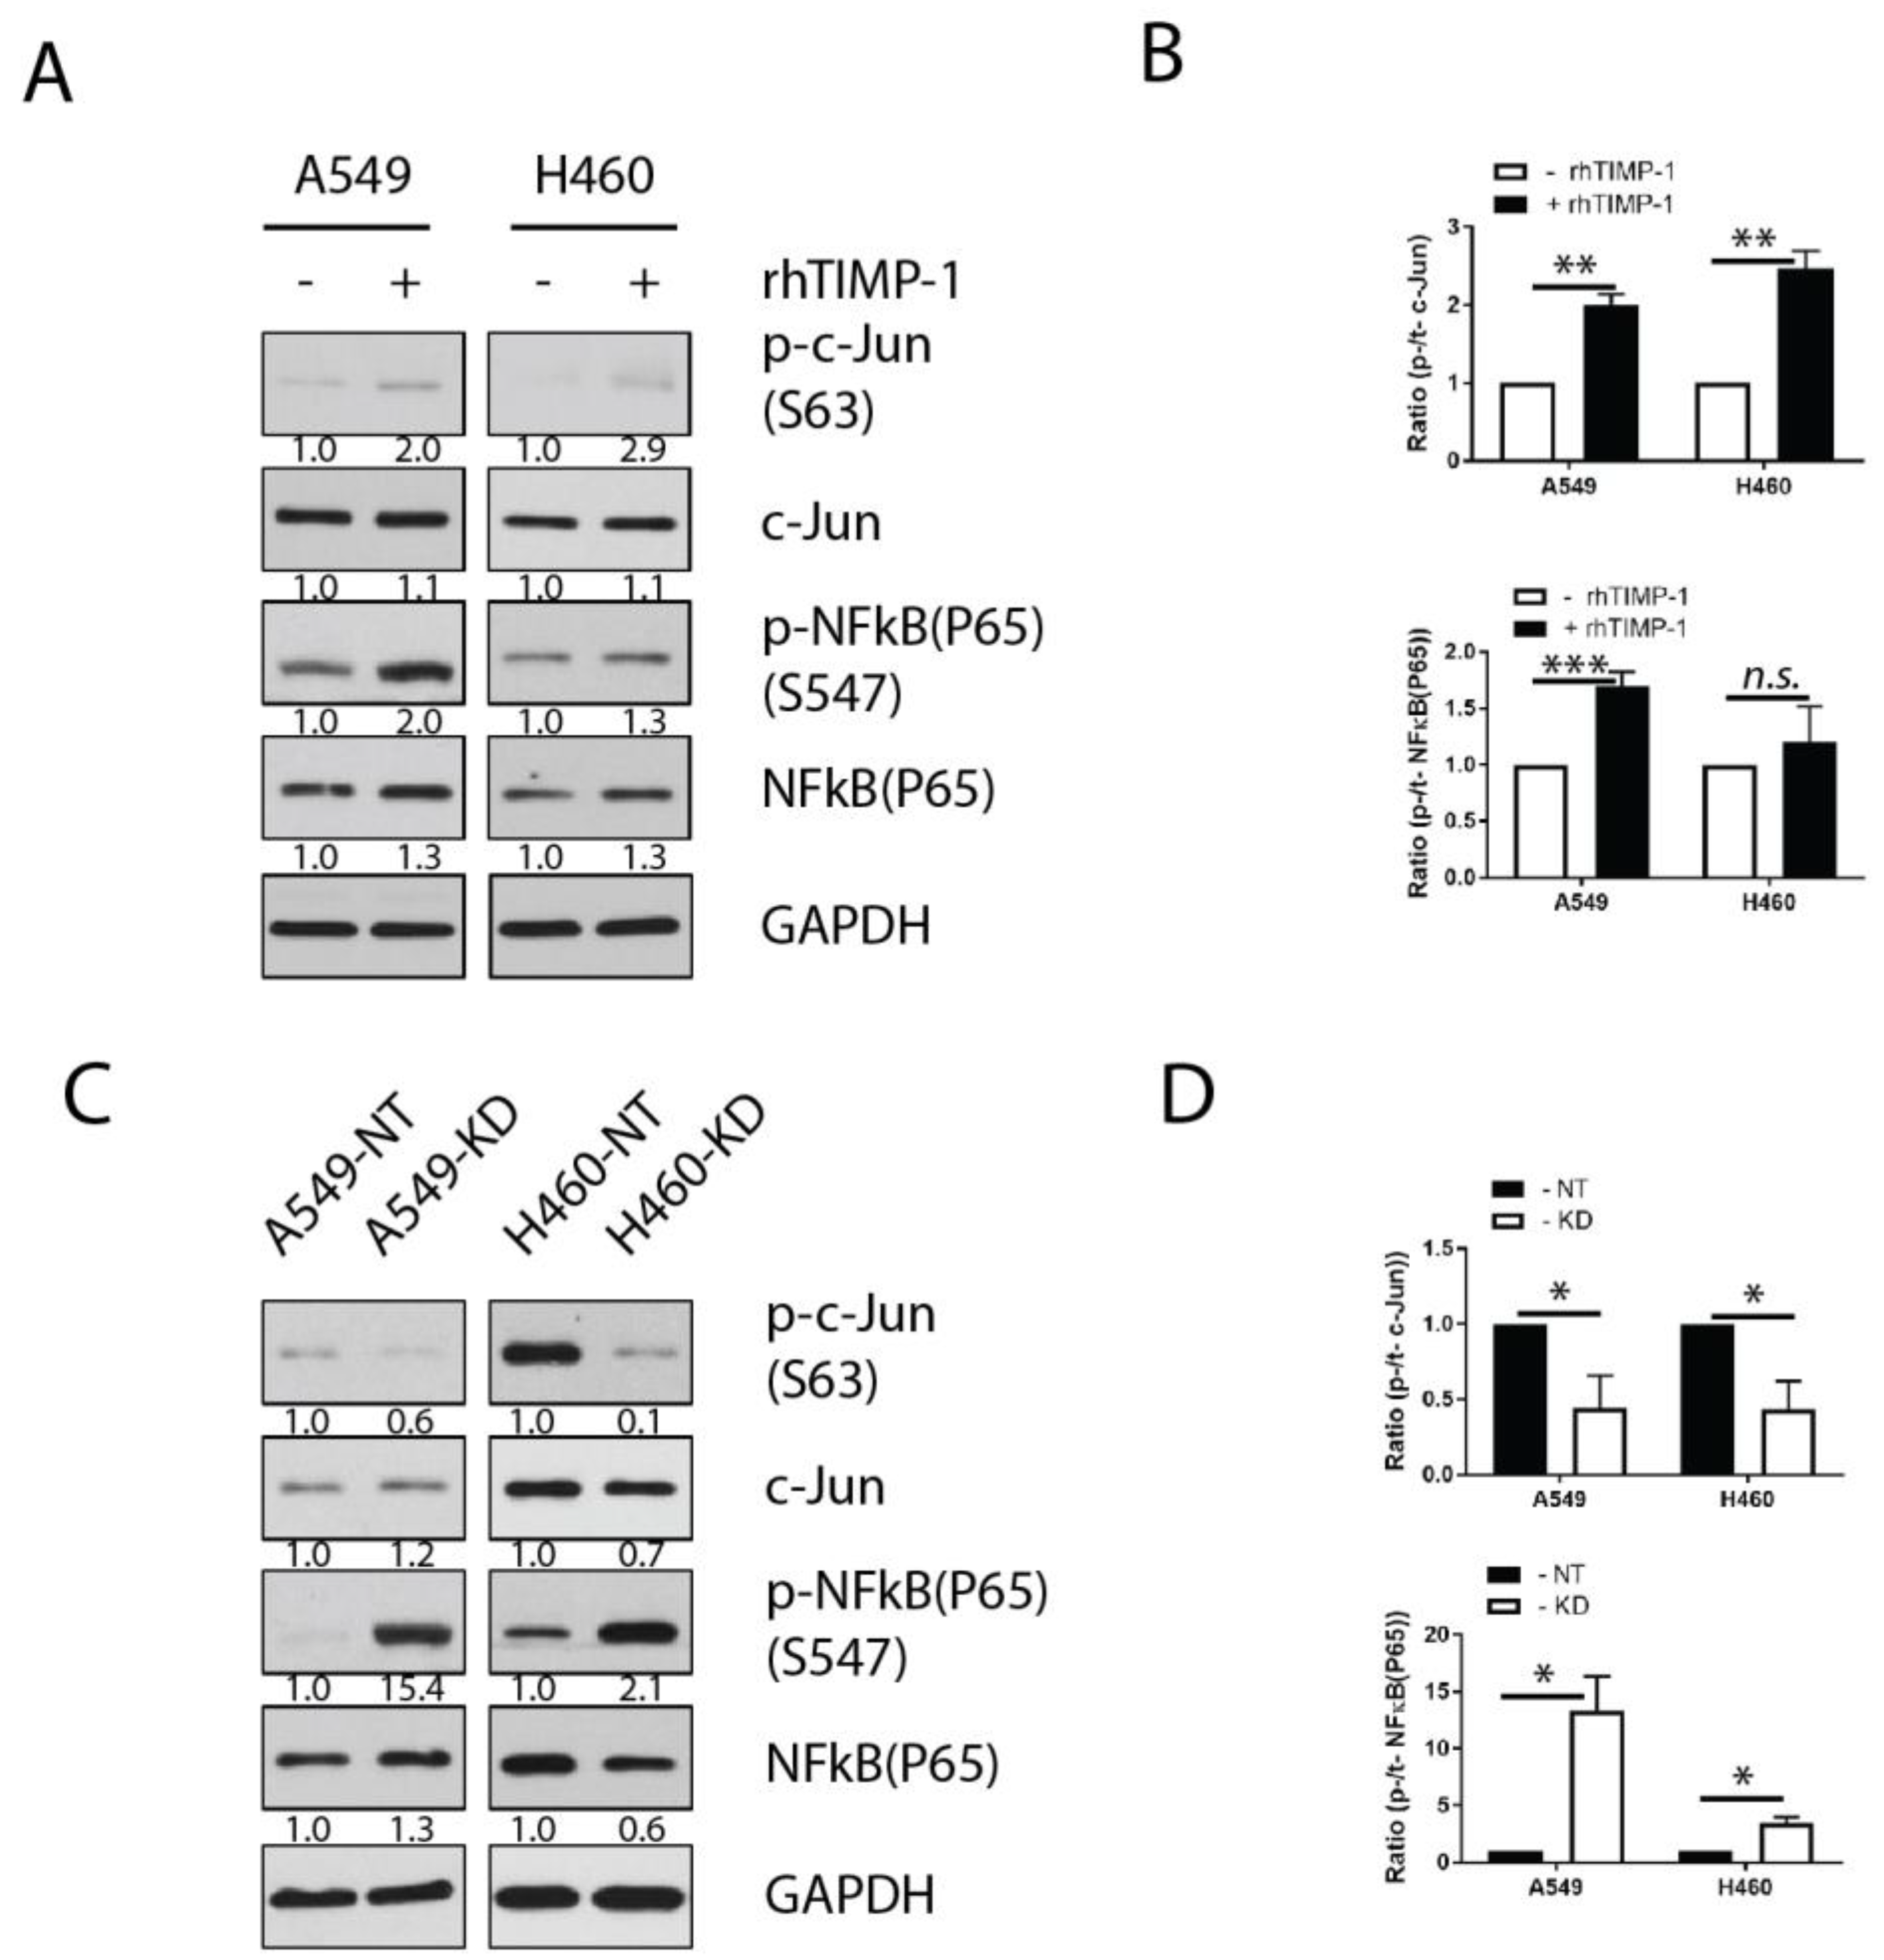
3.4. Involvement of Transcription Factor AP-1 in the TIMP-1 Regulation of IL-6
3.5. Chemoresistant NSCLC Cells Upregulate TIMP-1 and IL-6 and THEIR Transcriptional Activity
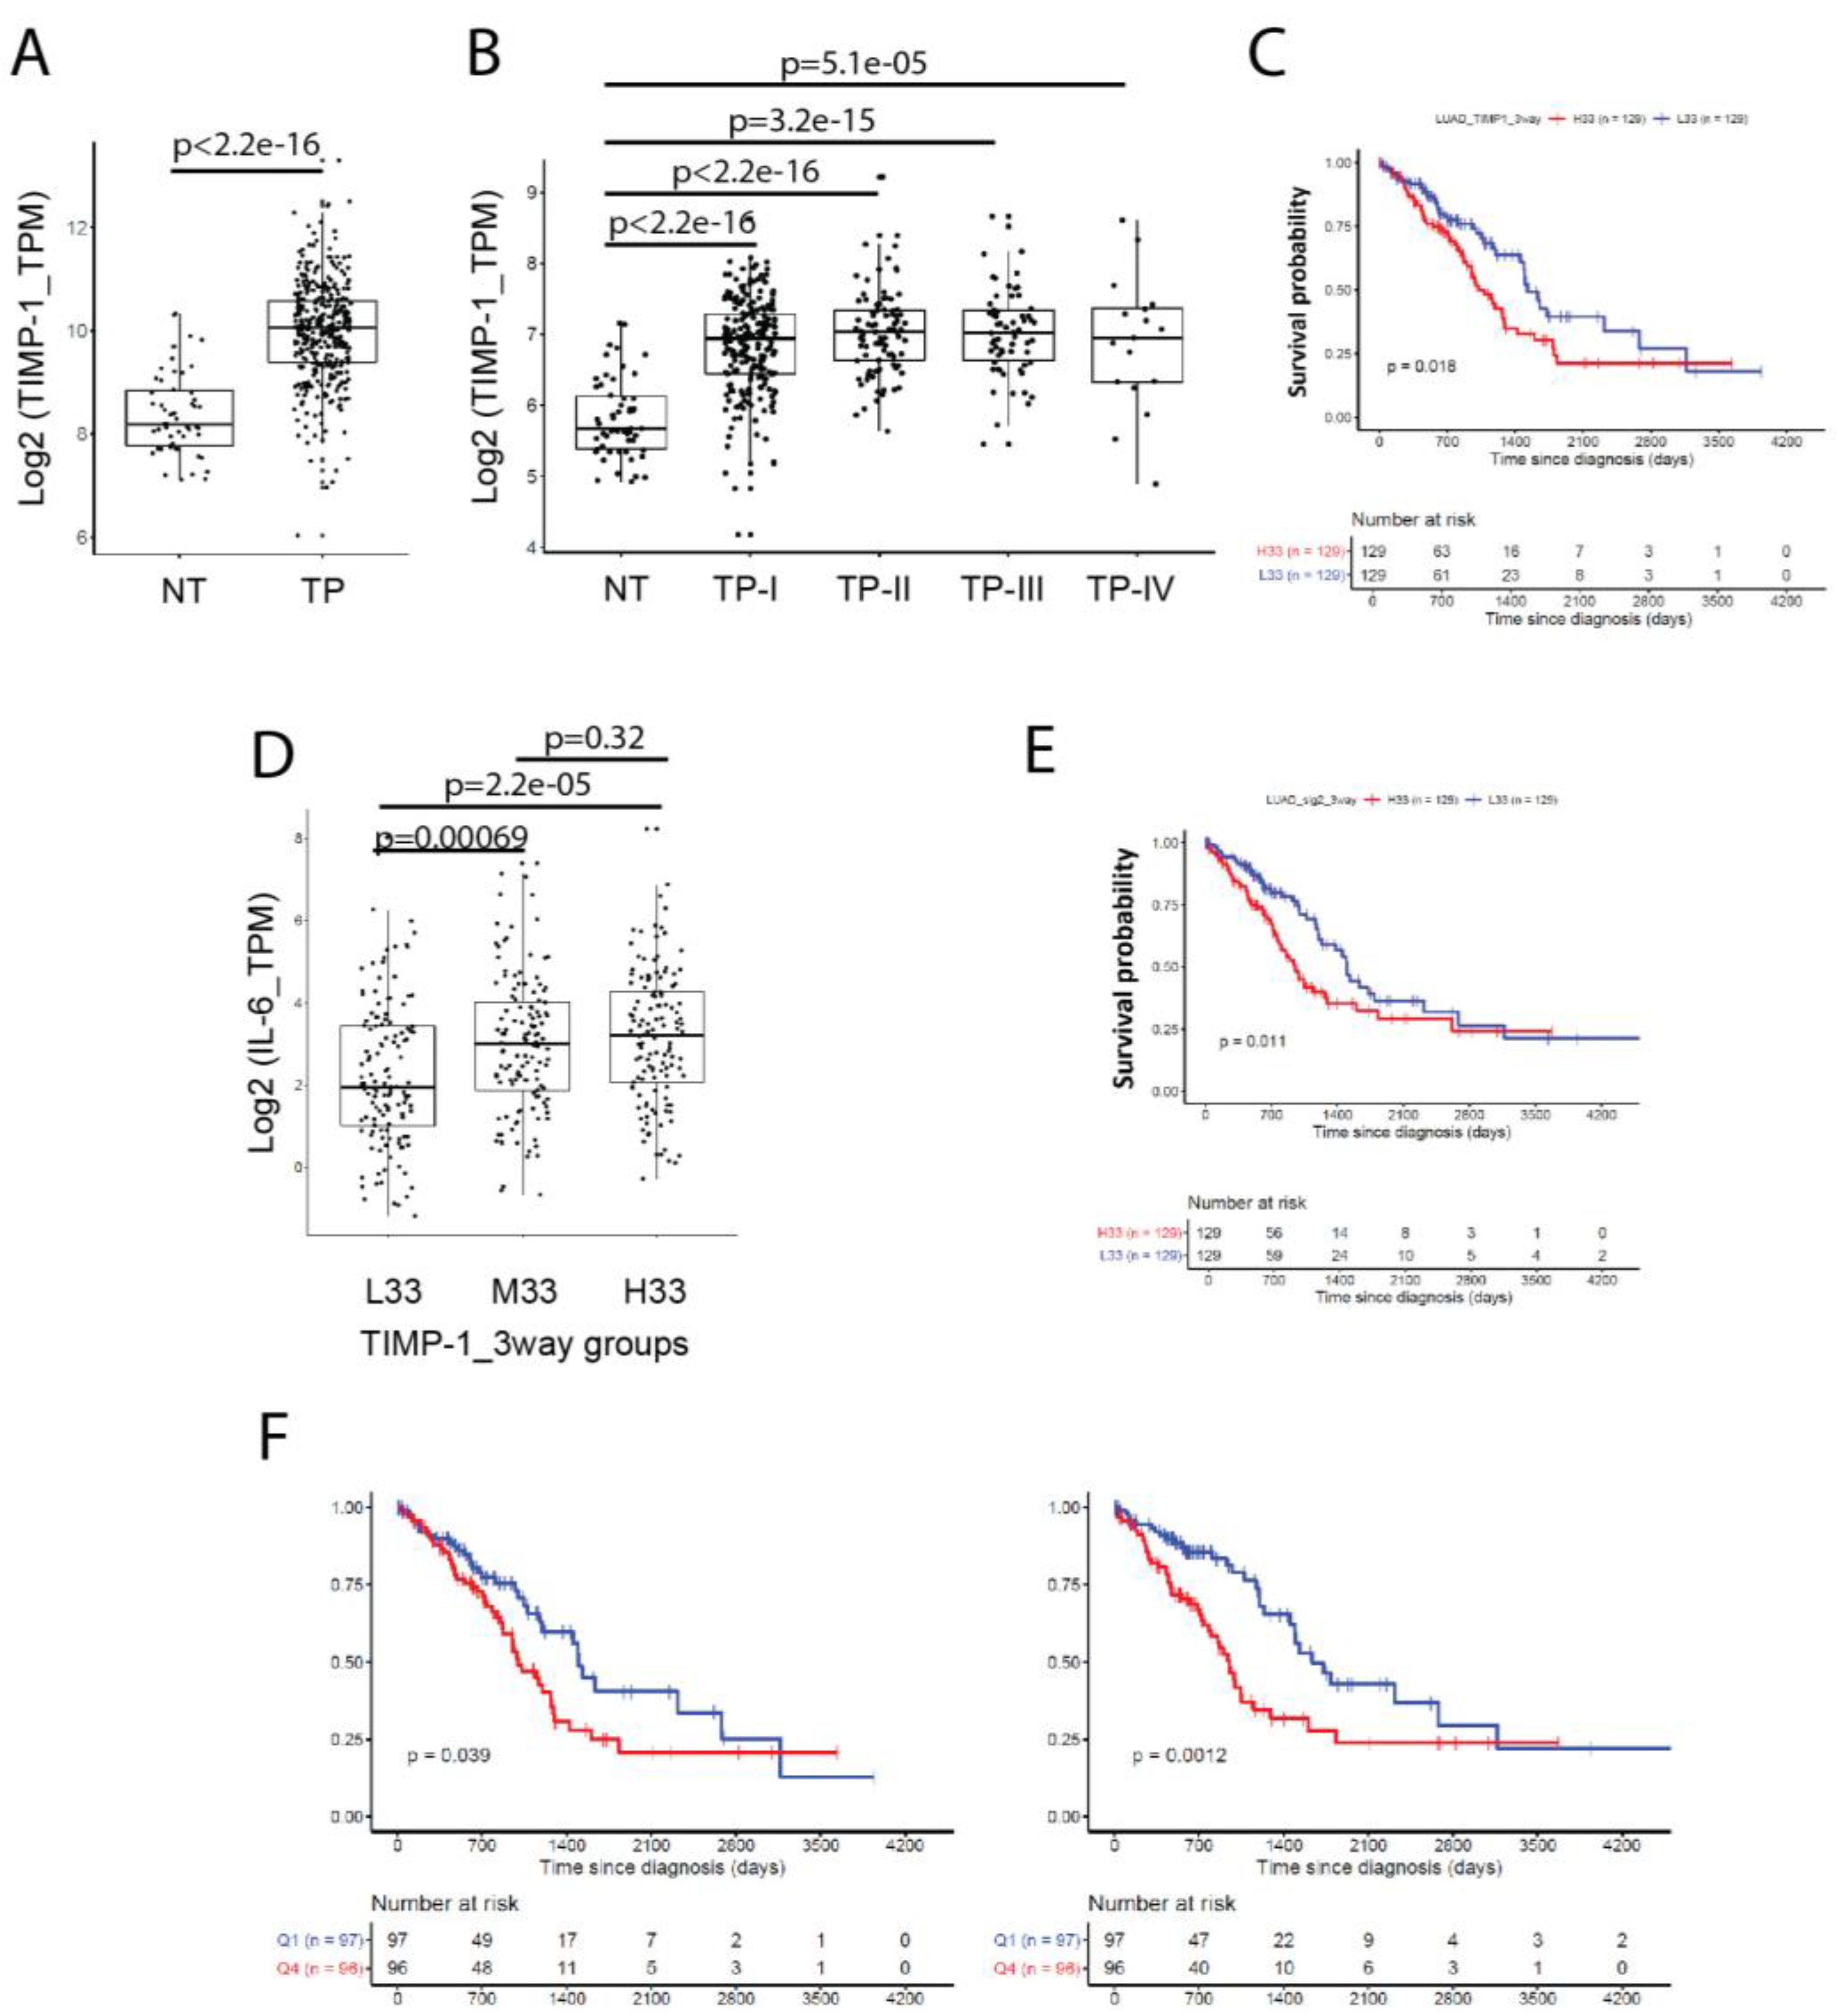
3.6. Co-Expression of TIMP-1 and IL-6 Inversely Correlates with the Survival of NSCLC Patients
4. Discussion
5. Conclusions
Supplementary Materials
Author Contributions
Funding
Acknowledgments
Conflicts of Interest
References
- Siegel, R.L.; Miller, K.D.; Jemal, A. Cancer statistics, 2019. CA Cancer J. Clin. 2019, 69, 7–34. [Google Scholar] [CrossRef]
- Bray, F.; Ferlay, J.; Soerjomataram, I.; Siegel, R.L.; Torre, L.A.; Jemal, A. Global cancer statistics 2018: GLOBOCAN estimates of incidence and mortality worldwide for 36 cancers in 185 countries. CA Cancer J. Clin. 2018, 68, 394–424. [Google Scholar] [CrossRef] [Green Version]
- Yoon, S.M.; Shaikh, T.; Hallman, M. Therapeutic management options for stage III non-small cell lung cancer. World J. Clin. Oncol. 2017, 8, 1–20. [Google Scholar] [CrossRef]
- Fennell, D.A.; Summers, Y.; Cadranel, J.; Benepal, T.; Christoph, D.C.; Lal, R.; Das, M.; Maxwell, F.; Visseren-Grul, C.; Ferry, D. Cisplatin in the modern era: The backbone of first-line chemotherapy for non-small cell lung cancer. Cancer Treat. Rev. 2016, 44, 42–50. [Google Scholar] [CrossRef]
- Jackson, H.W.; Defamie, V.; Waterhouse, P.; Khokha, R. TIMPs: Versatile extracellular regulators in cancer. Nat. Rev. Cancer 2017, 17, 38–53. [Google Scholar] [CrossRef]
- Ylisirnio, S.; Hoyhtya, M.; Turpeenniemi-Hujanen, T. Serum matrix metalloproteinases -2, -9 and tissue inhibitors of metalloproteinases -1, -2 in lung cancer--TIMP-1 as a prognostic marker. Anticancer Res. 2000, 20, 1311–1316. [Google Scholar]
- Rojiani, M.V.; Ghoshal-Gupta, S.; Kutiyanawalla, A.; Mathur, S.; Rojiani, A.M. TIMP-1 overexpression in lung carcinoma enhances tumor kinetics and angiogenesis in brain metastasis. J. Neuropathol. Exp. Neurol. 2015, 74, 293–304. [Google Scholar] [CrossRef]
- Kolenda, J.; Jensen, S.S.; Aaberg-Jessen, C.; Christensen, K.; Andersen, C.; Brunner, N.; Kristensen, B.W. Effects of hypoxia on expression of a panel of stem cell and chemoresistance markers in glioblastoma-derived spheroids. J. Neurooncol. 2011, 103, 43–58. [Google Scholar] [CrossRef]
- Nalluri, S.; Ghoshal-Gupta, S.; Kutiyanawalla, A.; Gayatri, S.; Lee, B.R.; Jiwani, S.; Rojiani, A.M.; Rojiani, M.V. TIMP-1 Inhibits Apoptosis in Lung Adenocarcinoma Cells via Interaction with Bcl-2. PLoS ONE 2015, 10, e0137673. [Google Scholar] [CrossRef]
- Ghoshal-Gupta, S.; Kutiyanawalla, A.; Lee, B.R.; Ojha, J.; Nurani, A.; Mondal, A.K.; Kolhe, R.; Rojiani, A.M.; Rojiani, M.V. TIMP-1 downregulation modulates miR-125a-5p expression and triggers the apoptotic pathway. Oncotarget 2018, 9, 8941–8956. [Google Scholar] [CrossRef] [Green Version]
- Senthebane, D.A.; Rowe, A.; Thomford, N.E.; Shipanga, H.; Munro, D.; Mazeedi, M.; Almazyadi, H.A.M.; Kallmeyer, K.; Dandara, C.; Pepper, M.S.; et al. The Role of Tumor Microenvironment in Chemoresistance: To Survive, Keep Your Enemies Closer. Int. J. Mol. Sci. 2017, 18, 1586. [Google Scholar] [CrossRef] [PubMed]
- Yeldag, G.; Rice, A.; Del Rio Hernandez, A. Chemoresistance and the Self-Maintaining Tumor Microenvironment. Cancers 2018, 10, 471. [Google Scholar] [CrossRef] [PubMed]
- Ghandadi, M.; Sahebkar, A. Interleukin-6: A Critical Cytokine in Cancer Multidrug Resistance. Curr. Pharm. Des. 2016, 22, 518–526. [Google Scholar] [CrossRef] [PubMed]
- Lotz, M.; Guerne, P.A. Interleukin-6 induces the synthesis of tissue inhibitor of metalloproteinases-1/erythroid potentiating activity (TIMP-1/EPA). J. Biol. Chem. 1991, 266, 2017–2020. [Google Scholar] [PubMed]
- Kossakowska, A.E.; Edwards, D.R.; Prusinkiewicz, C.; Zhang, M.C.; Guo, D.; Urbanski, S.J.; Grogan, T.; Marquez, L.A.; Janowska-Wieczorek, A. Interleukin-6 regulation of matrix metalloproteinase (MMP-2 and MMP-9) and tissue inhibitor of metalloproteinase (TIMP-1) expression in malignant non-Hodgkin’s lymphomas. Blood 1999, 94, 2080–2089. [Google Scholar] [PubMed]
- Gilbert, L.A.; Hemann, M.T. DNA damage-mediated induction of a chemoresistant niche. Cell 2010, 143, 355–366. [Google Scholar] [CrossRef]
- Xiao, W.; Ibrahim, M.L.; Redd, P.S.; Klement, J.D.; Lu, C.; Yang, D.; Savage, N.M.; Liu, K. Loss of Fas Expression and Function Is Coupled with Colon Cancer Resistance to Immune Checkpoint Inhibitor Immunotherapy. Mol. Cancer Res. 2019, 17, 420–430. [Google Scholar] [CrossRef] [PubMed]
- Colaprico, A.; Silva, T.C.; Olsen, C.; Garofano, L.; Cava, C.; Garolini, D.; Sabedot, T.S.; Malta, T.M.; Pagnotta, S.M.; Castiglioni, I.; et al. TCGAbiolinks: An R/Bioconductor package for integrative analysis of TCGA data. Nucleic Acids Res. 2016, 44, e71. [Google Scholar] [CrossRef]
- Li, B.; Ruotti, V.; Stewart, R.M.; Thomson, J.A.; Dewey, C.N. RNA-Seq gene expression estimation with read mapping uncertainty. Bioinformatics 2010, 26, 493–500. [Google Scholar] [CrossRef]
- Li, W.; Zhang, H.; Assaraf, Y.G.; Zhao, K.; Xu, X.; Xie, J.; Yang, D.H.; Chen, Z.S. Overcoming ABC transporter-mediated multidrug resistance: Molecular mechanisms and novel therapeutic drug strategies. Drug Resist. Updat 2016, 27, 14–29. [Google Scholar] [CrossRef]
- Kumari, N.; Dwarakanath, B.S.; Das, A.; Bhatt, A.N. Role of interleukin-6 in cancer progression and therapeutic resistance. Tumour Biol. 2016, 37, 11553–11572. [Google Scholar] [CrossRef] [PubMed]
- Cui, H.; Seubert, B.; Stahl, E.; Dietz, H.; Reuning, U.; Moreno-Leon, L.; Ilie, M.; Hofman, P.; Nagase, H.; Mari, B.; et al. Tissue inhibitor of metalloproteinases-1 induces a pro-tumourigenic increase of miR-210 in lung adenocarcinoma cells and their exosomes. Oncogene 2015, 34, 3640–3650. [Google Scholar] [CrossRef] [PubMed]
- O’Toole, E.A.; van Koningsveld, R.; Chen, M.; Woodley, D.T. Hypoxia induces epidermal keratinocyte matrix metalloproteinase-9 secretion via the protein kinase C pathway. J. Cell. Physiol. 2008, 214, 47–55. [Google Scholar] [CrossRef] [PubMed]
- Dendorfer, U.; Oettgen, P.; Libermann, T.A. Multiple regulatory elements in the interleukin-6 gene mediate induction by prostaglandins, cyclic AMP, and lipopolysaccharide. Mol. Cell. Biol. 1994, 14, 4443–4454. [Google Scholar] [CrossRef] [PubMed]
- Pesta, M.; Kulda, V.; Kucera, R.; Pesek, M.; Vrzalova, J.; Liska, V.; Pecen, L.; Treska, V.; Safranek, J.; Prazakova, M.; et al. Prognostic significance of TIMP-1 in non-small cell lung cancer. Anticancer Res. 2011, 31, 4031–4038. [Google Scholar] [PubMed]
- Hoang, T.; Traynor, A.M.; Schiller, J.H. Novel therapies for lung cancer. Surg. Oncol. 2002, 11, 229–241. [Google Scholar] [CrossRef]
- Meng, C.; Yin, X.; Liu, J.; Tang, K.; Tang, H.; Liao, J. TIMP-1 is a novel serum biomarker for the diagnosis of colorectal cancer: A meta-analysis. PLoS ONE 2018, 13, e0207039. [Google Scholar] [CrossRef] [PubMed]
- Chromek, M.; Tullus, K.; Lundahl, J.; Brauner, A. Tissue inhibitor of metalloproteinase 1 activates normal human granulocytes, protects them from apoptosis, and blocks their transmigration during inflammation. Infect. Immun. 2004, 72, 82–88. [Google Scholar] [CrossRef]
- Schrohl, A.S.; Meijer-van Gelder, M.E.; Holten-Andersen, M.N.; Christensen, I.J.; Look, M.P.; Mouridsen, H.T.; Brunner, N.; Foekens, J.A. Primary tumor levels of tissue inhibitor of metalloproteinases-1 are predictive of resistance to chemotherapy in patients with metastatic breast cancer. Clin. Cancer Res. 2006, 12, 7054–7058. [Google Scholar] [CrossRef]
- Frederiksen, C.; Qvortrup, C.; Christensen, I.J.; Glimelius, B.; Berglund, A.; Jensen, B.V.; Nielsen, S.E.; Keldsen, N.; Nielsen, H.J.; Brunner, N.; et al. Plasma TIMP-1 levels and treatment outcome in patients treated with XELOX for metastatic colorectal cancer. Ann. Oncol. 2011, 22, 369–375. [Google Scholar] [CrossRef]
- Blumenschein, G.R., Jr.; Reck, M.; Fossella, F.; Stewart, D.J.; Lathia, C.; Pena, C. Plasma biomarkers correlating with clinical outcome in a phase II study of sorafenib in advanced NSCLC. Cancer Biomark. 2011, 10, 287–298. [Google Scholar] [CrossRef] [PubMed]
- Vistejnova, L.; Safrankova, B.; Nesporova, K.; Slavkovsky, R.; Hermannova, M.; Hosek, P.; Velebny, V.; Kubala, L. Low molecular weight hyaluronan mediated CD44 dependent induction of IL-6 and chemokines in human dermal fibroblasts potentiates innate immune response. Cytokine 2014, 70, 97–103. [Google Scholar] [CrossRef] [PubMed]
- Maqbool, A.; Spary, E.J.; Manfield, I.W.; Ruhmann, M.; Zuliani-Alvarez, L.; Gamboa-Esteves, F.O.; Porter, K.E.; Drinkhill, M.J.; Midwood, K.S.; Turner, N.A. Tenascin C upregulates interleukin-6 expression in human cardiac myofibroblasts via toll-like receptor 4. World J. Cardiol. 2016, 8, 340–350. [Google Scholar] [CrossRef] [PubMed]
- Grivennikov, S.; Karin, E.; Terzic, J.; Mucida, D.; Yu, G.Y.; Vallabhapurapu, S.; Scheller, J.; Rose-John, S.; Cheroutre, H.; Eckmann, L.; et al. IL-6 and Stat3 are required for survival of intestinal epithelial cells and development of colitis-associated cancer. Cancer Cell 2009, 15, 103–113. [Google Scholar] [CrossRef] [PubMed]
- Petrova, V.; Annicchiarico-Petruzzelli, M.; Melino, G.; Amelio, I. The hypoxic tumour microenvironment. Oncogenesis 2018, 7, 10. [Google Scholar] [CrossRef] [PubMed]
- Roeb, E.; Graeve, L.; Mullberg, J.; Matern, S.; Rose-John, S. TIMP-1 protein expression is stimulated by IL-1 beta and IL-6 in primary rat hepatocytes. FEBS Lett. 1994, 349, 45–49. [Google Scholar] [CrossRef]
- Silacci, P.; Dayer, J.M.; Desgeorges, A.; Peter, R.; Manueddu, C.; Guerne, P.A. Interleukin (IL)-6 and its soluble receptor induce TIMP-1 expression in synoviocytes and chondrocytes, and block IL-1-induced collagenolytic activity. J. Biol. Chem. 1998, 273, 13625–13629. [Google Scholar] [CrossRef]
- Zheng, X.; Xu, M.; Yao, B.; Wang, C.; Jia, Y.; Liu, Q. IL-6/STAT3 axis initiated CAFs via up-regulating TIMP-1 which was attenuated by acetylation of STAT3 induced by PCAF in HCC microenvironment. Cell. Signal. 2016, 28, 1314–1324. [Google Scholar] [CrossRef]
- Smart, D.E.; Vincent, K.J.; Arthur, M.J.; Eickelberg, O.; Castellazzi, M.; Mann, J.; Mann, D.A. JunD regulates transcription of the tissue inhibitor of metalloproteinases-1 and interleukin-6 genes in activated hepatic stellate cells. J. Biol. Chem. 2001, 276, 24414–24421. [Google Scholar] [CrossRef]
- Hunter, C.A.; Jones, S.A. IL-6 as a keystone cytokine in health and disease. Nat. Immunol. 2015, 16, 448–457. [Google Scholar] [CrossRef]


© 2019 by the authors. Licensee MDPI, Basel, Switzerland. This article is an open access article distributed under the terms and conditions of the Creative Commons Attribution (CC BY) license (http://creativecommons.org/licenses/by/4.0/).
Share and Cite
Xiao, W.; Wang, L.; Howard, J.; Kolhe, R.; Rojiani, A.M.; Rojiani, M.V. TIMP-1-Mediated Chemoresistance via Induction of IL-6 in NSCLC. Cancers 2019, 11, 1184. https://doi.org/10.3390/cancers11081184
Xiao W, Wang L, Howard J, Kolhe R, Rojiani AM, Rojiani MV. TIMP-1-Mediated Chemoresistance via Induction of IL-6 in NSCLC. Cancers. 2019; 11(8):1184. https://doi.org/10.3390/cancers11081184
Chicago/Turabian StyleXiao, Wei, Lan Wang, John Howard, Ravindra Kolhe, Amyn M. Rojiani, and Mumtaz V. Rojiani. 2019. "TIMP-1-Mediated Chemoresistance via Induction of IL-6 in NSCLC" Cancers 11, no. 8: 1184. https://doi.org/10.3390/cancers11081184