Article

Deletions of Chromosome 7q Affect Nuclear Organization and HLXB9Gene Expression in Hematological Disorders

1
Department of Biological, Geological and Environmental Sciences, University of Catania, via Androne 81, 95124 Catania CT, Italy
2
Genome Engineering and Maintenance Network, Institute of Environment, Health and Societies, Brunel University London, Kingston Lane UB8 3PH, UK
3
Department of Biological and Environmental Sciences, School of Life and Medical Sciences, University of Hertfordshire, Hatfield AL10 9AB, UK
4
Associazione Italiana Ematologia Oncologia Pediatrica (AIEOP), Centro Ricerca Tettamanti, Pediatric Department, University of Milano-Bicocca, 20900 Monza, Italy
5
College of Health and Life Science, Brunel University London, Kingston Lane UB8 3PH, UK
*
Authors to whom correspondence should be addressed.
Cancers 2019, 11(4), 585; https://doi.org/10.3390/cancers11040585
Submission received: 12 March 2019 / Revised: 3 April 2019 / Accepted: 19 April 2019 / Published: 25 April 2019

Abstract

:
The radial spatial positioning of individual gene loci within interphase nuclei has been associated with up- and downregulation of their expression. In cancer, the genome organization may become disturbed due to chromosomal abnormalities, such as translocations or deletions, resulting in the repositioning of genes and alteration of gene expression with oncogenic consequences. In this study, we analyzed the nuclear repositioning of HLXB9 (also called MNX1), mapping at 7q36.3, in patients with hematological disorders carrying interstitial deletions of 7q of various extents, with a distal breakpoint in 7q36. We observed that HLXB9 remains at the nuclear periphery, or is repositioned towards the nuclear interior, depending upon the compositional properties of the chromosomal regions involved in the rearrangement. For instance, a proximal breakpoint leading the guanine-cytosine (GC)-poor band 7q21 near 7q36 would bring HLXB9 to the nuclear periphery, whereas breakpoints that join the GC-rich band 7q22 to 7q36 would bring HLXB9 to the nuclear interior. This nuclear repositioning is associated with transcriptional changes, with HLXB9 in the nuclear interior becoming upregulated. Here we report an in cis rearrangement, involving one single chromosome altering gene behavior. Furthermore, we propose a mechanistic model for chromatin reorganization that affects gene expression via the influences of new chromatin neighborhoods.

1. Introduction

The behavior of the genome within interphase nuclei gives us essential insights into the spatial and epigenetic regulation of gene expression [1,2]. The spatial positioning of different genomic regions within nuclei is non-random, and depends on the genome composition, in particular gene density and guanine-cytosine (GC)-content. The GC-richest regions, usually abundant in genes and more transcriptionally active, are positioned towards the nuclear interior, whereas the GC-poorest regions, characterized by a paucity of genes, are located towards the nuclear periphery, and are associated with gene silencing [3,4,5,6,7,8,9]. The spatial positioning of the GC-rich and GC-poor regions gives rise to a zig-zag arrangement of chromatin with a differential spatial location of individual bands that are adjacent to an individual chromosome, as demonstrated for human chromosome 7 in the cell nuclei of normal lymphocytes [5,10,11,12,13,14,15,16,17].
This nuclear distribution is further supported by evidence gathered using chromosome conformation-capture techniques such as the Hi-C method, that provide a high-resolution view of the genome in its three-dimensional (3D) organization and the interactions of higher-order chromatin structures within it [18]. These studies showed the presence of two genomic nuclear compartments, called A and B, localized at the nuclear interior (A) and at the periphery (B), that correspond to transcriptionally-active GC-rich/gene rich and transcriptionally-inactive GC-poor/gene poor compartments respectively [19,20,21]. The Hi-C methods also allowed the identification of distinct structural units called Topologically Associating Domains (TADs) with size ranging from a few kb to several Mb, defined by a higher frequency of chromatin interactions within these confined regions, with little or no interactions beyond their boundaries [22,23]. Previous studies suggested that gene silencing at the nuclear periphery is a consequence of interactions with the nuclear lamina [24,25]. In fact, certain transcriptionally-silent TADs are further organized into Lamina Associated Domains (LADs), which are genomic regions in contact with the nuclear lamina at the nuclear periphery, and are characterized by repressed or minimal transcriptional activity [26].
Although gene density/GC content seem to be the underlying factors crucial forgenome organization, in proliferating cells individual chromosomes and genes can be non-randomly relocated to other nuclear compartments during development and differentiation to accomplish specific transcriptional needs [14,27,28]. In cancer, alterations to specific chromosomes and gene locations in nuclei are particularly noticeable [29,30,31,32]. These findings imply that genomic rearrangements occurring in cis could also affect the 3D genome organization due to different chromosomal regions being erroneously positioned in various nuclear compartments [33,34,35,36,37].
Our earlier studies have described the localization of HLXB9 (also known as MNX1), a homeobox gene mapping at 7q36.3, at the nuclear periphery in phytohaemagglutinin (PHA)-stimulated lymphocytes from healthy subjects [10], as well as its repositioning in the nucleus of leukemic cells as a consequence of a chromosomal translocation [38]. In this case, the HLXB9 allele translocated to the chromosomal band 12p13, a region that is usually found in the inner part of the nucleus, moves toward the nuclear interior. We speculated that this repositioning of HLXB9 is associated with its activation in leukemias with t(7;12)(q36;p13) [38,39].
HLXB9 encodes the transcription factor HB9, involved in embryonic development for pancreatic and neuronal tissue differentiation [40,41]. While mutations of HLXB9 are well known to be associated with the developmental disorder Currarino syndrome [42], its role in cancer is still unresolved. A number of reports have described HLXB9 overexpression in malignancies other than leukemia, including breast cancer [43,44], prostate cancer [45], bladder cancer [46], colorectal cancer [47], liver cancer [48], neuroblastoma [28], and pancreatic tumors [49], making HLXB9 an interesting gene in cancer biology. Owing to its function as a transcription factor, the tumorigenic activity of HLXB9 could be attributable to the activation of erroneous transcription programs, via molecular mechanisms and subsets of target genes yet to be identified. Although the HLXB9 gene was first discovered in B-lymphocytes, there was a lack of consensus about whether HLXB9 is expressed in bone marrow or peripheral blood cells [50]. Still today, the expression of HLXB9 in normal hematopoietic stem cells is debated [39,51,52,53,54].
In terms of function, HLXB9 has been suggested to be involved in maintaining stem cell niche by regulating cell adhesion or cell-to-cell interaction genes [53], and its overexpression has been linked to induction of senescence and block in differentiation [54].
Abnormalities of chromosome 7 are frequently encountered in hematological disorders, particularly of the myeloid lineage. Deletions of the long arm of chromosome 7, del(7q), are commonly found in the myelodysplastic syndrome (MDS), regarded as a form of pre-leukemia, and acute myeloid leukemia (AML) [55]. These deletions vary in extent from patient to patient, and can encompass several chromosomal bands [56,57,58,59]. Monosomy 7 and del(7q) are also found in Fanconi anemia (FA) patients who progress to develop MDS or AML [60]. Moreover, the majority of deletions are interstitial, meaning that the 7q telomere and subtelomeric region, including the HLXB9 gene, are retained.
Understanding the chromosome 7 biology in leukemia is of interest both from a clinical and mechanistic perspective. A number of candidate genes possibly involved in leukemogenesis are found in the 7q region [55], with HLXB9 arousing particular interest. These observations prompted us to investigate the radial nuclear positioning of HLXB9 in the nuclei of cells from hematological patients harboring deletions of different sizes and breakpoints along the long arm of chromosome 7. In this study, we investigated the behavior of the HLXB9 gene in hematological disorders, including expression patterns in a large patient cohort. In particular, we aim to address a number of key questions surrounding the altered nuclear positioning of HLXB9 in leukemia with deletions of chromosome 7, and to identify any associations between the observed location, and changes in gene expression, size of the deletion, and cytogenetic mapping of affected chromosomal bands.

2. Results

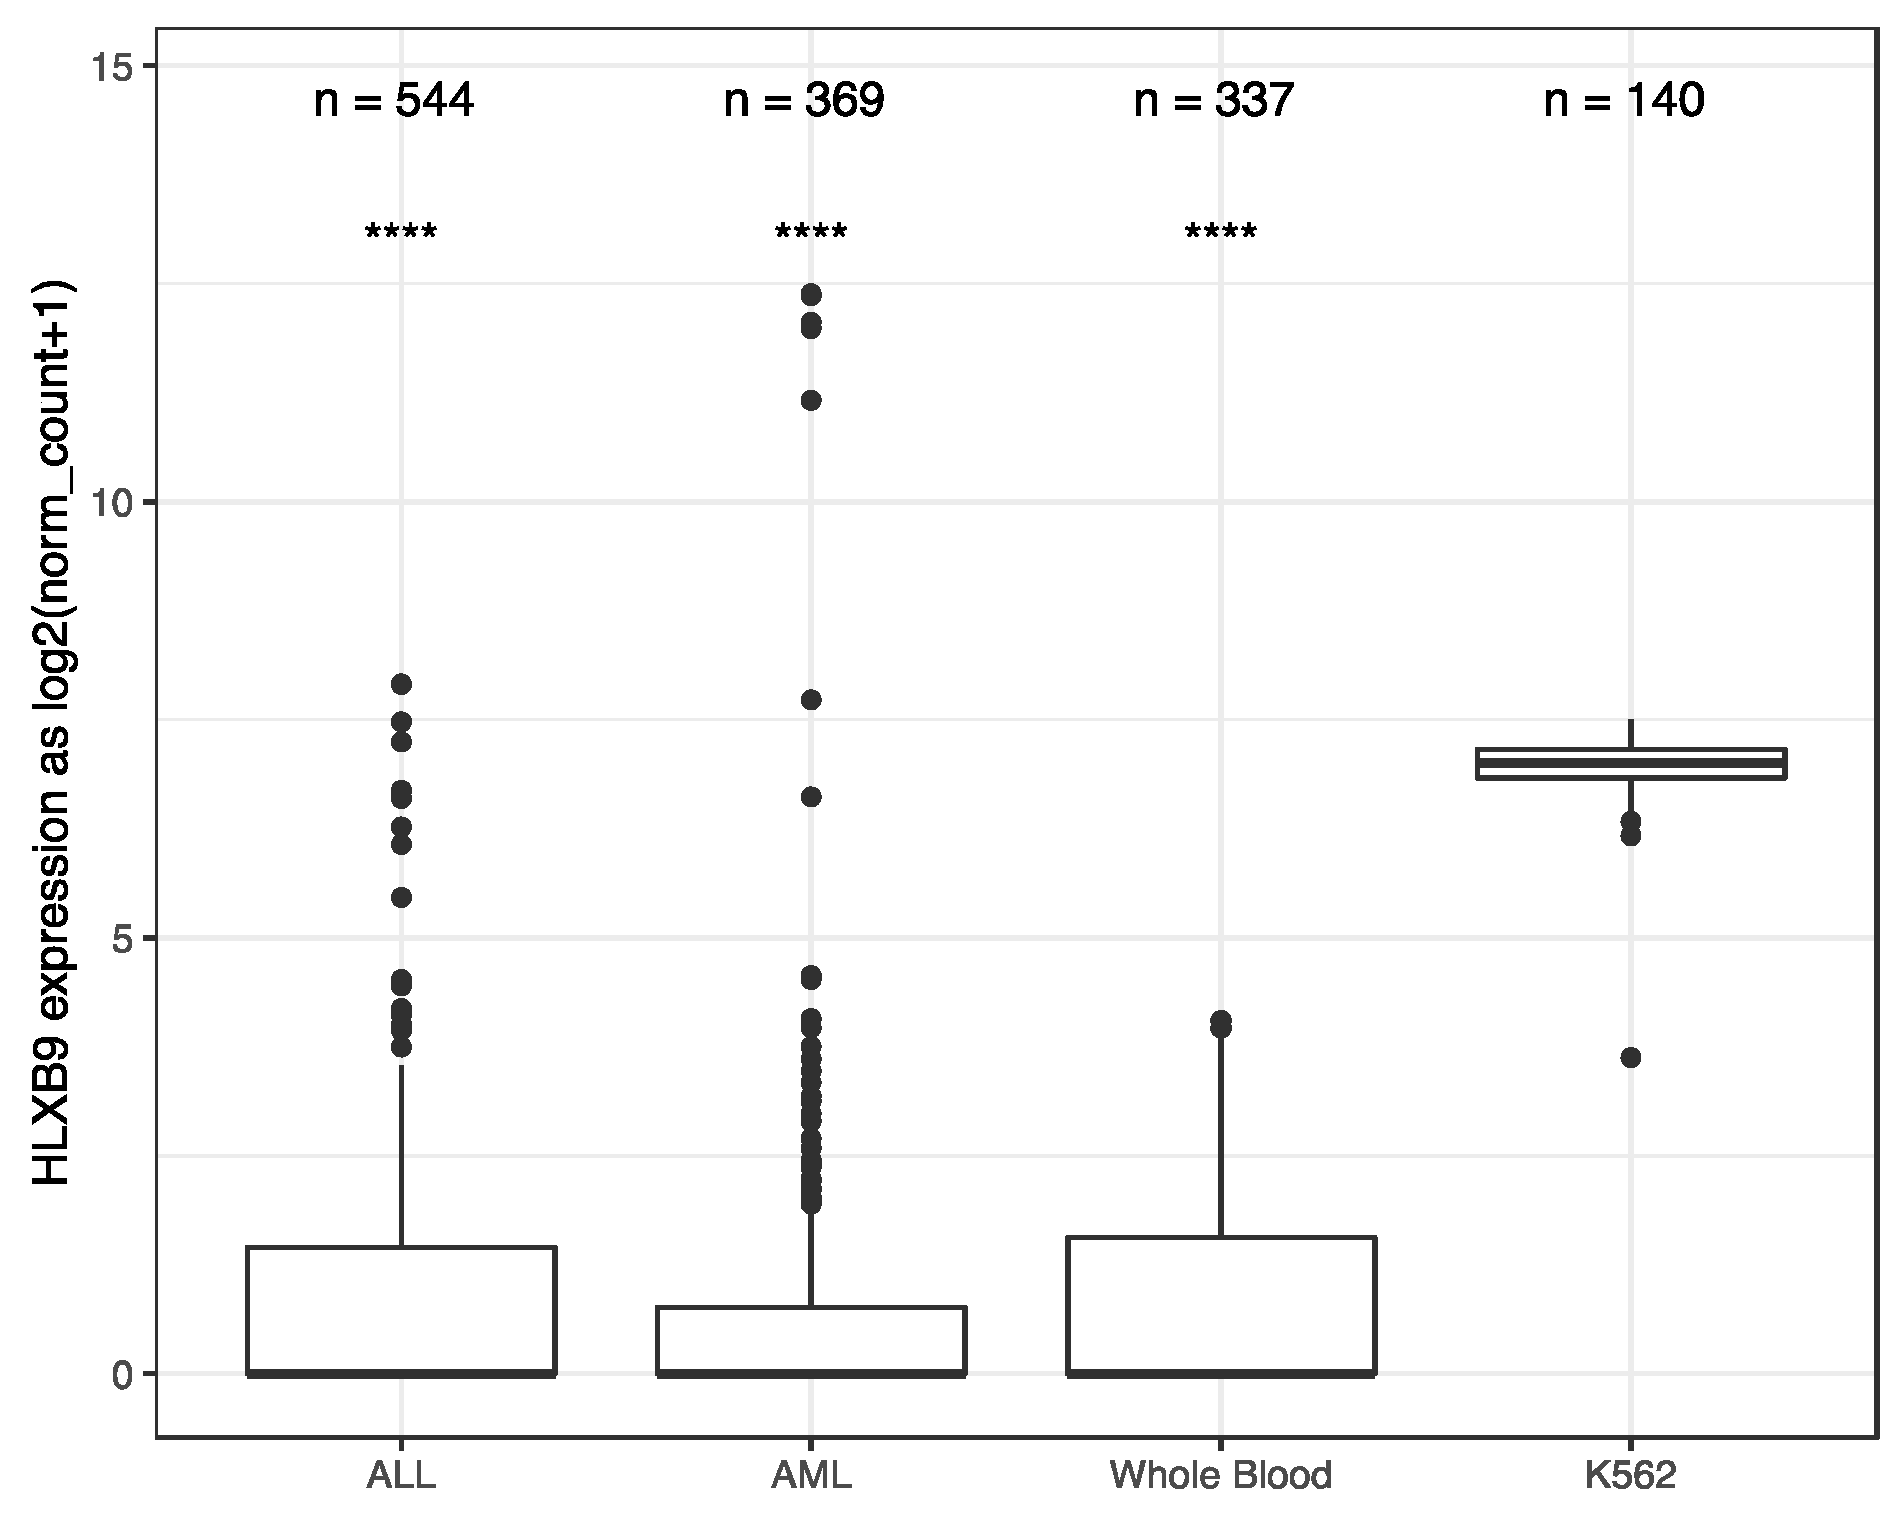
2.1. Data Mining of HLXB9 Expression

We investigated the expression of HLXB9 in acute myeloid leukemia (AML) and Acute lymphoblastic leukemia (ALL) by taking advantage of the available data from The Cancer Genome Atlas (TCGA), and the Therapeutically Applicable Research to Generate Effective Treatments (TARGET) initiative. We extracted and analyzed 369 AML and 544 ALL samples, of which 173 AML samples form TCGA had associated information regarding their cytogenetics. Data from 337 whole blood samples and 140 replicates of the K562 leukemia cell line from the Genotype-Tissue Expression (GTEx) project were used as negative and positive controls, respectively, for HLXB9 expression. Overall, similar levels of HLXB9 expression are observed in the majority of samples in ALL, AML and whole blood, when compared to the K562 cell line, which shows significantly higher expression (Figure 1, Supplementary Materials Figures S1,S2). However, a number of samples within the ALL and AML cohorts were distinguishable by a higher expression of HLXB9 compared to whole blood. We explored whether this may be associated with the cytogenetic features in the AML samples (cytogenetic data was unavailable for ALL). Using a cut-off value of 1 for the log2 normalized expression level, we were able to identify 7 samples characterized by the presence of del(7q) with high HLXB9 expression. Detailed phenotypic information of these cases is reported in Table S1. We subdivided the entire AML cohort in 4 classes based on the presence of a del(7q), according to the reported cytogenetic abnormality (Figure 2). Overall, about 30% of samples with a del(7q), alone or in conjunction with other abnormalities, shows expression of HLXB9. A detailed overview of HLXB9 expression levels across all cytogenetic groups is shown in Supplementary Materials Figure S3.

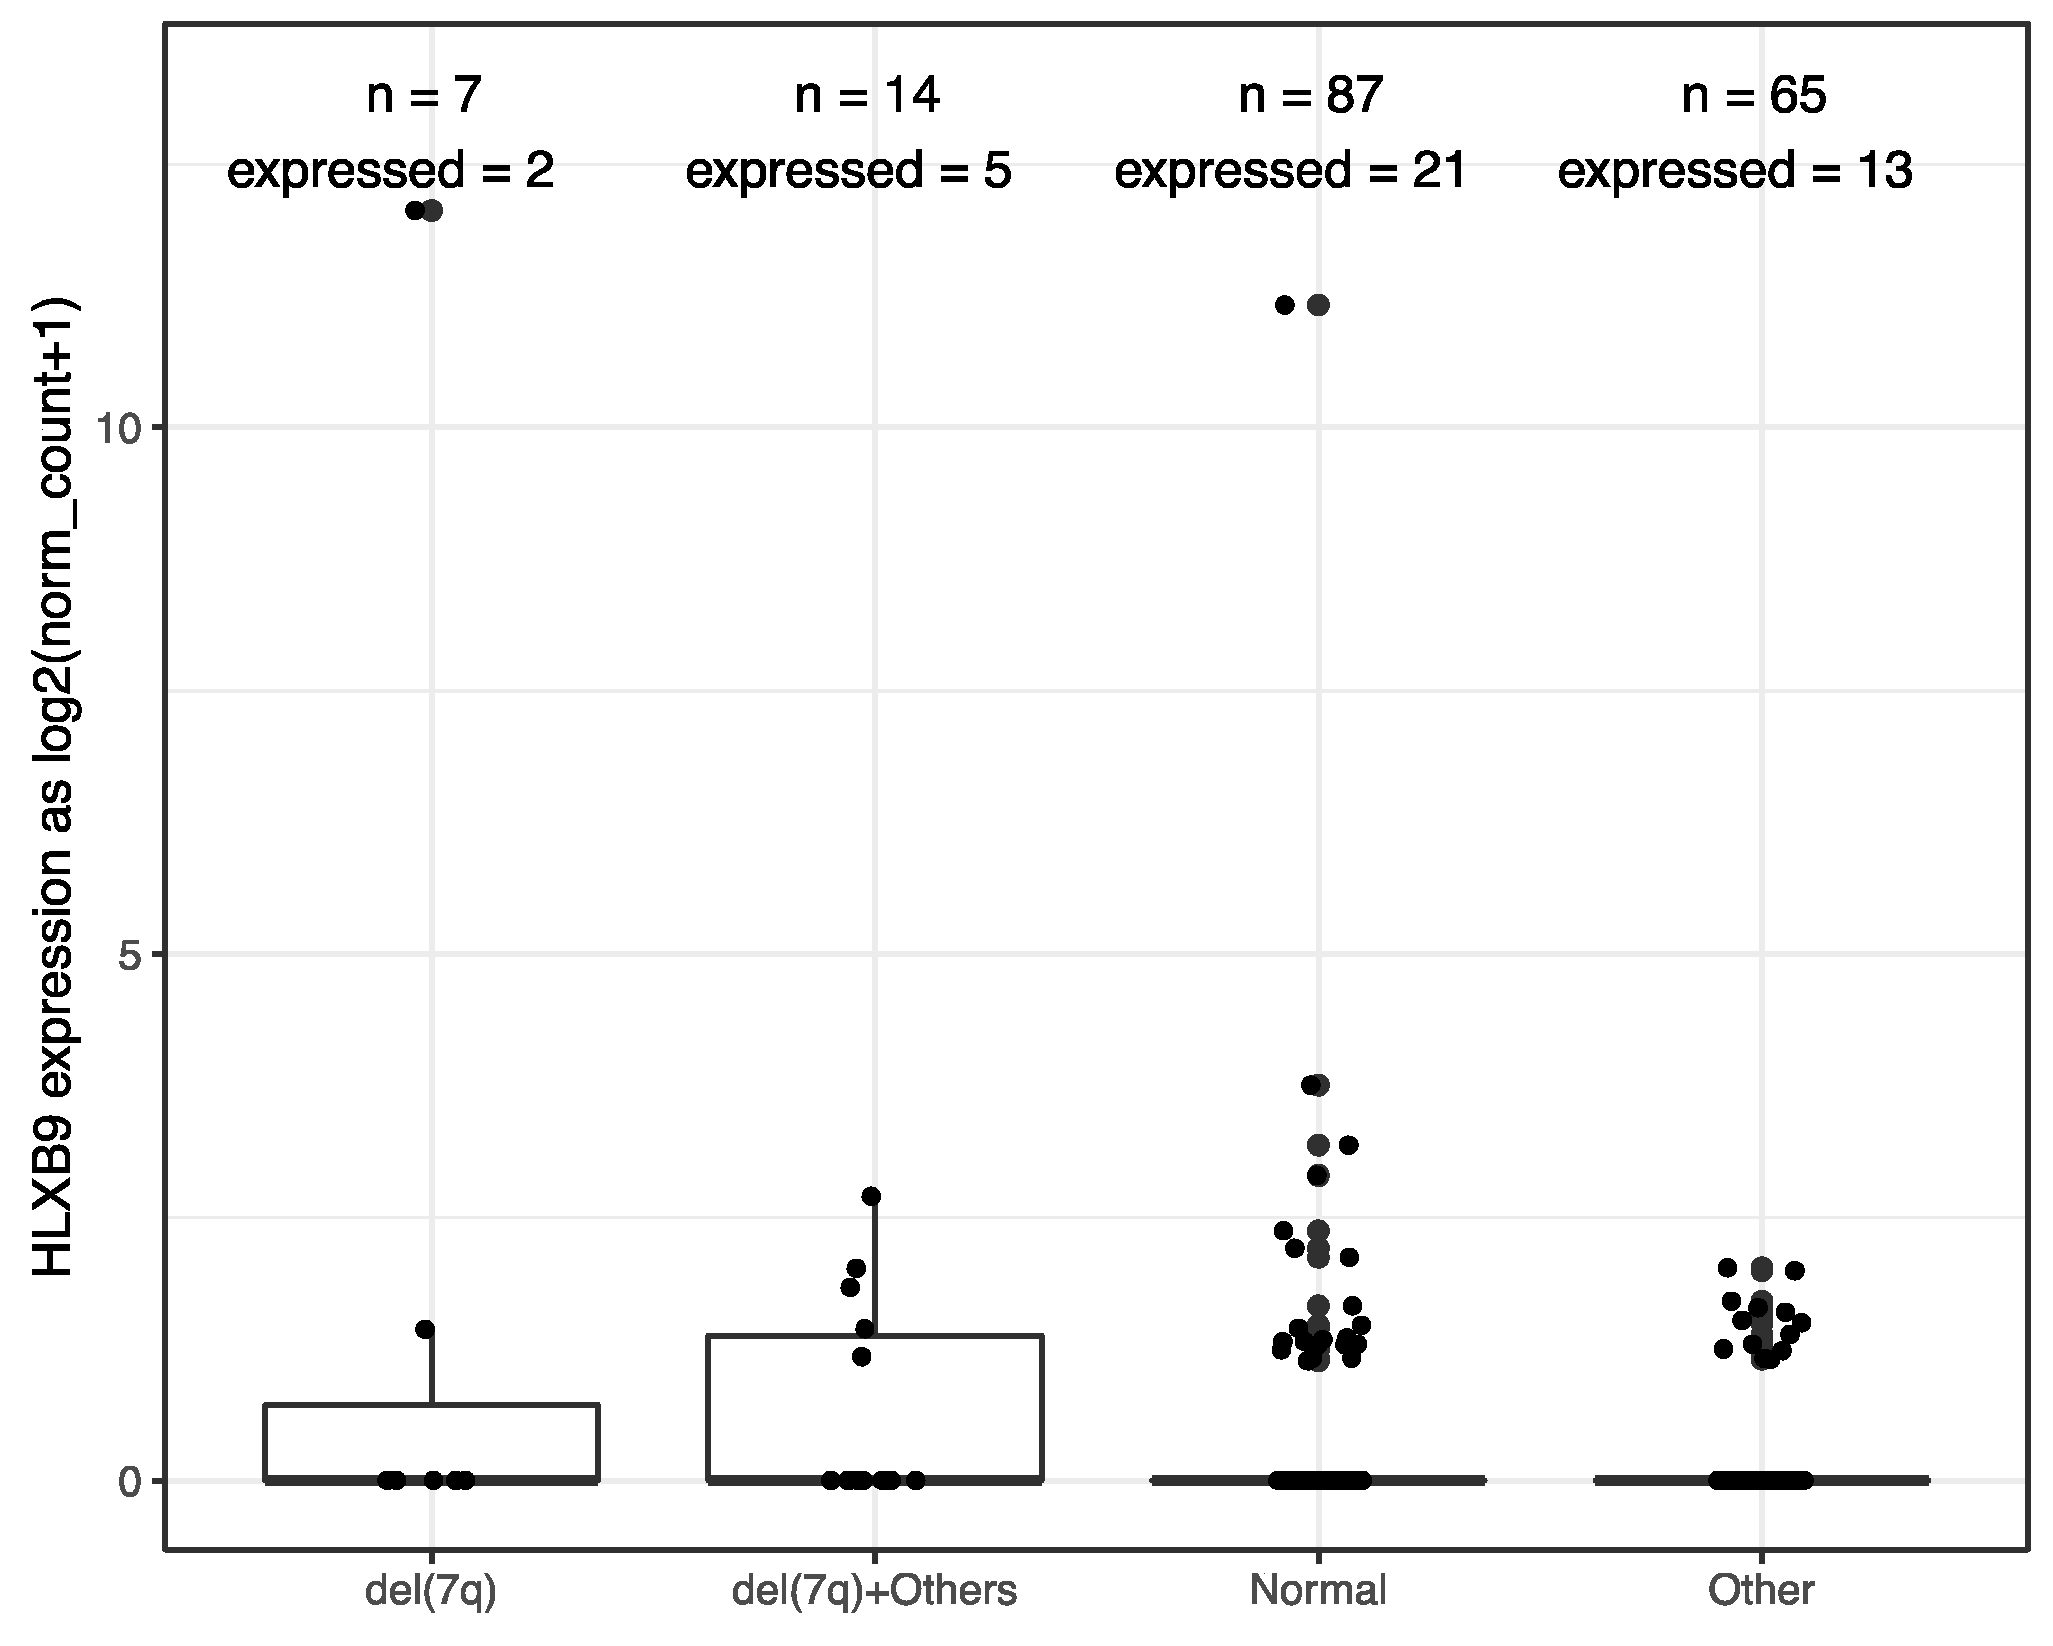
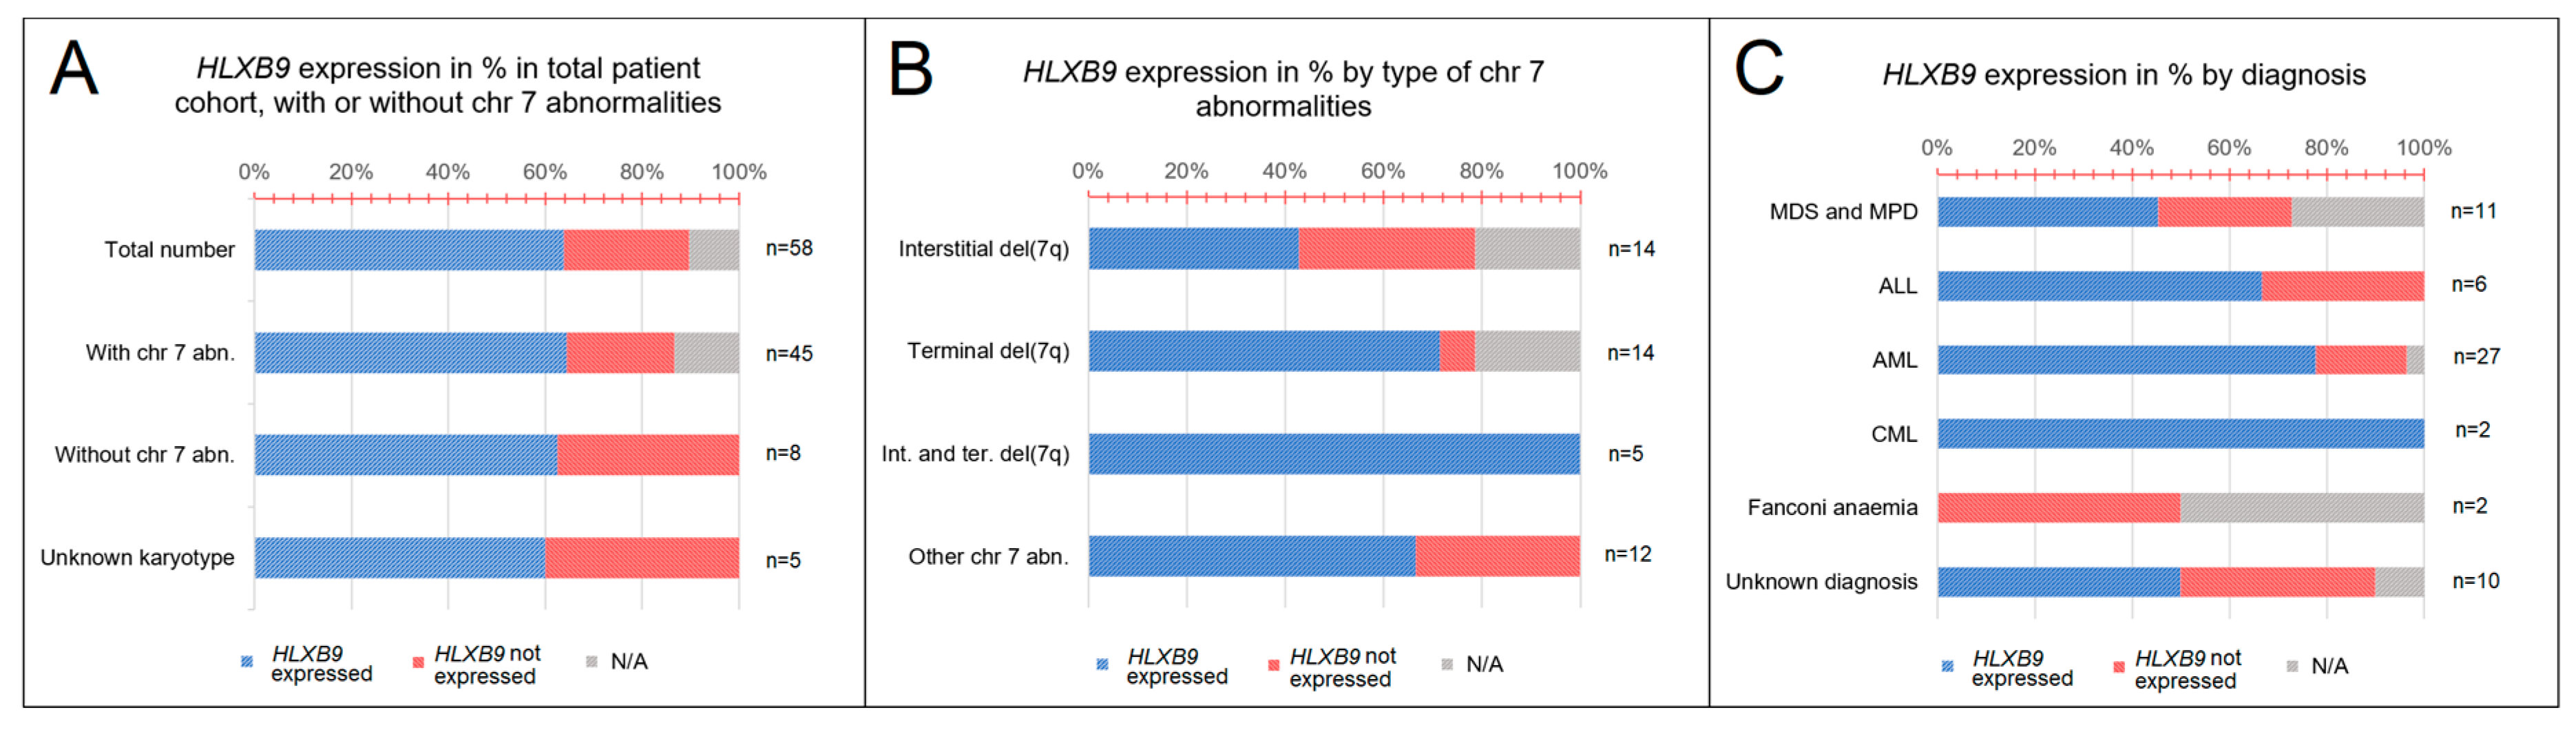
2.2. Classification of Large Series of Patients Based on HLXB9Expression Patterns

Altogether, we collected a total of 58 samples from patients with various hematological disorders, including myelodysplastic syndrome (MDS) and myeloproliferative disorder (MPD) (n = 11), acute lymphoblastic leukemia (ALL) (n = 6), acute myeloid leukemia (AML) (n = 27), chronic myeloid leukemia (CML) (n = 2), and Fanconi anemia (FA) (n = 2) (Figure 3A). Expression of HLXB9, assessed by reverse transcription polymerase chain reaction (RT-PCR), was detected in 15 samples out of 58. For 6 samples the expression of HLXB9 is unknown, due to lack of sufficient material. According to the karyotypes available, we subdivided the entire cohort into patients with chromosome 7 abnormalities (n = 45), and patients without chromosome 7 abnormalities (n = 8); for 5 patients the karyotype was unavailable. 10 patients with chromosome 7 abnormalities expressed HLXB9(29 did not express HLXB9, 6 N/A); 3 patients without chromosome 7 abnormalities out of 8 were positive (Figure 3B).
We further subdivided the chromosome 7 abnormality cohort by type—patients with interstitial deletions (n = 14), terminal deletions (n = 14), interstitial and terminal deletions (n = 5), and other (e.g., insertions, additions, ring, etc.) (n = 12). When these groups were investigated for the expression of HLXB9, 5 patients had an interstitial deletion of 7q; 1 had a terminal deletion, and 4 had other types of chromosome abnormality (Figure 3C). By classifying the patients based on their diagnosis, we found that HLXB9 was expressed in 3 patients diagnosed with MDS or MPD, 2 with ALL, 5 with AML, and 1 with FA. Out of 10 patients with an unknown diagnosis, 4 cases showed HLXB9 expression (Figure 3A).

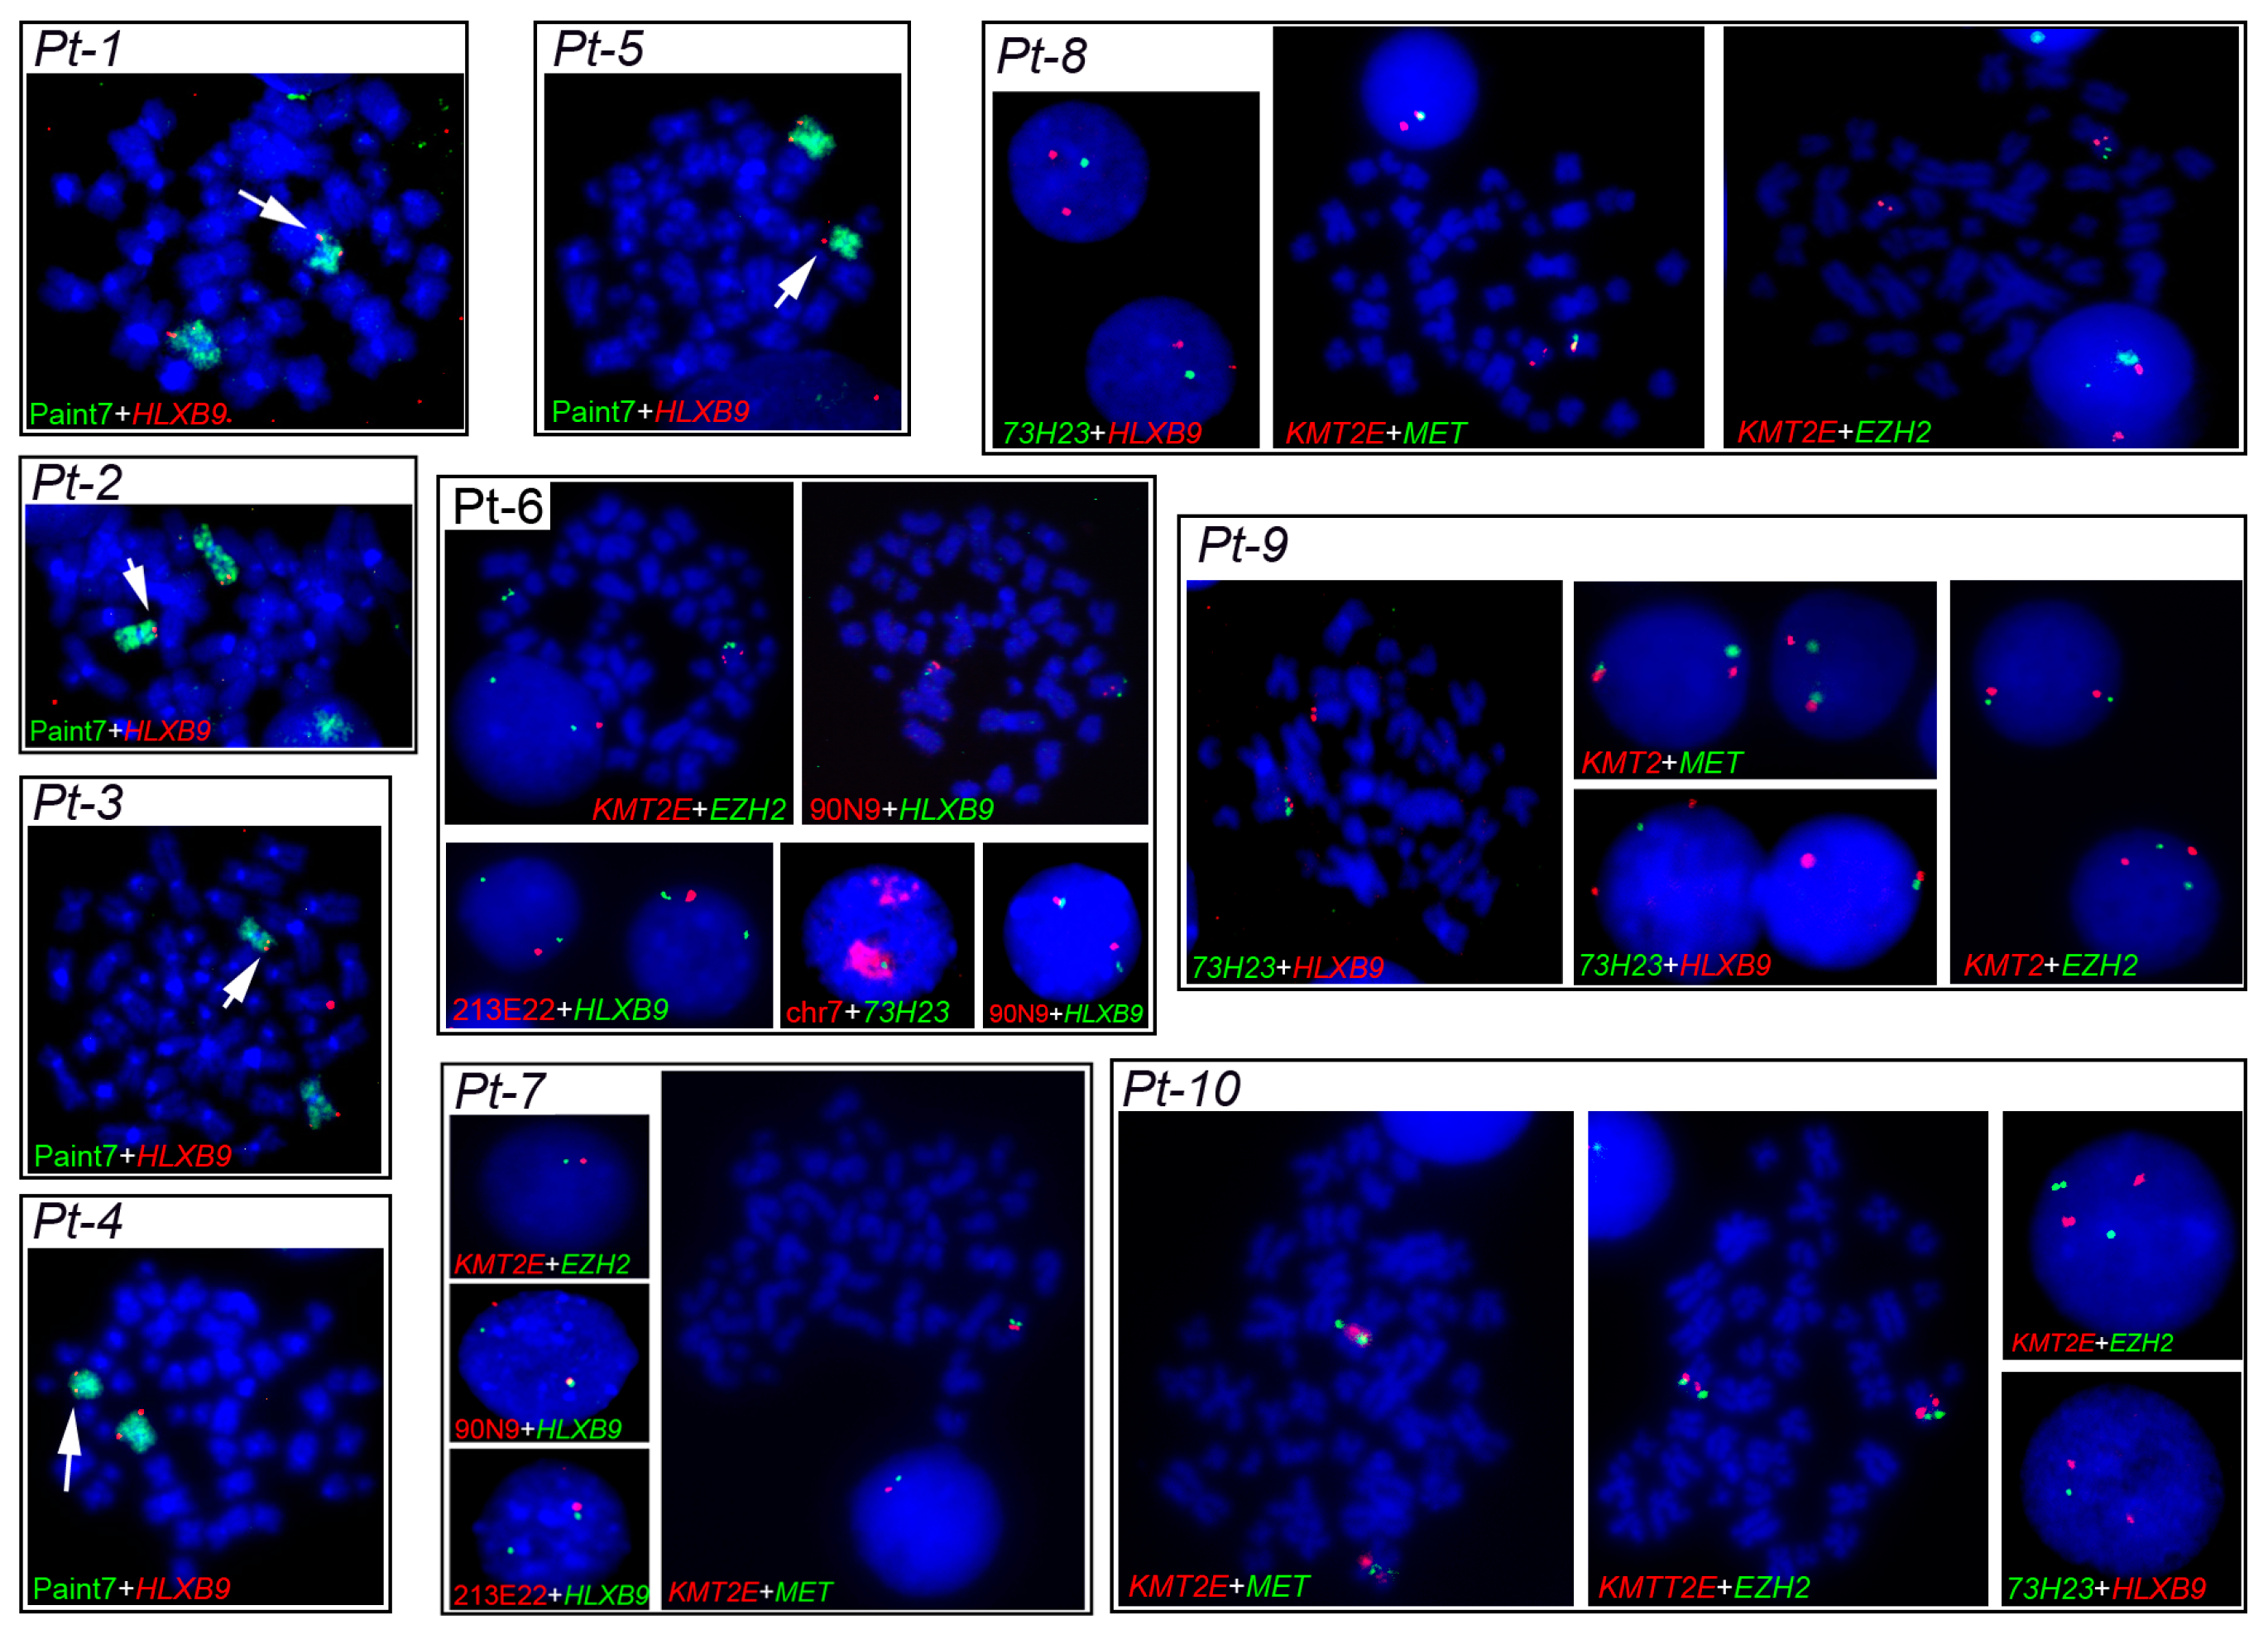
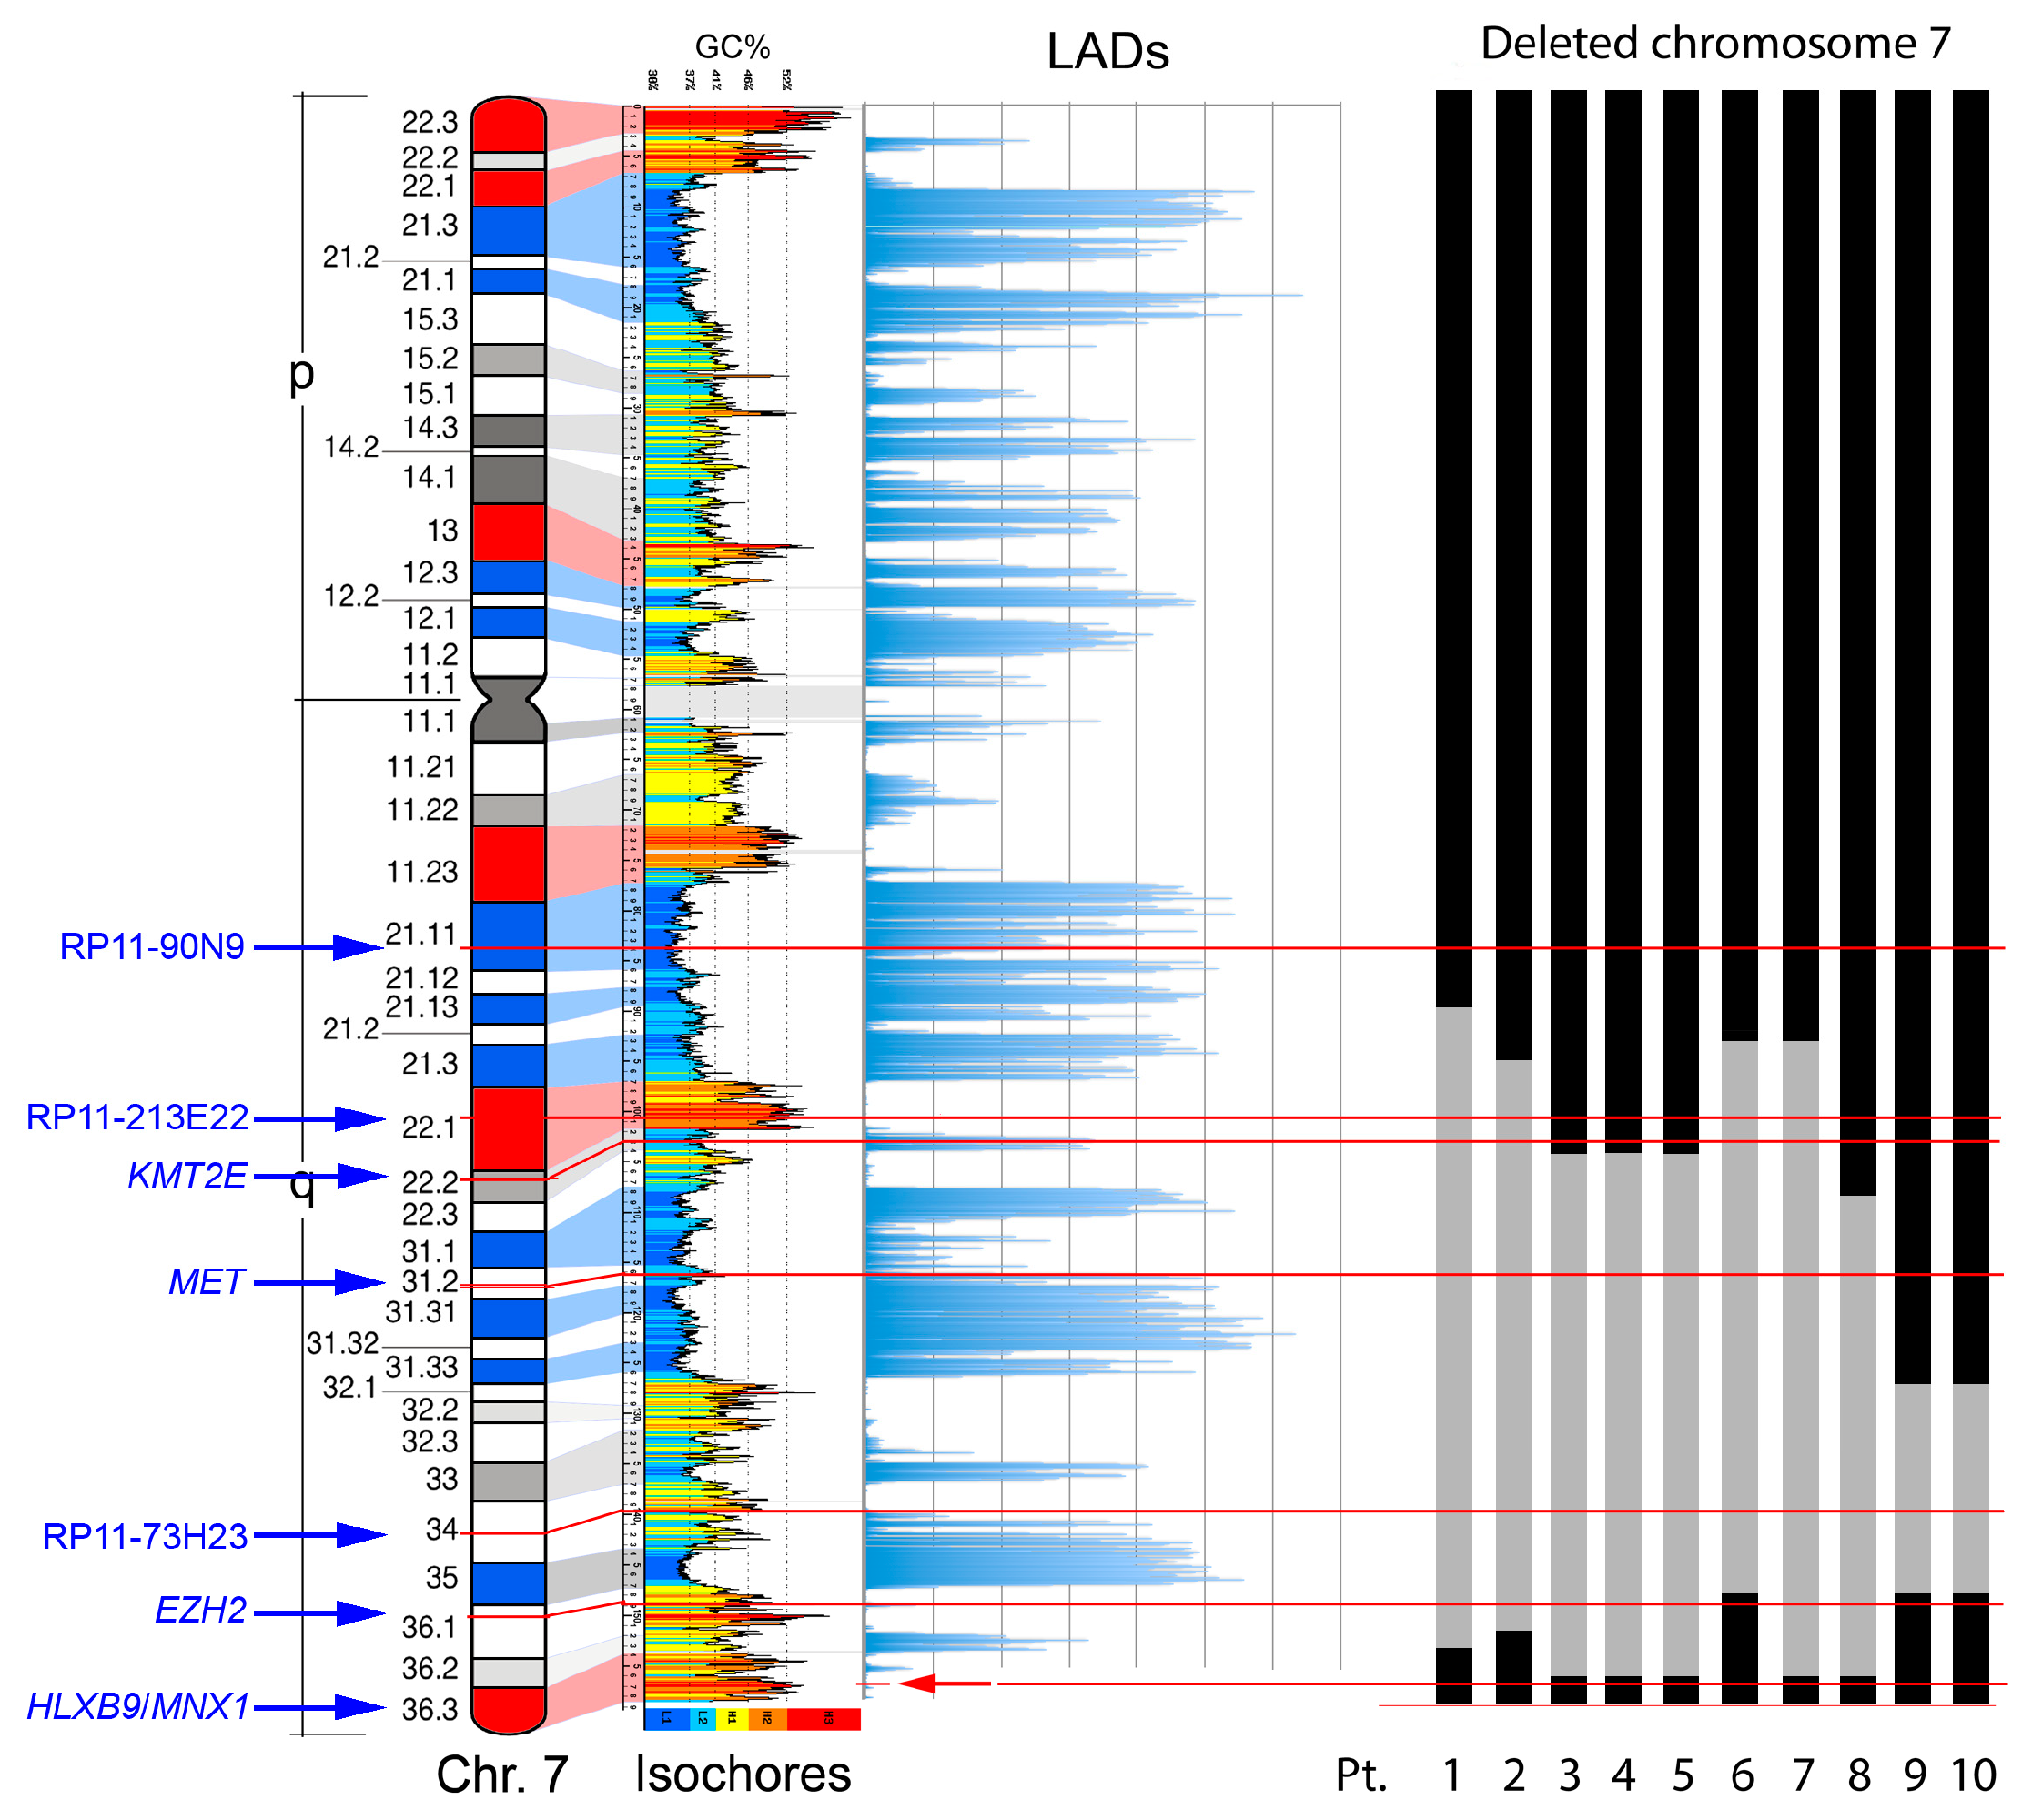
2.3. Deletion Mapping of Breakpoints, Radial Nuclear Location and Expression Analyzes in a Selected Series of Patients

From the series of 58 patient samples, we selected 10 (referred to as Pt-1 to Pt-10) with interstitial deletions of the long arm of chromosome 7, for which we had good quality material to enable us to conduct further molecular cytogenetic characterization and expression analysis. The clinical and cytogenetic details are reported in Table 1.

2.3.1. Characterization of del(7q) Breakpoints

Characterization of deletion breakpoints relied on both conventional karyotype analysis at the time of diagnosis (Table 1), and FISH (Table 2). We previously used FISH to map precisely the breakpoints in Pt-1 to Pt-4 in our earlier studies [58,61]. Here, for Pt-5 to Pt-10, we used FISH with probes localized along the long arm of chromosome 7 to determine the proximal and distal breakpoints of the del(7q), and whether the HLXB9 locus is retained in the deleted chromosome, to refine the karyotypes in some cases. For Pt-4 and Pt-5, the samples were of insufficient amount to allow further experiments needed to establish more precise breakpoints. Representative FISH images are shown in Figure 4. The presence of two hybridization signals for the locus-specific probe for HLXB9 (RP5-1121A15) at 7q36.3 in all 10 patients confirmed that HLXB9 was retained in all cases. In Pt-1 to Pt-5, this is shown in metaphases by the presence of a deleted chromosome 7 shorter than the normal homolog painted in green, and both HLXB9 loci detected in red by RP5-1121A15. In Pt-6 to Pt-10, two HLXB9 alleles are shown in metaphases, and nuclei hybridized by the same probe. Hybridization with the probe mixture containing the EZH2 locus at 7q36.1 further narrowed down the distal breakpoint in Pt-7 and Pt-8, which was mapped at 7q36.2, due to the absence of signals for this probe on the deleted chromosome. Pt-6, Pt-9 and Pt-10 had both signals for EZH2, indicating that the distal breakpoint lies on a region proximal to it, but could not be further determined. In Pt-6 to Pt-10, the 7q21.11 region was retained, as shown by two signals for the RP11-90N9 probe. Pt-6 and Pt-7 showed loss of the 7q22 and 7q31 regions on the deleted chromosomes, as shown by single signals for probes containing KMT2E (7q22), RP11-213E22 (7q22.1) and MET (7q31.2), indicating that the breakpoint lies in 7q21. These loci, however, were retained in Pt-9 and Pt-10. The breakpoint in Pt-8 was mapped at 7q22, considering that the 7q34, and 7q31.2signals were lost. In Pt-9 and Pt-10, signals for the 7q31 region were present, placing the proximal breakpoint further away, compared to other patients, approximately between 7q32 or 7q33. Given that only one signal for RP11-73H23 at 7q34 is seen in Pt-6 to Pt-10, and that the HLXB9 locus at 7q36.3 is consistently kept, we concluded that the deletions were all interstitial, with the distal breakpoint in 7q35/q36, and a variable proximal breakpoint between 7q21 and 7q33. Together with our previous analysis of Pt-1 to Pt-4 [58,61], we can summarize the proximal breakpoints as follows: In the 7q21 band in Pt-1, Pt-2, Pt-6 and Pt-7; in the 7q22 band in Pt-3, Pt-4, Pt-5 and Pt-8; in the 7q32/33 region in Pt-9 and Pt -10. A graphical view of the breakpoints in each patient, and the GC-content along chromosome 7 is shown in Figure 5.

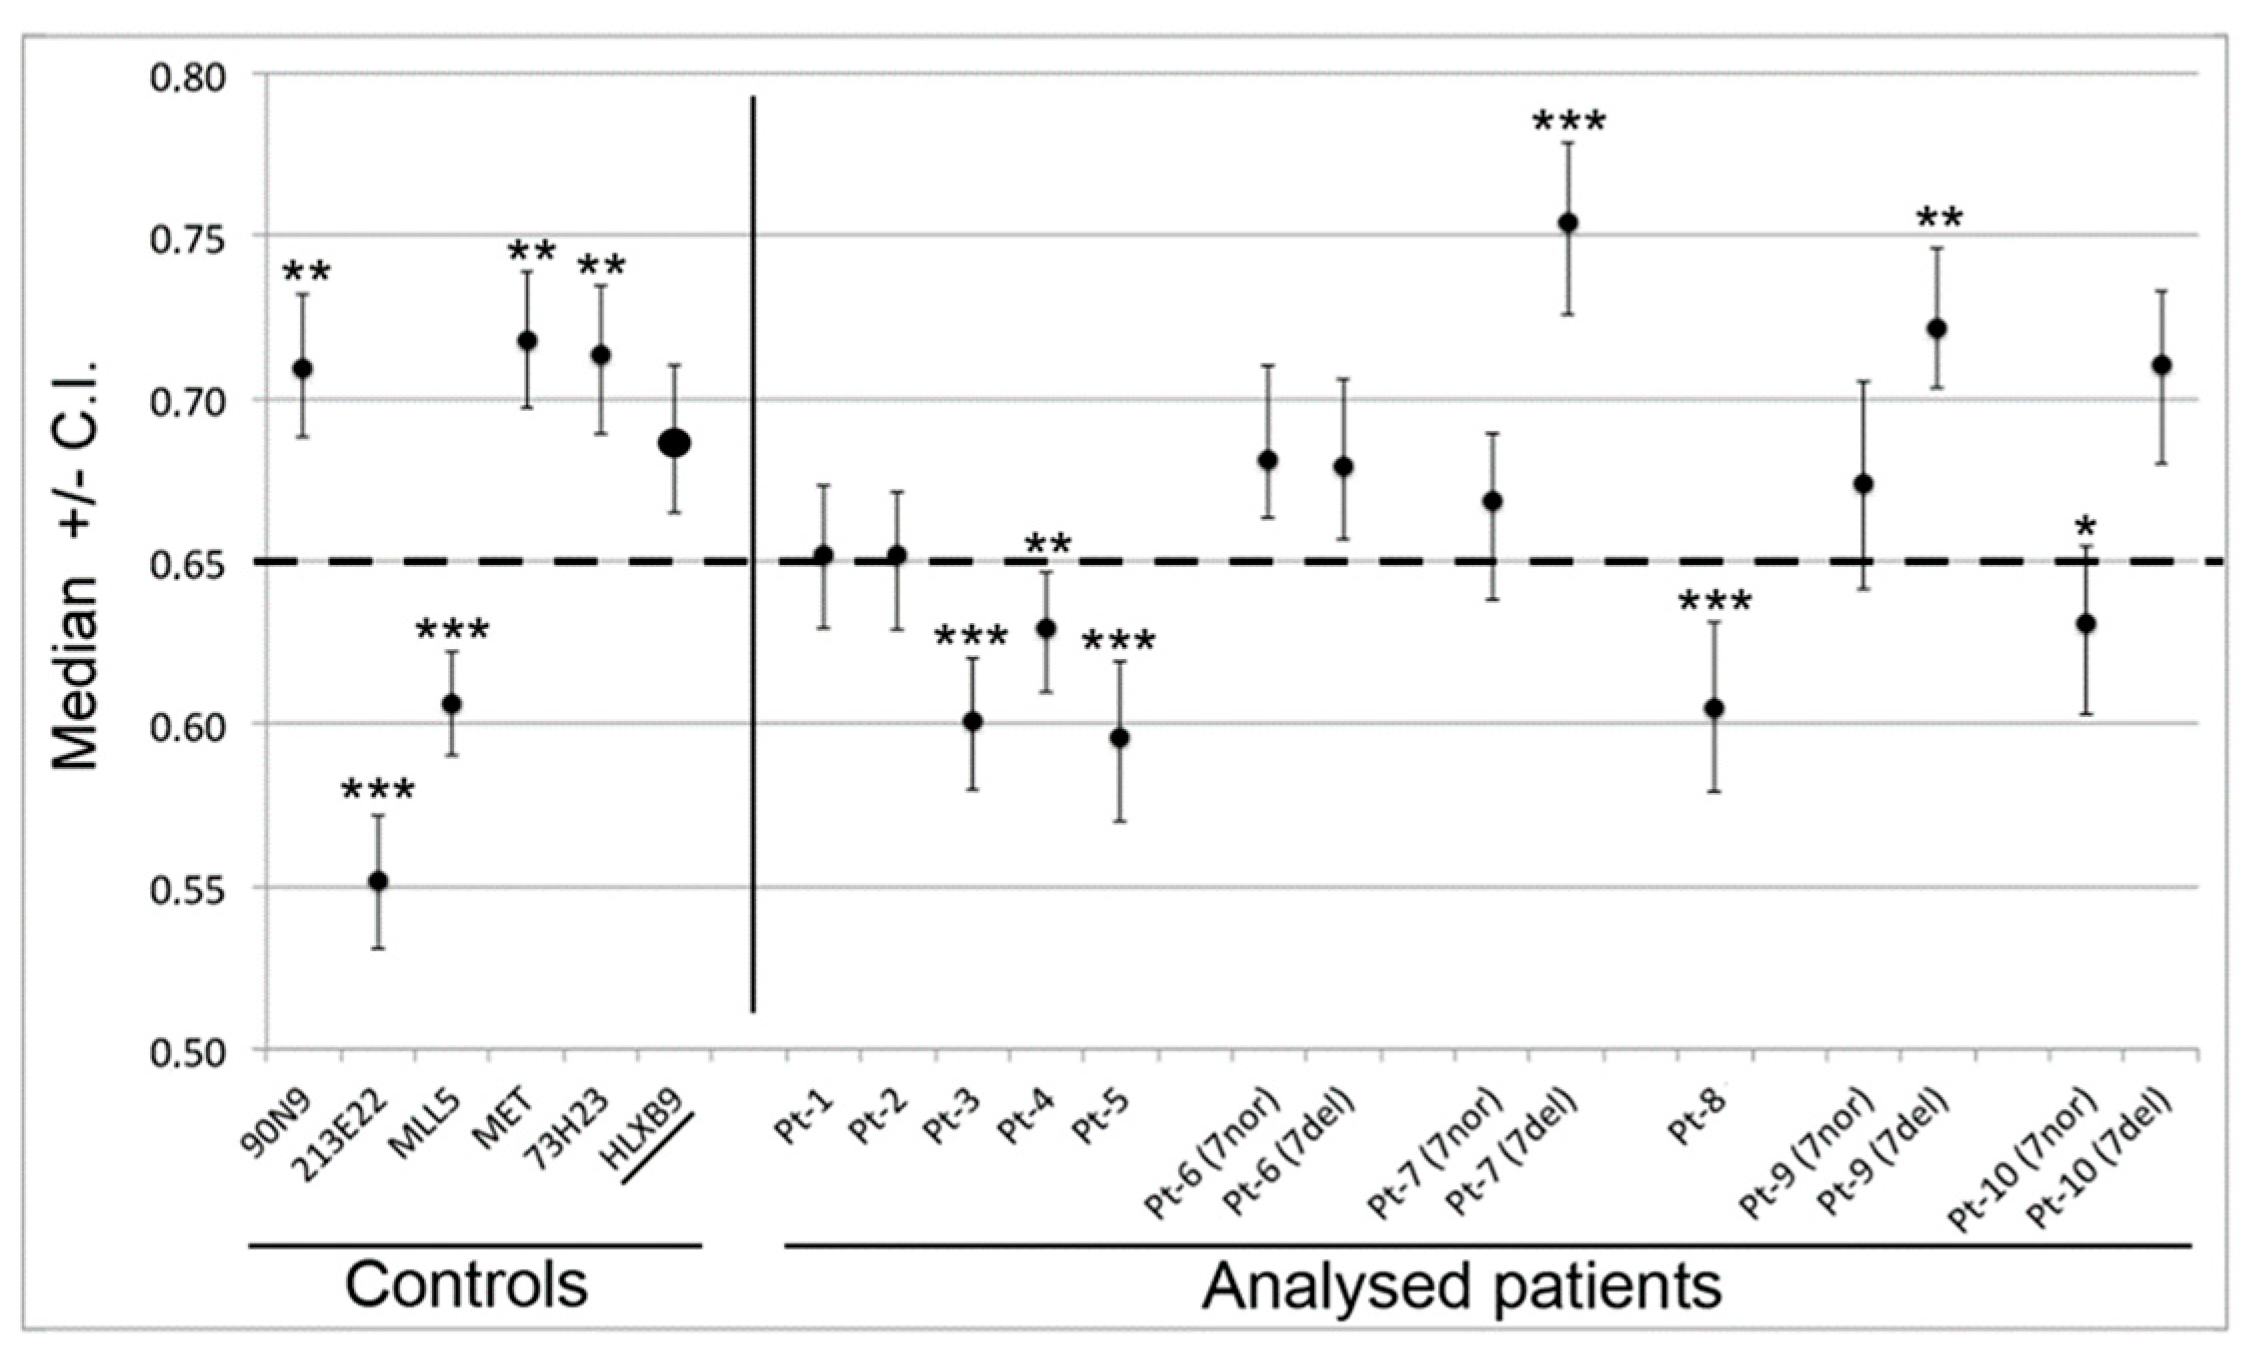
2.3.2. HLXB9 Radial Nuclear Location

We determined the radial nuclear location (RNL; expressed as median values) of the 7q36 region encompassed by RP11-1121A15 (containing the HLXB9 gene) in the 10 selected patient samples (Figure 6). Observations were carried out on both homologs, normal chromosome 7 and deleted chromosome whenever possible, depending on sample quality. Data for Pt-1 to Pt-5 were obtained using single-color FISH with the probe RP11-1121A15. This approach did not enable us to discriminate between the normal chromosome 7 and the deleted one. As a consequence, data are skewed by the presence of the HLXB9 allele on the non-deleted chromosome. The use of dual-color FISH in the other cases (Pt-6 to Pt-10) enabled us to discriminate between the two chromosomes, hence to obtain the individual RNL of the two HLXB9 alleles (“7nor” and “7del” in Figure 6). For Pt-8, although a dual-color approach was used, the RNL was calculated based on both alleles, since it was not possible to clearly identify the allele on the deleted chromosome from the non-deleted one. Overall, our analysis revealed that for Pt-1, Pt-2, Pt-6, Pt-7, Pt-9 and Pt-10, HLXB9 is located in the peripheral region of the nucleus (i.e. RNL higher than 0.650), which is the same compartment where the gene is located in the controls phytohaemagglutinin (PHA)-stimulated lymphocytes (left panel in Figure 6). By contrast, Pt-3, Pt-4, Pt-5 and Pt-8 showed that HLXB9 was positioned more internally in the nucleus (i.e. RNL lower than 0.650), compared to the controls (statistical differences highly significant, p < 0.0001 for Pt-3, Pt-5 and Pt-8 and p < 0.001 for Pt-4) (Figure 6). In the cases where we were able to distinguish between the normal and deleted chromosomes (i.e. Pt-6, Pt-7, Pt-9 and Pt-10), HLXB9 in the deleted chromosome 7 of Pt-7 (RNL = 0.754) and Pt-9 (RNL = 0.722), is located even more peripherally compared to the controls, and compared to the allele belonging to the non-deleted chromosome (p < 0.0001 and p < 0.001, respectively). HLXB9 in Pt-6 maintains a nuclear location similar to that of the control, and there is no significant difference between the normal and deleted chromosomes. In Pt-10 the allele located in the normal chromosome 7 is more internal than the control (p < 0.05).

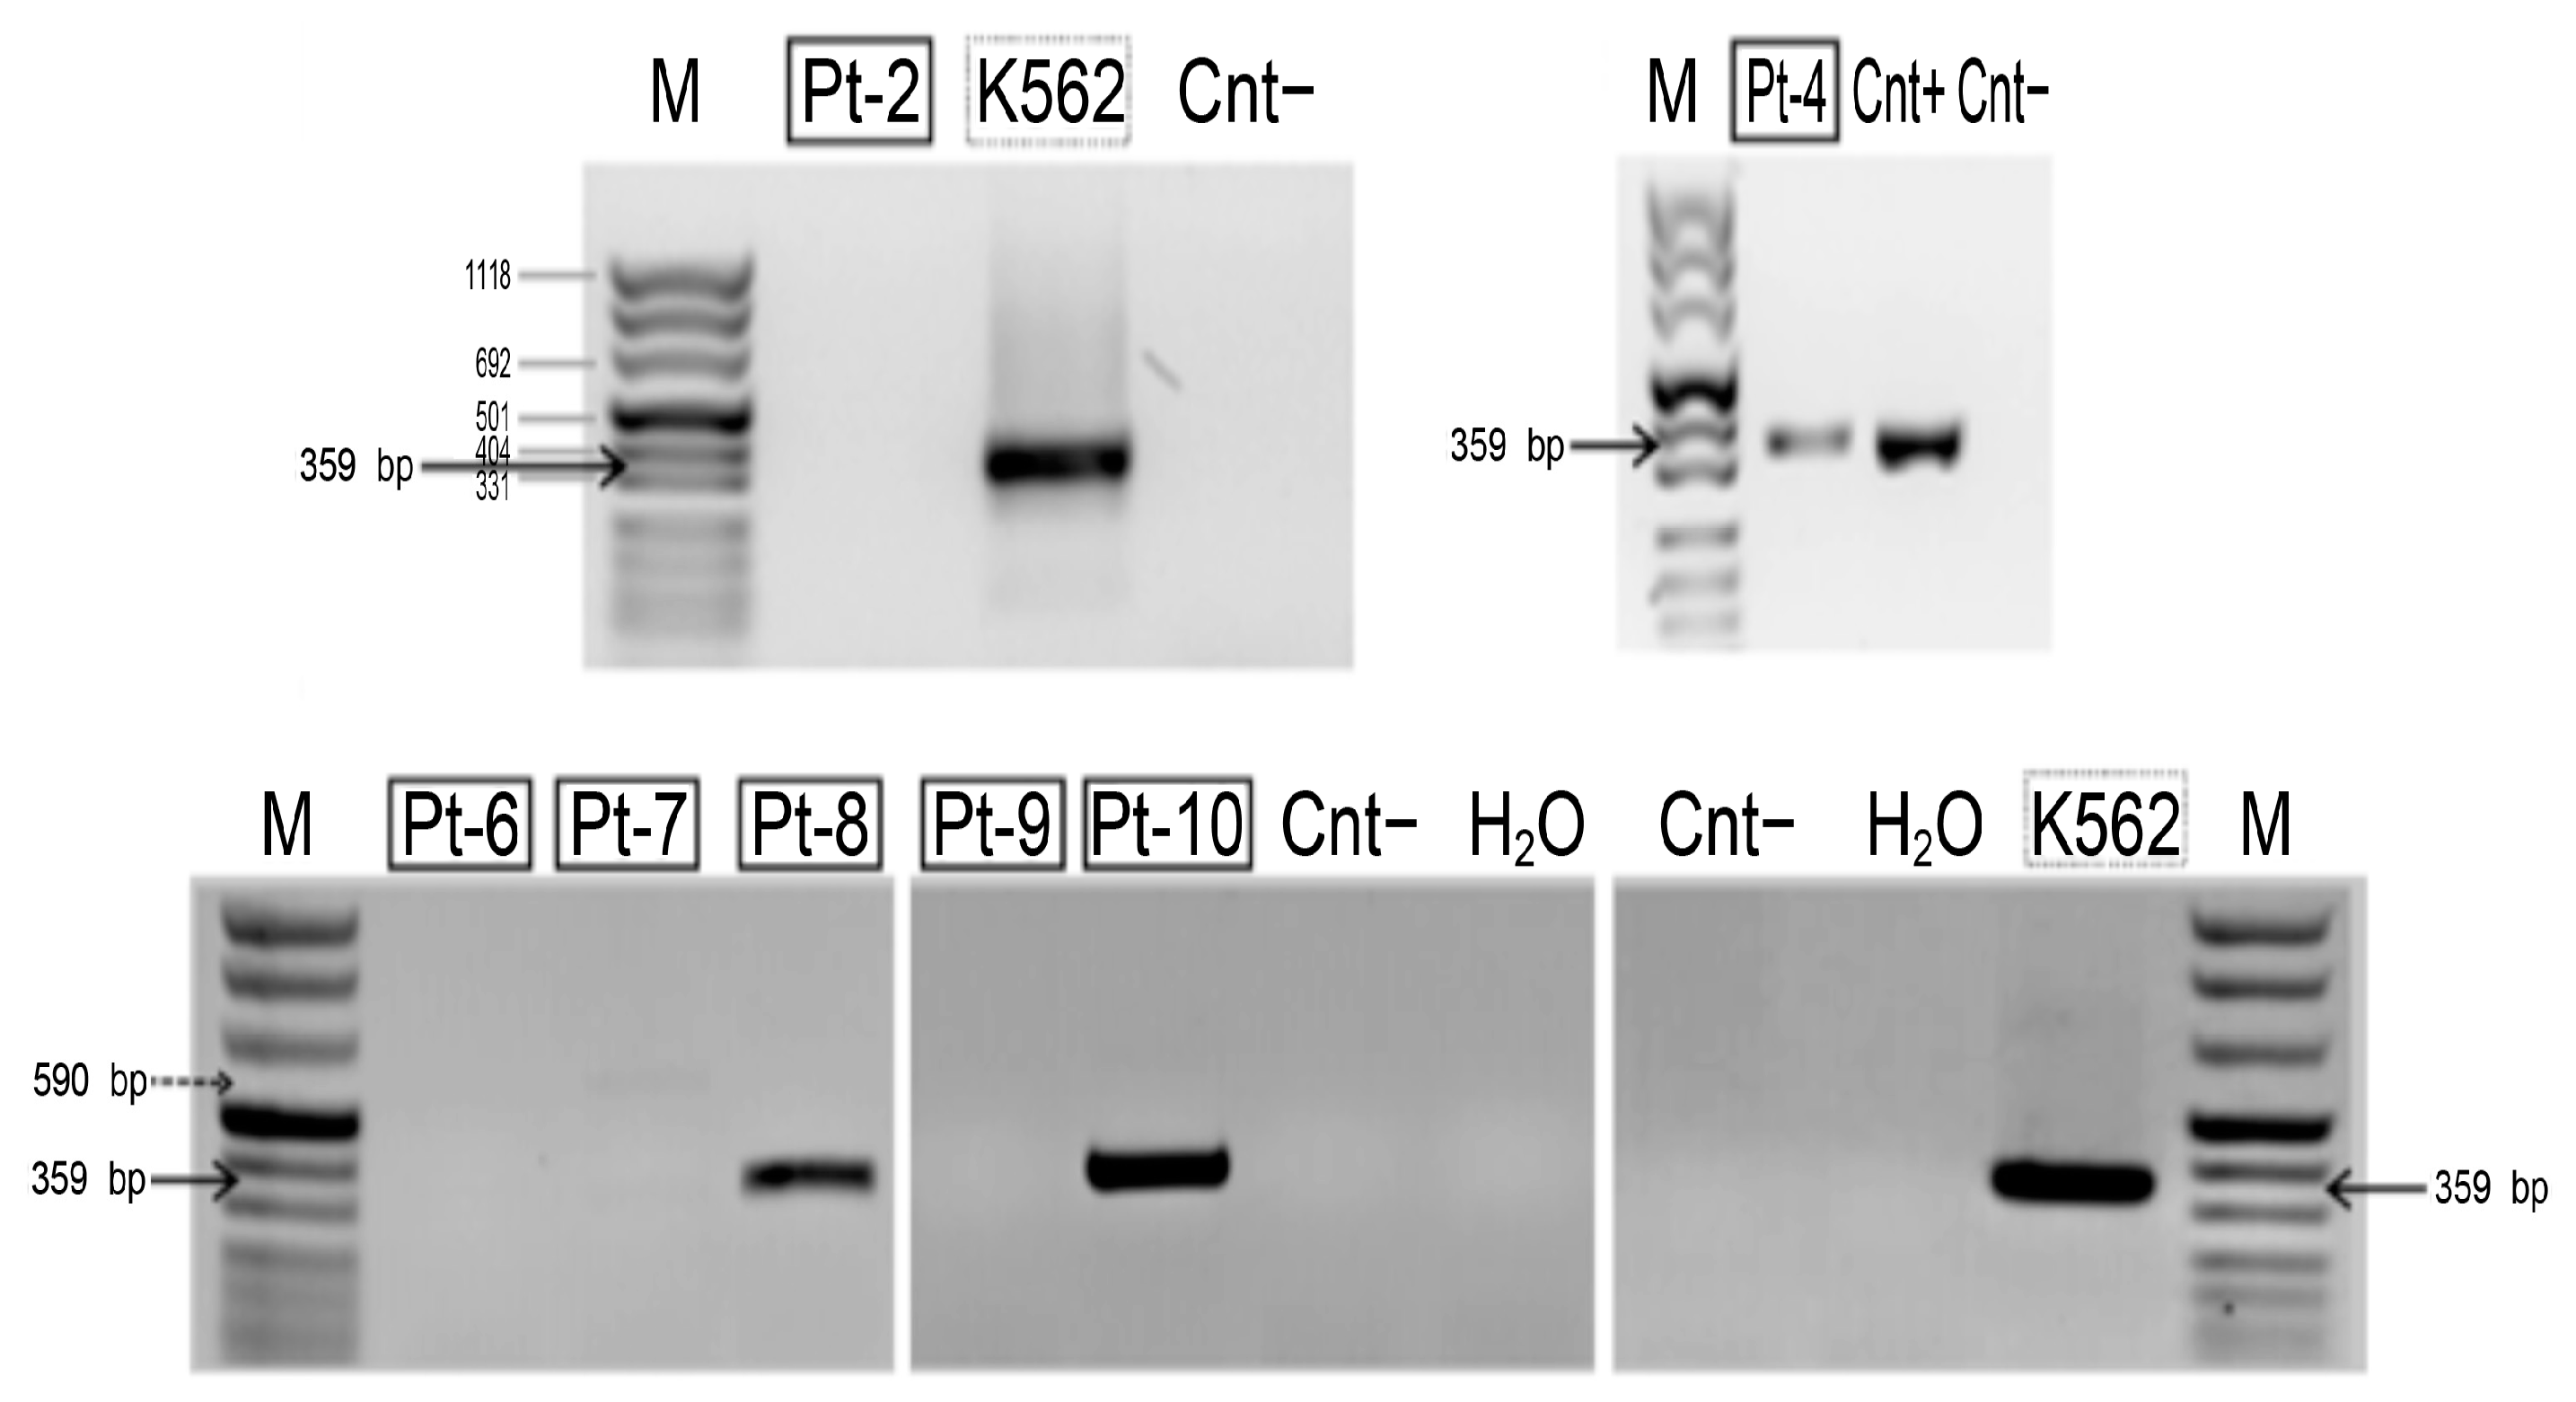
2.3.3. HLXB9Expression

HLXB9 expression analysis revealed the presence of the HLXB9 transcript in Pt-4, Pt-8, and Pt-10, but not in Pt-2, Pt-6, Pt-7, and Pt-9 (Figure 7). Insufficient material from Pt-1, Pt-3 and Pt-5 did not enable us to carry out the analysis in these samples. The amplified transcript corresponds to the predicted fragment of 359 bp, demonstrating the presence of the HLXB9 transcript in these samples. By comparing HLXB9 expression with its radial nuclear location and the GC-content of the chromosomal region in the vicinity of the proximal brakpoint, we observed a high degree of concordance of these three parameters: (1) HLXB9 is expressed, (2) HLXB9 is localized in the nuclear interior, and (3) high GC-level of the involved chromosomal region; or, in the opposite case, (1) HLXB9 is not expressed, (2) HLXB9 localizes at the nuclear periphery, and (3) low GC-level of the involved chromosomal region (Table 3).

3. Discussion

Increased expression of the homeobox gene HLXB9 has been described in several cancers, including leukemia [28,38,39,43,44,45,46,47,48,49,52]. However, little is known about the oncogenic mechanisms of HLXB9. In a specific type of infant leukemia, HLXB9 transcription seems to be triggered by the chromosomal rearrangement t(7;12)(q36;p13), where the breakpoint on chromosome 7 lies proximal to HLXB9 [64]. It has been proposed that HLXB9 may act as a tumor suppressor in AML, and oncogene in ALL [65]. Our interests focus on understanding gene repositioning in the context of nuclear architecture and genome organization as possible mechanisms of HLXB9 activation in hematological malignancies. In this study, we aimed to address (i) whether there are consistent patterns of HLXB9 expression in a broad variety of hematological disorders, (ii) if HLXB9 expression is associated with the presence of chromosome 7 abnormalities, (iii) if HLXB9 expression in del(7q) patients varies depending on chromosomal breakpoints, (iv) if HLXB9 expression status is associated with the positioning of the gene in particular nuclear compartments.

3.1. HLXB9 Expression is Not Associated with Any Specific Leukemia Subtype

In this study, we looked at HLXB9 expression in publicly-available databases (TCGA, TARGET and GTEx; Figure 1 and Figure 2), and in a cohort of 58 patients with various hematological disorders by RT-PCR (summarized in Figure 3). Across the datasets, HLXB9 expression in the majority of samples was comparable to that of normal blood. However, it was evident that a number of outliers are spread at higher expression levels in AML and ALL, suggesting that HLXB9 expression could be linked to features other than diagnosis. Similarly, data gathered from our 58 patient samples showed HLXB9 expression in approximately 20% of cases. From our initial survey of the total patient cohort according to diagnosis (Figure 3A), the patterns of HLXB9 expression varied, and was not particularly prominent in any diagnostic group. A higher number of positive patients was noticed in the MDS-MPD and AML groups, consistent with the higher incidence of chromosome 7 abnormalities in these disorders. The small sample sizes for the two patients with FA limited our interpretation for HLXB9 expression in this subgroup. These observations are in line with the description of HLXB9 overexpression in a variety of malignancies unrelated to the hematopoietic system, some of which correlate with the role of HLXB9 in pancreatic and neuronal development in the embryo [28,43,44,45,46,47,48,49].

3.2. HLXB9 Expression is Not Necessarily Associated with the Presence of Chromosome 7 Abnormalities

The expression of HLXB9 according to cytogenetic subgroups in public databases correlated with our observations in the patient cohort (Figure 2 and Figure 3). Approximately 30% of patients with del(7q), alone or in conjunction with other rearrangements, showed expression of HLXB9, when compared to 20–25% of normal karyotypes or other subgroups. The expression of HLXB9 in patients without chromosome 7 abnormalities indicates that its activation may not be solely dependent on chromosome 7 rearrangements. It should be taken into consideration that a proportion of patients presents cryptic abnormalities or microdeletions of 7q [39,66], which may go unnoticed by conventional karyotyping, and become misclassified in the studied cohorts. Similarly, it cannot be excluded that rearrangements of other chromosomes may bring about changes in nuclear organization that indirectly activate other genes in trans. However, among patients with chromosome 7 abnormalities in our cohort, HLXB9 was expressed at a higher proportion in patients with interstitial deletions of 7q, and those with other chromosome 7 abnormalities (e.g. rings, additions, translocations), when compared to patients with terminal deletions (i.e. with loss of the HLXB9 allele on the deleted chromosome). It was not possible to compare this data with published datasets due to the lack of cytogenetic information in the latter.

3.3. HLXB9 is Expressed When del(7q) Proximal Breakpoint Lies in a GC-rich Genomic Region

The 10 samples used in the present work were characterized by an interstitial deletion of the long arm in one of the two chromosomes 7. The deletions spanned from few to several chromosomal bands, and the deleted segment did not include the HLXB9 gene, located at 7q36.3, at about 2.3 Mb from the telomere (Figure 5). Each deletion determined a specific repositioning of HLXB9 in the nucleus, depending on the GC-content of the chromosomal region close to the proximal breakpoint. We compared the HLXB9expression status of each patient with the RNL of HLXB9 and the compositional properties of the chromosomal region close to the centromeric breakpoint, observing a large degree of concordance with these three parameters (Table 3). We observed that deletions causing a repositioning of the 7q36 region near the GC-poor bands 7q21 (Pt-1, Pt-2, Pt-6 and Pt-7) or 7q31 (Pt-9 and Pt-10), result in a more peripheralnuclear localization of the HLXB9 allele. Conversely, deletions joining the telomeric end of chromosome 7 with the GC-rich 7q22 band (Pt-3, Pt-4, Pt-5 and Pt-8) result in an inner nuclear localization of HLXB9.
Thus, the transcriptional activation of HLXB9 occurs only in those cases carrying a deletion of chromosome 7 where the gene moves to the more internal part of the nucleus. Indeed, two cases (Pt-4 and Pt-8) showed a relocation of HLXB9 in the inner part of the nucleus and activation of its transcription. Incidentally, in Pt-10, HLXB9 expression was also observed, but the allele re-located to the inner part of the nucleus belongs to the non-deleted chromosome 7. In this latter case, we can hypothesize that transcriptional activation could be due to anectopic activation of this allele, and may indicate a more complex mechanism leading to gene activation in leukemia. We described a similar scenario in the leukemia cell line GDM-1 where, in the presence of the translocation t(6;7)(q23;q36), the activation of HLXB9 seems to arise from the non-affected chromosome [32]. It is to be noted that it is still a topic of debate whether HLXB9 is active in non-pathological conditions and in certain differentiated cells, other than during embryonic development [39,51,52,53,54].

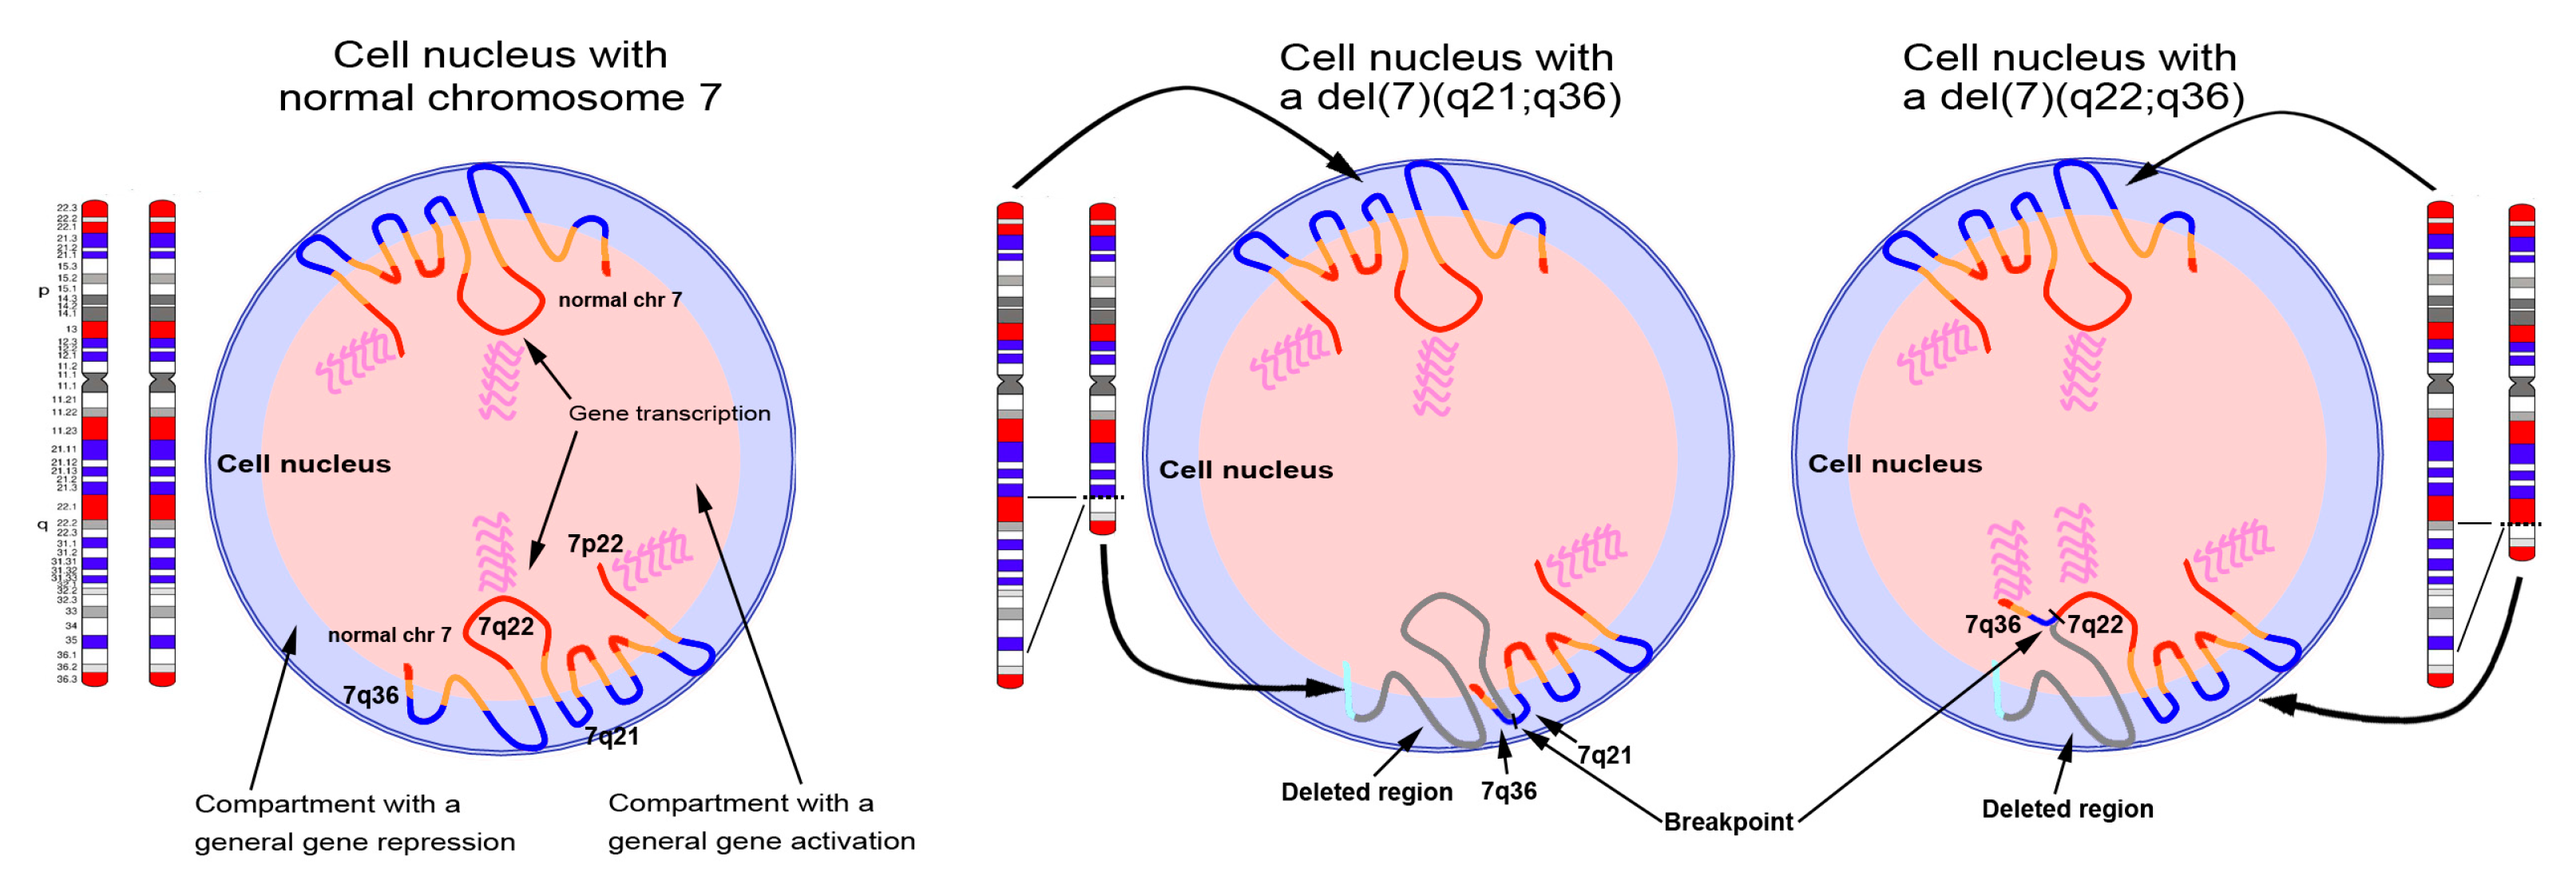
3.4. Mechanisms Leading to HLXB9 Re-positioning in the Nucleus

Although the biology of hematological disorders with del(7q) is still largely unknown, the del(7q) seems to have an important role in tumor emergence and progression [67,68,69]. We speculate that the oncogenic mechanisms of del(7q) leukemia rely on differences in gene expression patterns that reflect different deletion breakpoints (Figure 8). Deletions involving different chromosomal bands might lead to the activation or silencing of different gene pathways due to alteration of the nuclear architecture and genome organization.
According to our results, the repositioning of HLXB9 in the nucleus of leukemia cells is dependent on the newly juxtaposed chromosomal region resulting from the deletion. Our observations are consistent with other reports showing that the repositioning of genes is non-random, and depends on the properties of neighboring genomic loci [70].
Little is known regarding the mechanisms that induce gene repositioning in the nucleus. Zones of gene deserts seem to be enriched with lamina-associated domains (LADs) that favor their attachment to the nuclear lamina, resulting in their transcriptional silencing [26,71]. The distribution of such LADs along different regions of chromosome 7 (Figure 5) [63] further supports the model ofzig-zag positioning of chromosome 7 in the nuclei of control lymphocytes (Figure 6) [10]. Theoretically, an interstitial deletion bringing together two zones of transcriptionally silent LADs at the nuclear periphery would not produce an effect on the expression of a particular gene. Similarly, a loss of LADs could prevent an adjacent region from interacting with the nuclear lamina, and becoming transcriptionally active under a new neighboring structural domain.

3.5. Gene Expression in 3D Chromatin Architecture

Individual gene repositioning within the interphase nucleus should be seen in context with the more complex 3D organization of the whole genome and chromatin architecture in differentiated or replicative cells. It was recently shown that evolutionarily successful chromosomal rearrangements do not alter the nuclear position of the regions involved. This is not the case in pathological situations, where the rearrangements typically alter the gene structure, and often also the gene nuclear position [32].
Many studies have focused on how gene relocation might affect gene regulation and expression, in both cell development and disease [14,16,28,38,72,73], and how these alterations are associated with the interaction with certain structures such as LADs and TADs [24,74,75]. We foresee that these interactions, higher-order chromatin features, and their disturbance caused by chromosomal rearrangements, are the key to understanding the oncogenic changes in gene expression, which would bring us a step closer in comprehending the process of leukemogenesis associated with chromosome 7 aberrations.
Current research on spatial organization of the genome in cancer cells confirms that a number of genes are consistently repositioned in specific pathologies, such as breast and prostate cancer [30,31,76,77,78]. Therefore, the analysis of nuclear gene positioning in cancer could be of diagnostic value. Some investigations also showed repositioning of whole chromosomes in leukemia samples prior to relapse, indicating the prognostic value of nuclear positioning studies [79]. Further work is needed to fully understand the implications of our findings, and if mapping of HLXB9 in the nucleus of leukemia cells has any diagnostic potential. The prognosis of del(7q) leukemias is known to be generally very poor, irrespective of breakpoint or extent of deletion. Similarly, the presence of del(7q) in MDS-MPD and FA patients is a sign of malignant transformation, and hence indicative of poor clinical outcome. However, the added information coming from HLXB9 repositioning, associated with gene expression data, might help to refine the classification of these cases, and aid design tailored therapy.

4. Materials and Methods

4.1. Patient Samples

We used archival material from 58 patient samples in the form of fixed chromosome and nuclei suspensions in methanol:acetic acid, some of which were used in previous studies [38,58,61]. Of these, we selected 10 samples (Pt-1 to Pt-10, with details in Table 1) with good material quality, enabling us to carry out more detailed analyzes using fluorescence in situ hybridization (FISH) with several genomic probes and reverse transcription polymerase chain reaction (RT-PCR), to assess HLXB9 expression. Four patient samples presented in this work (from Pt-1 to Pt-4) were described in earlier reports [38,58,61]. Archival materials of the six other patients (from Pt-5 to Pt-10) are described here for the first time. Pt-5 was contributed by Professor Jochen Harbott, Oncogenetic Laboratory, Children’s Hospital, University of Giessen, Germany. Pt-6 to Pt-10 were contributed by Associazione Italiana Ematologia Oncologia Pediatrica (AIEOP), Centro Ricerca Tettamanti, Pediatric Department, University of Milano-Bicocca, Monza, Italy. A complete karyotype, available in the majority of cases, was obtained using chromosome banding with standard methods. Moreover, the extent of deletions was refined by FISH. Ethical approval no: 16516-TISS-Apr/2019-18741-2.

4.2. Control Samples

Control samples from peripheral blood lymphocytes of healthy individuals were prepared and analyzed previously [10]. Data of radial nuclear location (RNL) published at that time was used as a reference for the present study. Furthermore, the myeloid leukemia cell line K562, and a patient positive for HLXB9 expression (patient no. 10 described in previous work [38]), were used as positive controls for expression analysis based on RT-PCR performed on Pt-6 to Pt-10.

4.3. Reverse Transcription Polymerase Chain Reaction (RT-PCR)

RNA was extracted from archival fixed-chromosome and nuclei suspensions using Qiagen RNeasy mini Kit (Qiagen, Manchester, UK). cDNA was synthesised using Superscript III reverse transcriptase kit (Life Technologies, Paisley, UK). Nested RT-PCR was conducted to assess HLXB9 expression using primers and conditions as previously described [38]. Briefly, primers for the first round of amplification were HB9-WT1f: 5’-CTTCCAGCTGGACCAGTGGCTG-3’ and HB9-WT1r: 5’-CGTCCTCGTCCTCGTCCTCC-3’, and HB9-1994 forward: 5’-TCCACCGCGGGCATGATCCTG-3’ and HB9-WT2 reverse: 5’-GGCCCCAGCAGCTCCTCGGCTC-3’ for the second round.
The amplification conditions were: Denaturation at 94°C for 3 min, followed by 35 cycles of annealing at 68 °C for 30 s, extension at 68 °C for 1 min, final extension at 68 °C for 3 min, holding at 4°C. The predicted size of the amplified DNA segment is 359 bp, based on the available sequence of the HLXB9 mRNA (accession number: NM_005515.4), also consistent with the results shown by [80].

4.4. Data Mining

Data from the three datasets. The Cancer Genome Atlas (TCGA), Therapeutically Applicable Research to Generate Effective Treatments (TARGET) and Genotype-Tissue Expression (GTEx), were obtained from the University of California, Santa Cruz, Xena repository. The raw gene expression data across the three datasets (TCGA, TARGET, and GTEx) was processed at UCSC using the TOIL pipeline as described in [81]. All the expression levels for the genes of interest were extracted from the TCGA-TARGET-GTEX cohort. To investigate the association between expression level and the cytogenetic phenotype, we extracted phenotypic information from the TCGA acute myeloid leukemia (AML) and Therapeutically Applicable Research to Generate Effective Treatments (TARGET) acute lymphoblastic leukemia (ALL)datasets. 7q deletion information was available only for the TCGA AML data. We used 337 whole blood and 140 K562 Leukemia cell line sample data from the Genotype-Tissue Expression (GTEx) project as controls.

4.5. Fluorescence in Situ Hybridization (FISH) and Image Capture

Metaphase chromosome and interphase nuclei from the patients analyzed here were obtained from the archival material stored in methanol-acetic acid. Dual-color FISH experiments on metaphase chromosomes and interphase nuclei were performed using a selection of probes mapping at different sites in the long arm of chromosome 7 (see Table 2 for list of probes and corresponding chromosomal location). In particular, for the mapping of HLXB9 on 7q36.3, we used the PAC RP5-1121A15 (GenBank accession No. AC006357.5) containing the gene. We also used commercially available probe mixtures XL 7q22/7q36, containing the KMT2E and EZH2 genes, and XL del(7)(q22q31), containing the KMT2E and MET genes (MetaSystems, Athlussein, Germany). Other probes included chromosome 7 paint directly labeled in green (Cambio, Cambridge, UK), BACs RP11-90N9 (GenBank accession No. AZ518618.1), RP11-213E22 (GenBank accession No. AQ484445.1), RP11-73H23 (GenBank accession No. AQ266610.1). Additionally, we included probes previously used and described in [58]. These were: Cosmid clones Cos5.3, Cos7d.2, Cos8a.2, Cos1107, Cos1120 and YAC clones HSC7E485, HSC7E124, HSC7E86, HSC7E769, and the PAC clone 1065. Probes were labeled either directly with fluorochromes, or indirectly with biotin or digoxigenin, using nick translation (Roche, Mannheim, Germany), and detected according to standard methods previously described [21]. FISH experiments were carried out as previously described [10,82]. Hybridization signals on metaphase chromosomes and interphase nuclei were analyzed using an Olympus AX70 fluorescence microscope, and images were captured using MacProbe v4.3 software (Applied Imaging, Newcastle, UK).

4.6. Radial Nuclear Positioning Analysis

Radial nuclear location (RNL) of HLXB9 and other relevant loci was based on two dimensional (2D) analysis of FISH images of interphase nuclei as previously described [10,21]. Briefly, the RNL of each hybridization signal was determined as the ratio of the nuclear radius. The numerical value (namely the position of the hybridization signals along the nuclear radius) ranges between 0 and 1, where 0 indicates the cent and 1 the outer extreme of the nucleus. Depending on sample quality, we aimed at scoring at least 200 nuclei per sample. The localization of large number of hybridization signals relative to specific loci was determined according to well-established statistical methods that take into consideration the median value of all signals +/− confidence interval (CI) [10]. According to these methods, median values lower than 0.650 are indicative of loci positioned towards the nuclear interior [10,28,32,38].
The statistical analysis and the corresponding graphs were carried out using Microsoft Excel and StatView software (SAS Institute Inc., Cary, USA) [83]. Statistical significance was evaluated using the Two-tailed t-test.

5. Conclusions

In this study, we address the radial nuclear repositioning of a gene in relation to the compositional properties of chromosomal bands involved in a chromosomal deletion and its effect onits transcriptional activation. We show here that the repositioning of HLXB9 in the nuclei of leukemia cells with del(7q) depends on the location of the breakpoints on chromosome 7, which implies the disruption and re-joining of different chromosomal bands. This type of repositioning may influence the nuclear organization of the chromatin and the transcriptional activity of the repositioned genes. We show that HLXB9 becomes activated when relocated to the inner part of the nucleus, consistent with previously described observations [28,32,38]. We believe that our results will open new grounds for research in the field of cancer genome organization, sheding some light into the mechanisms leading to gene repositioning and gene regulation in tumor initiation and progression.

Supplementary Materials

The following are available online at https://www.mdpi.com/2072-6694/11/4/585/s1, Figure S1: Distribution of HLXB9 expression levels across datasets stratified by gender, Figure S2: HLXB9 expression levels in AML, ALL, Whole Blood and Leukemia Cell Line differentiated per dataset of origin: GTEX, TARGET and TCGA, Figure S3: Distribution of HLXB9 expression levels in TCGA AML data stratified per cytogenetic phenotype, Table S1: Phenotypic Characterization for del(7q) samples with high HLXB9 expression levels.

Author Contributions

Conceptualization, C.F., S.S. and S.T.; Formal analysis, C.F., T.O., D.R., V.S., D.C., C.G.L., F.B., H.A.F., S.R., G.G., G.C., C.S., S.S. and S.T.; Funding acquisition, S.S. and S.T.; Investigation, C.F., T.O., D.R., V.S., D.C., C.G.L., F.B., H.A.F., S.R., G.G., G.C. and C.S.; Project administration, S.S. and S.T.; Resources, G.C., C.S., S.S. and S.T.; Supervision, S.S. and S.T.; Validation, G.C., C.S., S.S. and S.T.; Visualization, D.R. and S.S.; Writing—original draft, J.M.B., S.S. and S.T.; Writing—review & editing, C.F., D.R., C.S., J.M.B., S.S. and S.T.

Funding

This research was funded by Research Plan 2016\2018 from Department of Biological, Geological and Environmental Sciences, University of Catania to C.F.” and “The APC was funded by Brunel University London; V.S., and F.B. are supported by a fellowship of the PhD program (University of Catania, Italy); D.R. is the recipient of a Kidscan funded PhD studentship and partly supported by Brunel University London.

Conflicts of Interest

The authors declare no conflict of interest.

References

  1. Pombo, A.; Dillon, N. Three-dimensional genome architecture: players and mechanisms. Nat. Rev. Mol. Cell. Biol. 2015, 16, 245–257. [Google Scholar] [CrossRef]
  2. Brickner, J. Genetic and epigenetic control of the spatial organization of the genome. Mol. Biol. Cell 2017, 28, 364–369. [Google Scholar] [CrossRef] [PubMed] [Green Version]
  3. Sadoni, N.; Langer, S.; Fauth, C.; Bernardi, G.; Cremer, T.; Turner, B.M.; Zink, D. Nuclear organization of mammalian genomes: polar chromosome territories build up functionally distinct higher order compartments. J. Cell. Biol. 1999, 146, 1211–1226. [Google Scholar] [CrossRef] [PubMed]
  4. Croft, J.A.; Bridger, J.M.; Boyle, S.; Perry, P.; Teague, P.; Bickmore, W.A. Differences in the localization and morphology of chromosomes in the human nucleus. J. Cell. Biol. 1999, 145, 1119–1131. [Google Scholar] [CrossRef] [PubMed]
  5. Boyle, S.; Gilchrist, S.; Bridger, J.M.; Mahy, N.L.; Ellis, J.A.; Bickmore, W.A. The spatial organization of human chromosomes within the nuclei of normal and emerin-mutant cells. Hum. Mol. Genet. 2001, 10, 211–219. [Google Scholar] [CrossRef] [PubMed] [Green Version]
  6. Cremer, T.; Cremer, C. Chromosome territories, nuclear architecture and gene regulation in mammalian cells. Nat. Rev. Genet. 2001, 2, 292–301. [Google Scholar] [CrossRef] [PubMed]
  7. Saccone, S.; Federico, C.; Bernardi, G. Localization of the gene-richest and the gene-poorest isochores in the interphase nuclei of mammals and birds. Gene 2002, 300, 169–178. [Google Scholar] [CrossRef]
  8. Federico, C.; Scavo, C.; Cantarella, C.D.; Motta, S.; Saccone, S.; Bernardi, G. Gene-rich and gene-poor chromosomal regions have different locations in the interphase nuclei of cold-blooded vertebrates. Chromosoma 2006, 115, 123–128. [Google Scholar] [CrossRef] [PubMed]
  9. Meuleman, W.; Peric-Hupkes, D.; Kind, J.; Beaudry, J.B.; Pagie, L.; Kellis, M.; Reinders, M.; Wessels, L.; van Steensel, B. Constitutive nuclear lamina–genome interactions are highly conserved and associated with A/T-rich sequence. Genome Res. 2013, 23, 270–280. [Google Scholar] [CrossRef] [PubMed]
  10. Federico, C.; Cantarella, C.D.; Di Mare, P.; Tosi, S.; Saccone, S. The radial arrangement of the human chromosome 7 in the lymphocyte cell nucleus is associated with chromosomal band gene density. Chromosoma 2008, 117, 399–410. [Google Scholar] [CrossRef] [PubMed] [Green Version]
  11. Misteli, T. Beyond the sequence: cellular organization of genome function. Cell 2007, 128, 787–800. [Google Scholar] [CrossRef]
  12. Morey, C.; Da Silva, N.R.; Kmita, M.; Duboule, D.; Bickmore, W.A. Ectopic nuclear reorganization driven by a Hoxb1 transgene transported into Hoxd. J. Cell. Sci. 2008, 121, 571–577. [Google Scholar] [CrossRef] [PubMed]
  13. Finlan, L.E.; Sproul, D.; Thomson, I.; Boyle, S.; Kerr, E.; Perry, P.; Ylstra, B.; Chubb, J.R.; Bickmore, W.A. Recruitment to the nuclear periphery can alter expression of genes in human cells. PLoS Genet. 2008, 4, e1000039. [Google Scholar] [CrossRef] [PubMed]
  14. Szczerbal, I.; Foster, H.A.; Bridger, J.M. The spatial repositioning of adipogenesis genes is correlated with their expression status in a porcine mesenchymal stem cell adipogenesis model system. Chromosoma 2009, 118, 647–663. [Google Scholar] [CrossRef] [PubMed]
  15. Elcock, L.S.; Bridger, J.M. Exploring the relationship between interphase gene positioning, transcriptional regulation and the nuclear matrix. Biochem. Soc. Trans. 2010, 38, 263–267. [Google Scholar] [CrossRef] [PubMed] [Green Version]
  16. Harewood, L.; Schutz, F.; Boyle, S.; Perry, P.; Delorenzi, M.; Bickmore, W.A.; Reymond, A. The effect of translocation-induced nuclear reorganization on gene expression. Genome Res. 2010, 20, 554–564. [Google Scholar] [CrossRef] [PubMed] [Green Version]
  17. Pindyurin, A.V. van Steensel, B. Hox in space. Nucleus 2012, 3, 118–122. [Google Scholar] [CrossRef]
  18. Fraser, J.; Williamson, I.; Bickmore, W.A.; Dostie, J. An overview of genome organization and how we got there: from FISH to Hi-C. Microbiol. Mol. Biol. Rev. 2015, 79, 347–372. [Google Scholar] [CrossRef]
  19. Lieberman Aiden, E.; van Berkum, N.L.; Williams, L.; Imakaev, M.; Ragoczy, T.; Telling, A.; Amit, I.; Lajoie, B.R.; Sabo, P.J.; Dorschner, M.O.; et al. Comprehensive mapping of long-range interactions reveals folding principles of the human genome. Science 2009, 326, 289–293. [Google Scholar] [CrossRef]
  20. Jabbari, K.; Bernardi, G. An isochore framework underlies chromatin architecture. PLoS ONE 2017, 12, e0168023. [Google Scholar] [CrossRef]
  21. Federico, C.; Pappalardo, A.M.; Ferrito, V.; Tosi, S.; Saccone, S. Genomic properties of chromosomal bands are linked to evolutionary rearrangements and new centromere formation in primates. Chromosome Res. 2017, 25, 261–276. [Google Scholar] [CrossRef]
  22. Dixon, J.R.; Selvaraj, S.; Yue, F.; Kim, A.; Li, Y.; Shen, Y.; Hu, M.; Liu, J.S.; Ren, B. Topological domains in mammalian genomes identified by analysis of chromatin interactions. Nature 2012, 485, 376. [Google Scholar] [CrossRef] [PubMed]
  23. Rao, S.S.; Huntley, M.H.; Durand, N.C.; Stamenova, E.K.; Bochkov, I.D.; Robinson, J.T.; Sanborn, A.L.; Machol, I.; Omer, A.D.; Lander, E.S.; et al. A 3D map of the human genome at kilobase resolution reveals principles of chromatin looping. Cell 2014, 159, 1665–1680. [Google Scholar] [CrossRef]
  24. Akhtar, W.; de Jong, J.; Pindyurin, A.V.; Pagie, L.; Meuleman, W.; de Ridder, J.; Berns, A.; Wessels, L.F.; van Lohuizen, M.; van Steensel, B. Chromatin position effects assayed by thousands of reporters integrated in parallel. Cell 2013, 154, 914–927. [Google Scholar] [CrossRef]
  25. Kind, J.; Pagie, L.; Ortabozkoyun, H.; Boyle, S.; de Vries, S.S.; Janssen, H.; Amendola, M.; Nolen, L.D.; Bickmore, W.A.; van Steensel, B. Single-cell dynamics of genome-nuclear lamina interactions. Cell 2013, 153, 178–192. [Google Scholar] [CrossRef]
  26. Van Steensel, B.; Belmont, A.S. Lamina-associated domains: links with chromosome architecture, heterochromatin, and gene repression. Cell 2017, 169, 780–791. [Google Scholar] [CrossRef]
  27. Szczerbal, I.; Bridger, J.M. Association of adipogenic genes with SC-35 domains during porcine adipogenesis. Chromosome Res. 2010, 18, 887–895. [Google Scholar] [CrossRef] [PubMed]
  28. Leotta, C.G.; Federico, C.; Brundo, M.V.; Tosi, S.; Saccone, S. HLXB9 gene expression, and nuclear location during in vitro neuronal differentiation in the SK-N-BE neuroblastoma cell line. PLoS ONE 2104, 9, e105481. [Google Scholar] [CrossRef] [PubMed]
  29. Bridger, J.M.; Arican-Gotkas, H.D.; Foster, H.A.; Godwin, L.S.; Harvey, A.; Kill, I.R.; Knight, M.; Mehta, I.S.; Ahmed, M.H. The non-random repositioning of whole chromosomes and individual gene loci in interphase nuclei and its relevance in disease, infection, aging, and cancer. Springer 2014, 263–279. [Google Scholar]
  30. Meaburn, K.J.; Misteli, T. Locus-specific and activity-independent gene repositioning during early tumorigenesis. J. Cell. Biol. 2008, 180, 39–50. [Google Scholar] [CrossRef] [Green Version]
  31. Meaburn, K.J.; Gudla, P.R.; Khan, S.; Lockett, S.J.; Misteli, T. Disease-specific gene repositioning in breast cancer. J. Cell. Biol. 2009, 187, 801–812. [Google Scholar] [CrossRef] [PubMed]
  32. Federico, C.; Leotta, C.G.; Bruno, F.; Longo, A.M.; Owoka, T.; Tosi, S.; Saccone, S. GDM-1. Nuclear repositioning of the non-translocated HLXB9 allele in the leukemia cell line GDM-1 harboring a t(6;7)(q23;q36). Cytogenet. Genome Res 2017, 153, 10–17. [Google Scholar] [CrossRef]
  33. Kozubek, S.; Lukasova, E.; Mareckova, A.; Skalníková, M.; Kozubek, M.; Bártová, E.; Kroha, V.; Krahulcová, E.; Slotová, J. The topological organization of chromosomes 9 and 22 in cell nuclei has a determinative role in the induction of t(9,22) translocations and in the pathogenesis of t(9,22) leukemias. Chromosoma 1999, 108, 426–435. [Google Scholar] [CrossRef] [PubMed]
  34. Lukášová, E.; Kozubek, S.; Kozubek, M.; Falk, M.; Amrichová, J. The 3D structure of human chromosomes in cell nuclei. Chromosom. Res. 2002, 10, 535–548. [Google Scholar] [CrossRef]
  35. Taslerova, R.; Kozubek, S.; Lukasova, E.; Jirsová, P.; Bártová, E.; Kozubek, M. Arrangement of chromosome 11 and 22 territories, EWSR1 and FLI1 genes, and other genetic elements of these chromosomes in human lymphocytes and Ewing sarcoma cells. Hum. Genet. 2003, 112, 143–155. [Google Scholar] [PubMed]
  36. Barki-Celli, L.; Lefebvre, C.; Le Baccon, P.; Nadeau, G.; Bonnefoix, T.; Usson, Y.; Vourc’h, C.; Khochbin, S.; Leroux, D.; Callanan, M. Differences in nuclear positioning of 1q12 pericentric heterochromatin in normal and tumor B lymphocytes with 1q rearrangements. Genes, Chromosomes Cancer 2005, 43, 339–349. [Google Scholar] [CrossRef]
  37. Grasser, F.; Neusser, M.; Fiegler, H.; Thormeyer, T.; Cremer, M.; Carter, N.P.; Cremer, T.; Müller, S. Replication-timing-correlated spatial chromatin arrangements in cancer and in primate interphase nuclei. J. Cell. Sci. 2008, 121, 1876–1886. [Google Scholar] [CrossRef] [Green Version]
  38. Ballabio, E.; Cantarella, C.D.; Federico, C.; Di Mare, P.; Hall, G.; Harbott, J.; Hughes, J.; Saccone, S.; Tosi, S. Ectopic expression of the HLXB9 gene is associated with an altered nuclear position in t(7;12). Leukemia 2009, 23, 1179–1182. [Google Scholar] [CrossRef]
  39. Tosi, S.; Mostafa Kamel, Y.; Owoka, T.; Federico, C.; Truong, T.H.; Saccone, S. Pediatric acute myeloid leukemia with the t(7;12)(q36;p13) rearrangement: a review of the biological and clinical management aspects. Biomark Res. 2015, 3, 21. [Google Scholar] [CrossRef]
  40. Harrison, K.A.; Thaler, J.; Pfaff, S.L.; Gu, H.; Kehrl, J.H. Pancreas dorsal lobe agenesis and abnormal islets of Langerhans in HLXB9-deficient mice. Nature genetics 1999, 23, 71. [Google Scholar] [CrossRef]
  41. Thaler, J.; Harrison, K.; Sharma, K.; Lettieri, K.; Kehrl, J.; Pfaff, S.L. Active suppression of interneuron programs within developing motor neurons revealed by analysis of homeodomain factor HB9. Neuron 1999, 23, 675–687. [Google Scholar] [CrossRef]
  42. Hagan, D.M.; Ross, A.J.; Strachan, T.A.; Lynch, S.A.; Ruiz-Perez, V.; Wang, Y.M.; Scambler, P.; Custard, E.; Reardon, W.; Hassan, S.; et al. Mutation analysis and embryonic expression of the HLXB9 Currarino syndrome gene. Am. J. Hum. Genet. 2000, 66, 1504–1515. [Google Scholar] [CrossRef] [PubMed]
  43. Neufing, P.J.; Kalionis, B.; Horsfall, D.J.; Ricciardelli, C.; Stahl, J.; Vivekanandan, S.; Raymond, W.; Tilley, W.D. Expression and localization of homeodomain proteins DLX4/HB9 in normal and malignant human breast tissues. Anticancer Res. 2003, 23, 1479–1488. [Google Scholar]
  44. Tian, T.; Wang, M.; Zhu, Y.; Zhu, W.; Yang, T.; Li, H.; Lin, S.; Dai, C.; Deng, Y.; Song, D.; et al. Expression, clinical significance, and functional prediction of MNX1 in breast cancer. Mol. Ther. Nucleic Acids 2018, 13, 399–406. [Google Scholar] [CrossRef]
  45. Zhang, L.; Wang, J.; Wang, Y.; Zhang, Y.; Castro, P.; Shao, L.; Sreekumar, A.; Putluri, N.; Guha, N.; Deepak, S.; et al. MNX1 is oncogenically upregulated in African-American prostate cancer. Cancer Res. 2016, 76, 6290–6298. [Google Scholar] [CrossRef] [PubMed] [Green Version]
  46. Chen, M.; Wu, R.; Li, G.; Liu, C.; Tan, L.; Xiao, K.; Ye, Y.; Qin, Z. Motor neuron and pancreas homeobox 1/HLXB9 promotes sustained proliferation in bladder cancer by upregulating CCNE1/2. J. Exp. Clin. Cancer Res. 2018, 37, 154. [Google Scholar] [CrossRef]
  47. Hollington, P.; Neufing, P.; Kalionis, B.; Waring, P.; Bentel, J.; Wattchow, D.; Tilley, W.D. Expression and localization of homeodomain proteins DLX4, HB9, and HB24 in malignant and benign human colorectal tissues. Anticancer Res. 2004, 24, 955–962. [Google Scholar]
  48. Wilkens, L.; Jaggi, R.; Hammer, C.; Inderbitzin, D.; Giger, O. von Neuhoff, N. The homeobox gene HLXB9 is upregulated in a morphological subset of poorly differentiated hepatocellular carcinoma. Virchows Arch. 2011, 458, 697–708. [Google Scholar] [CrossRef]
  49. Desai, S.S.; Kharade, S.S.; Parekh, V.I.; Iyer, S.; Agarwal, S.K. Pro-oncogenic roles of HLXB9 in insulinoma cells through interaction with Nono and downregulation of the c-Met inhibitor Cblb. J. Biol. Chem. 2015, 290, 25595–25608. [Google Scholar] [CrossRef]
  50. Harrison, K.A.; Druey, K.M.; Deguchi, Y.; Tuscano, J.M.; Kehrl, J.H. A novel human homeobox gene distantly related to proboscipedia is expressed in lymphoid and pancreatic tissues. J. Biol. Chem. 1994, 269, 19968–19975. [Google Scholar]
  51. Deguchi, Y.; Kehrl, J.H. Selective expression of two homeobox genes in CD34-positive cells from human bone marrow. Blood 1991, 78, 323–328. [Google Scholar]
  52. Von Bergh, A.R.; van Drunen, E.; van Wering, E.R.; van Zutven, L.J.; Hainmann, I.; Lönnerholm, G.; Meijerink, J.P.; Pieters, R.; Beverloo, H.B. High incidence of t(7;12)(q36;p13) in infant AML but not in infant ALL, with a dismal outcome and ectopic expression of HLXB9. Genes Chromosomes Cancer 2006, 45, 731–739. [Google Scholar] [CrossRef] [PubMed]
  53. Wildenhain, S.; Ingenhag, D.; Ruckert, C.; Degistirici, Ö.; Dugas, M.; Meisel, R.; Hauer, J.; Borkhardt, A. Homeobox protein HB9 binds to the prostaglandin E receptor, 2 promoter and inhibits intracellular cAMP mobilization in leukemic cells. J. Biol. Chem. 2012, 287, 40703–40712. [Google Scholar] [CrossRef] [PubMed]
  54. Ingenhag, D.; Reister, S.; Auer, F.; Bhatia, S.; Wildenhain, S.; Picard, D.; Remke, M.; Hoell, J.I.; Kloetgen, A.; Sohn, D.; et al. The homeobox transcription factor HB9 induces senescence and blocks differentiation in hematopoietic stem and progenitor cells. Hematologica 2018, 104, 35–46. [Google Scholar] [CrossRef] [PubMed]
  55. Gupta, R.; Harankhedkar, S.; Rahman, K.; Singh, M.K.; Chandra, D.; Mittal, N.; Gupta, A.; Nityanand, S. Prevalence of chromosome 7 abnormalities in myelodysplastic syndrome and acute myeloid leukemia: A single center study and brief literature review. Indian J. Hematol. Blood Transfus. 2018, 34, 602–611. [Google Scholar] [CrossRef]
  56. Le Beau, M.M.; Espinosa, R.; Davis, E.M.; Eisenbart, J.D.; Larson, R.A.; Green, E.D. Cytogenetic and molecular delineation of a region of chromosome 7 commonly deleted in malignant myeloid diseases. Blood 1996, 88, 1930–1935. [Google Scholar] [CrossRef]
  57. Fischer, K.; Fröhling, S.; Scherer, S.W.; McAllister Brown, J.; Scholl, C.; Stilgenbauer, S.; Tsui, L.C.; Lichter, P.; Döhner, H. Molecular cytogenetic delineation of deletions and translocations involving chromosome band 7q22 in myeloid leukemias. Blood 1997, 89, 2036–2041. [Google Scholar]
  58. Tosi, S.; Scherer, S.W.; Giudici, G.; Czepulkowski, B.; Biondi, A.; Kearney, L. Delineation of multiple deleted regions in 7q in myeloid disorders. Genes Chromosomes Cancer 1999, 25, 384–392. [Google Scholar] [CrossRef]
  59. Honda, H.; Nagamachi, A.; Inaba, T. -7/7q- syndrome in myeloid-lineage hematopoietic malignancies: attempts to understand this complex disease entity. Oncogene 2015, 34, 2413–2425. [Google Scholar] [CrossRef]
  60. Mehta, P.A.; Harris, R.E.; Davies, S.M.; Kim, M.O.; Mueller, R.; Lampkin, B.; Mo, J.; Myers, K.; Smolarek, T.A. Numerical chromosomal changes and risk of development of myelodysplastic syndrome–acute myeloid leukemia in patients with Fanconi anemia. Cancer Genet. Cytogenet. 2010, 203, 180–186. [Google Scholar] [CrossRef]
  61. Tosi, S.; Harbott, J.; Haas, O.A.; Douglas, A.; Hughes, D.M.; Ross, F.M.; Biondi, A.; Scherer, S.W.; Kearney, L. Classification of deletions and identification of cryptic translocations involving 7q by fluoresence in situ hybridization. Leukemia 1996, 10, 644–649. [Google Scholar]
  62. Costantini, M.; Clay, O.; Federico, C.; Saccone, S.; Auletta, F.; Bernardi, G. Human chromosomal bands: nested structure, high definition map and molecular basis. Chromosoma 2007, 116, 29–40. [Google Scholar] [CrossRef]
  63. Kind, J.; Pagie, L.; de Vries, S.S.; Nahidiazar, L.; Dey, S.S.; Bienko, M.; Zhan, Y.; Lajoie, B.; de Graaf, C.A.; Amendola, M.; et al. Genome-wide maps of nuclear lamina interactions in single human cells. Cell 2015, 163, 134–147. [Google Scholar] [CrossRef] [Green Version]
  64. Tosi, S.; Hughes, J.; Scherer, S.W.; Nakabayashi, K.; Harbott, J.; Haas, O.A.; Cazzaniga, G.; Biondi, A.; Kempski, H.; Kearney, L. Heterogeneity of the 7q36 breakpoints in the t(7;12) involving ETV6 in infant leukemia. Genes Chromosomes Cancer 2003, 38, 191–200. [Google Scholar] [CrossRef]
  65. Ferguson, S.; Gautrey, H.E.; Strathdee, G. The dual role of HLXB9 in leukemia. Pediatr. Blood Cancer 2011, 56, 349–352. [Google Scholar] [CrossRef]
  66. González, M.B.; Gutiérrez, N.C.; García, J.L.; Schoenmakers, E.F.; Solé, F.; Calasanz, M.J.; San Miguel, J.F.; Hernández, J.M. Heterogeneity of structural abnormalities in the 7q31. 3∼ q34 region in myeloid malignancies. Cancer Genet. Cytogenet. 2004, 150, 136–143. [Google Scholar] [CrossRef]
  67. McNerney, M.E.; Brown, C.D.; Wang, X.; Bartom, E.T.; Karmakar, S.; Bandlamudi, C.; Yu, S.; Ko, J.; Sandall, B.P.; Stricker, T.; et al. CUX1 is a haploinsufficient tumor suppressor gene on chromosome 7 frequently inactivated in acute myeloid leukemia. Blood 2013, 121, 975–983. [Google Scholar] [CrossRef]
  68. Huang, R.; Liao, X.; Li, Q. Identification of key pathways and genes in TP53 mutation acute myeloid leukemia: evidence from bioinformatics analysis. Onco. Targets Ther. 2017, 11, 163–173. [Google Scholar] [CrossRef] [Green Version]
  69. Inaba, T.; Honda, H.; Matsui, H. The enigma of monosomy 7. Blood 2017, 131, 2891–2898. [Google Scholar] [CrossRef]
  70. Jost, K.L.; Bertulat, B.; Rapp, A.; Brero, A.; Hardt, T.; Domaing, P.; Gösele, C.; Schulz, H.; Hübner, N.; Cardoso, M.C. Gene repositioning within the cell nucleus is not random and is determined by its genomic neighborhood. Epigenetics Chromatin 2015, 8, 36. [Google Scholar] [CrossRef] [Green Version]
  71. Guelen, L.; Pagie, L.; Brasset, E.; Meuleman, W.; Faza, M.B.; Talhout, W.; Eussen, B.H.; de Klein, A.; Wessels, L.; de Laat, W.; et al. Domain organization of human chromosomes revealed by mapping of nuclear lamina interactions. Nature 2008, 453, 948–951. [Google Scholar] [CrossRef] [PubMed]
  72. Gonzalez-Sandoval, A.; Towbin, B.D.; Kalck, V.; Cabianca, D.S.; Gaidatzis, D.; Hauer, M.H.; Geng, L.; Wang, L.; Yang, T.; Wang, X.; et al. Perinuclear anchoring of H3K9-methylated chromatin stabilizes induced cell fate in C. elegans embryos. Cell 2015, 163, 1333–1347. [Google Scholar] [CrossRef]
  73. Egecioglu, D.; Brickner, J.H. Gene positioning and expression. Curr. Opin. Cell. Biol. 2011, 23, 338–345. [Google Scholar] [CrossRef] [PubMed]
  74. Remeseiro, S.; Hörnblad, A.; Spitz, F. Gene regulation during development in the light of topologically associating domains. Wiley Interdiscip. Rev. Dev. Biol. 2015, 5, 169–185. [Google Scholar] [CrossRef]
  75. Rodríguez-Carballo, E.; Lopez-Delisle, L.; Zhan, Y.; Fabre, P.J.; Beccari, L.; El-Idrissi, I.; Huynh, T.H.N.; Ozadam, H.; Dekker, J.; Duboule, D. The HoxD cluster is a dynamic and resilient TAD boundary controlling the segregation of antagonistic regulatory landscapes. Genes Dev. 2017, 31, 2264–2281. [Google Scholar] [CrossRef] [PubMed] [Green Version]
  76. Leshner, M.; Devine, M.; Roloff, G.W.; True, L.D.; Misteli, T.; Meaburn, K.J. Locus-specific gene repositioning in prostate cancer. Mol. Biol. Cell. 2016, 27, 236–246. [Google Scholar] [CrossRef] [PubMed] [Green Version]
  77. Meaburn, K.J.; Agunloye, O.; Devine, M.; Leshner, M.; Roloff, G.W.; True, L.D.; Misteli, T. Tissue-of-origin-specific gene repositioning in breast and prostate cancer. Histochem. Cell Biol. 2016, 145, 433–446. [Google Scholar] [CrossRef] [PubMed]
  78. Taberlay, P.C.; Achinger-Kawecka, J.; Lun, A.T.; Buske, F.A.; Sabir, K.; Gould, C.M.; Zotenko, E.; Bert, S.A.; Giles, K.A.; Bauer, D.C.; et al. Three-dimensional disorganization of the cancer genome occurs coincident with long range genetic and epigenetic alterations. Genome Res. 2016, 26, 719–731. [Google Scholar] [CrossRef] [PubMed]
  79. Tian, X.; Wang, Y.; Zhao, F.; Liu, J.; Yin, J.; Chen, D.; Ma, W.; Ke, X. A new classification of interphase nuclei based on spatial organization of chromosome 8 and 21 for t(8;21)(q22q22) acute myeloid leukemia by three-dimensional fluorescence in situ hybridization. Leuk. Res. 2015, 39, 1414–1420. [Google Scholar] [CrossRef] [PubMed]
  80. Beverloo, H.B.; Panagopoulos, I.; Isaksson, M.; van Wering, E.; van Drunen, E.; de Klein, A.; Johansson, B.; Slater, R. Fusion of the homeobox gene HLXB9 and the ETV6 gene in infant acute myeloid leukemias with the t(7;12)(q36;p13). Cancer Res. 2001, 61, 5374–5377. [Google Scholar]
  81. Vivian, J.; Rao, A.A.; Nothaft, F.A.; Ketchum, C.; Armstrong, J.; Novak, A.; Pfeil, J.; Narkizian, J.; Deran, A.D.; Musselman-Brown, A.; et al. Toil enables reproducible, open source, big biomedical data analyzes. Nat. Biotechnol. 2017, 35, 314–316. [Google Scholar] [CrossRef] [PubMed]
  82. Garimberti, E.; Tosi, S. Fluorescence in situ hybridization (FISH), basic principles and methodology. Methods Mol. Biol. 2010, 659, 3–20. [Google Scholar] [PubMed]
  83. Landau, S.; Rabe-Hesketh, S. StatView for Windows, Version 5.0. Stat. Methods Med. Res. 1999, 8, 337–341. [Google Scholar] [CrossRef] [PubMed]
Figure 1. HLXB9 expression-level distribution in acute myeloid leukemia (AML), acute lymphoblastic leukemia (ALL), whole blood and K562 leukemia cell line. The number of samples in each dataset is given above. Whole blood and K562 samples were extracted from Genotype-Tissue Expression (GTEx). AML is a composite dataset combining cross-project normalized samples from The Cancer Genome Atlas (TCGA)(173 samples) and the Therapeutically Applicable Research to Generate Effective Treatments (TARGET) (196 samples). **** p < 0.0001.
Cancers 11 00585 g001
Figure 2. HLXB9 expression level distribution in 173 TCGA AML samples stratified by cytogenetic phenotypes, where “n” signifies the total number of samples in each class, while “expressed” indicates the number of samples with HLXB9 expression level higher than 1.
Cancers 11 00585 g002
Figure 3. HLXB9 expression patterns in the patients analyzed. (A) Graph showing proportion of patients with HLXB9 expression categorised by the type of hematological disorder determined at the time of diagnosis. (B) Graph showing HLXB9 expression in the total number of patients considered in this study, categorised into three groups: Patients with or without chromosome 7 abnormalities, and patients with an unknown karyotype. (C) HLXB9 expression in patients with chromosome 7q abnormalities by subtype (interstitial, terminal, interstitial and terminal, and other).
Cancers 11 00585 g003
Figure 4. Fluorescence in situ hybridization (FISH) patterns observed in metaphases and nuclei of patients with del(7q). The 7q deletion breakpoints in Pt-1 to Pt-10 were determined by dual-color FISH using different probes, indicated at the bottom of each panel. The HLXB9 gene was detected using the BAC probe RP5-1121A15 (7q36.3). KMT2E (7q22) + MET (7q31.2) and KMT2E + EZH2 (7q36.1) were detected using commercial probe mixtures from MetaSystems. Whole chromosome paint 7, RP11-90N9 (7q21.11), RP11-211E22 (7q22.1), and RP11-73H23 (7q34) are BAC probes previously described (see Materials and methods). Metaphase chromosomes and interphase nuclei were counter-stained in blue with DAPI. Magnification 1000×.
Cancers 11 00585 g004
Figure 5. Genomic properties of chromosome 7 and the extent of the deleted region in the del(7q) patients. From left to right: Probes for the main landmarks used for FISH experiments, ideogram of the chromosome 7 showing the guanine-cytosine (GC)-richest (red) and the GC-poorest (blue) bands [10],correspondence with the GC-level of the genomic DNA sequence [62], distribution of the Lamina Associated Domains (LADs) along the chromosome [63], and schematic representation of the deleted region (in grey) in the del(7) chromosome detected in the ten subjects analyzed (Pt.: Patient number and deletion data from Table 1 and Table 2). The thin horizontal lines indicate the position of the probes indicated on the left.
Cancers 11 00585 g005
Figure 6. Radial nuclear location (RNL) of the HLXB9 locus in del(7q) patients. The graph displays median value and relative confidence interval (C.I.) corresponding to the RNL of the HLXB9 locus in patients and controls. On the left are the RNL of the genomic loci 90N9 (7q21.11), 213E22 (7q22.1), KMT2E (7q22.3), MET (7q31.2), 73H23 (7q34) and HLXB9 in nuclei of control cells (lymphocytes from peripheral blood of volunteer healthy donors from [10]). On the right side, each RNL value refers to the HLXB9 gene in the indicated patients (Pt-1 to Pt-10). For Pt-6, Pt-7, Pt-9, and Pt-10 the two alleles were measured separately: 7nor and 7del indicate HLXB9 in the normal or deleted chromosome 7, respectively. In the other cases, the RNL value refers to both HLXB9 alleles, as it was not possible to discriminate between the two, due to a low number of informative nuclei. The dashed line at 0.65 indicates the median value separating the peripheral and the internal nuclear compartment, i.e. values higher than 0.65 are peripheral, and values lower than 0.65 are internal to the nucleus. Statistical significance of the difference in the RNL data obtained for each probe with respect to the HLXB9 in the control cells (name underlined, and RNL indicated by an enlarged spot), was evaluated using the two-tailed t tests. p values are: * p < 0.05, ** p < 0.001, *** p < 0.0001.
Cancers 11 00585 g006
Figure 7. Detection of the HLXB9 transcript in patient samples with del(7q). Agarose gel electrophoresis containing nested reverse transcription (RT)-PCR products obtained using primers specific for HLXB9. The molecular marker (M) is peqGOLD DNA-Sizer XI (range 67-1118 bp, PeqLab, Fareham, UK). The amplified DNA fragment, indicated by black arrows, corresponds to theexpected size of the HLXB9 transcript (359 bp). The transcript is clearly present in Pt-4, Pt-8 and Pt-10. Positive controls are the leukemia-derived cell line K562 and another patient sample (Cnt+), known to express HLXB9 (patient no. 10 in [38]).
Cancers 11 00585 g007
Figure 8. Distribution of chromosome 7 genomic material across the nucleus. The illustration depicts three nuclei with two normal copies of chromosome 7 (left), one chromosome 7 with an interstitial deletion involving the region included between 7q21 and 7q36 (middle), and one chromosome 7 with an interstitial deletion involving the region included between 7q22 and 7q36 (right). The representation of the chromosome 7 territories follows a zig-zag conformation of the DNA, according to data previously published [10]. Depending on the extent of the deletion, the terminal region of 7q, harboring HLXB9, becomes juxtaposed to either the 7q21 band or the 7q22 bands. The vicinity to the 7q21 band, positioned at the periphery of the nucleus, determines a peripheral position for HLXB9, whereas the vicinity to the 7q22 band, normally positioned towards the inner part of the nucleus, causes an alteration in the location of HLXB9, which becomes positioned more internally. Since the repositioning potentially alters the gene expression pattern of the affected gene, this could explain the ectopic activation of HLXB9 allele repositioned in the inner part of the nucleus. Red and blue chromosomal bands correspond to the GC-richest and the GC-poorest bands in the chromosome 7 [10].
Cancers 11 00585 g008
Table 1. Clinical and cytogenetic features of the patients analyzed in this study.
PtDiagnosisKaryotypeReference
1CMML46,del(7)(q21q36)[61]
2MDS46,XY,del(7)(q21.3-22q36)[58,61]
3AML-M546,XX,del(7)(q22q36)[58]
4MDS46,XY,del(7)(q22q36)[61]
5MDS45,XX,del(5)(q14),del(7)(q22), del(9)(q22),-17This study
6CML47,XY,del(7)(q21),+21[20] 1This study
7FA46,XY,dup(1)(q24q44),del(7)(q21)[5] 1This study
8AML-M644,XY,t(1;3)(p21;?),-5,del(7)(q31.1),-17,-20,+mar[cp18] 1This study
9t-AML46,XX,del(7)(q32.1[4]/46,XX[6]This study
10AML47,XY,+8[11]/47,idem,del(7)(q32.1)[9]This study
Notes: Pt: Patient; CMML: Chronic myelomonocytic leukemia, MDS: Myelodysplastic syndrome; AML-M5: Acute myeloid leukemia M5 subtype, CML: Chronic myeloid leukemia, FA: Fanconi anemia, AML-M6: Acute myeloid leukemia M6 subtype, while also t-AML represents therapy-related acute myeloid leukemia.Archival samples from these patients were originally contributed by the Oncogenetic Laboratory, Children’s Hospital, University of Giessen, Germany (Pt. 1 to 4) and by the Pediatric Hematology Department, San Gerardo Hospital, Monza, Italy (Pt-5). 1 Original karyotypes were refined byfluorescence in situ hybridization (FISH) (see Table 2).
Table 2. Fluorescence in situ hybridization (FISH) mapping of chromosome 7 deletion breakpoints.
ProbesBandPatients
Pt.1Pt.2Pt.3Pt.4Pt.5Pt.6Pt.7Pt.8Pt.9Pt.10
RP11-90N97q21.11 +++++
Cos 5.27q21.3 +
RP11-213E227q22.1 +++
Cos 7d.27q22.1
Cos 8a.27q22.1
Cos 11207q22.1
PAC 1065 (CUTL1)7q22.1 +
KMT2E gene 17q22 +++
HSC7E4857q22.2
MET gene 17q31.2 ++
RP11-73H237q34
HSC7E1247q36.1
EZH2 gene 17q36.1 +++
HSC7E867q36.2 +
HSC7E7697q36.2 +
RP5-1121A157q36.3++++++++++
Notes: The probes listed in this table have been described before [10,58]. + and − indicate retention or loss of the relative genomic region on the deleted chromosome 7. 1 probes from MetaSystems; empty spaces in correspondence to a probe, indicate no data available regarding retention or loss of the locus.
Table 3. HLXB9 gene positioning and expression in the patients analyzed in this study.
HLXB9ExpressionRNLGC-level (a)Pt ID
Not Expressed0.754()GC-poor7 Cancers 11 00585 i001
Not Expressed0.722()GC-poor9
Expressed0.710()GC-poor10
Not Expressed0.671()GC-poor6
NA0.652(▲)GC-poor1
Not Expressed0.652(▲)GC-poor2
Expressed0.629(▲)GC-rich4
Expressed0.605(▲)GC-rich8
NA0.601(▲)GC-rich3
NA0.593(▲)GC-rich5
Notes: Pt: Patient; RNL: Radial nuclear location evaluated by the median values of the nuclear location obtained in a large number of cells (see Material and Methods); HLXB9 expr.: Expression evaluated by reverse transcription polymerase chain reaction (RT-PCR); NA: Data not available. (a) GC-level of the chromosomal region proximal to the centromeric breakpoint. (right graph) () RNL of the two HLXB9 alleles. (•) RNL of the HLXB9 allele in the deleted chromosome 7. Plot color codes for gene expression: Blue - not expressed, red – expressed, gray – no information available (NA).

