Article

Prognostic Value of Genetic Alterations in Elderly Patients with Acute Myeloid Leukemia: A Single Institution Experience

1
Department of Hematology, Lyon-Sud Hospital, Hospices Civils de Lyon, 69495 Pierre Bénite, France
2
University Claude Bernard Lyon 1, 69100 Villeurbanne, France
3
Department of Hematology, Centre Léon Bérard, 69008 Lyon, France
4
Laboratory of Molecular Biology, Lyon-Sud Hospital, Hospices Civils de Lyon, 69495 Pierre Bénite, France
5
Laboratory of Cytology and Immunology, Lyon-Sud Hospital, Hospices Civils de Lyon, 69495 Pierre Bénite, France
6
Laboratory of Cytogenetics, Lyon-Sud Hospital, Hospices Civils de Lyon, 69495 Pierre Bénite, France
*
Author to whom correspondence should be addressed.
Cancers 2019, 11(4), 570; https://doi.org/10.3390/cancers11040570
Submission received: 24 February 2019 / Revised: 23 March 2019 / Accepted: 8 April 2019 / Published: 22 April 2019
(This article belongs to the Special Issue Acute Myeloid Leukemia)

Abstract

:
Although the outcome in younger adults with acute myeloid leukemia (AML) has improved, the benefit associated with standard intensive chemotherapy in older patients remains debatable. In this study, we investigated the incidence and the prognostic significance of genetic characteristics according to treatment intensity in patients aged 60 years or older. On the 495 patients of our cohort, DNMT3A R882 (25.2%), NPM1 (23.7%) and FLT3-ITD (16.8%) were the most frequent molecular mutations found at diagnosis. In this elderly population, intensive chemotherapy seemed to be a suitable option in terms of early death and survival, except for normal karyotype (NK) NPM1−FLT3-ITD+ patients and those aged over 70 within the adverse cytogenetic/molecular risk group. The FLT3-ITD mutation was systematically associated with an unfavorable outcome, independently of the ratio. NK NPM1+/FLT3-TKD+ genotype tends to confer a good prognosis in patients treated intensively. Regarding minimal residual disease prognostic value, overall survival was significantly better for patients achieving a 4 log NPM1 reduction (median OS: 24.4 vs. 12.8 months, p = 0.013) but did not reach statistical significance for progression free survival. This retrospective study highlights that intensive chemotherapy may not be the most appropriate option for each elderly patient and that molecular markers may help treatment intensity decision-making.

1. Introduction

Although the outcome in younger adults with acute myeloid leukemia (AML) has improved, the benefit associated with standard intensive chemotherapy in older patients remains debatable [1]. A reason for this is hematopoietic stem cell aging, caused by DNA damage, telomere shortening, and oxidative stress [2,3]. ‘Older’ patients are generally considered those aged 60 years or older, even if recent recommendations are more based on “fitness” [4,5]. As the population in industrialized countries is aging, this arbitrary cut-off may be rational. Firstly, it is now well known that clonal hematopoiesis, commonly termed clonal hematopoiesis of indeterminate potential (CHIP), could affect about 5% of patients older than 60 years and up to 10% after 70 years, but is rare before 40 [6]. Carriers of those mutations (DNMT3A, TET2, ASXL1) have 10 times the risk to develop a hematologic cancer as do those without such mutations. Altogether, hematological malignancies post-CHIP and secondary AML post-myelodysplastic syndrome (MDS) are diseases that may have a worse outcome [7,8]. Secondly, aging in AML patients is associated with modifications of risk group distribution, especially in the adverse group and with an increase of mutations with poor prognosis (TP53, ASXL1, RUNX1). AML patients over 60 years carried adverse cytogenetics more frequently than younger adults but also a specific gene-expression that supports a molecular basis for poor outcomes [9,10]. Based on molecular and cytogenetic markers, the European LeukemiaNet (ELN) has recently established a new classification of AML, in which NK-AML (normal karyotype AML) was subdivided into different genetic groups [4]. However, other factors such as patient age and frailty have been shown to influence the outcome [11]. The prognostic impact of karyotype in these settings has been studied with mixed conclusions, but little is known about molecular markers in the elderly population [12,13,14,15].
Juliusson et al. have previously shown that response rate and overall outcome even after intensive chemotherapy drastically fall after 60 years [16]. On the other hand, a European Organization for Research and Treatment of Cancer (EORTC) randomized study established that intensive treatment was superior to a non-intensive approach [17]. However, another study suggested that intensive chemotherapy delivered to the very elderly (patients ≥70 years of age), may not be beneficial [18]. Yet, a particular proportion of AML patients will not tolerate the use of intensive chemotherapy. Those patients may be offered demethylating agents, low dose cytarabine, investigational agents or only palliative care. According to 2017 ELN recommendations, age alone should not be the decisive determinant to guide therapy but only “fit” patients should benefit from intensive chemotherapy irrespective of pretreatment prognostic factors [5]. Unfortunately, very few randomized trials have addressed the question of the usefulness of intensive compared to less intensive therapy in this subset of patients. There is actually no clear consensus or recommendations regarding the treatment of elderly patients according to their age and cytogenetic/molecular risk subgroup.
In this monocentric study, we aimed to address the prognostic impact of molecular and cytogenetic markers on survival of older AML patients according to the received treatment intensity. Understanding real-world treatment patterns and outcomes in elderly AML patients seems crucial to improve outcomes in this population.

2. Results

2.1. Initial Patient Characteristics

The median age was 69 years (range, 60–93 years). The median age was 65 years in group 1 (n = 260) and 74 years in group 2 (n = 235). Table 1 shows the distribution of patient’s characteristics by age group (patient distribution by cytogenetic/molecular subgroups in Supplementary Table S1). Karyotype was only available in 58.6% of cases in the entire cohort at the time of treatment decision. There was no difference among cytogenetic subgroups between age groups, except an excess of monosomal karyotypes in age group 2 (group 1 = 12.4% vs. group 2 = 21.8%) (Supplementary Table S1). Regarding molecular alterations, DNMT3A R882 (25.2%), NPM1 (23.7%), and FLT3-ITD (16.8%) were the most frequent molecular mutations found at diagnosis. Among FLT3-ITD-mutated patients tested for ratio, 37/71 (52.1%) of them had a FLT3-ITD/WT ratio < 0.5, with no difference between age group 1 and 2. All other mutations (CEBPα, IDH1/2, FLT3-TKD, and MLL-PTD) were present in less than 10% of patients. WT1 and MECOM1 overexpression were present in 34 and 12.4%, respectively. MECOM1 overexpression was associated with secondary AML (61.1%) and unfavorable karyotype (56%), and more specifically with chromosome 7 abnormalities (18/54, 33.3%). None of the MECOM1 overexpressing patients were NPM1 mutated. Regarding IDH2, 21/25 (84%) were R140Q and 4/25 (16%) R172K. IDH2 R172 cases had significantly lower white blood cells (WBC) counts than IDH2 R140 cases (1.2 vs. 33G/L). Among the 36 FLT3-TKD mutated patients, 30 harbored the D835 including 14 D835Y (two I836M, one A680V, one G846D, one N841D, and one Y842M). Both FLT3-ITD and -TKD mutations were present in only three patients. FLT3-TKD mutations were found to be associated with NPM1 mutation in 39.5% of cases but also with higher WBC count (median = 39.5 G/L, p < 0.01), higher LDH (median = 745, p = 0.04) and higher leukemic BM infiltration (median=85%, p = 0.09) when compared with FLT3-TKD WT patients.

2.2. Overall Outcome

The median follow-up of the entire cohort was of 7.62 months (1st quartile–3rd quartile: 2.8–20). One-hundred and seventy-five patients (35.3%) achieved complete composite response (CRc), of which 89.7% treated by intensive chemotherapy and the rest by less intensive regimens (Table 2).
After removing acute promyelocytic leukemia (APL) patients, the median overall survival (OS) of the entire cohort was 10.6 months with an OS rate of 47.3% at one year and 26.2% at three years. Progression-free survival (PFS) was 43.6% at one year and 21.4% at three years (median PFS: 9.3 months). In patients younger than 70 years (group 1), median OS was 15.9 months with a three-year OS of 32.3% vs. 6.31 months with a three-year OS of 19% for those aged over 70 years (p < 0.001) (Supplementary Table S2, Supplementary Figure S1A,B). Patients with a favorable- or intermediate-risk within group 1 had a better OS (favorable: median OS = 25.4 months, intermediate: median OS = 18.3 months) than those in the adverse-risk group (median OS: 6.8 months) (p < 0.001). In patients within group 2, there was no difference in terms of OS and PFS among different risk group (Supplementary Table S2, Supplementary Figure S1C,D).

2.3. Treatment Patterns

When considering only patients treated intensively (APL excluded), CRc rates were better in favorable- (93.2%) and intermediate-risk groups (67.7%) compared to unfavorable (57.9%). This distribution was similar between groups 1 and 2. Overall, age did not influence significantly CRc rate, independently of prognosis risk groups. Early death (ED) (death within 60 days from diagnosis) occurred in 8.2% for patients treated intensively in group 1, with a slight increase within group 2 (13.2%). The ED rate proportionally increased with the performance status (PS) across groups 1 and 2, and reached 50% for group 2 patients with PS > 2 treated intensively. Among patients treated less intensively, CRc rates were comprised between 10 and 16.3%. In this population, ED was 18.7% and concerned especially group 2 (group 2: 20.4% vs. group 1: 13.3%, p = 0.38). In patients treated only with BSC, ED reached 58.7% (Table 2).
Outcome regarding favorable- and intermediate-risk groups according to treatment patterns is summarized in Table 3 and Supplementary Figure S2A,B. When considering patients treated intensively (all age group comprised) with normal cytogenetics, NPM1−/FLT3-ITD− negative status was associated with a significantly better OS compared to the other genotypes, with no influence of the presence of NPM1 mutation on survival in the presence of FL3-ITD. However, there was no difference in terms of PFS (Figure 1A,B). Intensive chemotherapy was better in terms of OS when compared to low-intensive treatment in NPM1+FLT3-ITD+ (median OS: 10.1 vs. 2.9 months, p < 0.001) and NPM1−FLT3-ITD− (17.4 vs. 13.4 months, p < 0.001). In NPM1−FLT3-ITD+ patients, there was no difference in survival regardless of the treatment strategy (median OS: 7.56 vs. 8.15 vs. 1.15 months in intensive, semi-intensive and best supportive care (BSC), respectively, p = 0.2) (Supplementary Table S3). In patients with intermediate abnormal karyotype, intensive chemotherapy remains superior in terms of PFS (median PFS: 12.6 months) and OS (median OS: 24.2 months) compared to other treatments (Figure 1C,D). In the unfavorable-risk group, lower intensity regimens were superior in terms of OS and PFS compared to other strategies but only in patients aged over 70 years (median OS: 9.4 vs. 7.4 months, p = 0.009).
For patients undergoing allogeneic stem cell transplantation (HSCT), all of them were under 70 years old (median age of transplanted patients: 63.6). Treatment related mortality (TRM) at one and three years was 32.3% and 35%, respectively. Main causes of TRM were infections (45.5%) followed by acute GVHD (36.4%). On the 34 patients transplanted, only four of them relapsed (4/34) within a median of three months (range: 1.7–7.3). Nevertheless, transplanted patients in first CRc have a significantly better PFS compared to those treated with chemotherapy alone (median PFS: 63 vs. 15.6 months, p = 0.003), which did not translate into a better OS (Supplementary Figure S2D). There was no clear benefit of the transplant procedure according to cytogenetic risk group, but only a trend for better OS when considering patients with intermediate-risk (median OS = 63.2 months vs. 29.3 months) (Supplementary Figure S3A). At one year, cumulative incidence of relapse was 21.7%.

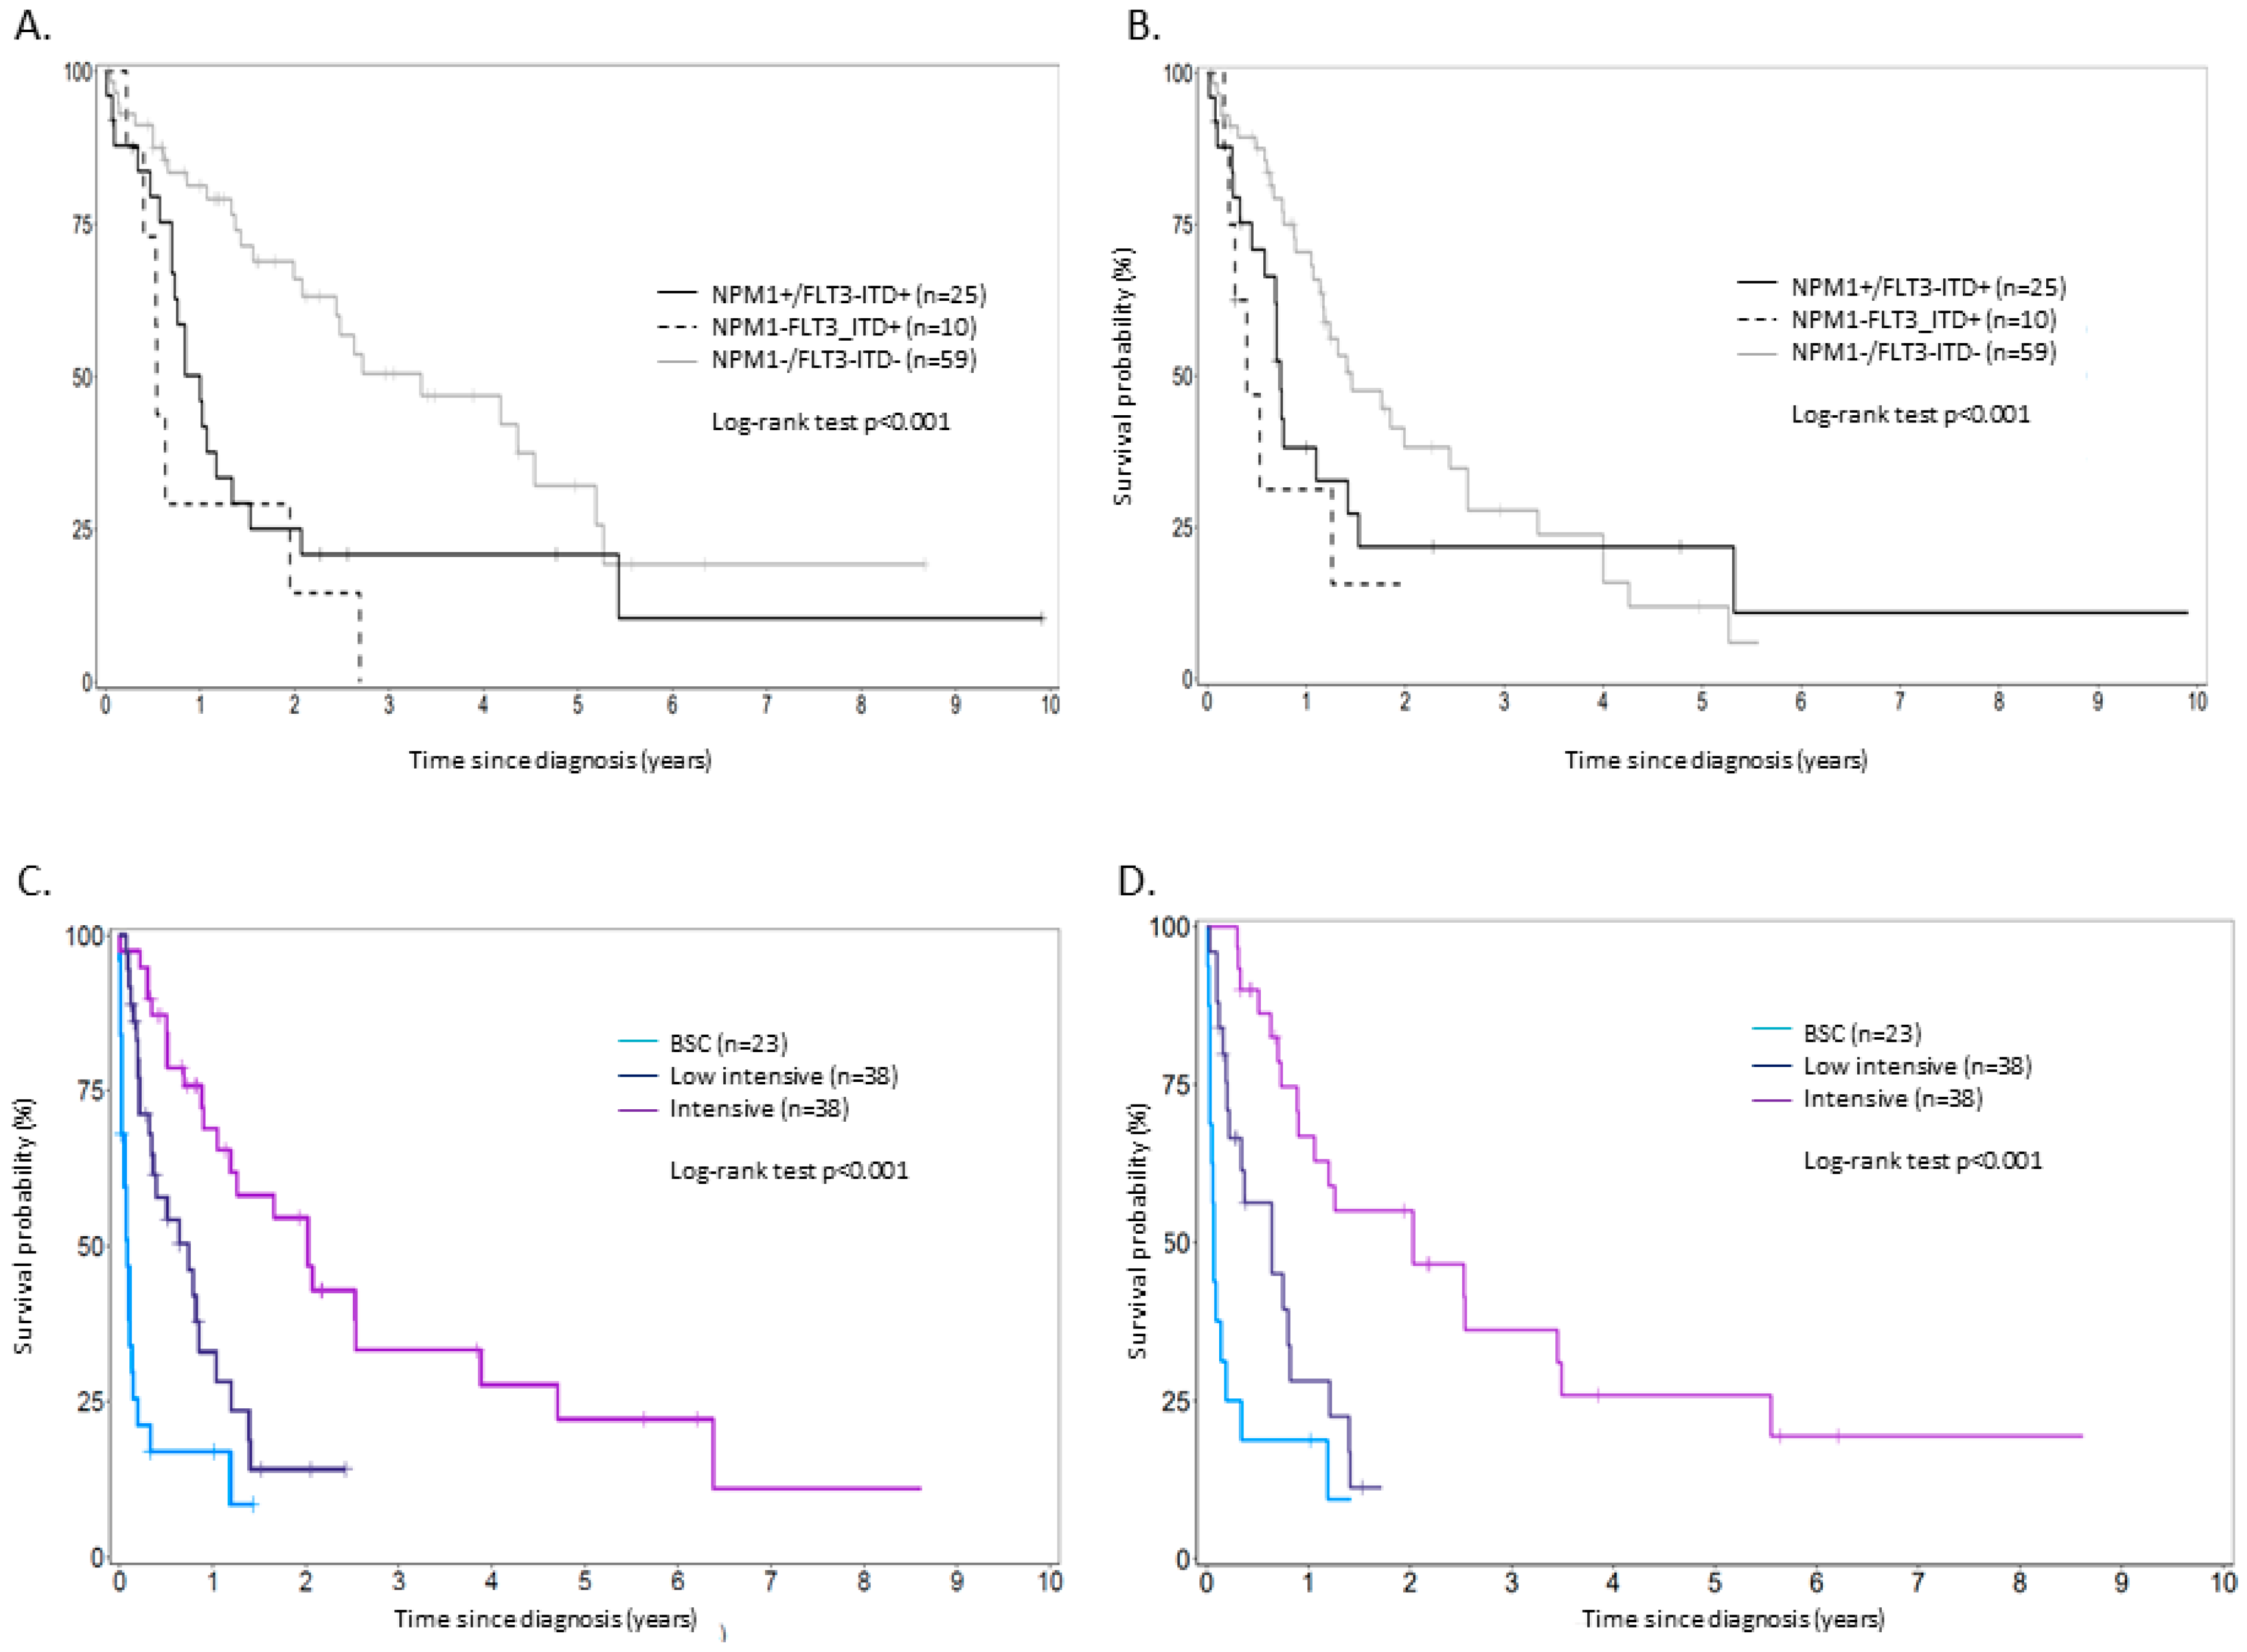
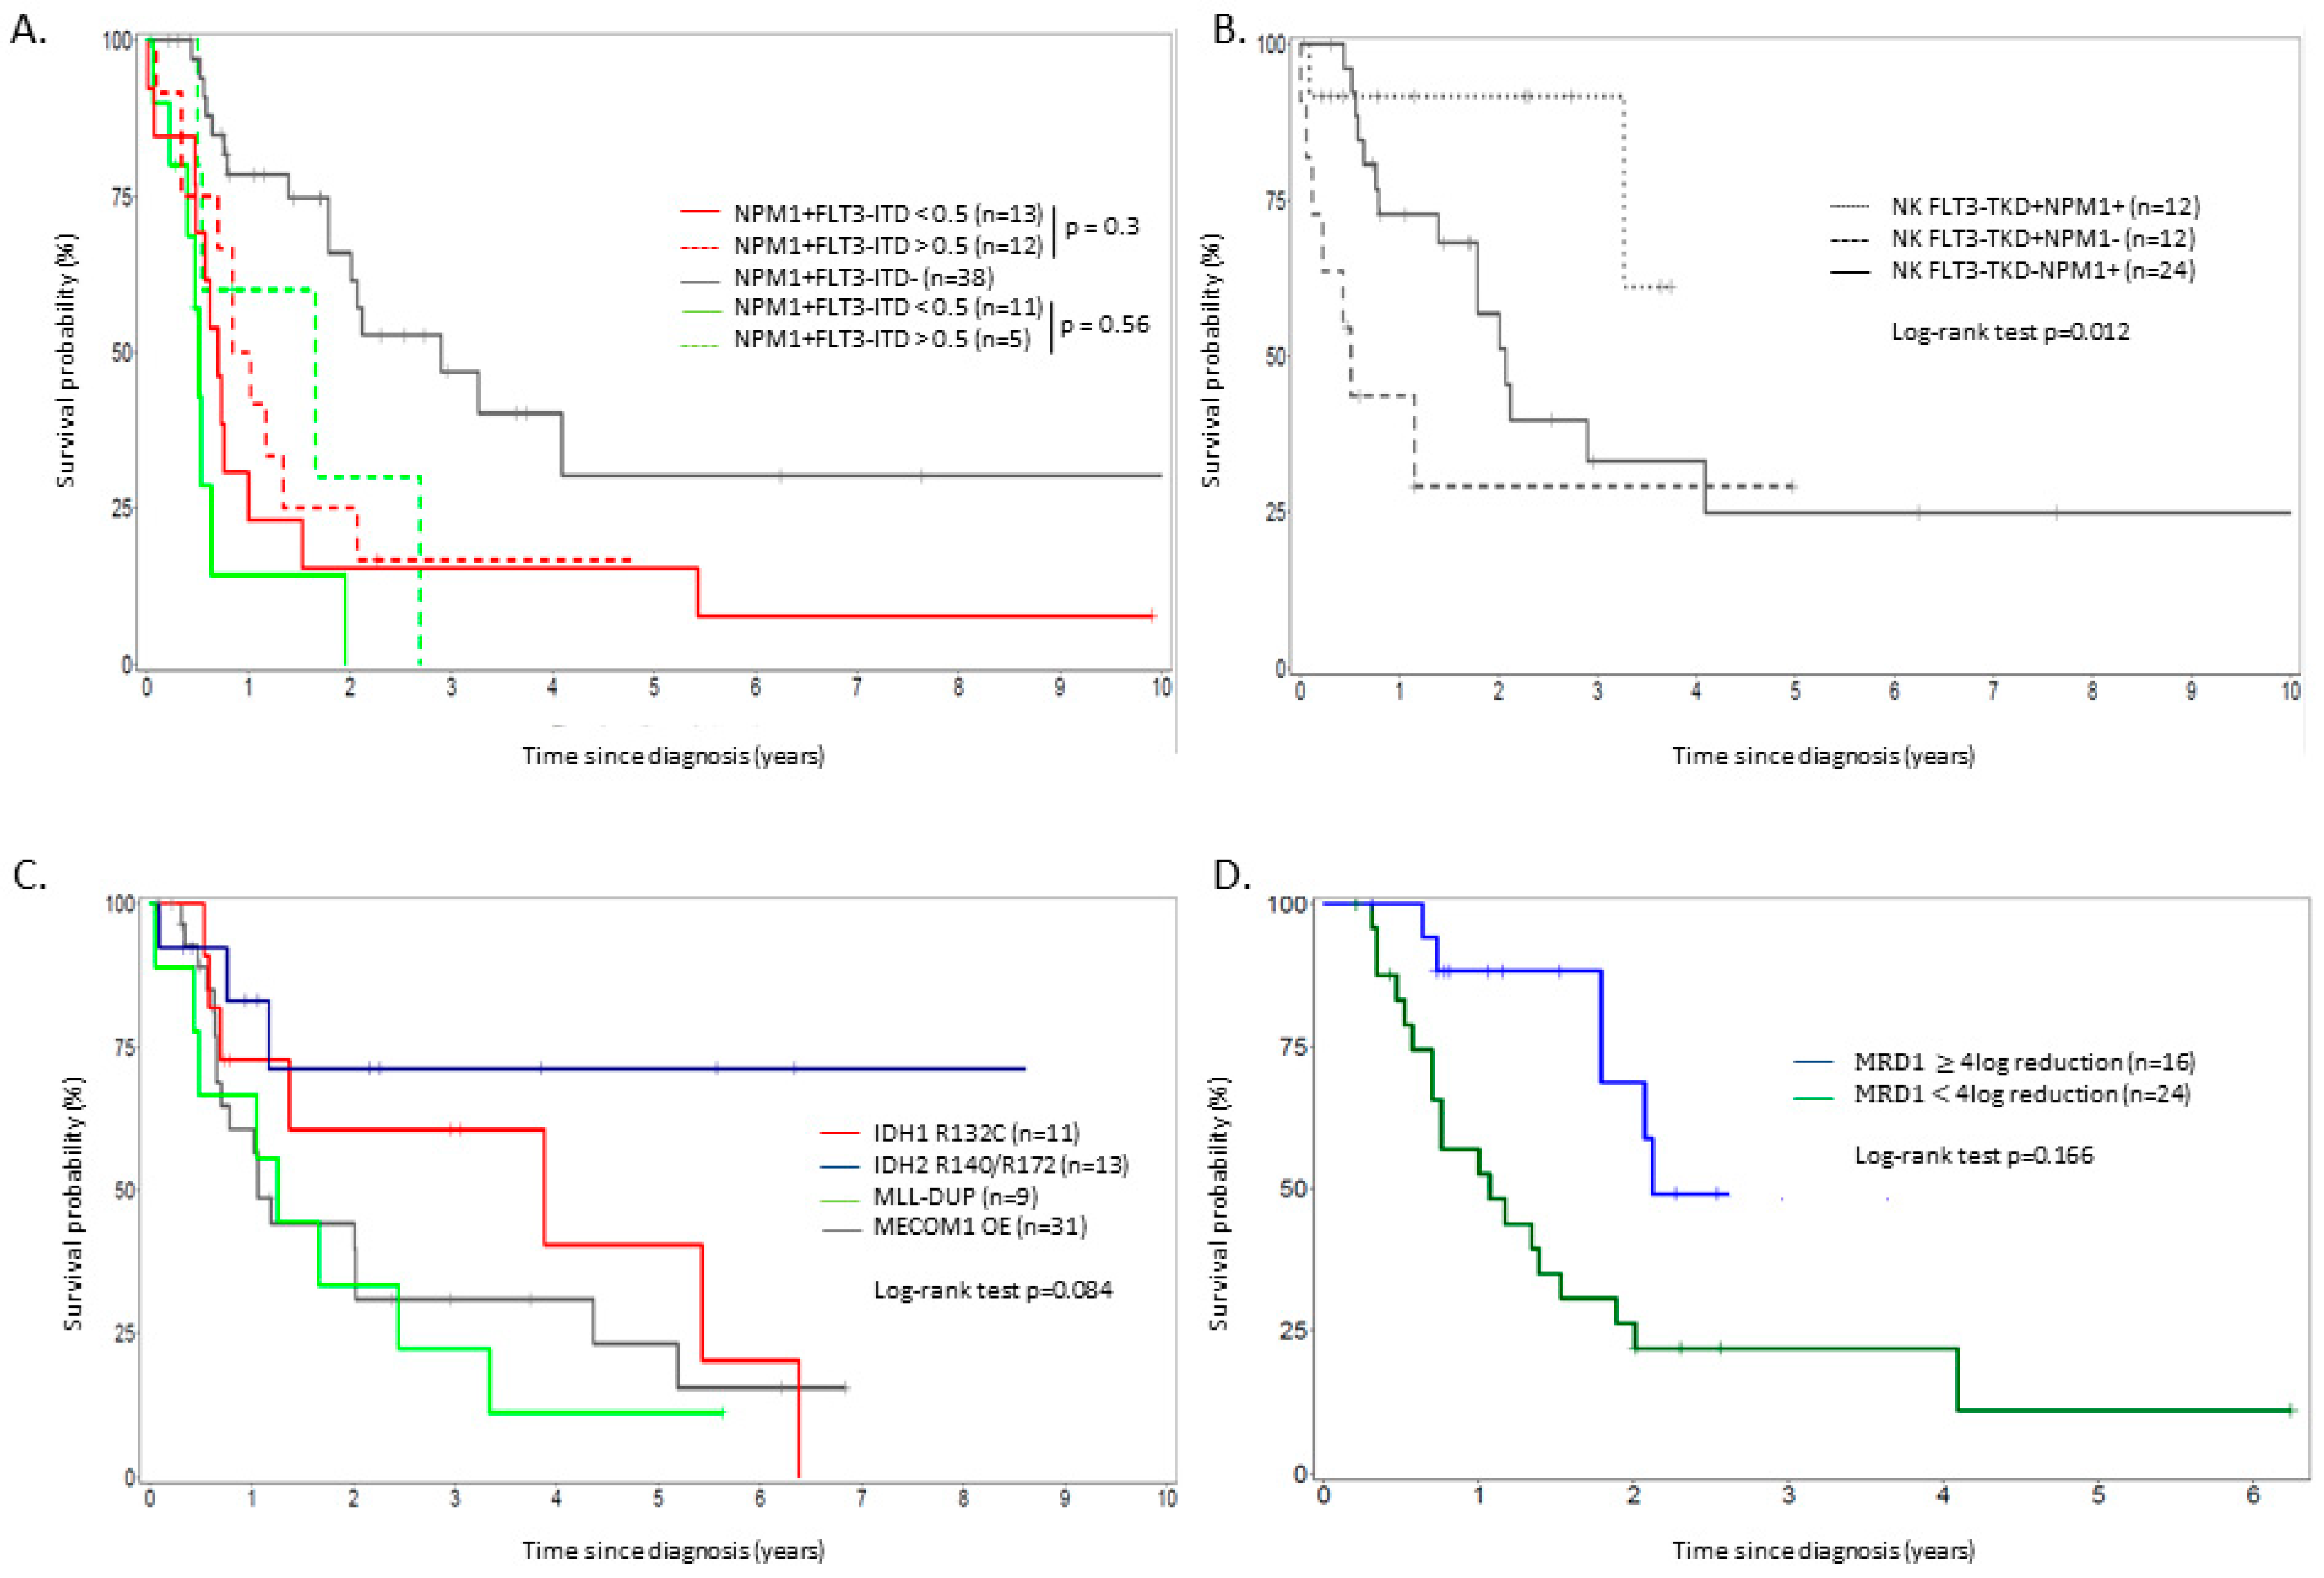
2.4. Outcome According to Molecular Markers and Minimal Residual Disease (MRD) Determined on NPM1 or WT1 Assessment

When focusing on normal karyotypes, NPM1+FLT3-ITD− cases treated intensively had a higher CRc rate and a better outcome in terms of OS and PFS than all other patients with normal karyotype. In the intermediate-risk group, intensive chemotherapy was superior to low intensity therapy in NPM1+FLT3-ITD+ (median OS: 10.1 vs. 2.9 months, p < 0.001) and NPM1−FLT3-ITD− (17.4 vs. 13.4 months, p < 0.001). In NPM1−FLT3-ITD+ patients, there was no difference in terms of OS regardless of the treatment strategy was (median OS: 7.56 (intensive) vs. 8.15 (low intensity) vs. 1.15 months (BSC), respectively, p = 0.2).
When available, we stratified patients with NK treated intensively according to their FLT3-ITD/WT ratio (low: ratio < 0.5; high: ratio ≥ 0.5) as previously described in the new ELN recommendations, and their NPM1 mutational status [7]. There was no statistical difference in terms of OS between NK NPM1+FLT3-ITDhigh (median OS = 7.1 months) and NK NPM1+FLT3-ITDlow (median OS = 10.1 months) but also between NK NPM1−FLT3-ITDhigh (median OS = 5.3 months) and NK NPM1−FLT3-ITDlow (median OS = 7.1 months). Only patients with NPM1+FLT3-ITD− mutational status were associated with a favorable outcome compared to others (median OS: 21.5 months) (Figure 2A, Table 3). Regarding the prognostic impact of the FLT3-TKD mutation (without FLT3-ITD), the mutation was associated to a better outcome but only in patients harboring concomitant NPM1 mutation (median OS: 39.2 vs. 6.1 months in FLT3-TKD+NPM1+ vs. FLT3-TKD+NPM1−, p = 0.001) (Figure 2B, Table 3). Concerning other molecular markers, IDH2 mutations seemed to confer a more favorable outcome (median OS: NR; OS at three years: 76%) compared to IDH1 R132 (median OS: 46.2 months; OS at three years: 54.9%), MLL-PTD (median OS: 15.1 months; OS at 3 years: 26.9%) and MECOM1 overexpression (median OS: 14.3 months; OS at three years: 34.7%) (Figure 2C). The presence of MLL-PTD or FLT3-TKD without NPM1 was highly predictive of chemoresistance as 56% and 58.2% of patients were refractory after the first cycle of induction respectively (Table 3).
Regarding NPM1+ patients treated intensively, 40 were evaluable for NPM1 at MRD1 (post induction MRD), of which 16 (40%) were good responders (NPM1 MRD1 ≥ 4-log reduction). Patients who reached good molecular response were less frequently FLT3-ITD+ compared to poor responders (p = 0.01) (Supplementary Table S4). OS was significantly better for patients aiming a 4-log NPM1 reduction (median OS: 24.4 vs. 12.8 months, p = 0.013) (Figure 2d) but did not reach statistical significance for PFS (Supplementary Figure S3B). Regarding WT1+ patients treated intensively, 24 were evaluable for WT1 at MRD1, of which 13 (52%) were good responders (WT1 MRD1 < 10−3). No individual risk factors were shown to influence molecular response rate (Supplementary Table S4). Overall, there was no difference in terms of OS and PFS between good or poor WT1 MRD responders in this small subset of patients (Supplementary Figure S3C,D).

2.5. Multivariate Analysis

In the multivariate analysis (including all variables statistically significant in the univariate analysis, Supplementary Table S5), only initial PS, LDH, FLT3-ITD, genetic characteristics at treatment decision and treatment group appeared of prognostic value on both PFS and OS. When considering only patients treated intensively, only initial PS, unfavorable risk group, FLT3-ITD, first CRc achievement and the presence of genetic characteristics at treatment decision were independent variables influencing OS, whereas HSCT performed in first CRc, age (as a continuous variable or when considering patient within group 1 vs. group 2) and molecular markers associated with better survival (i.e., IDH2, NPM1+FLT3-TKD+) were not (Table 4). In an interaction model performed in order to determine whether specific variables have an artificial influence outcome, the only positive interaction on survival was the presence of genetic characteristics at treatment decision and first-line treatment intensity (Supplementary Table S6).

3. Discussion

The management of AML in patients older than 60 years remains a major challenge as it is still rather unclear which patients will benefit or not from intensive chemotherapy compared to low intensity regimens according to clinical, molecular or cytogenetics markers [9]. This analysis allows us to look at broad practice patterns and outcomes in older patients referred to one French hematological center, especially according to cytogenetics and molecular markers. Several factors may be involved in the poor prognosis of older AML patients. Elderly AML harbors genetic and epigenetic patterns not shared by younger adults. In addition to a specific methylation signature, these AMLs are enriched in genetic alterations in spliceosome machinery, epigenetic regulators and in DNA repair factors known to be associated with global treatment resistance [19]. Aging has also been related to an increased frequency of unfavorable karyotype incidence, probably due to the increasing prevalence of secondary AML. Nevertheless, after 60 years old, Nagel et al. showed that there were no major modifications among ELN risk group distribution under and beyond 70 years old, which was the same regarding NPM1 and FLT3-ITD mutations distribution [20]. Our results are in line with this epidemiological observation with a trend to a decreased relative prevalence in favorable-risk AML contrasting with an increase in the adverse risk group. Regarding molecular alterations, only FLT3-TKD tend to be less frequent in patients older than 70 years old whereas NPM1 and FLT3-ITD mutations remain unchanged among age groups (Table 1). FLT3-TKD and ITD were associated with higher WBC count, higher BM blastic infiltration, and NPM1 mutations at diagnosis. Compared with younger adults, NPM1 mutation co-occurred with FLT3-TKD less frequently than previously reported [21]. There were fewer IDH1 and IDH2 mutations than reported in the literature. However, only R132H for IDH1 and R140Q/R172K for IDH2 were tested and in a limited number of cases [22].
Currently, there is no clear consensus regarding treatment algorithm in patients over 60 years of age. Chronological age is probably an obsolete variable as the population is more and more ‘fit’ in advanced age. Nevertheless, prognostic drastically collapsed after 60 years, urging the need for better stratifications. In our cohort, intensive chemotherapy appeared as the best therapeutic option with a lower early death rate and an improved survival. Our study has certainly several limitations. They mainly concerned its retrospective profile and the absence of data regarding co-morbidities (such as diabetes, high blood pressure, or cardiac features). One other key point is that treatment strategies and options might have change over the study time period. Furthermore, molecular data were not exhaustive for all patients. Nevertheless, there is very few data regarding the prognostic impact of FLT3-TKD mutation in older AML patients. Boddu et al. recently showed that patients with FLT3-TKD+NPM1+ mutational status had a better relapse-free survival and that HSCT did not impact the outcome [23]. Perry et al. confirmed these results but also showed that NPM1 lost its favorable impact on outcome in the absence of FLT3-TKD mutation [21]. We confirmed these results not only in terms of PFS but also in terms of OS. FLT3-ITD and TKD mutants are associated with different molecular signature and pathway activation that may explain the difference of outcome between these two mutations, notably regarding the activation of various transcription factors in the STAT5 pathway [24]. However, the mechanistic link between FLT3-TKD and NPM1 conferring this cooperative favorable effect still remains unclear. Other molecular markers seem to have effects on outcome in the elderly. As previously reported in younger patients, IDH2 mutational status was associated with global favorable outcome compared to others patients and especially for those mutated for IDH1 [25]. However, the favorable prognostic impact of IDH2 may be at least partially driven by the presence of NPM1 mutation, even in the elderly. Conversely, Prassek et al. recently reported that IDH1 mutations was associated with a very unfavorable outcome in patients aged over 75 years, independently of other mutations such as NPM1, FLT3-ITD or TP53 [26]. The prognostic impact of MECOM1 overexpression remains a matter of debate. Usually, it is considered as an unfavorable marker. However, this may be related to the overexpression of a specific MECOM1 isoform [27]. As this marker is frequently associated with unfavorable/complex karyotype that may essentially drive the prognosis of these patients, its overexpression is rarely considered as an independent prognosis variable. MECOM1 could potentially be used for MRD monitoring in AML, but the physiological MECOM1 gene expression is high and the magnitude of reduction in MECOM1 expression levels between diagnosis and follow-up seems to be insufficient to allow sensitive and specific detection of MRD [28].
In multivariate analysis, age > 70 years was not an independent prognostic factor regarding OS. However, genetic characteristics available at treatment decision were one of the strongest markers in terms of survival. Based on previous results, we based treatment decision making essentially on karyotype and molecular markers at diagnosis [29]. This could explain the direct interaction between treatment intensity and the presence of genetic characteristics at treatment initiation. Karyotype was available in only 58.5% of AML cases at diagnosis and missing in most of the patients older than 70 years. Treatment intensity decision making should only be considered when karyotype and routine molecular markers are available, even in patients aged over 70 years. However, cytogenetic and molecular alterations are probably not the only factors that should be considered for treatment intensity decisions. As intensive chemotherapy without HSCT in non-favorable AML is rarely curative, patient and family decisions should also be taken into account, and alternative therapy potentially considered. Stem cell transplantation in the elderly is still a matter of debate. Although reduced intensity conditioning (RIC) conditioning allowed reduced TRM, this type of conditioning is known to be associated with a higher risk of relapse. Moreover, it remains unclear which patients would benefit the most of the procedure. In our study, HSCT seems to reduce the risk of relapse even if it does not translate into a better OS. These results may have been biased by the small number of transplanted patients and the high rate of TRM in this cohort. Nevertheless, HSCT may benefit to some elderly AML cases. Gardin et al. reported that only adverse ELN-risk subset had an OS benefit associated with HSCT [30]. However, in a specific randomized trial, HSCT was not confirmed as an independent variable for OS and event free survival (EFS) among ELN-risk subgroups [31].
In younger adults, NPM1 MRD has recently demonstrated a favorable predictive marker for EFS and OS independently of FLT3-ITD status. Balsat et al. prospectively showed that a 4-log reduction of NPM1 MRD after induction conferred a better survival, independently of FLT3-ITD status. Moreover, good molecular responders did not seem to beneficiate from HSCT [32]. These results were in line with those previously published [33]. MRD negativity assessed by flow cytometry could be also a good surrogate marker for better survival in older patients, even if its prognostic value is less powerful than in younger patients [34,35]. Here we showed that good NPM1 molecular responders (≥4-log reduction) have a better OS. However, NPM1 MRD was not significant in terms of PFS suggesting that good molecular response does not completely erase the risk of relapse. Somehow, good responders seem to maintain chemo-sensitivity after relapse. WT1 MRD monitoring has also been a matter of debate due to contradictory reports regarding its prognostic value. Recently, Lambert et al. showed that MRD negativity after induction was associated with a lower incidence of relapse and a longer OS, independently of NPM1, FLT3-ITD, and HSCT status [36]. Despite a trend, we did not confirm these results.

4. Patients and Methods

4.1. Patients

Four hundred and ninety-five patients (aged 60 years or older) with newly diagnosed AML (de novo or secondary) were seen in our institution between October 2000 and September 2016. AML was defined according to the French-American-British (FAB) classification [37]. APL were included in descriptive analysis but excluded from survival analysis. Patient characteristics are shown in Table 1. At diagnosis, blood and bone marrow (BM) samples were examined for cytogenetic abnormalities and molecular markers (NPM1, FLT3-ITD, FLT3-TKD, WT1 expression, MECOM1 expression, MLL-PTD, DNMT3A R882, IDH1 R132, and IDH2 R140Q/R172K) according to local procedures. Patients were then assigned to risk groups according to the ELN 2010 classification [4]. As intermediate I and intermediate II risk groups of the ELN 2010 classification are not different in terms of prognosis, we fused these two groups [9].

4.2. Treatments

Patients were stratified according to the treatment intensity they received. The first study group (259 patients) comprised patients treated frontline by intensive chemotherapy. Induction therapy varied by treatment period [38]. All patients were treated with an anthracycline and cytarabine-based induction chemotherapy regimen. Thirty patients with APL also received all-trans retinoic acid (ATRA) during induction therapy [39]. Patients achieving complete remission (CR) after one or two courses of induction were given consolidation chemotherapy according to the protocol they were included in. The second study group (209 patients) comprised patients treated frontline by lower-intensity therapy (60 patients received low dose cytarabine, 37 azacitidine, 23 decitabine, and eight guadecitabine). Policy with regard to blood product support, antibiotics and anti-fungal prophylaxis, and treatment of febrile neutropenia was determined according to established local practice [40]. The third study group (92 patients) comprised patients treated by BSC plus eventually the administration of hydroxyurea (46 patients) or 6-mercaptopurine (13 patients) in order to control proliferative white blood cell (WBC) count. We also stratified patients according to their age: group 1, 60–69 years old; group 2, ≥70 years old. Thirty-four patients underwent HSCT in first CRc after reduced intensity conditioning (RIC) (13 matched sibling, 12 matched unrelated (MUD), three mismatched MUD, six cord blood unit).

4.3. Clinical and Molecular Markers

WBC count, platelet count, hemoglobin level, lactate dehydrogenase level (LDH), circulating blasts, bone marrow blasts, de novo AML versus non de novo AML, presence of extramedullary disease, performance status, sex, and age were evaluated at diagnosis. Cytogenetic analysis was performed according to the International System for Human Cytogenetic Nomenclature guidelines [41]. The nucleophosmin mutations (NPM1), fms-like tyrosine kinase-3 internal tandem duplications (FLT3-ITD), tyrosine kinase domain mutations (FLT3-TKD), mixed lineage leukemia gene partial tandem duplications (MLL-PTD or KMT2A), CEBPα mutations, isocitrate dehydrogenase enzyme isoforms 1 and 2 mutations (IDH1/IDH2), WT1 and ecotropic viral integration site 1 gene (EVI1/1D or MECOM1) expressions were detected and quantified as previously described [27,42,43,44,45,46,47,48,49,50]. DNMT3A exon 23 was amplified by polymerase chain reaction (PCR) from genomic DNA screened by high-resolution melting curve analysis and positive PCR products were subsequently sequenced to identify R882 mutations [51]. When available, MRD for NPM1 and WT1 were assessed after 1st cycle of induction (MRD1) as previously described [32,36].
As cytogenetic and molecular markers might be detrimental for proper treatment decision, we aim to assess if initial genetic characteristics (defined by karyotype and NPM1/FLT3-ITD status) at the time of treatment decision (absent vs. present) could be associated with prognosis.

4.4. Outcome Parameters

CRc (CR+CRi+CRp) status was defined on bone marrow aspirates with less than 5% of blasts recovery and classical hematological recovery characteristics [5]. OS was calculated from treatment assignment to death from any cause. PFS was determined for responders from CRc until relapse for patients treated intensively and until disease progression for those treated with low-intensity regiments and palliative care or death from any cause. Patients alive were censored for OS at last follow-up date, and patients in CR were censored for PFS at last disease assessment.

4.5. Statistical Analyses

Comparative descriptive statistics were used to characterize patients and their disease in their entirety and according to their age group. Continuous variables were reported as median ± standard deviation (SD) followed by a t test if the distribution was normal in both groups, if not as median, range (min-max) and inter-quartile range (IQR) with a Mann–Whitney test to compare groups. Discrete and qualitative variables were reported as count and percentage. Comparisons among groups were analyzed with a Pearson chi-square test (with the Monte Carlo method if any cell count was below 5). Probabilities of PFS and OS were estimated the Kaplan–Meier method, and the log-rank rest evaluated differences between survival distributions. Univariate and multivariate analyses including baseline demographic, clinical and molecular features were studied thanks to Cox regressions. The statistical results were two-sided with a p-value < 0.05 considered statistically significant.

5. Conclusions

This study highlights that genetic characteristics are essential for treatment decision making and that intensive chemotherapy may not be always the most appropriate therapeutic option. However, such characteristics may not be sufficient to properly stratify patients toward treatment strategies. Other characteristics such as frailty or molecular markers should be also integrated into the equation but this still need to be prospectively evaluated. IDH2 (at least R140Q) and NPM1+ FLT3-TKD+ mutated elderly patients may have very favorable outcome when treated intensively and should be considered for this strategy when possible. Regarding HSCT, there are now evidences suggesting that this procedure may not benefit to all patients and especially to those from the intermediate-risk group. Nevertheless, new therapeutic agents may drastically change the prognosis of AML in elderly patients [52,53].

Supplementary Materials

The following are available online at https://www.mdpi.com/2072-6694/11/4/570/s1, Figure S1: Survival curves according to age and ELN risk groups, Figure S2: Survival curves according to treatment intensity and ELN risk groups, Figure S3: Survival curves according to NPM1/WT1 molecular response and HSCT impact on survival, Table S1: Cytogenetics and molecular demographics among ELN 2010 risk groups, Table S2: Overall outcome according to the risk group independently of treatment intensity, Table S3: Clinical outcome according to the risk group and the initial treatment type after removing APL patients, Table S4: Clinical characteristics and outcome of NPM1+ and WT1 OE patients according to their MRD1 response after standard induction, Table S5: Univariate analysis, Table S6: Interaction score of variables influencing survival.

Author Contributions

Investigation: M.H., H.L.-W., F.E.N., M.M., M.B., E.P., A.P., I.T., S.H., F.B., P.S., S.D., E.W. and X.T.; supervision: X.T., G.S.; writing—original draft preparation: M.H.

Funding

This research received no external funding.

Acknowledgments

We would like to acknowledge Stéphane Morisset who conducted all statistical analysis.

Conflicts of Interest

Authors have no conflict of interest to declare.

References

  1. Appelbaum, F.R.; Gundacker, H.; Head, D.R.; Slovak, M.L.; Willman, C.L.; Godwin, J.E.; Anderson, J.E.; Petersdorf, S.H. Age and acute myeloid leukemia. Blood 2006, 107, 3481–3485. [Google Scholar] [CrossRef] [Green Version]
  2. Kamminga, L.M.; de Haan, G. Cellular memory and hematopoietic stem cell aging. Stem Cell 2006, 24, 1143–1149. [Google Scholar] [CrossRef]
  3. Liang, Y.; Van Zant, G.; Szilvassy, S.J. Effects of aging on the homing and engraftment of murine hematopoietic stem and progenitor cells. Blood 2005, 106, 1479–1487. [Google Scholar] [CrossRef] [Green Version]
  4. Döhner, H.; Estey, E.H.; Amadori, S.; Appelbaum, F.R.; Büchner, T.; Burnett, A.K.; Dombret, H.; Fenaux, P.; Grimwade, D.; Larson, R.A.; et al. Diagnosis and management of acute myeloid leukemia in adults: Recommendations from an international expert panel, on behalf of the European LeukemiaNet. Blood 2010, 115, 453–474. [Google Scholar] [CrossRef] [PubMed]
  5. Döhner, H.; Estey, E.; Grimwade, D.; Amadori, S.; Appelbaum, F.R.; Büchner, T.; Dombret, H.; Ebert, B.L.; Fenaux, P.; Larson, R.A.; et al. Diagnosis and management of AML in adults: 2017 ELN recommendations from an international expert panel. Blood 2017, 129, 424–447. [Google Scholar] [CrossRef]
  6. Jaiswal, S.; Fontanillas, P.; Flannick, J.; Manning, A.; Grauman, P.V.; Mar, B.G.; Lindsley, R.C.; Mermel, C.H.; Burtt, N.; Chavez, A.; et al. Age-Related Clonal Hematopoiesis Associated with Adverse Outcomes. N. Engl. J. Med. 2014, 371, 2488–2498. [Google Scholar] [CrossRef] [PubMed] [Green Version]
  7. Coombs, C.C.; Zehir, A.; Devlin, S.M.; Kishtagari, A.; Syed, A.; Jonsson, P.; Hyman, D.M.; Solit, D.B.; Robson, M.E.; Baselga, J.; et al. Therapy-Related Clonal Hematopoiesis in Patients with Non-hematologic Cancers Is Common and Associated with Adverse Clinical Outcomes. Cell Stem Cell 2017, 21, 374–382. [Google Scholar] [CrossRef] [PubMed]
  8. Walter, M.J.; Shen, D.; Ding, L.; Shao, J.; Koboldt, D.C.; Chen, K.; Larson, D.E.; McLellan, M.D.; Dooling, D.; Abbott, R.; et al. Clonal architecture of secondary acute myeloid leukemia. N. Engl. J. Med. 2012, 366, 1090–1098. [Google Scholar] [CrossRef]
  9. Mrózek, K.; Marcucci, G.; Nicolet, D.; Maharry, K.S.; Becker, H.; Whitman, S.P.; Metzeler, K.H.; Schwind, S.; Wu, Y.Z.; Kohlschmidt, J.; et al. Prognostic significance of the European LeukemiaNet standardized system for reporting cytogenetic and molecular alterations in adults with acute myeloid leukemia. J. Clin. Oncol. 2012, 30, 4515–4523. [Google Scholar] [CrossRef]
  10. Rao, A.V.; Valk, P.J.; Metzeler, K.H.; Acharya, C.R.; Tuchman, S.A.; Stevenson, M.M.; Rizzieri, D.A.; Delwel, R.; Buske, C.; Bohlander, S.K.; et al. Age-specific differences in oncogenic pathway dysregulation and anthracycline sensitivity in patients with acute myeloid leukemia. J. Clin. Oncol. 2009, 27, 5580–5586. [Google Scholar] [CrossRef]
  11. Schoch, C.; Kern, W.; Schnittger, S.; Büchner, T.; Hiddemann, W.; Haferlach, T. The influence of age on prognosis of de novo acute myeloid leukemia differs according to cytogenetic subgroups. Haematologica 2004, 89, 1082–1090. [Google Scholar] [PubMed]
  12. Mori, M.; Ohta, M.; Miyata, A.; Higashihara, M.; Oshimi, K.; Kimura, H.; Yagasaki, F.; Sunami, K. Treatment of acute myeloid leukemia patients aged more than 75 years: Results of the E-AML-01 trial of the Japanese Elderly Leukemia and Lymphoma Study Group (JELLSG). Leuk Lymphoma 2006, 47, 2062–2069. [Google Scholar] [CrossRef] [PubMed]
  13. Harb, A.J.; Tan, W.; Wilding, G.E.; Ford, L.; Sait, S.N.; Block, A.W.; Barcos, M.; Wallace, P.K.; Wang, E.S.; Wetzler, M. Treating octogenarian and nonagenarian acute myeloid leukemia patients—Predictive prognostic models. Cancer 2009, 15, 2472–2481. [Google Scholar] [CrossRef]
  14. Lazarevic, V.; Hörstedt, A.S.; Johansson, B.; Antunovic, P.; Billström, R.; Derolf, A.; Hulegårdh, E.; Lehmann, S.; Möllgård, L.; Nilsson, C.; et al. Incidence and prognostic significance of karyotypic subgroups in older patients with acute myeloid leukemia: The Swedish population-based experience. Blood Cancer J. 2014, 4, e188. [Google Scholar] [CrossRef] [PubMed]
  15. Kantarjian, H.; O’Brien, S.; Cortes, J.; Giles, F.; Faderl, S.; Jabbour, E.; Garcia-Manero, G.; Wierda, W.; Pierce, S.; Shan, J.; et al. Results of intensive chemotherapy in 998 patients age 65 years or older with acute myeloid leukemia or high-risk myelodysplastic syndrome: Predictive prognostic models for outcome. Cancer 2006, 106, 1090–1098. [Google Scholar] [CrossRef] [PubMed]
  16. Juliusson, G.; Antunovic, P.; Derolf, A.; Lehmann, S.; Möllgård, L.; Stockelberg, D.; Tidefelt, U.; Wahlin, A.; Höglund, M. Age and acute myeloid leukemia: Real world data on decision to treat and outcomes from the Swedish Acute Leukemia Registry. Blood 2009, 113, 4179–4187. [Google Scholar] [CrossRef] [PubMed]
  17. Löwenberg, B.; Zittoun, R.; Kerkhofs, H.; Jehn, U.; Abels, J.; Debusscher, L.; Cauchie, C.; Peetermans, M.; Solbu, G.; Suciu, S.; et al. On the value of intensive remission-induction chemotherapy in elderly patients of 65 years with acute myeloid leukemia: A randomized phase III study of the European organization for research and treatment of cancer leukemia group. J. Clin. Oncol. 1989, 7, 1268–1274. [Google Scholar] [CrossRef]
  18. Kantarjian, H.; Ravandi, F.; O’Brien, S.; Cortes, J.; Faderl, S.; Garcia-Manero, G.; Jabbour, E.; Wierda, W.; Kadia, T.; Pierce, S.; et al. Intensive chemotherapy does not benefit most older patients (age 70 years or older) with acute myeloid leukemia. Blood 2010, 116, 4422–4429. [Google Scholar] [CrossRef] [Green Version]
  19. Silva, P.; Neumann, M.; Schroeder, M.P.; Vosberg, S.; Schlee, C.; Isaakidis, K.; Ortiz-Tanchez, J.; Fransecky, L.R.; Hartung, T.; Türkmen, S.; et al. Acute myeloid leukemia in the elderly is characterized by a distinct genetic and epigenetic landscape. Leukemia 2017, 31, 1640–1644. [Google Scholar] [CrossRef] [PubMed]
  20. Nagel, G.; Weber, D.; Fromm, E.; Erhardt, S.; Lübbert, M.; Fiedler, W.; Kindler, T.; Krauter, J.; Brossart, P.; Kündgen, A.; et al. Epidemiological, genetic, and clinical characterization by age of newly diagnosed acute myeloid leukemia based on an academic population-based registry study (AMLSG BiO). Ann. Hematol. 2017, 96, 1993–2003. [Google Scholar] [CrossRef] [Green Version]
  21. Perry, M.; Bertoli, S.; Rocher, C.; Hayette, S.; Ducastelle, S.; Barraco, F.; Labussière-Wallet, H.; Salles, G.; Recher, C.; Thomas, X.; et al. FLT3-TKD Mutations associated with NPM1 mutations define a favorable-risk group in patients with acute myeloid leukemia. Clin. Lymphoma Myeloma Leuk 2018, 18, e545–e550. [Google Scholar] [CrossRef]
  22. Papaemmanuil, E.; Gerstung, M.; Bullinger, L.; Gaidzik, V.I.; Paschka, P.; Roberts, N.D.; Potter, N.E.; Heuser, M.; Thol, F.; Bolli, N.; et al. Genomic classification and prognosis in acute myeloid leukemia. N. Engl. J. Med. 2016, 374, 2209–2221. [Google Scholar] [CrossRef] [PubMed]
  23. Boddu, P.; Kantarjian, H.; Borthakur, G.; Kadia, T.; Daver, N.; Pierce, S.; Andreeff, M.; Ravandi, F.; Cortes, J.; Kornblau, S.M. Co-occurrence of FLT3-TKD and NPM1 mutations defines a highly favorable prognostic AML group. Blood Adv. 2017, 1, 1546–1550. [Google Scholar] [CrossRef] [Green Version]
  24. Janke, H.; Pastore, F.; Schumacher, D.; Herold, T.; Hopfner, K.P.; Schneider, S.; Berdel, W.E.; Büchner, T.; Woermann, B.J.; Subklewe, M.; et al. Activating FLT3 mutants show distinct gain-of-function phenotypes in vitro and a characteristic signaling pathway profile associated with prognosis in acute myeloid leukemia. PLoS ONE 2014, 9, e89560. [Google Scholar] [CrossRef] [PubMed]
  25. Green, C.L.; Evans, C.M.; Zhao, L.; Hills, R.K.; Burnett, A.K.; Linch, D.C.; Gale, R.E. The prognostic significance of IDH2 mutations in AML depends on the location of the mutation. Blood 2011, 118, 409–412. [Google Scholar] [CrossRef] [Green Version]
  26. Prassek, V.V.; Rothenberg-Thurley, M.; Sauerland, M.C.; Herold, T.; Janke, H.; Ksienzyk, B.; Konstandin, N.P.; Goerlich, D.; Krug, U.; Faldum, A.; et al. Genetics of acute myeloid leukemia in the elderly: Mutation spectrum and clinical impact in intensively treated patients aged 75 years or older. Haematologica 2018, 103, 1853–1861. [Google Scholar] [CrossRef]
  27. Barjesteh, V.W.V.D.K.; Erpelinck, C.; van Putten, W.L.; Valk, P.J.; Hack, R.; Slater, R.; Smit, E.M.; Beverloo, H.B.; Verhoef, G.; Verdonck, L.F.; et al. High EVI1 expression predicts poor survival in acute myeloid leukemia: A study of 319 de novo AML patients. Blood 2003, 101, 837–845. [Google Scholar]
  28. Smol, T.; Nibourel, O.; Marceau-Renaut, A.; Celli-Lebras, K.; Berthon, C.; Quesnel, B.; Boissel, N.; Terré, C.; Thomas, X.; Castaigne, S.; et al. Quantification of EVI1 transcript levels in acute myeloid leukemia by RT-qPCR analysis: A study by the ALFA Group. Leuk Res. 2015, 39, 1443–1447. [Google Scholar] [CrossRef]
  29. Heiblig, M.; Le Jeune, C.; Elhamri, M.; Balsat, M.; Tigaud, I.; Plesa, A.; Barraco, F.; Labussière, H.; Ducastelle, S.; Nicolini, F.; et al. Treatment patterns and comparative effectiveness in elderly acute myeloid leukemia patients (age 70 years or older): The Lyon-university hospital experience. Leuk Lymphoma 2017, 58, 110–117. [Google Scholar] [CrossRef] [PubMed]
  30. Gardin, C.; Pautas, C.; Lemasle, E.; Bourhis, J.H.; Ades, L.; Marolleau, J.P.; Valère Malfuson, J.; Gastaud, L.; Raffoux, E.; Cano, I.; et al. Role of allogeneic reduced intensity conditioning stem cell transplantation (RIC-SCT) in older patients with acute myeloid leukemia (AML): Analysis of the ALFA-1200 study. Blood 2017, 130, 466. [Google Scholar]
  31. Foran, J.; Sun, Z.; Claxton, D.; Lazarus, H.; Paietta, E.; Godwin, J.; Luger, S.; Rowe, J.; Altman, J.; Pratz, K.; et al. Prospective study of HLA-matched donor availability and survival in remission after AML in older adults: 1st planned analysis from ECOG-ACRIN E2906 phase III randomized trial in patients age ≥60 years. In Proceedings of the European Hematology Association Congress, Stockholm, Sweden, 16 June 2018. [Google Scholar]
  32. Balsat, M.; Renneville, A.; Thomas, X.; de Botton, S.; Caillot, D.; Marceau, A.; Lemasle, E.; Marolleau, J.P.; Nibourel, O.; Berthon, C.; et al. Postinduction minimal residual disease predicts outcome and benefit from allogeneic stem cell transplantation in acute myeloid leukemia with NPM1 mutation: A study by the Acute Leukemia French Association Group. J. Clin. Oncol. 2017, 35, 185–193. [Google Scholar] [CrossRef]
  33. Krönke, J.; Schlenk, R.F.; Jensen, K.O.; Tschürtz, F.; Corbacioglu, A.; Gaidzik, V.I.; Paschka, P.; Onken, S.; Eiwen, K.; Habdank, M.; et al. Monitoring of minimal residual disease in NPM1-mutated acute myeloid leukemia: A study from the German-Austrian acute myeloid leukemia study group. J. Clin. Oncol. 2011, 29, 2709–2716. [Google Scholar] [CrossRef]
  34. Buccisano, F.; Maurillo, L.; Piciocchi, A.; Del Principe, M.I.; Sarlo, C.; Cefalo, M.; Ditto, C.; Di Veroli, A.; De Santis, G.; Irno Consalvo, M.; et al. Minimal residual disease negativity in elderly patients with acute myeloid leukemia may indicate different postremission strategies than in younger patients. Ann. Hematol. 2015, 94, 1319–1326. [Google Scholar] [CrossRef]
  35. Boddu, P.; Jorgensen, J.; Kantarjian, H.; Borthakur, G.; Kadia, T.; Daver, N.; Alvarado, Y.; Pemmaraju, N.; Bose, P.; Naqvi, K.; et al. Achievement of a negative minimal residual disease state after hypomethylating agent therapy in older patients with AML reduces the risk of relapse. Leukemia 2017, 32, 241–244. [Google Scholar] [CrossRef]
  36. Lambert, J.; Lambert, J.; Thomas, X.; Marceau-Renaut, A.; Renneville, A.; Coude, M.M.; Hayette, S.; Recher, C.; Raffoux, E.; Pigneux, A.; et al. Early detection of WT1 minimal residual disease predicts outcome in acute myeloid leukemia and identify patients with high risk of relapse independently of allogeneic stem cell transplantation. Blood 2017, 130, 29. [Google Scholar]
  37. Bennett, J.M.; Catovsky, D.; Daniel, M.T.; Flandrin, G.; Galton, D.A.; Gralnick, H.R.; Sultan, C. Proposed revised criteria for the classification of acute myeloid leukemia. A report of the French-American-British Cooperative Group. Ann. Intern. Med. 1985, 103, 620–625. [Google Scholar] [CrossRef]
  38. Plesa, C.; Le, Q.H.; Chelghoum, Y.; Elhamria, M.; Tigaud, I.; Anglaret, B.; Ducastelle, S.; Perrine, M.C.; Nicolini, F.; Belhabri, A.; et al. Prognostic index for older adult patients with newly diagnosed acute myeloid leukemia: The Edouard Herriot hospital experience. Clin. Leuk 2008, 2, 198–204. [Google Scholar] [CrossRef]
  39. Adès, L.; Guerci, A.; Raffoux, E.; Sanz, M.; Chevallier, P.; Lapusan, S.; Recher, C.; Thomas, X.; Rayon, C.; Castaigne, S.; et al. Very long-term outcome of acute promyelocytic leukemia after treatment with all-trans retinoic acid and chemotherapy: The European APL group experience. Blood 2010, 115, 1690–1696. [Google Scholar] [CrossRef]
  40. Fattoum, J.; Cannas, G.; Elhamri, M.; Tigaud, I.; Plesa, A.; Heiblig, M.; Plesa, C.; Wattel, E.; Thomas, X. Effect of age on treatment decision-making in elderly patients with acute myeloid leukemia. Clin Lymphoma Myeloma Leuk 2015, 15, 477–483. [Google Scholar] [CrossRef] [PubMed]
  41. Schaffer, L.G.; Slovak, M.L.; Campbell, L.J. An International System for Human Cytogenetic Nomenclature: Recommendations of the International Standing Committee on Human Cytogenetic Nomenclature; Karger Publishers: Berlin, Germany, 2009. [Google Scholar]
  42. Pabst, T.; Mueller, B.; Zhang, P.; Radomska, H.S.; Narravula, S.; Schnittger, S.; Behre, G.; Hiddemann, W.; Tenen, D.G. Dominant-negative mutations of CEBPA, encoding CCAAT/enhancer bindingprotein-α (C/EBPα), in acute myeloid leukemia. Nat. Genet. 2001, 27, 263–270. [Google Scholar] [CrossRef] [PubMed]
  43. Huet, S.; Jallades, L.; Charlot, C.; Chabane, K.; Nicolini, F.E.; Michallet, M.; Magaud, J.P.; Hayette, S. New Quantitative Method to Identify NPM1 Mutations in Acute Myeloid Leukaemia. Leuk Res. Treat. 2013, 2013, 756703. [Google Scholar] [CrossRef] [PubMed]
  44. Meshinchi, S.; Woods, W.G.; Stirewalt, D.L.; Sweetser, D.A.; Buckley, J.D.; Tjoa, T.K.; Bernstein, I.D.; Radich, J.P. Prevalence and prognostic significance of Flt3 internal tandem duplication in pediatric acute myeloid leukemia. Blood 2001, 97, 89–94. [Google Scholar] [CrossRef] [PubMed] [Green Version]
  45. Libura, M.; Asnafi, V.; Tu, A.; Delabesse, E.; Tigaud, I.; Cymbalista, F.; Bennaceur-Griscelli, A.; Villarese, P.; Solbu, G.; Hagemeijer, A.; et al. FLT3 and MLL intragenic abnormalities in AML reflect a common category of genotoxic stress. Blood 2003, 2198–2204. [Google Scholar] [CrossRef]
  46. Caligiuri, M.A.; Strout, M.P.; Schichman, S.A.; Mrózek, K.; Arthur, D.C.; Herzig, G.P.; Baer, M.R.; Schiffer, C.A.; Heinonen, K.; Knuutila, S.; et al. Partial Tandem Duplication of ALL as a Recurrent Molecular Defect in Acute Myeloid Leukemia with Trisomy 11. Cancer Res. 1996, 56, 1418–1425. [Google Scholar] [PubMed]
  47. Preudhomme, C.; Sagot, C.; Boissel, N.; Cayuela, J.M.; Tigaud, I.; de Botton, S.; Thomas, X.; Raffoux, E.; Lamandin, C.; Castaigne, S.; et al. Favorable prognostic significance of CEBPA mutations in patients with de novo acute myeloid leukemia: A study from the Acute Leukemia French Association (ALFA). Blood 2002, 100, 2717–2723. [Google Scholar] [CrossRef]
  48. Boissel, N.; Nibourel, O.; Renneville, A.; Gardin, C.; Reman, O.; Contentin, N.; Bordessoule, D.; Pautas, C.; de Revel, T.; Quesnel, B.; et al. Prognostic Impact of Isocitrate Dehydrogenase Enzyme Isoforms 1 and 2 Mutations in Acute Myeloid Leukemia: A Study by the Acute Leukemia French Association Group. J. Clin. Oncol. 2010, 28, 3717–3723. [Google Scholar] [CrossRef] [PubMed]
  49. Sylvie, M.; Noordermeer, S.M.; Tönnissen, E.; van der Heijden, A.; van de Locht, L.T.; Deutz-Terlouw, P.P.; Marijt, E.W.; Jansen, J.H.; van der Reijden, B.A. Rapid identification of IDH1 and IDH2 mutations in acute myeloid leukaemia using high resolution melting curve analysis. Br. J. Haematol. 2011, 152, 493–496. [Google Scholar] [CrossRef]
  50. Cilloni, D.; Gottardi, E.; De Micheli, D.; Serra, A.; Volpe, G.; Messa, F.; Rege-Cambrin, G.; Guerrasio, A.; Divona, M.; Lo Coco, F.; et al. Quantitative assessment of WT1 expression by real time quantitative PCR may be a useful tool for monitoring minimal residual disease in acute leukemia patients. Leukemia 2002, 16, 2115–2121. [Google Scholar] [CrossRef] [PubMed] [Green Version]
  51. Hayette, S.; Thomas, X.; Jallades, L.; Chabane, K.; Charlot, C.; Tigaud, I.; Gazzo, S.; Morisset, S.; Cornillet-Lefebvre, P.; Plesa, A.; et al. High DNA Methyltransferase DNMT3B Levels: A Poor Prognostic Marker in Acute Myeloid Leukemia. PLoS ONE 2012, 7, e51527. [Google Scholar] [CrossRef]
  52. Lancet, J.E.; Uy, G.L.; Cortes, J.E.; Newell, L.F.; Lin, T.L.; Ritchie, E.K.; Stuart, R.K.; Strickland, S.A.; Hogge, D.; Solomon, S.R.; et al. CPX-351 (cytarabine and daunorubicin) Liposome for Injection Versus Conventional Cytarabine Plus Daunorubicin in Older Patients With Newly Diagnosed Secondary Acute Myeloid Leukemia. J. Clin. Oncol. 2018, 36, 2684–2692. [Google Scholar] [CrossRef]
  53. DiNardo, C.D.; Pratz, K.; Pullarkat, V.; Jonas, B.A.; Arellano, M.; Becker, P.S.; Frankfurt, O.; Konopleva, M.; Wei, A.H.; Kantarjian, H.M.; et al. Venetoclax combined with decitabine or azacitidine in treatment-naive, elderly patients with acute myeloid leukemia. Blood 2018, 133, 7–17. [Google Scholar] [CrossRef] [PubMed]
Figure 1. (A) Overall and (B) progression free survival of NK NPM1+/FLT3-ITD+, NPM1−/FLT3-ITD+ and NPM1−/FLT3-ITD− patients treated intensively. (C) Overall and (D) progression-free survival of intermediate abnormal karyotype patients (independently of NPM1/FLT3-ITD status) according to treatment intensity.
Cancers 11 00570 g001
Figure 2. (A) Overall survival in NK patients according to their NPM1/FLT3-ITD status, (B) overall survival in FLT3-ITD− patients according to NPM1 and FLT3-TKD status, (C) overall survival in patients with IDH1 R132, IDH2 R140Q/R172K, MLL-DUP mutations and MECOM1 overexpression, independently of the karyotype, (D) overall survival in NPM1 mutated patients according to NPM1 MRD1 log reduction (all patients were treated intensively).
Cancers 11 00570 g002
Table 1. Demographic, biological and clinical characteristics at baseline stratified by age group: group 1 (age 60–69 years old) and group 2 (age ≥70 years old).
VariableTotal
(n = 495)
Group 1: 60–69 yo
(n = 260)
Group 2: 70+ yo
(n = 235)
p-Value
Age at diagnosis, median (range)69 (64–73)65 (60-69.9)74 (70–92.7)-
Sex ratio M/F (n)1.3 (282/213)1.3 (143/112)1.3 (134/101)0.95
PS > 2, n (%)76/440 (17.3%)38/223 (17%)38/215 (17.7%)0.71
WBC (G/L), median (range)5.6 (1.9–32)5.9 (1.8–32)5.5 (2.06–28.75)0.81
Hb (G/L), median (range)9.1 (8.1–10.5)9 (8.2–10.4)9.1 (8.1–10.6)0.58
Platelets (G/L), median (range)60 (30–103)60 (29–108.8)61 (32–101)0.95
Peripheral blasts, median (range)25 (0–100)20.5 (0–100)28 (0–95)0.62
Medullar blasts, median (range)60 (31–85)60 (30–80)65 (35–90)0.21
LDH (UI/L), median (range)452 (266–854)532 (310–878)354 (248–797)0.004
Extramedullar localization at diagnosis, N (%)18/488 (3.7%)7/255 (2.7%)11/233 (4.7%)0.27
Secondary AML, n (%)
    Solid cancer
    MDS/MPN
125/488 (25.6%)
48 (9.8%)
79 (16.2%)
68/255 (26.7%)
25 (9.8%)
45 (17.6%)
57/233 (24.4%)
23 (9.8%)
34 (14.6%)
0.93
ELN 2010 risk groupsFavorable, n (%)104 (21.1%)61 (23.4%)43 (18.2%)0.84
Intermediate, n (%)249 (50.3%)129 (49.6%)120 (51.1%)
Unfavorable, n (%)121 (24.4%)60 (23.1%)61 (25.9%)
Failure, n (%)21 (4.2%)10 (3.9%)11 (4.8%)
Molecular subgroupsNPM1,n (%)110/464 (23.7%)62/242 (25.6%)48/222 (21.6%)0.5
FLT3-ITD,n (%)78/464 (16.8%)40/242 (16.5%)38/222 (17.1%)0.88
FLT3-TKD,n (%)36/460 (7.8%)26/242 (10.7%)10/218 (4.5%)0.09
CEBPα,n (%)2/145 (1.4%)0/832/62 (3.2%)0.38
IDH1 R132H, n (%)24/367 (6.5%)16/221 (7.2%)8/146 (5.4%)0.85
IDH2 R140Q/R172K,n (%)25/367 (6.8%)16/221(7.2%)9/177 (5.1%)0.85
MLL-PTD, n (%)35/430 (8.1%)18/235 (7.6%)17/195 (8.7%)0.91
DNMT3A R882,n (%)36/143 (25.2%)22/93 (23.6%)14/50 (28%)0.56
WT1 OE, n (%)147/432 (34%)77/238 (32.3%)70/194 (36.1%)0.37
MECOM1 OE, n (%)54/435 (12.4%)33/238 (13.9%)21/197 (10.6%)0.31
Genetic characteristics available at treatment initiation, n (%)290 (58.6%)184 (70.7%)106 (45.1%)<0.001
* Intermediate 1 and 2 risk groups have been fused together. Legend: Hb = Hemoglobin, LDH = lactate deshydrogenase, MDS = myelodysplastic syndrome, MPN = myeloprolferative neoplasm, OE = overexpression, PS = performance status, yo = years old, WBC = white blood cell.
Table 2. Treatment intensity proportion among age groups and rate of response according to the initial treatment type after removing APL patients.
VariableTotal
(n = 495)
Group1: 60–69 yo
(n = 260)
Group2: 70+ yo
(n = 235)
p-Value
1st line treatment intensity, n (%)BSC92 (18.6%)20 (7.7%)72 (30.6%)<0.001
Low intensive
HMA
LDAC
128 (25.8%)
68 (13.7%)
60 (12.1%)
30 (11.5%)
20 (7.7%)
10 (3.8%)
98 (41.6%)
49 (20.8%)
49 (20.8%)
Intensive259 (52.3%)209 (80.3%) *50 (21.3%) **
Experimental drug16 (3.2%)1 (<1%)15 (6.4%)0.06
1st line intensive chemotherapy response, n (%)CRc
  Favorable ***
  Intermediate
  Unfavorable
157/230 (68.2%)
41/44 (93.2%)
86/127 (67.7%)
23/48 (47.9%)
135/192 (70.3%)
38/40 (95%)
71/102 (69.6%)
21/43 (48.8%)
22/38 (57.9%)
3/4 (75%)
15/25 (60%)
2/5 (40%)
0.13
Refractory52/230 (22.6%)42/192 (21.9%)11/38 (28.9%)0.34
Early death
  PS 0–1
  PS 2
  PS 3–4
19/230 (8.2%)
2.9%
12%
30%
14/192 (7.3%)
3.1%
12.5%
20.8%
5/38 (13.2%)
2.9%
22%
50%
0.003
1st line low- intensive chemotherapy response, n (%)CRc17/128 (13.3%)3/30 (10%)16/98 (16.3%)0.39
Early death24/128 (18.7%)4/30 (13,3%)20/98 (20.4%)0.38
1st line best supportive care, N (%)Early death54/92 (58.7%)12/20 (60%)41/72 (56.9%)0.73
Median time from CR1 to progression/relapse, months (95% CI)7.59 (4.29–13.99)7.89 (4.24–14.09)7.56 (4.98–12.07)0.56
HSCT in CR1, N (%)28 (12.1%)28 (14.5%)00.02
Median follow-up time since diagnosis, months (95% CI)7.62 (2.8–20)10.13 (4.8–26.1)4.6 (1.8–14.1)0.01
* Including 18 APL patients, ** Including 12 APL patients, *** APL patients excluded. Legend: BSC = best supportive care, CRc = composite complete remission, HMA = hypomethylating agents, HSCT = hematopoietic stem cell transplantation, LDAC = low dose cytarabine, Q1–Q3 = 1st quartile–3rd quartile, yo = years old.
Table 3. Overall outcome of favorable NK NPM1+ patients, intermediate risk patients with NK according to their NPM1/FLT3-ITD status or with abnormal karyotype, and in patients harboring other molecular abnormalities.
Cytogenetic/Molecular Subgroup Treatment Intensity CRc Rate, N (%)Median OS, Months (95% CI)1 Year OS Probability, % (95% CI)p-Value Median PFS, Months (95% CI)1 Year PFS Probability, % (95% CI)p-Value
NK NPM1+/FLT3-ITD-Intensive33/34 (97%)34.8 (24–NR)80.6 (67.9–95.82)<0.00118.5 (14.8–NR)82.7 (69.9–97.9)<0.001
Low intensive3/12 (25%)9.4 (4–NR)40.9 (19.4–86.3)9.4 (3.7–NR)40.9 (19.4–86.3)
BSC02.8 (2–NR)26.7 (11.5–61.7)2.8 (1.7–NR)26.7 (11.5–61.7)
NK NPM1+/FLT3–ITD+Intensive17/24 (70.8%)10 (8.3–16.1)39.3 (23.6–65.3)<0.0018.4 (5.3–18.3)30.6 (15.9–58.5)<0.001
Low intensive2/8 (25%)3.9 (3.8–NR)03.9 (3.8–NR)0
BSC0/51.3 (1.15–NR)01.3 (1.15–NR)0
NK NPM1-/FLT3-ITD+Intensive4/10 (40%)7.56 (6.3–NR)48.2 (27.4–84.7)0.186.7 (3.3–NR)34 (15.8–73.4)0.37
Low intensive0/38.15 (4.7–NR)34.9 (14.3–82.1)8.15 (4.7–NR)34.3 (14.3–82.1)
BSC0/51.15 (0.6–NR)12.9 (2.1–79.85)1.3 (0.7–NR)11.4 (1.81–72.0)
NK NPM1-/FLT3-ITD-Intensive44/60 (73.3%)30.2 (10.5–NR)70.7 (50.2–89.7)<0.00117.4 (14–31.5)71.8 (59.75–86.2)<0.001
Low intensive2/26 (7.7%)13.4 (8.5–NR)52.8 (34.25–81.3)9.8 (3.2–15.6)39 (20.4–59.1)
BSC0/214.1 (4.1–NR)15.8 (6–41.3)1.4 (0.48–NR)19.85 (7.75–50.8)
Intermediate abnormal karyotypeIntensive22/38 (57.9%)24.2 (12.6–NR)67.6 (53.3–85.7)<0.00112.6 (9.1–41.4)52.9 (38.2–73.1)<0.001
Low intensive3/38 (7.9%)7.7 (4–14.4)32 (18.4–55.6)7.7 (4–12.5)28.7 (15.8–51.9)
BSC0/230.99 (0.59–2.23)16.5 (6.3–43)0.99 (0.6–2.2)14.1 (4–40)
Other molecular mutations/overexpression
FLT3-TKDIntensive16/24 (66.7%)36.4 (12.1–NR)66.8 (44.5–100)25.2 (10.1–NR)50.1 (34.6–75)
FLT3-TKD+NPM1-5/12 (41.7%)6.1 (2–NR)43.6 (21.8–87.44)0.0122.5 (1.8–NR)36.6 (21.8–87.44)0.02
FLT3-TKD+NPM1+11/12 (91.2%)NR (39.2–NR)91.7 (77.3–100)NR (29.6–NR)70.5 (77.3–100)
IDH1 R13211/13 (84.6%)46.6 (16.4–NR)72.7 (50.6–100)0.0846.6 (16.4–NR)72.7 (50.6–100)0.06
IDH2 R140Q/R712K13/18 (72.2%)NR (14–NR)83.1 (64.1–100)NR (11–NR)55.2 (34.1–75)
MLL-PTD7/15 (44%)15.1 (5.9–NR)66.7 (42–100)7.2 (3.1–NR)46.4 (31–79.7)
MECOM1 OE13/24 (54.2%)12.7 (8.4–62.4)60.7 (44.3–83.1)6.1 (3.2–51.4)50.6 (33.3–73.1)
Legend: BSC = best supportive care, CRc = composite complete remission, NK = normal karyotype, NR = not reached, OE = overexpression, OS = overall survival, PFS = progression free survival.
Table 4. Multivariate analysis including factors associated with survival on univariate analysis in the overall cohort and on intensively treated patients.
VariablesPFSOS
HRRangep-ValueHRRangep-Value
All cohortAge < 70 vs. ≥ 70 years old1.36(1.02–1.83)0.0391.28(0.95–1.73)0.107
PS > 21.91(1.32–2.75)<0.0011.88(1.30–2.71)<0.001
LDH > 400 UI/L1.73(1.27–2.35)<0.0011.56(1.15–2.13)0.005
Risk groupFavorable1.00--1.00--
Intermediate0.95(0.67–1.35)0.7850.85(0.60–1.21)0.366
Unfavorable1.24(0.85–1.83)0.2651.20(0.81–1.76)0.364
FLT3-ITD status: Mut vs. WT1.40(1.01–1.94)0.0421.56(1.13–2.16)0.007
Genetic characteristics at treatment decision (present vs. absent)0.31(0.19–0.58)<0.0010.42(0.21–0.63)<0.001
Treatment intensityIntensive1.00--1.00--
Low-intensive1.47(0.71–3.08)0.3021.50(0.72–3.17)0.282
BSC2.26(1.35–3.78)0.0021.90(1.15–3.16)0.013
Intensively treated patientsAge < 70 vs. ≥ 70 years old1.15(0.67–1.96)0.611.12(0.65–1.91)0.69
PS > 21.98(1.11–3.55)0.0211.79(1.04–3.08)0.035
Secondary AML vs. de novo1.46(0.80-2.63)0.211.07(0.71–1.59)0.76
Risk groupFavorable1.00--1.00--
Intermediate1.17(0.67–2.04)0.581.15(0.66–2.02)0.63
Unfavorable2.65(1.33–5.28)0.0062.78(1.45–5.32)0.002
FLT3-ITD status: Mut vs. WT1.72(1.06–2.78)0.031.80(1.12–2.90)0.015
IDH2 status: Mut vs. WT0.42(0.12–1.42)0.1610.44(0.13–1.50)0.19
CR1 post-induction (yes vs. no)0.36(0.23–0.56)<0.0010.39(0.27–0.57)<0.001
HSCT in CR1 (yes vs. no)1.02(0.57–1.84)0.931.05(0.59–1.88)0.87
Genetic characteristics at treatment decision (present vs. absent)0.38(0.26–0.56)<0.0010.38(0.25–0.58)<0.001
Legend: CR1 = complete remission 1, HR = hazard ratio, HSCT = hematopoietic allogeneic stem cell transplantation, LDH = lactate deshydrogenase, Mut = mutated, OS = overall survival, PFS = progression free survival, PS = performance status, WT = wild type.

