
Droplet Motion Driven by Liquid Dielectrophoresis in the Low-Frequency Range

Abstract
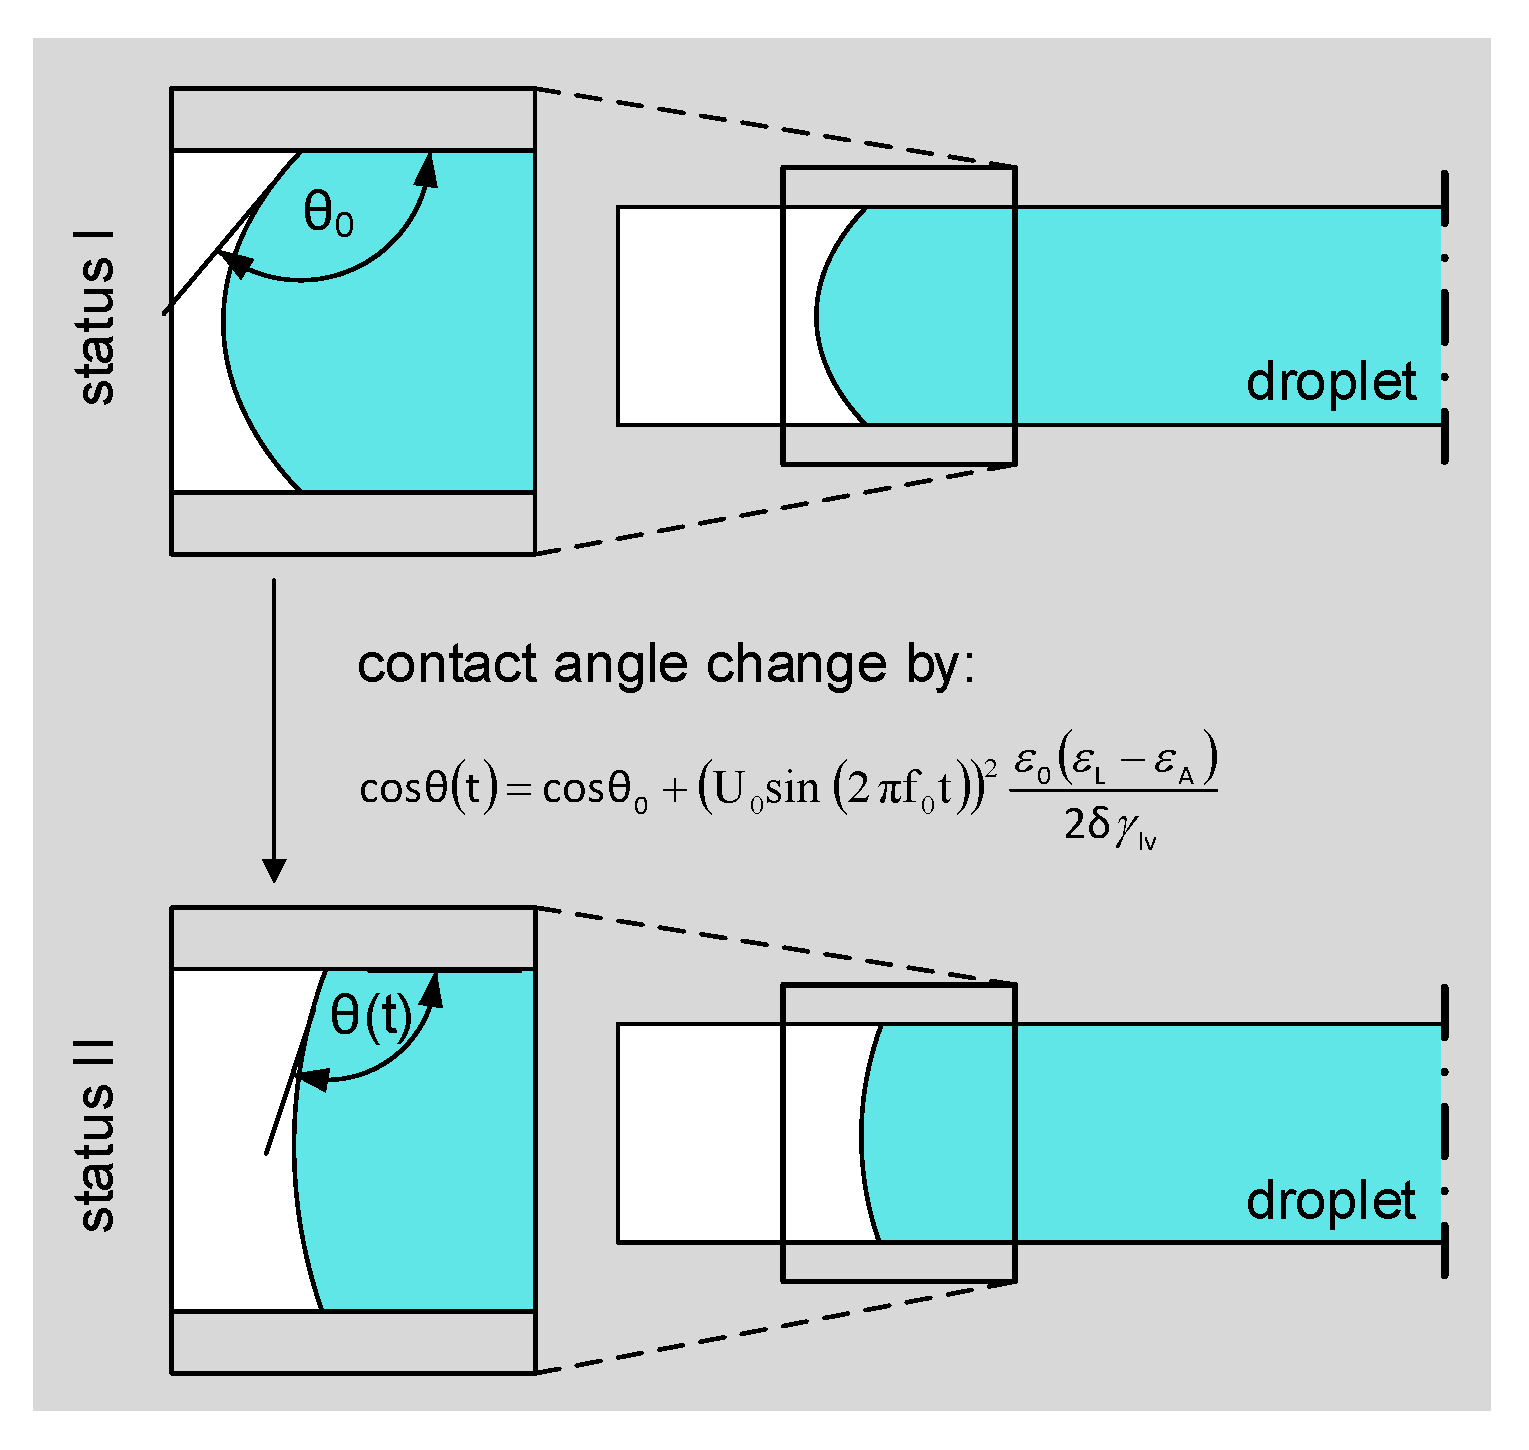
:1. Introduction
2. Microfluidic System for LDEP Actuation
2.1. System Configuration
2.2. Liquids
2.3. Electrode Geometry
3. Results and Discussion
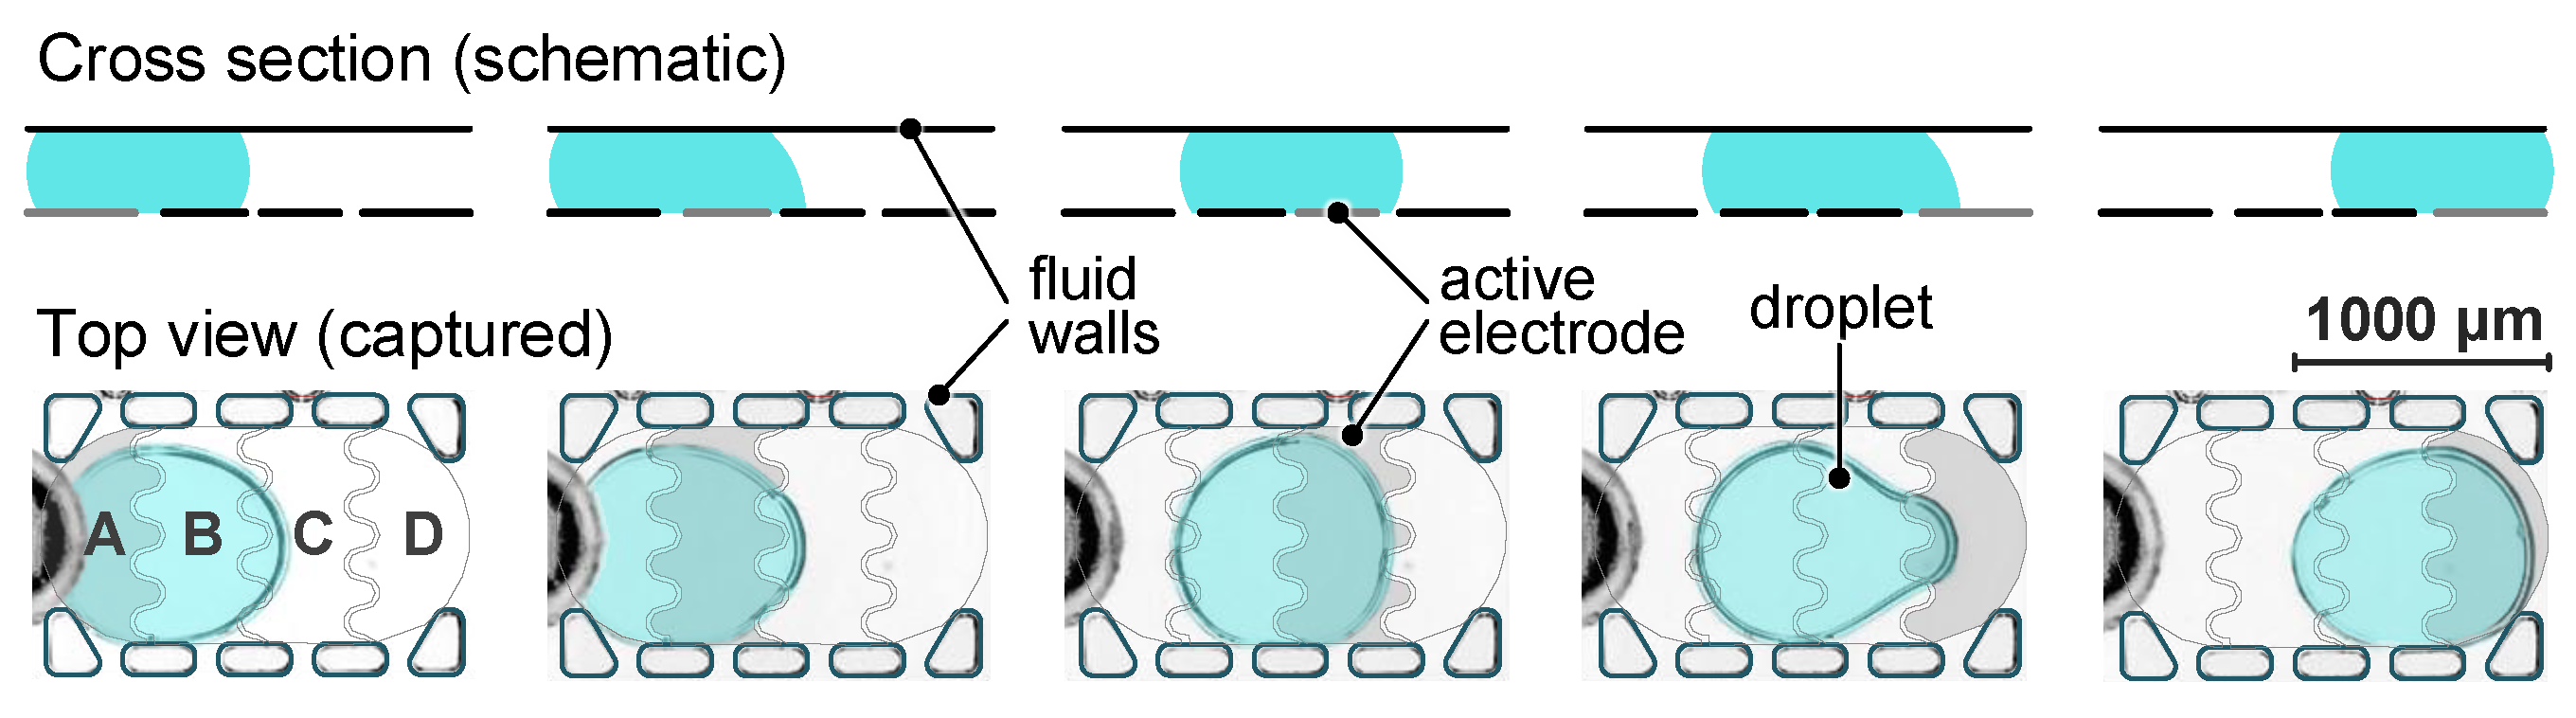
3.1. LDEP-Induced Droplet Actuation
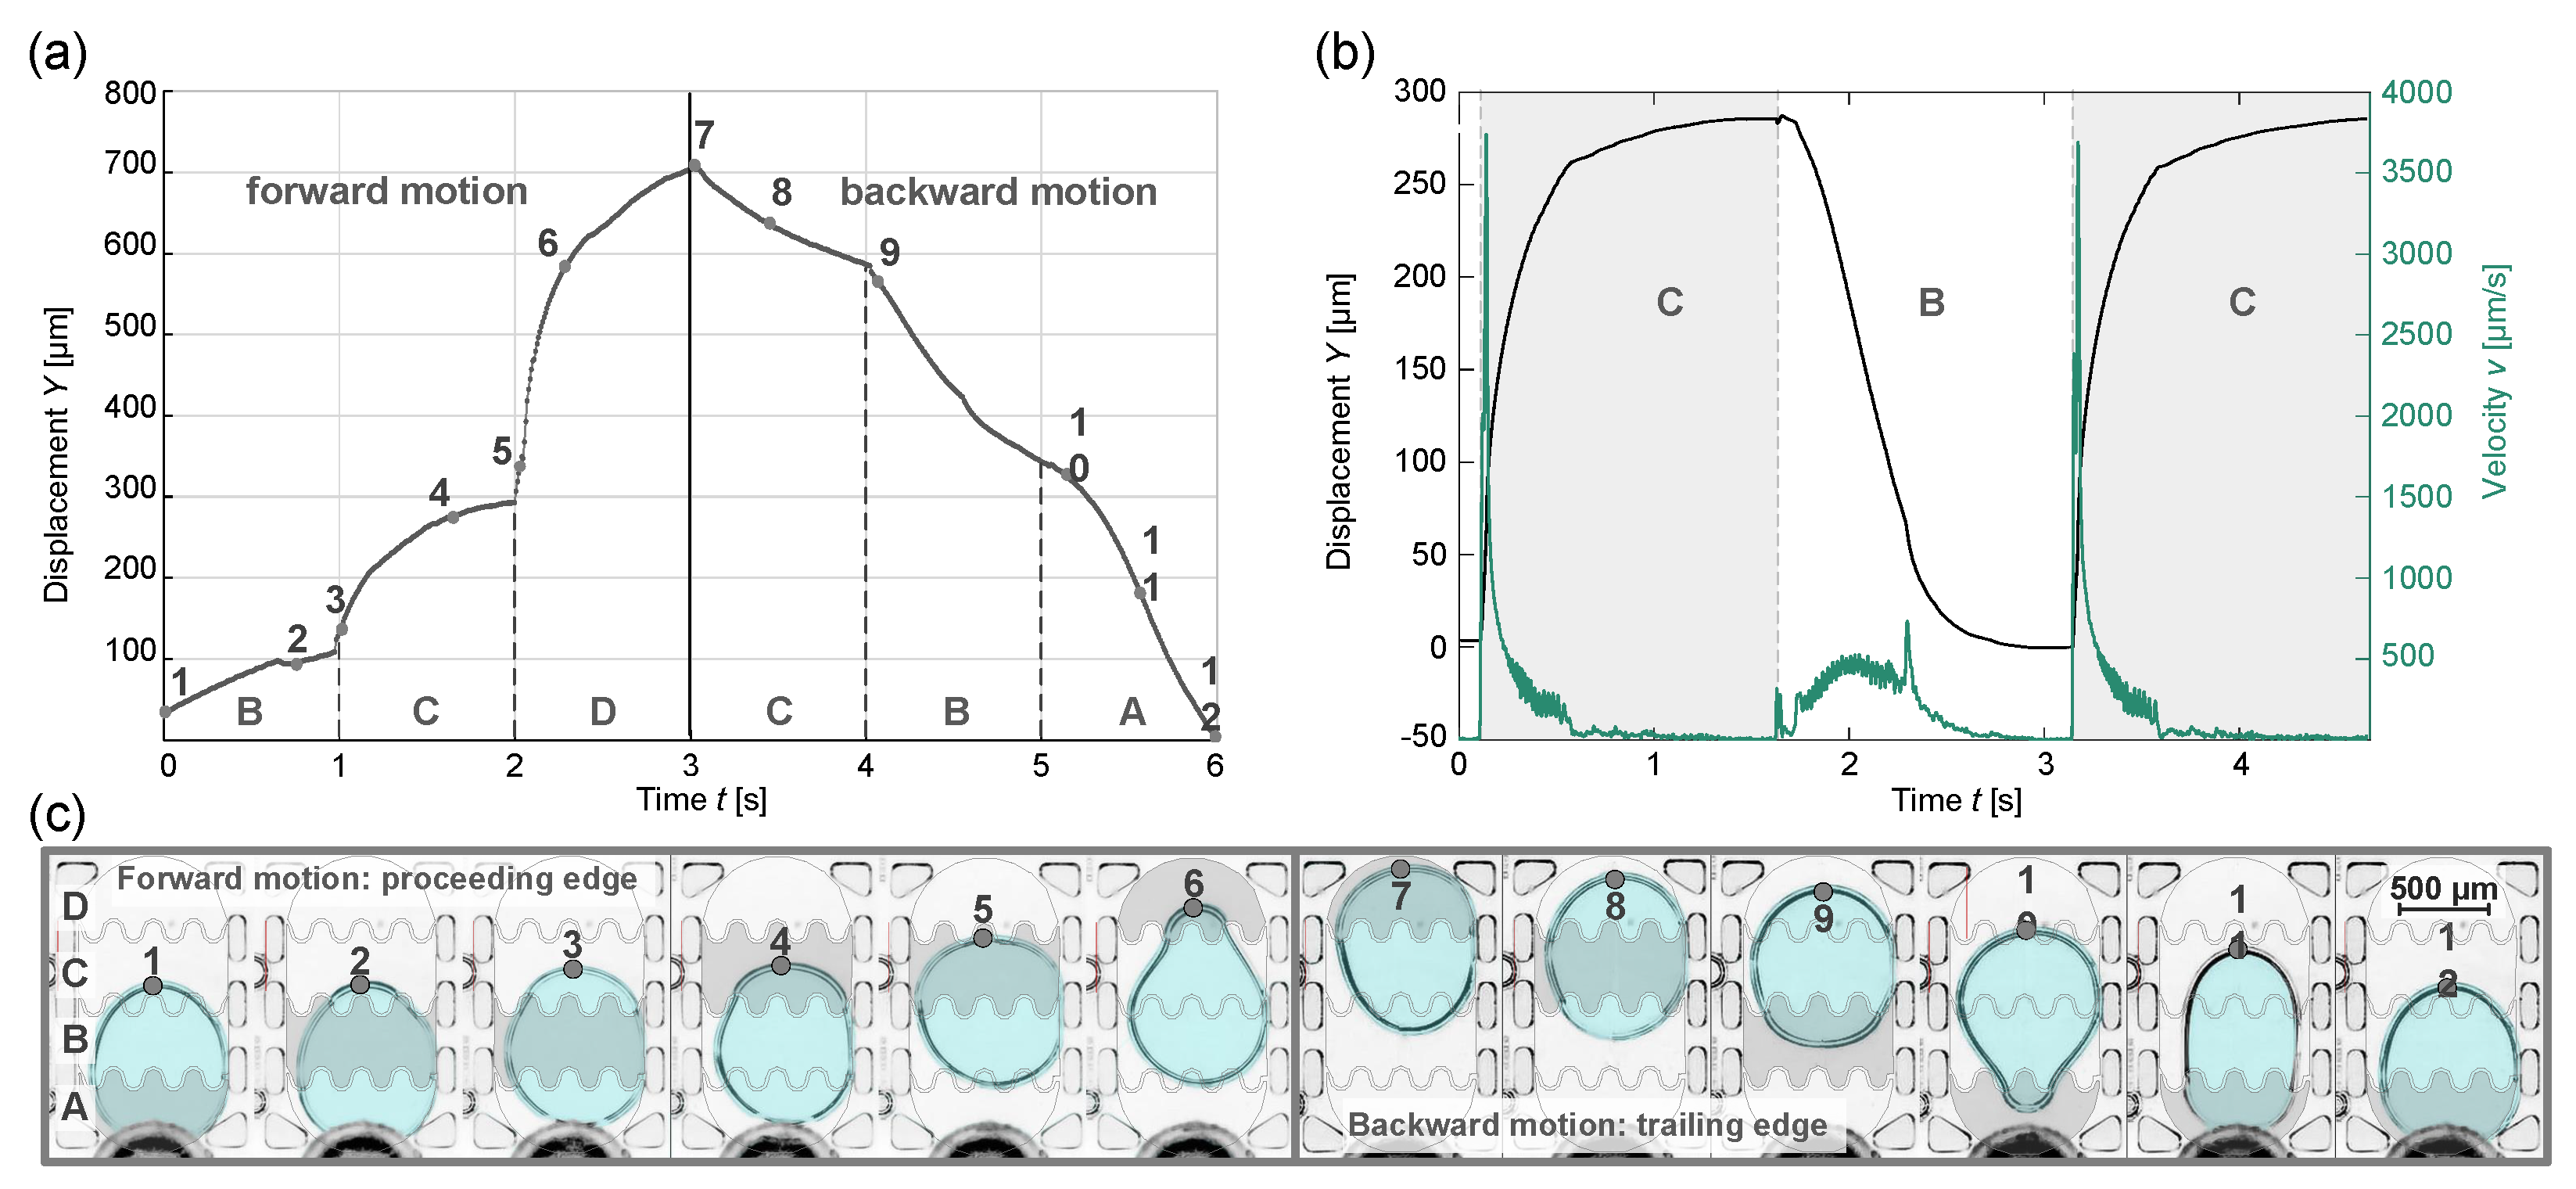
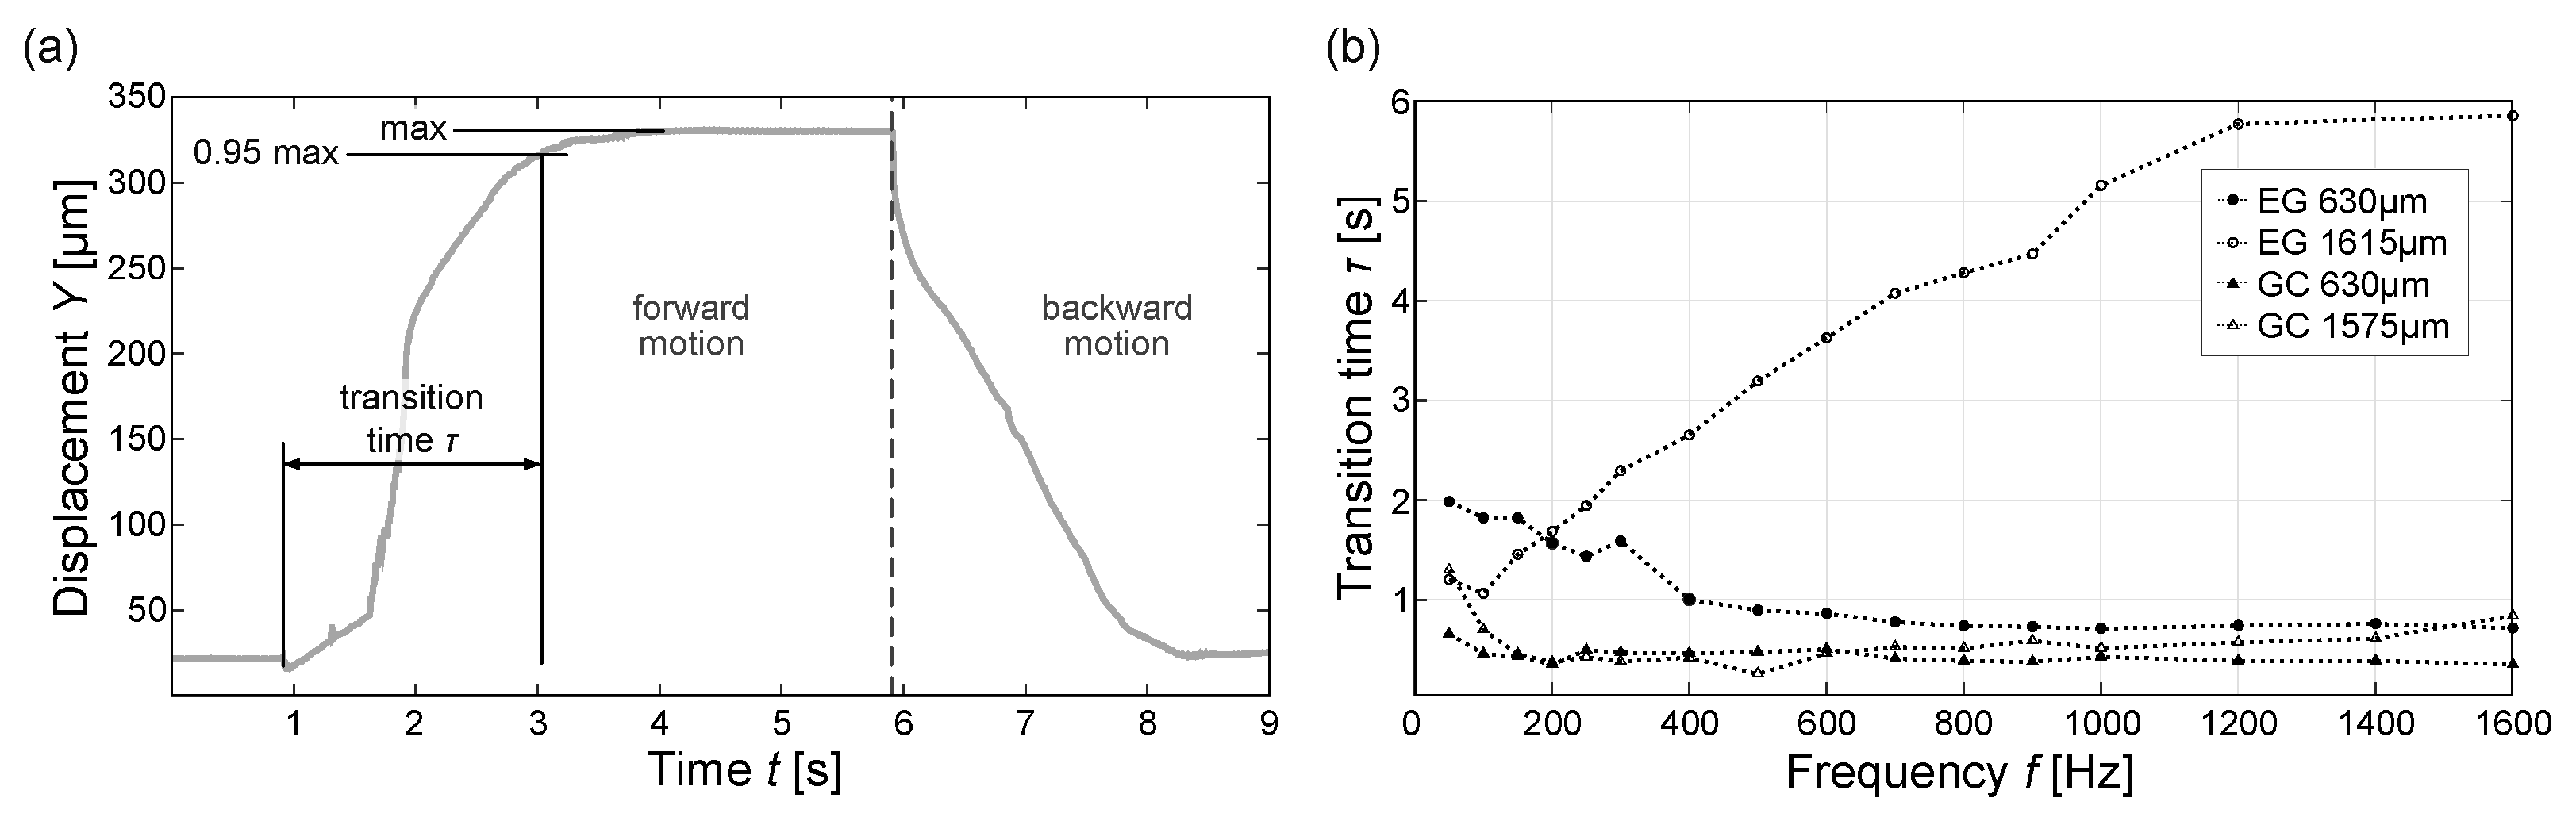
3.2. Motion Profile
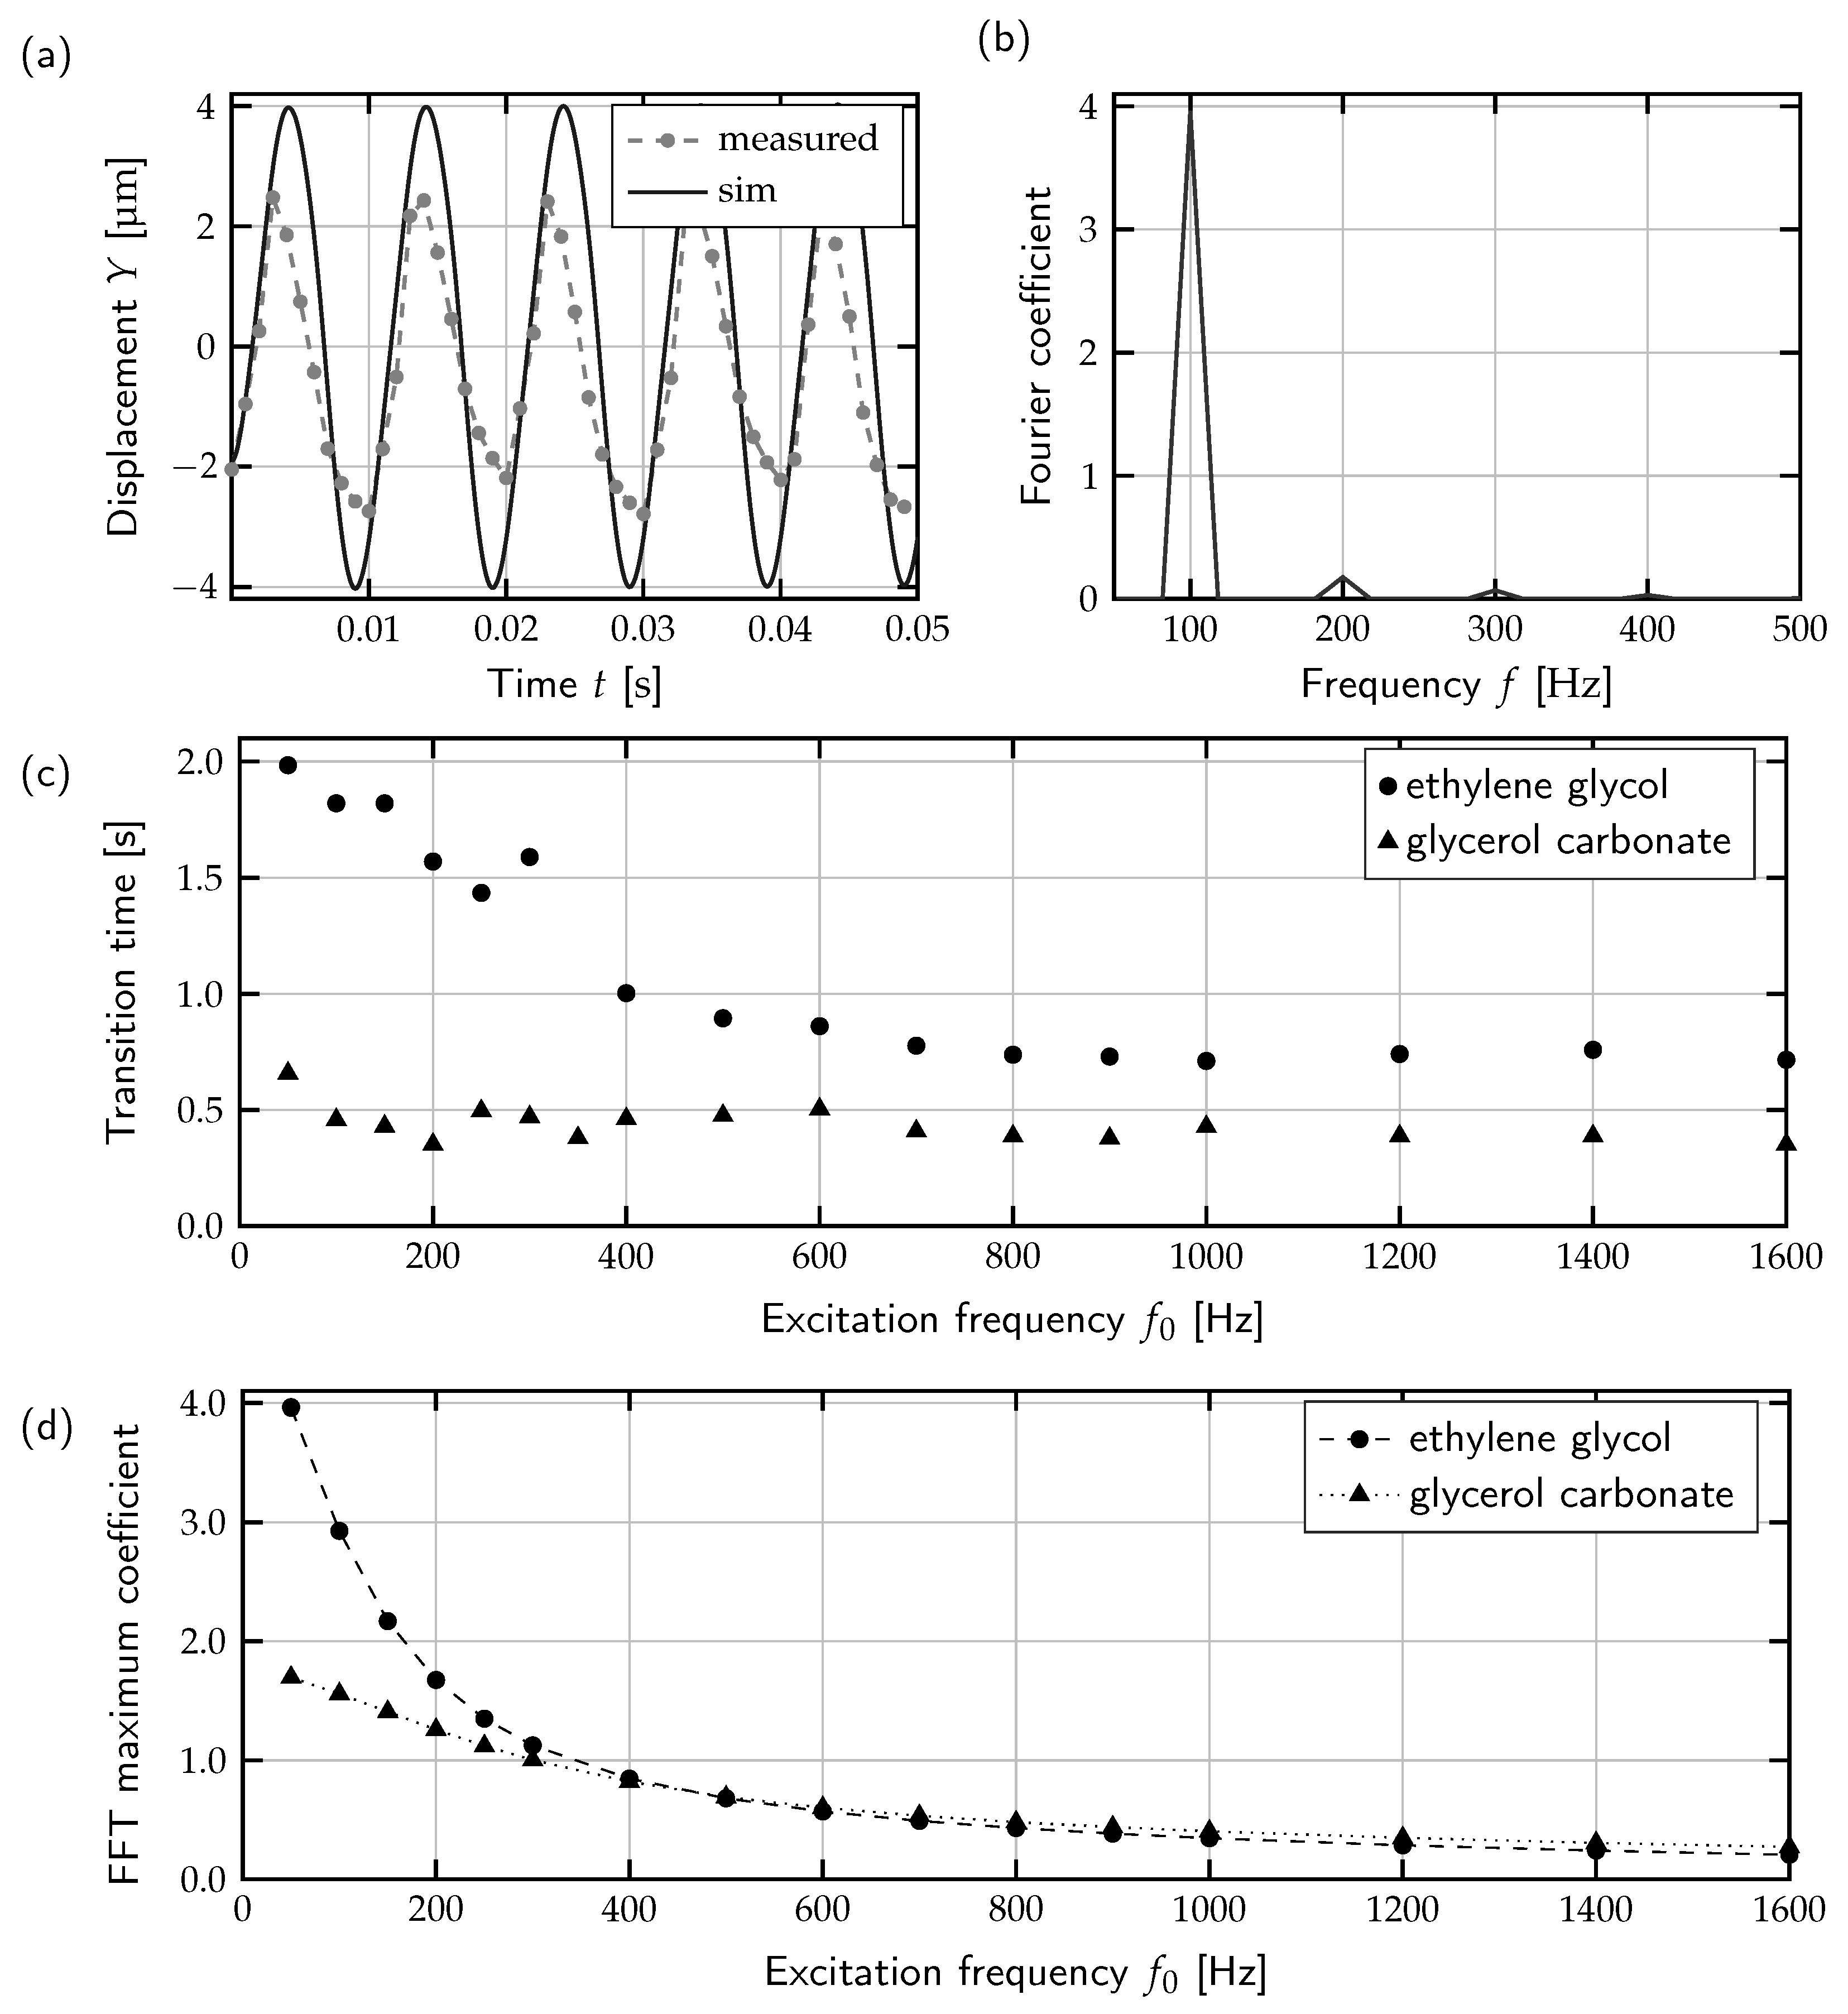
3.3. Frequency Variation
3.4. Numerical Model of Droplet Contour Vibration
4. Methods
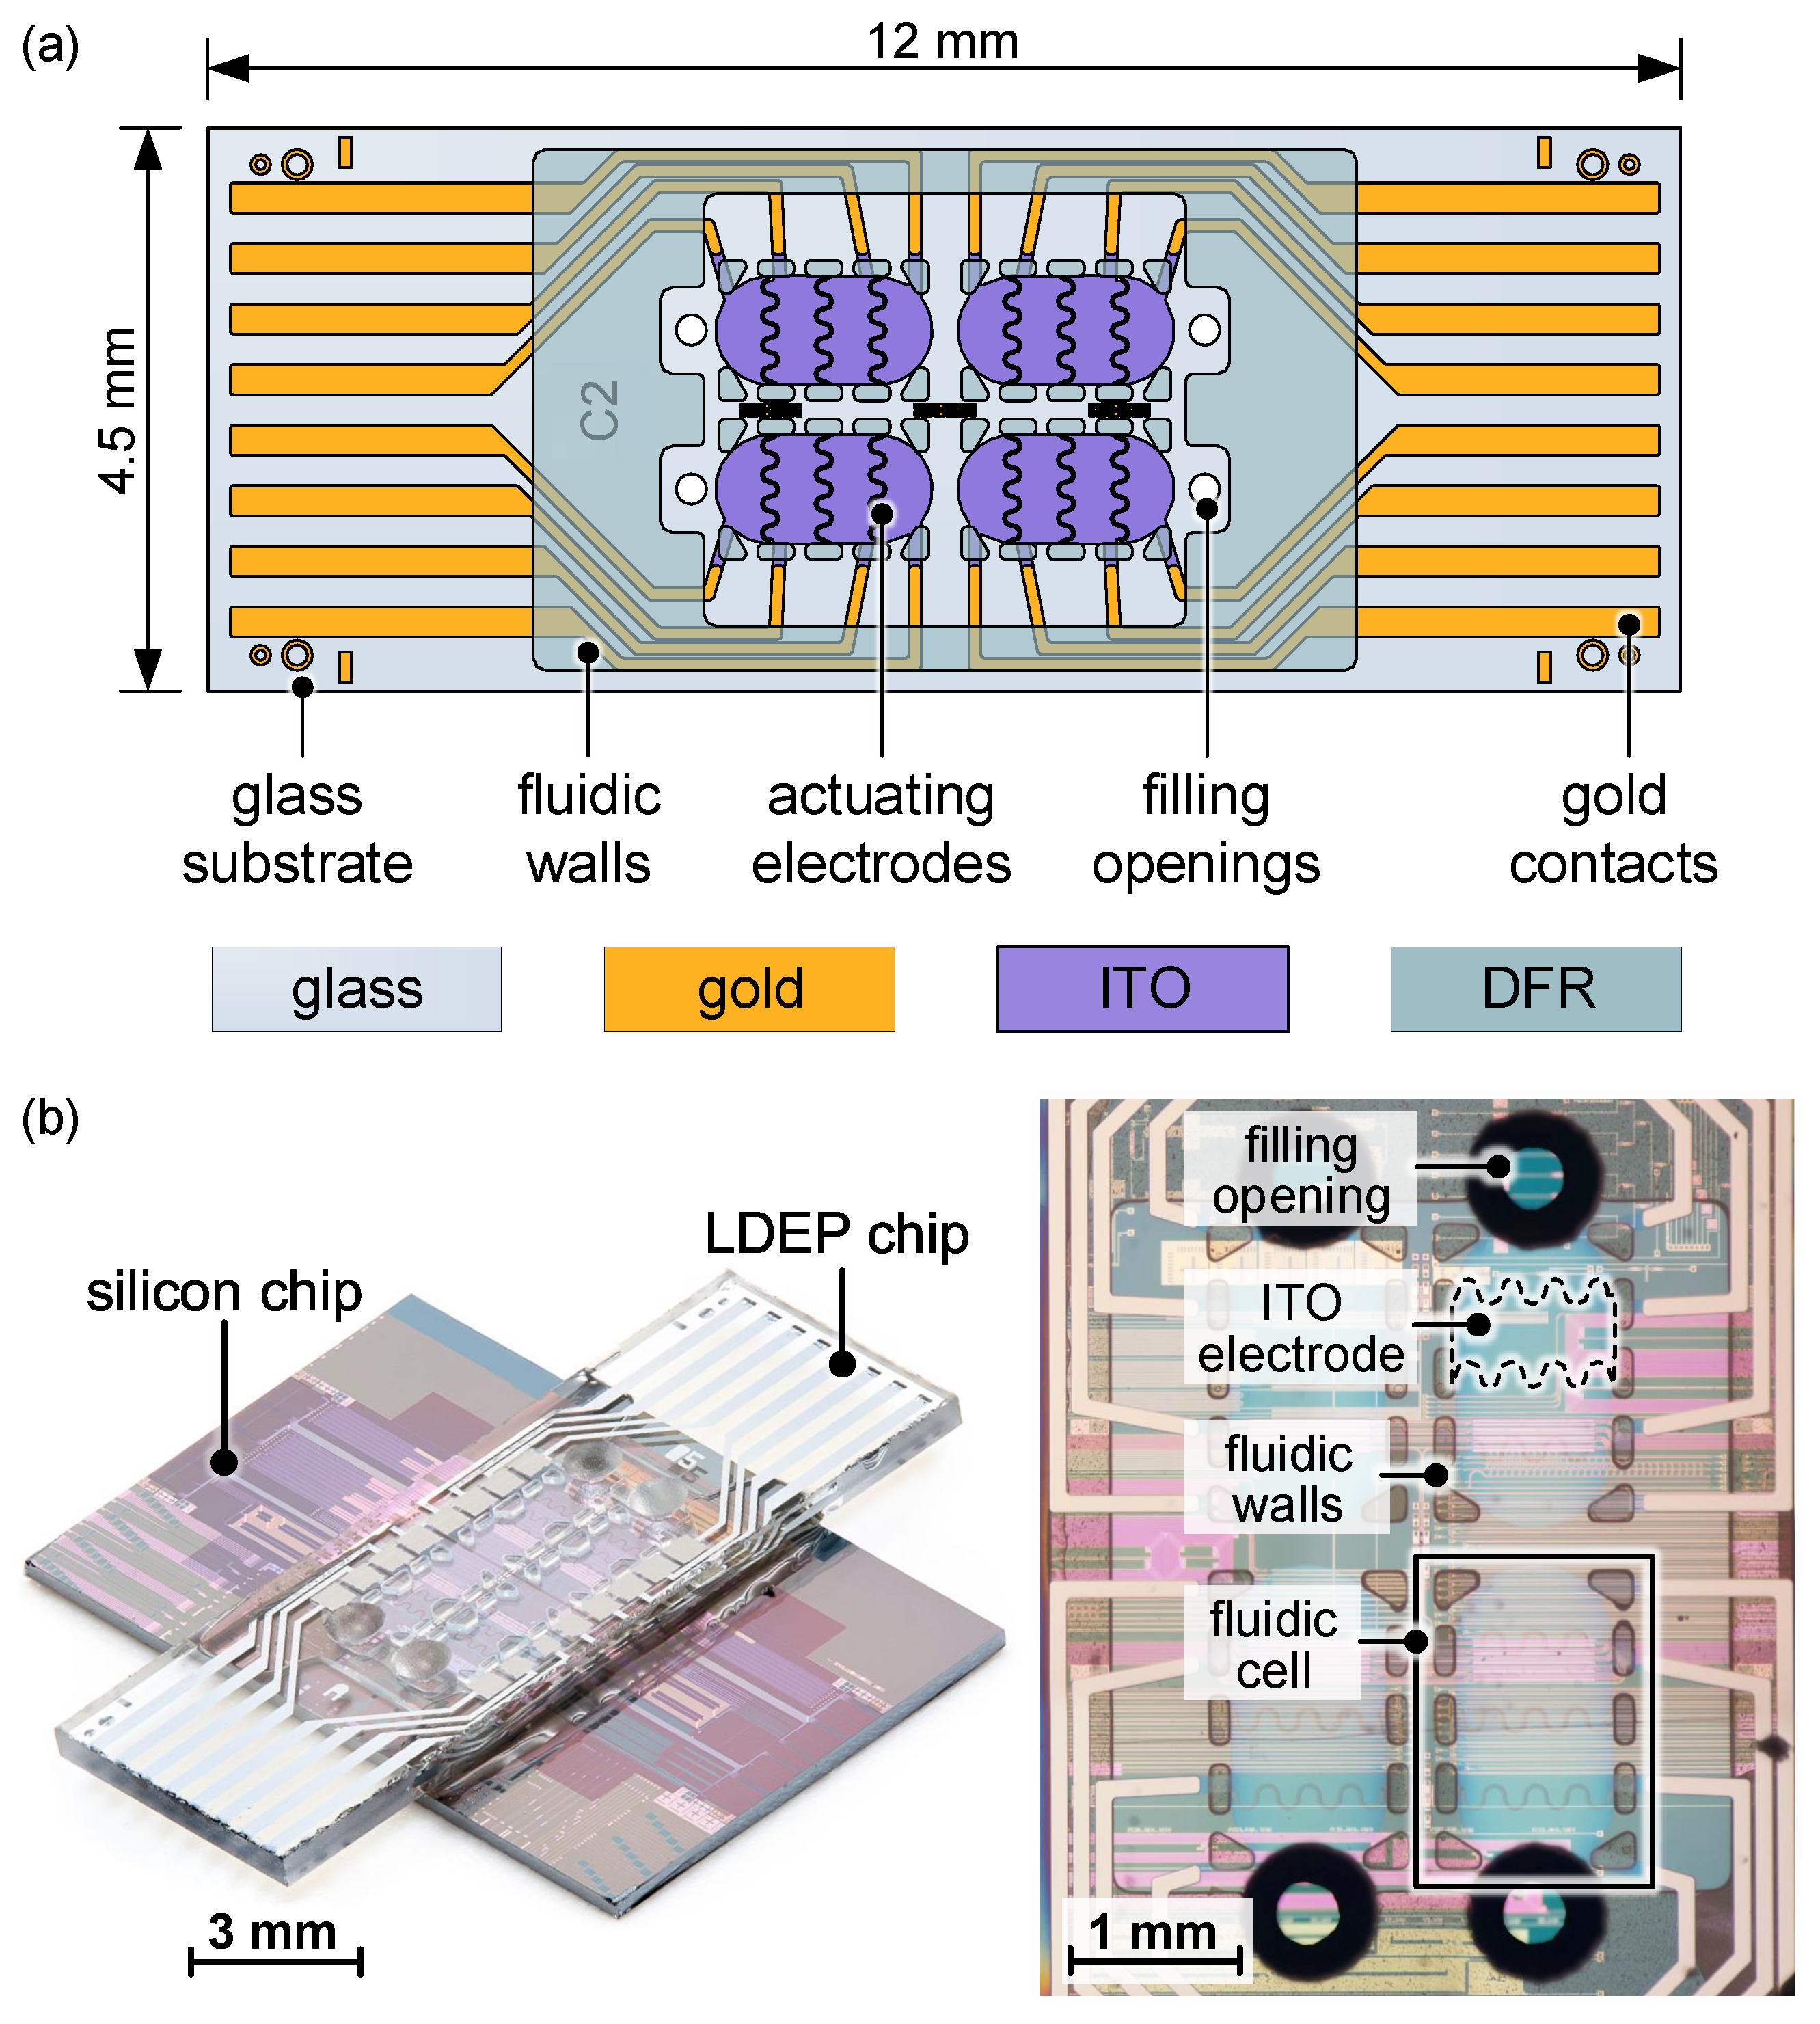
4.1. Background of the Used Device Design
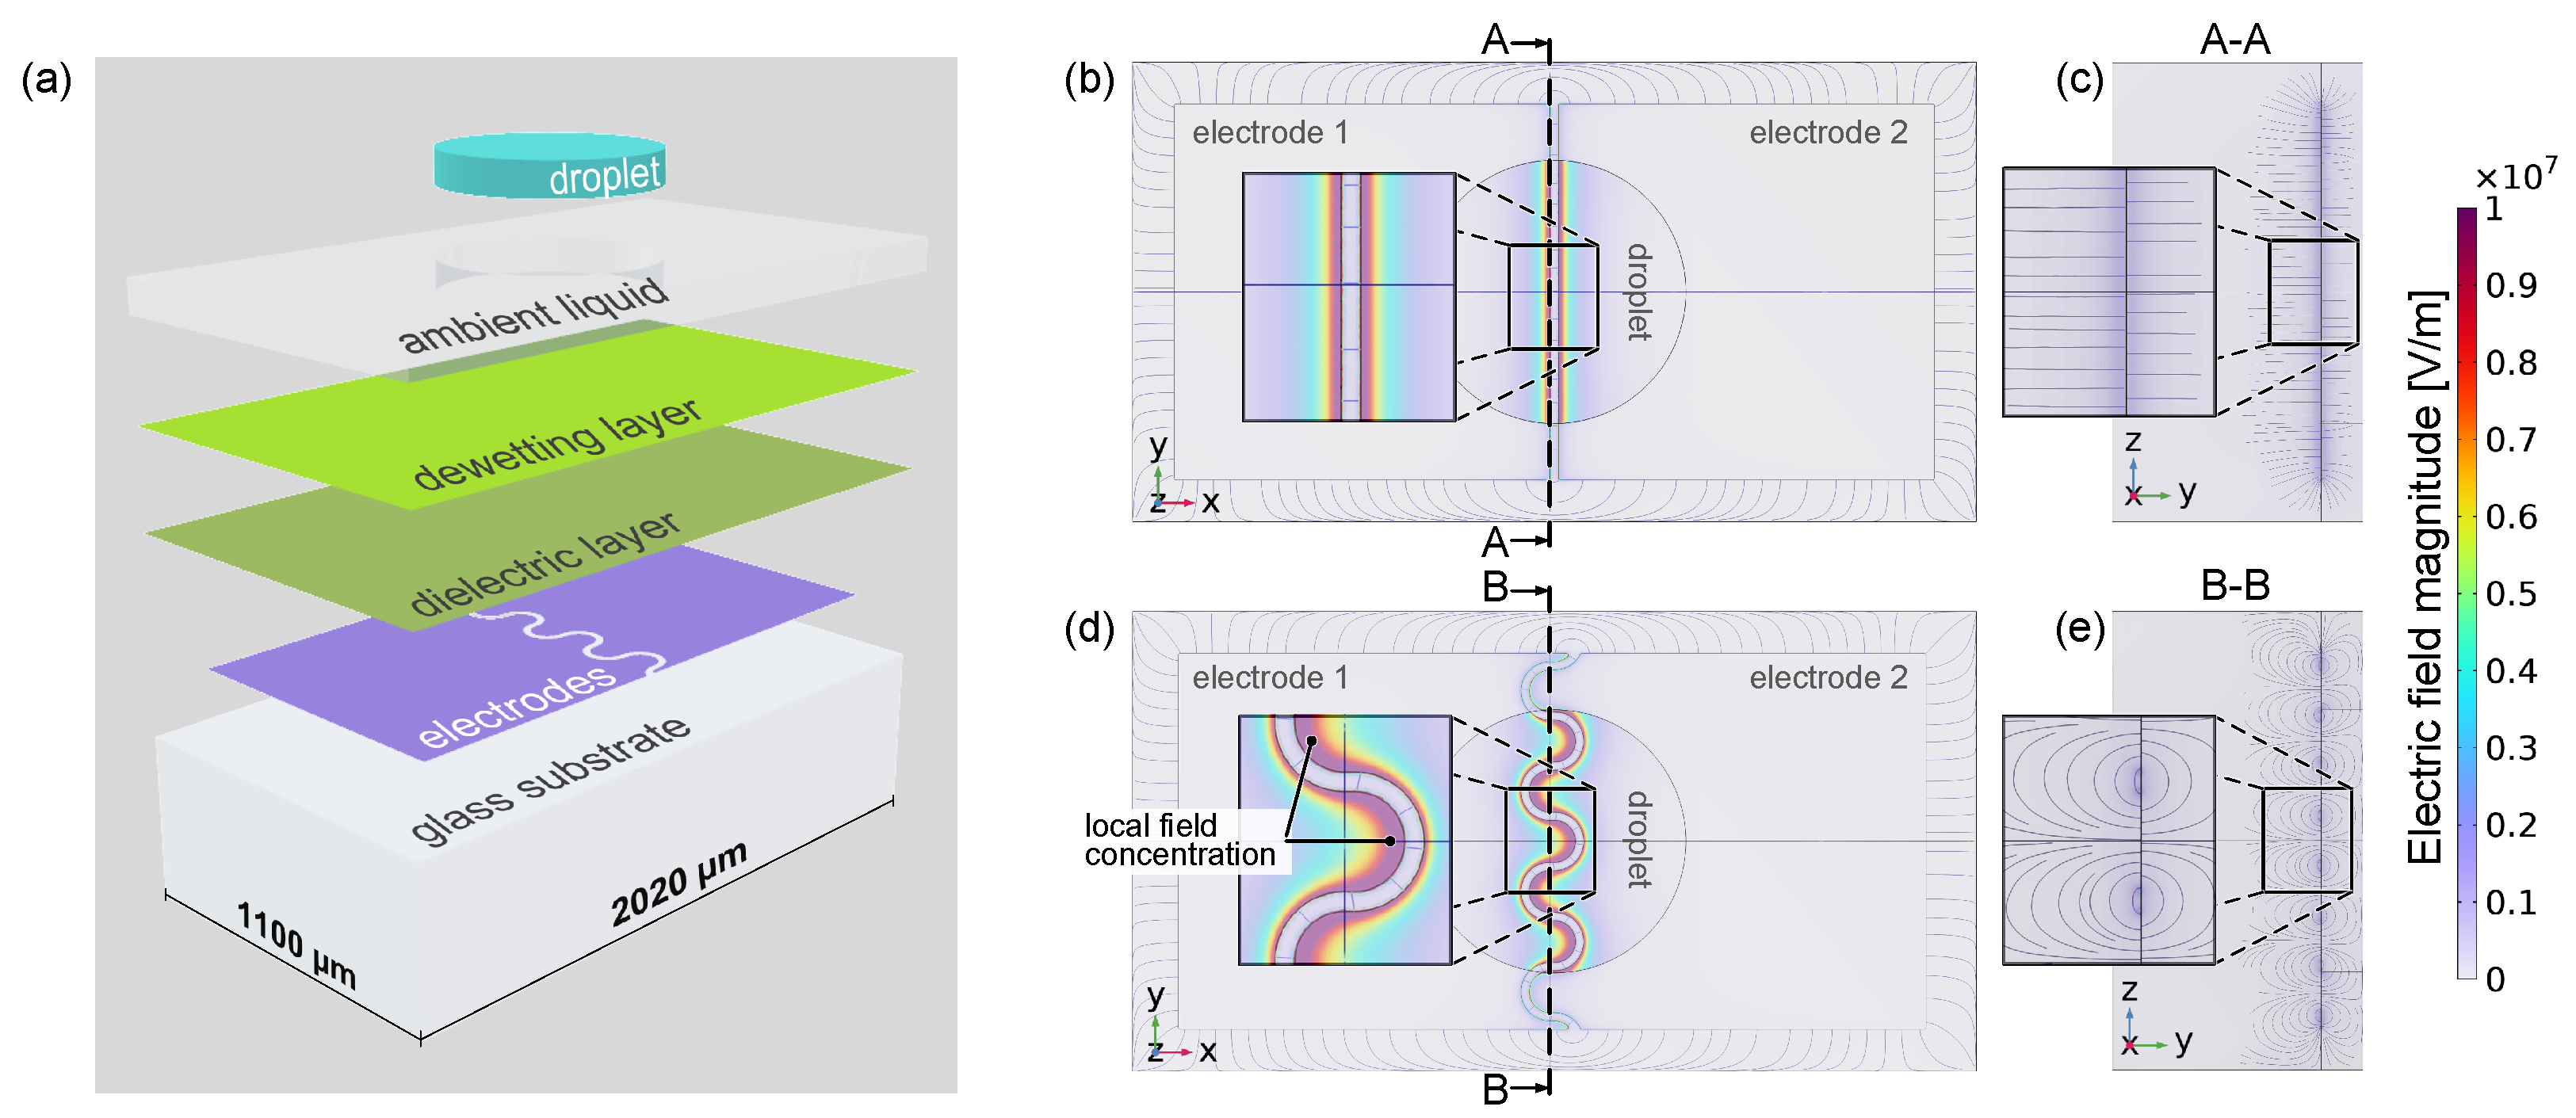
4.2. Electric Field Simulation
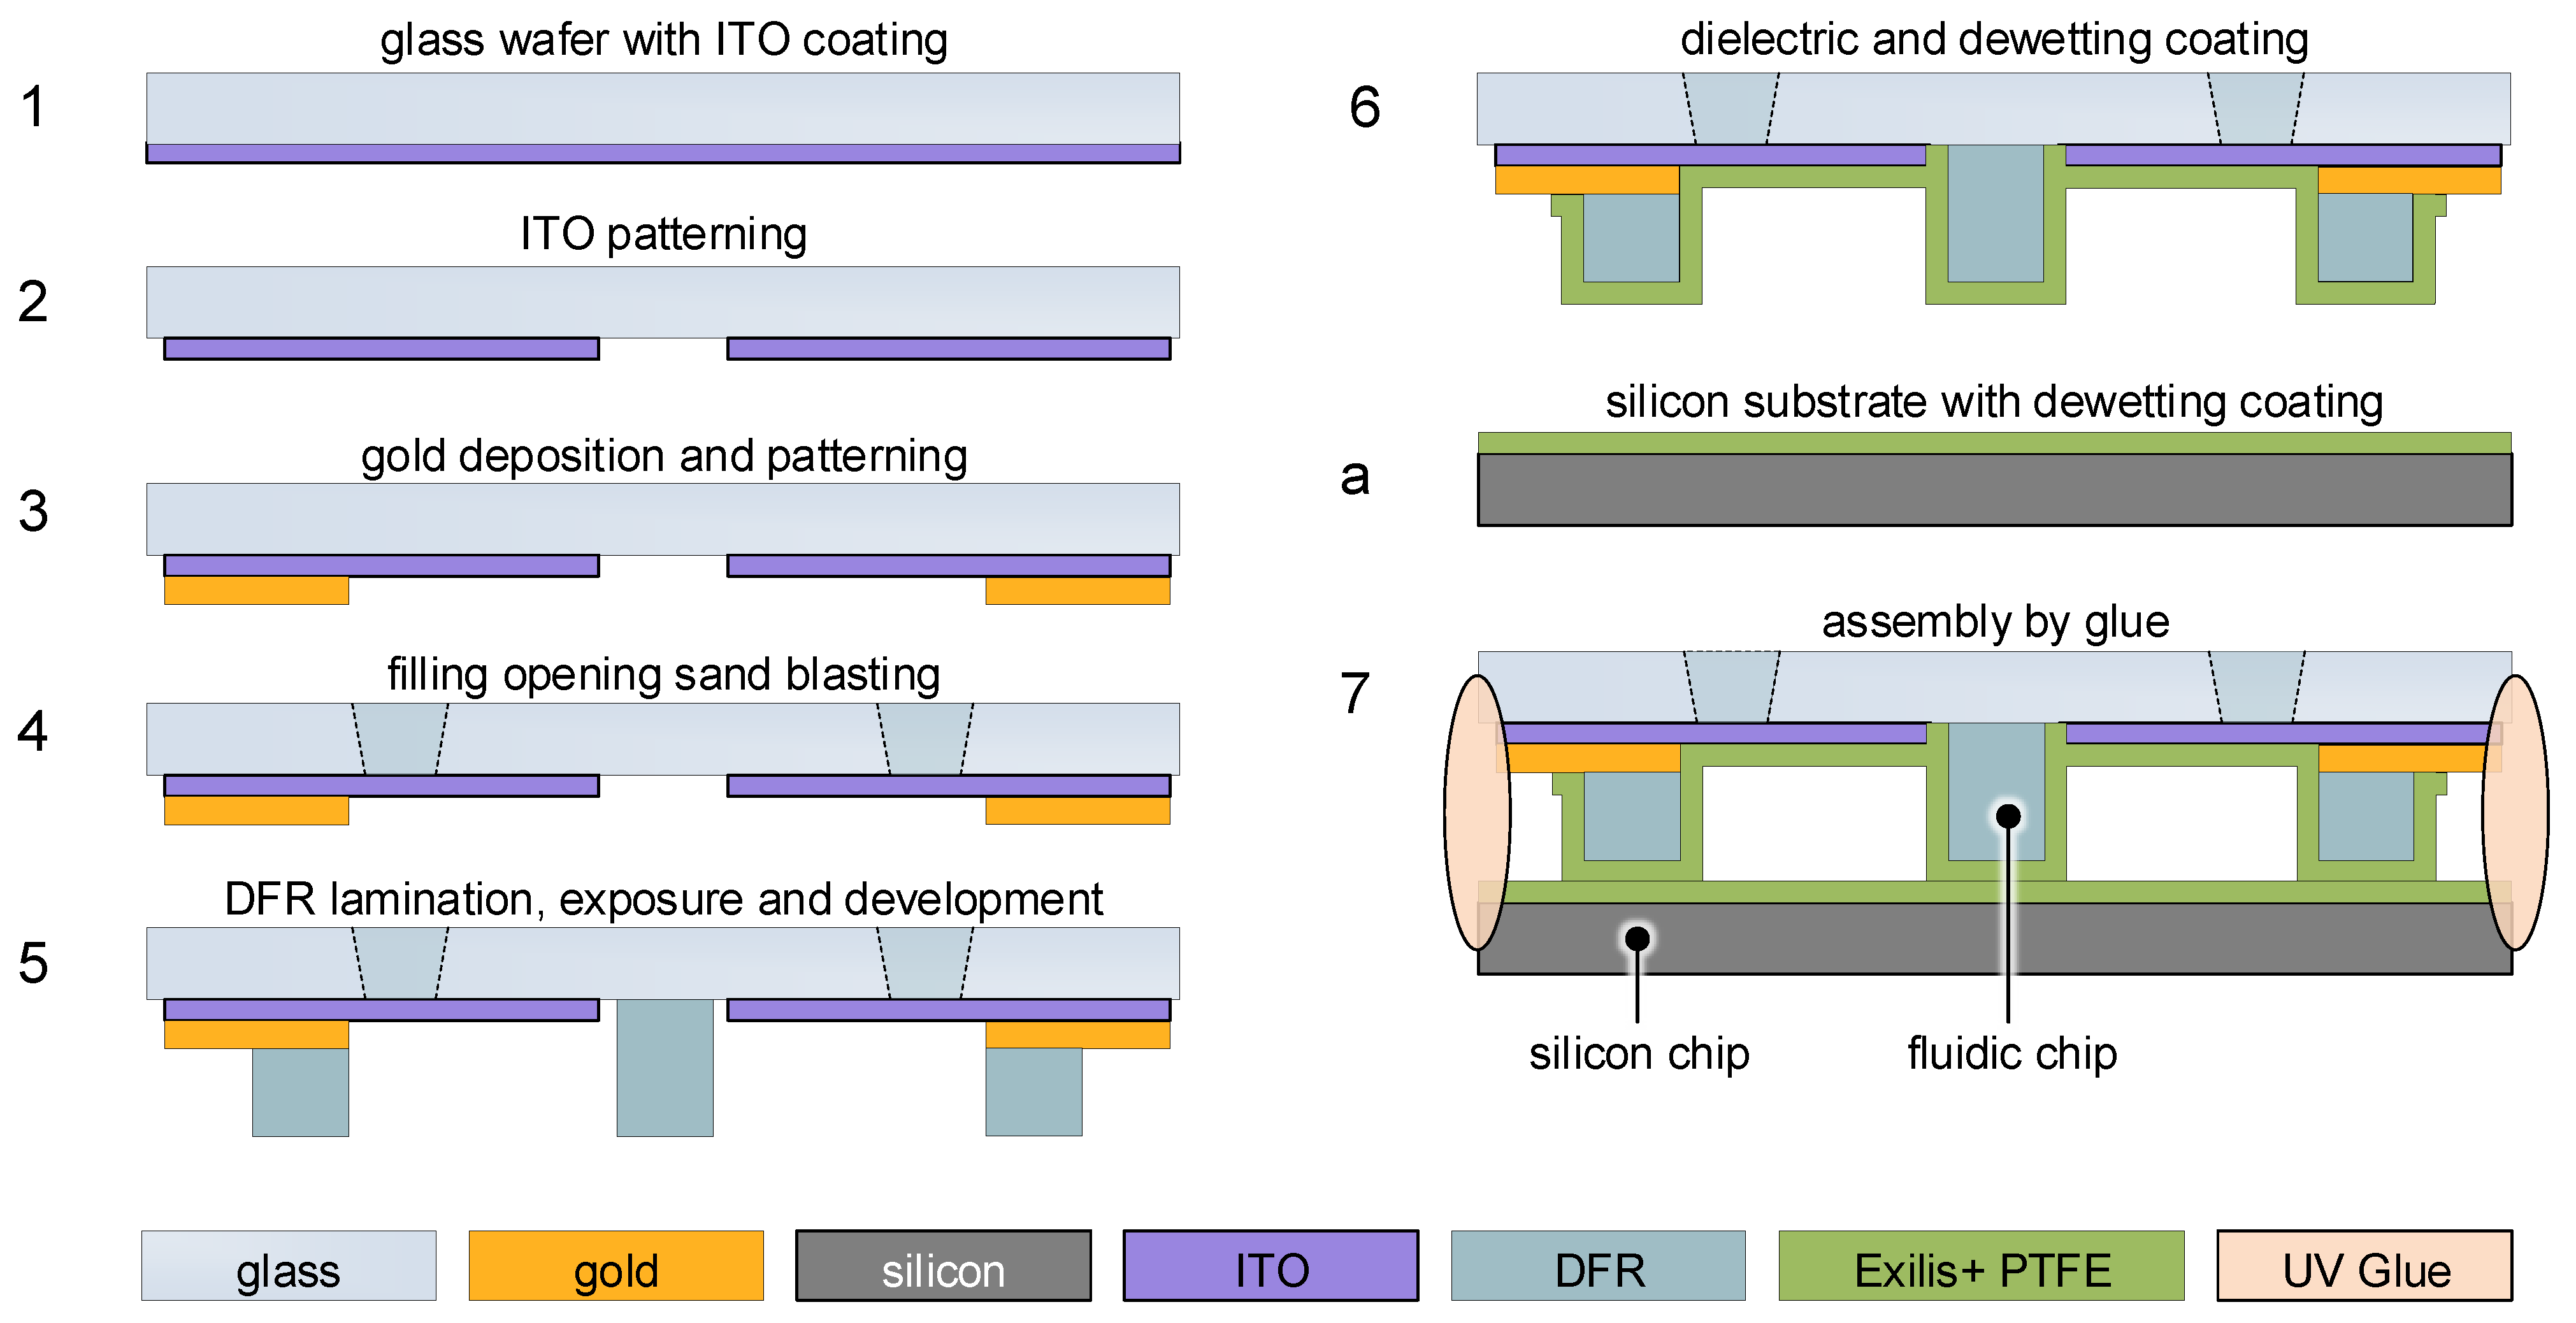
4.3. LDEP Device Fabrication
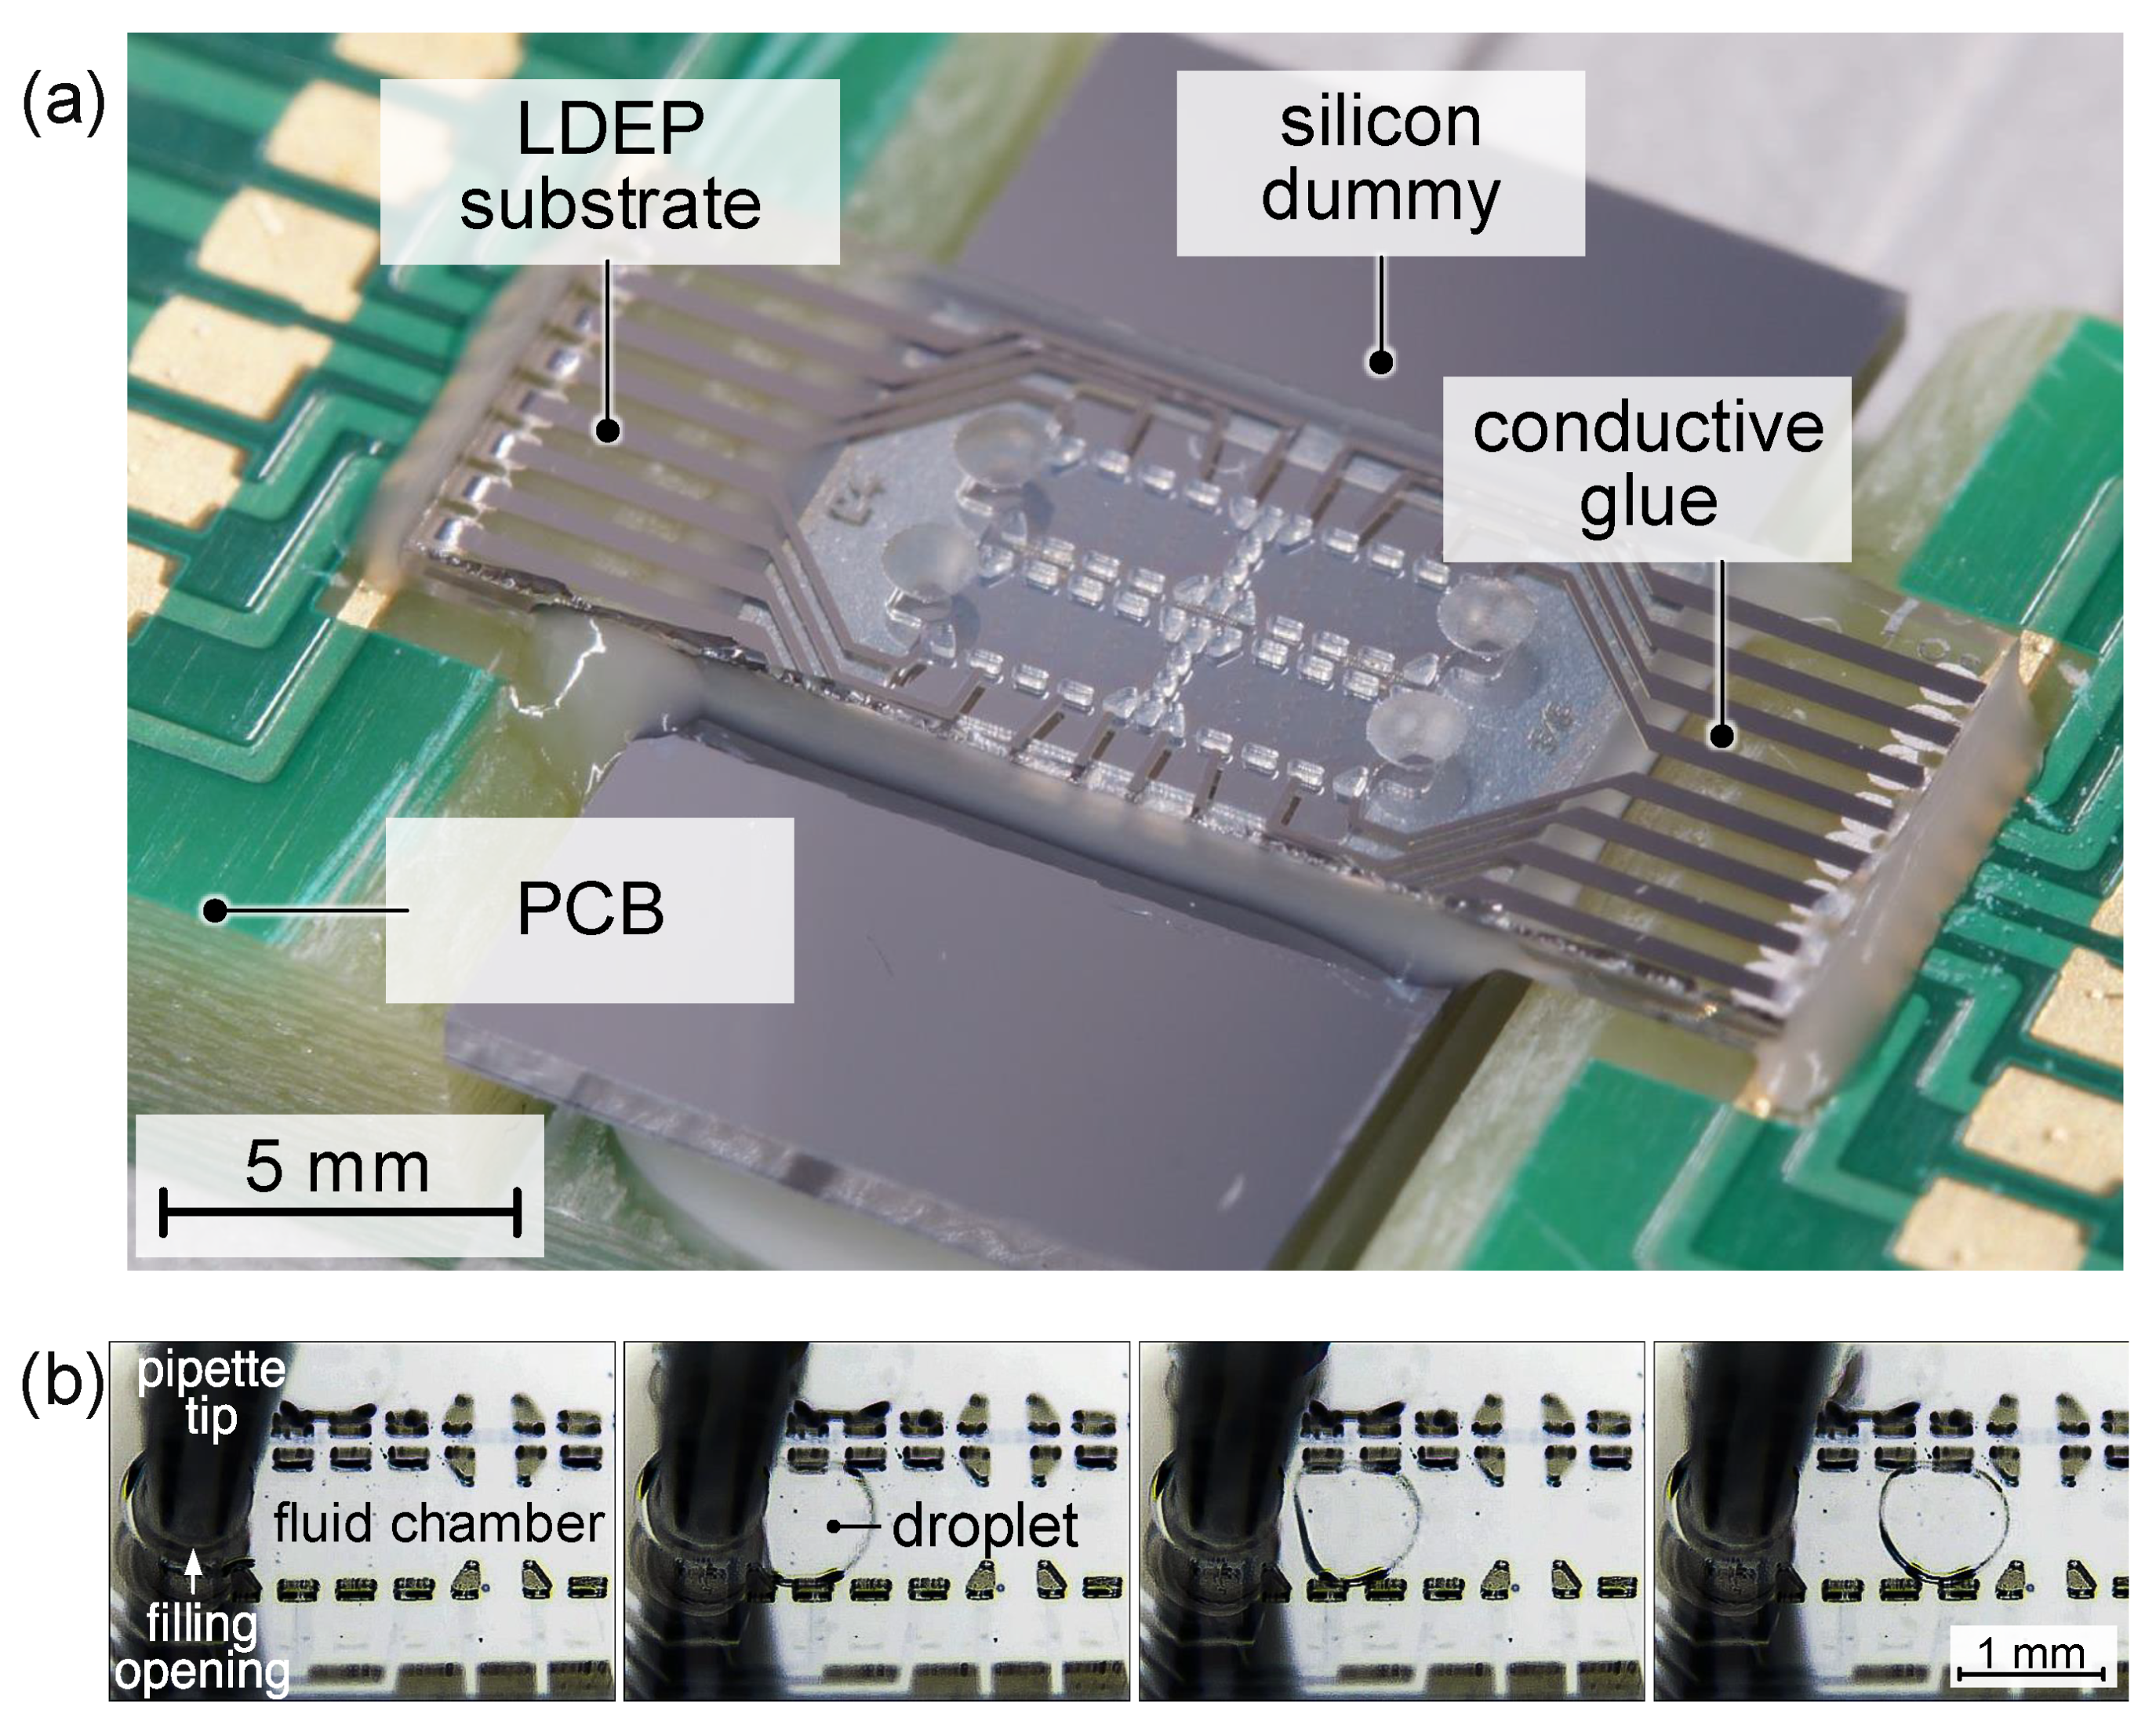
4.4. Device Assembly and Filling
4.5. Experimental Setup
4.6. Droplet Contour Vibration Model Setup
5. Conclusions
Author Contributions
Funding
Data Availability Statement
Acknowledgments
Conflicts of Interest
References
- Hayes, R.; Feenstra, B. Video-speed electronic paper based on electrowetting. Nature 2003, 425, 383–385. [Google Scholar] [CrossRef] [PubMed]
- You, H.; Steckl, A. Three-color electrowetting display device for electronic paper. Appl. Phys. Lett. 2010, 97, 023514. [Google Scholar] [CrossRef]
- Feenstra, J.; Schram, I.; Evans, M.; Vermeulen, P.; Cometti, C.; Weert, M.; Ferket, M.; Massard, R.; Mans, J.; Sakai, T. Large Size Full-Color eReader Displays Based on Electrowetting. SID Symp. Dig. Tech. Pap. 2010, 41, 480–483. [Google Scholar] [CrossRef]
- Chevalliot, S.; Heikenfeld, J.; Clapp, L.; Milarcik, A.; Vilner, S. Analysis of Nonaqueous Electrowetting Fluids for Displays. J. Disp. Technol. 2011, 7, 649–656. [Google Scholar] [CrossRef]
- Cheng, C.C.; Yeh, J.J. Dielectrically actuated liquid lens. Opt. Express 2007, 15, 7140–7145. [Google Scholar] [CrossRef]
- Ren, H.; Xu, S.; Wu, S.T. Deformable liquid droplets for optical beam control. Opt. Express 2010, 18, 11904–11910. [Google Scholar] [CrossRef]
- Ousati Ashtiani, A.; Jiang, H. Design and fabrication of an electrohydrodynamically actuated microlens with areal density modulated electrodes. J. Micromech. Microeng. 2016, 26, 015004. [Google Scholar] [CrossRef]
- Lim, W.Y.; Supekar, O.D.; Zohrabi, M.; Gopinath, J.T.; Bright, V.M. Liquid Combination with High Refractive Index Contrast and Fast Scanning Speeds for Electrowetting Adaptive Optics. Langmuir 2018, 34, 14511–14518. [Google Scholar] [CrossRef]
- Renaudot, R.; Agache, V.; Daunay, B.; Lambert, P.; Kumemura, M.; Fouillet, Y.; Collard, D.; Fujita, H. Optimization of Liquid DiElectroPhoresis (LDEP) Digital Microfluidic Transduction for Biomedical Applications. Micromachines 2011, 2, 258–273. [Google Scholar] [CrossRef]
- Gao, D.; Jin, F.; Zhou, M.; Jiang, Y. Recent advances in single cell manipulation and biochemical analysis on microfluidics. Analyst 2019, 144, 766–781. [Google Scholar] [CrossRef]
- Zhang, H.; Chang, H.; Neuzil, P. DEP-on-a-Chip: Dielectrophoresis Applied to Microfluidic Platforms. Micromachines 2019, 10, 423. [Google Scholar] [CrossRef] [PubMed]
- Jones, T.; Gunji, M.; Washizu, M.; Feldman, M. Dielectrophoretic liquid actuation and nanodroplet formation. J. Appl. Phys. 2001, 89, 1441–1448. [Google Scholar] [CrossRef]
- Jones, T. Liquid dielectrophoresis on the microscale. J. Electrost. 2001, 51, 290–299. [Google Scholar] [CrossRef]
- Frozanpoor, I.; Cooke, M.; Racz, Z.; Bossons, I.; Ambukan, V.; Wood, D.; Gallant, A.; Balocco, C. Programmable droplet actuating platform using liquid dielectrophoresis. J. Micromech. Microeng. 2021, 31, 055014. [Google Scholar] [CrossRef]
- Wang, Z.; Zhang, Y.; Gao, M.; Wang, Q.; Deng, H.; Gui, L. A Liquid-Metal-Based Dielectrophoretic Microdroplet Generator. Micromachines 2019, 10, 769. [Google Scholar] [CrossRef] [PubMed]
- Bhaumik, S.; Das, S.; Chakraborty, S.; Dasgupta, S. Droplet transport through dielectrophoretic actuation using line electrode. Microfluid. Nanofluid. 2013, 16, 597–603. [Google Scholar] [CrossRef]
- Gascoyne, P.R.C.; Vykoukal, J.V.; Schwartz, J.A.; Anderson, T.J.; Vykoukal, D.M.; Current, K.W.; McConaghy, C.; Becker, F.F.; Andrews, C. Dielectrophoresis-based programmable fluidic processors. Lab Chip 2004, 4, 299–309. [Google Scholar] [CrossRef]
- Geng, H.; Cho, S.K. Progress in Adhesion and Adhesives; John Wiley & Sons, Ltd.: Hoboken, NJ, USA, 2018. [Google Scholar] [CrossRef]
- McHale, G.; Brown, C.V.; Newton, M.I.; Wells, G.G.; Sampara, N. Dielectrowetting Driven Spreading of Droplets. Phys. Rev. Lett. 2011, 107, 186101. [Google Scholar] [CrossRef]
- Mchale, G.; Brown, C.; Newton, M.; Wells, G.; Sampara, N. Developing interface localized liquid dielectrophoresis for optical applications. In Proceedings of the Optical Design and Testing V, Beijing, China, 5–7 November 2012; Wang, Y., Du, C., Hua, H., Tatsuno, K., Urbach, H.P., Eds.; International Society for Optics and Photonics, SPIE: Philadelphia, PA, USA, 2012; Volume 8557, p. 855703. [Google Scholar] [CrossRef]
- Brown, C.; Mchale, G.; Trabi, C. Dielectrophoresis-Driven Spreading of Immersed Liquid Droplets. Langmuir 2015, 31, 1011–1016. [Google Scholar] [CrossRef]
- Edwards, A.; Brown, C.; Newton, M.; McHale, G. Dielectrowetting: The past, present and future. Curr. Opin. Colloid Interface Sci. 2018, 36, 28–36. [Google Scholar] [CrossRef]
- Chen, C.H.; Tsai, S.L.; Chen, M.K.; Jang, L.S. Effects of gap height, applied frequency, and fluid conductivity on minimum actuation voltage of electrowetting-on-dielectric and liquid dielectrophoresis. Sens. Actuators B Chem. 2011, 159, 321–327. [Google Scholar] [CrossRef]
- Chae, J.B.; Lee, S.J.; Yang, J.; Chung, S.K. 3D electrowetting-on-dielectric actuation. Sens. Actuators A Phys. 2015, 234, 331–338. [Google Scholar] [CrossRef]
- Wu, J.; Fang, H.; Zhang, J.; Yan, S. Modular microfluidics for life sciences. J. Nanobiotechnol. 2023, 21, 85. [Google Scholar] [CrossRef] [PubMed]
- D’heer, H.; Arce, C.L.; Vandewiele, S.; Watté, J.; Huybrechts, K.; Baets, R.; Thourhout, D.V. Nonvolatile Liquid Controlled Adiabatic Silicon Photonics Switch. J. Light. Technol. 2017, 35, 2948–2954. [Google Scholar] [CrossRef]
- Azizy, R.; Otto, H.; König, J.; Schreier, D.; Weigel, C.; Cierpka, C.; Strehle, S. A microfluidic magnetohydrodynamic pump based on a thermally bonded composite of glass and dry film photoresist. Micro Nano Eng. 2023, 18, 100173. [Google Scholar] [CrossRef]
- Roos, M.; Winkler, A.; Nilsen, M.; Menzel, S.; Strehle, S. Towards Green 3D-Microfabrication of Bio-MEMS Devices Using ADEX Dry Film Photoresists. Int. J. Precis. Eng. Manuf.-Green Technol. 2021, 9. [Google Scholar] [CrossRef]
- Günther, S.; Si, S.; D’heer, H.; Thourhout, D.; Hoffmann, M. FDTS as Dewetting Coating for an Electrowetting Controlled Silicon Photonic Switch. IEEE Photonics Technol. Lett. 2018, 30, 2005–2008. [Google Scholar] [CrossRef]
- Günther, S.; Endrody, C.; Si, S.; Weinberger, S.; Claes, R.; Justo, Y.; D’heer, H.; Neft, A.; Hoffmann, M. EWOD system designed for optical switching. In Proceedings of the 2017 IEEE 30th International Conference on Micro Electro Mechanical Systems (MEMS), Las Vegas, NV, USA, 22–26 January 2017; pp. 1329–1332. [Google Scholar] [CrossRef]
- Young, P.; Mohseni, K. Force Characterization of Dielectrophoresis in Droplet Transport. Ann. N. Y. Acad. Sci. 2009, 1161, 463–471. [Google Scholar] [CrossRef]
- Geng, H.; Feng, J.; Stabryla, L.; Cho, S.K. Dielectrowetting Manipulation for Digital Microfluidics: Creating, Transporting, Splitting, and Merging of Droplets. Lab Chip 2017, 17, 1060–1068. [Google Scholar] [CrossRef]
- Cho, S.K.; Moon, H.; Kim, C.-J. Creating, transporting, cutting, and merging liquid droplets by electrowetting-based actuation for digital microfluidic circuits. J. Microelectromech. Syst. 2003, 12, 70–80. [Google Scholar] [CrossRef]
- Thomas, D.; Audry, M.C.; Thibaut, R.M.; Kleimann, P.; Chassagneux, F.; Maillard, M.; Brioude, A. Charge injection in dielectric films during electrowetting actuation under direct current voltage. Thin Solid Film. 2015, 590, 224–229. [Google Scholar] [CrossRef]
- Li, F.; Mugele, F. How to make sticky surfaces slippery: Contact angle hysteresis in electrowetting with alternating voltage. Appl. Phys. Lett. 2008, 92, 244108. [Google Scholar] [CrossRef]
- Cooney, C.; Chen, C.Y.; Emerling, M.; Nadim, A.; Sterling, J. Electrowetting droplet microfluidics on a single planar surface. Microfluid. Nanofluid. 2006, 2, 435–446. [Google Scholar] [CrossRef]
- Frigo, M.; Johnson, S. FFTW: An adaptive software architecture for the FFT. In Proceedings of the 1998 IEEE International Conference on Acoustics, Speech and Signal Processing, Seattle, WA, USA, 15 May 1998; Volume 3, pp. 1381–1384. [Google Scholar] [CrossRef]
- Günther, S.; Gropp, S.; Hoffmann, M.; D’heer, H.; van Thourhout, D.; Neft, A.; Bartels, F.; Gradkowski, K.; Carroll, L.; O’Brien, P.; et al. Electrowetting Controlled Non-Volatile Integrated Optical Switch. In Proceedings of the 2018 European Conference on Optical Communication (ECOC), Rome, Italy, 23–27 September 2018. [Google Scholar] [CrossRef]
- D’heer, H.; Arce, C.L.; Watté, J.; Huybrechts, K.; Baets, R.; Thourhout, D.V. Broadband and Non-volatile Liquid Controlled Silicon Photonics Switch. In Proceedings of the Conference on Lasers and Electro-Optics, Optical Society of America, San Jose, CA, USA, 5–10 June 2016. [Google Scholar] [CrossRef]
- D’heer, H.; Saurav, K.; Xie, W.; Arce, C.L.; Watté, J.; Thourhout, D.V. Vertical liquid controlled adiabatic waveguide coupler. Opt. Express 2018, 26, 19877–19884. [Google Scholar] [CrossRef] [PubMed]
- D’heer, H.; Saurav, K.; Arce, C.L.; Tuccio, S.; Clemmen, S.; Lenci, S.; Stassen, A.; Watté, J.; Thourhout, D.V. Broadband and Temperature Tolerant Silicon Nitride Liquid Controlled Waveguide Coupler. J. Light. Technol. 2019, 37, 2311–2316. [Google Scholar] [CrossRef]
- Barman, J.; Shao, W.; Tang, B.; Yuan, D.; Groenewold, J.; Zhou, G. Wettability Manipulation by Interface-Localized Liquid Dielectrophoresis: Fundamentals and Applications. Micromachines 2019, 10, 329. [Google Scholar] [CrossRef] [PubMed]
- Fan, S.K.; Hsieh, T.H.; Lin, D.Y. General digital microfluidic platform manipulating dielectric and conductive droplets by dielectrophoresis and electrowetting. Lab Chip 2009, 9, 1236–1242. [Google Scholar] [CrossRef] [PubMed]
- Yi, U.C.; Kim, C.J. Characterization of electrowetting actuation on addressable single-side coplanar electrodes. J. Micromech. Microeng. 2006, 16, 2053–2059. [Google Scholar] [CrossRef]
- Frozanpoor, I.; Cooke, M.D.; Ambukan, V.; Gallant, A.J.; Balocco, C. Continuous Droplet-Actuating Platforms via an Electric Field Gradient: Electrowetting and Liquid Dielectrophoresis. Langmuir 2021, 37, 6414–6422. [Google Scholar] [CrossRef]
- Park, J.; Ha, J.; Choi, K.; Bae, J.; Kim, H.Y. Critical AC frequency for stable operation of electrowetting-driven optofluidic devices with polymeric electrolyte solutions. J. Mech. Sci. Technol. 2019, 33, 1793–1797. [Google Scholar] [CrossRef]
- Li, Y.J.; Cahill, B. Frequency Dependence of Low-Voltage Electrowetting Investigated by Impedance Spectroscopy. Langmuir 2017, 33, 13139–13147. [Google Scholar] [CrossRef] [PubMed]
- Jones, T.; Wang, K.; Yao, D.J. Frequency-Dependent Electromechanics of Aqueous Liquids: Electrowetting and Dielectrophoresis. Langmuir ACS J. Surf. Colloids 2004, 20, 2813–2818. [Google Scholar] [CrossRef] [PubMed]
- Jones, T.B.; Fowler, J.D.; Chang, Y.S.; Kim, C.J. Frequency-Based Relationship of Electrowetting and Dielectrophoretic Liquid Microactuation. Langmuir 2003, 19, 7646–7651. [Google Scholar] [CrossRef]


| Property | Ethylene Glycol (EG) | Glycerol Carbonate (GC) | Diphenyl Sulfide (DS) |
|---|---|---|---|
| CAS no. | 107-21-1 | 931-40-8 | 139-66-2 |
| Linear formula | C12H10S | C2H6O2 | C4H6O4 |
| Relative permittivity | 5.4 | 37.7 | 109.7 |
| Surface tension () | 41.8 | 48.2 | 57 |
| Density (g/cm3) | 1.11 | 1.19–1.23 | 1.11 |
| Dynamic viscosity () (25) | 4.2 | 17.4 | 85.4 |
| Droplet | Size (m) | (s) | (s) | |
|---|---|---|---|---|
| Ethylene | 1615 | 5.9 | 1.1 | 5.3 |
| glycol | 630 | 2.0 | 0.7 | 2.8 |
| Glycerol | 1575 | 1.3 | 0.5 | 2.5 |
| carbonate | 630 | 0.7 | 0.4 | 1.9 |
| Geometric Area | Material | Relative Permittivity | Thickness |
|---|---|---|---|
| Bottom glass | Eagle XG® | 5.27 | 500 |
| Dielectric layer | Exilis | 2.6 | 300 |
| Dewetting layer | PTFE | 2.1 | 50 |
| Droplet | Ethylene glycol | 37.7 | 100 |
| Ambient liquid | Diphenyl sulfide | 5.4 | 100 |
| Name | Value | Description | Comment |
|---|---|---|---|
| 50–1600 | Excitation frequency | ||
| V | Applied voltage, RMS | ||
| H | 102 | Height of the fluid channel | Determined with laser scanning microscope Olympus LEXT 4100 |
| 630 | Droplet diameter | ||
| Interfacial tension between GC and DS | Determined with KrüssDrop Shape Analysis DSA10 contact angle measuring device | ||
| Interfacial tension between EG and DS | |||
| 130 | Initial contact angle | ||
| 300 | Thickness of the Exilis dielectric layer | ||
| Relative permittivity of the Exilis dielectric layer | Value provided by manufacturer (GVD) | ||
| 50 | Thickness of the PTFE layer | ||
| Relative permittivity of the PTFE dielectric layer | Value provided by manufacturer (GVD) | ||
| Total capacity of Exilis and PTFE per unit area | |||
| Relative permittivity of glycerol carbonate | See Table 1 | ||
| Relative permittivity of ethylene glycol | See Table 1 | ||
| Relative permittivity of diphenyl sulfide | See Table 1 |
Disclaimer/Publisher’s Note: The statements, opinions and data contained in all publications are solely those of the individual author(s) and contributor(s) and not of MDPI and/or the editor(s). MDPI and/or the editor(s) disclaim responsibility for any injury to people or property resulting from any ideas, methods, instructions or products referred to in the content. |
© 2024 by the authors. Licensee MDPI, Basel, Switzerland. This article is an open access article distributed under the terms and conditions of the Creative Commons Attribution (CC BY) license (https://creativecommons.org/licenses/by/4.0/).
Share and Cite
Günther-Müller, S.; Azizy, R.; Strehle, S. Droplet Motion Driven by Liquid Dielectrophoresis in the Low-Frequency Range. Micromachines 2024, 15, 151. https://doi.org/10.3390/mi15010151
Günther-Müller S, Azizy R, Strehle S. Droplet Motion Driven by Liquid Dielectrophoresis in the Low-Frequency Range. Micromachines. 2024; 15(1):151. https://doi.org/10.3390/mi15010151
Chicago/Turabian StyleGünther-Müller, Sarah, Raschid Azizy, and Steffen Strehle. 2024. "Droplet Motion Driven by Liquid Dielectrophoresis in the Low-Frequency Range" Micromachines 15, no. 1: 151. https://doi.org/10.3390/mi15010151