
High-Sensitivity Piezoelectric MEMS Accelerometer for Vector Hydrophones

 ,
,  ,
,
Abstract
:1. Introduction
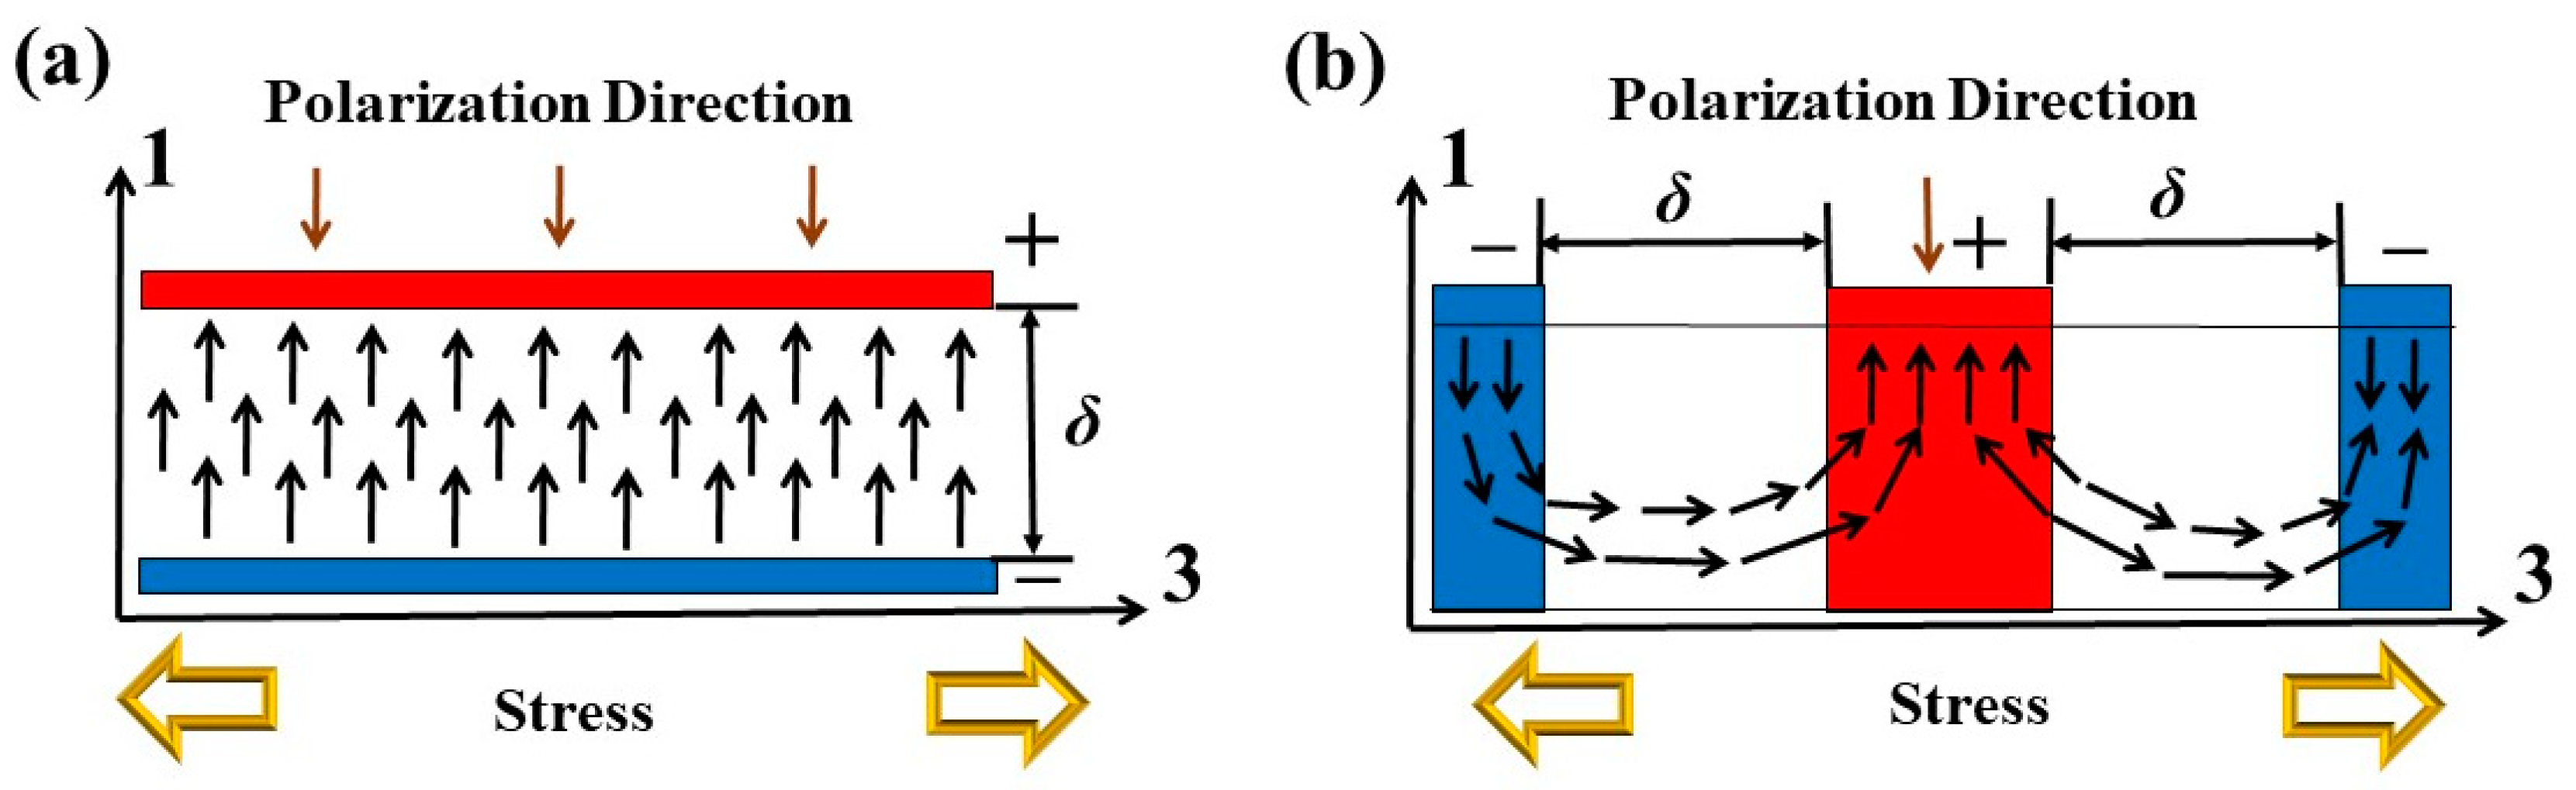
2. Theoretical
3. Design and Simulation
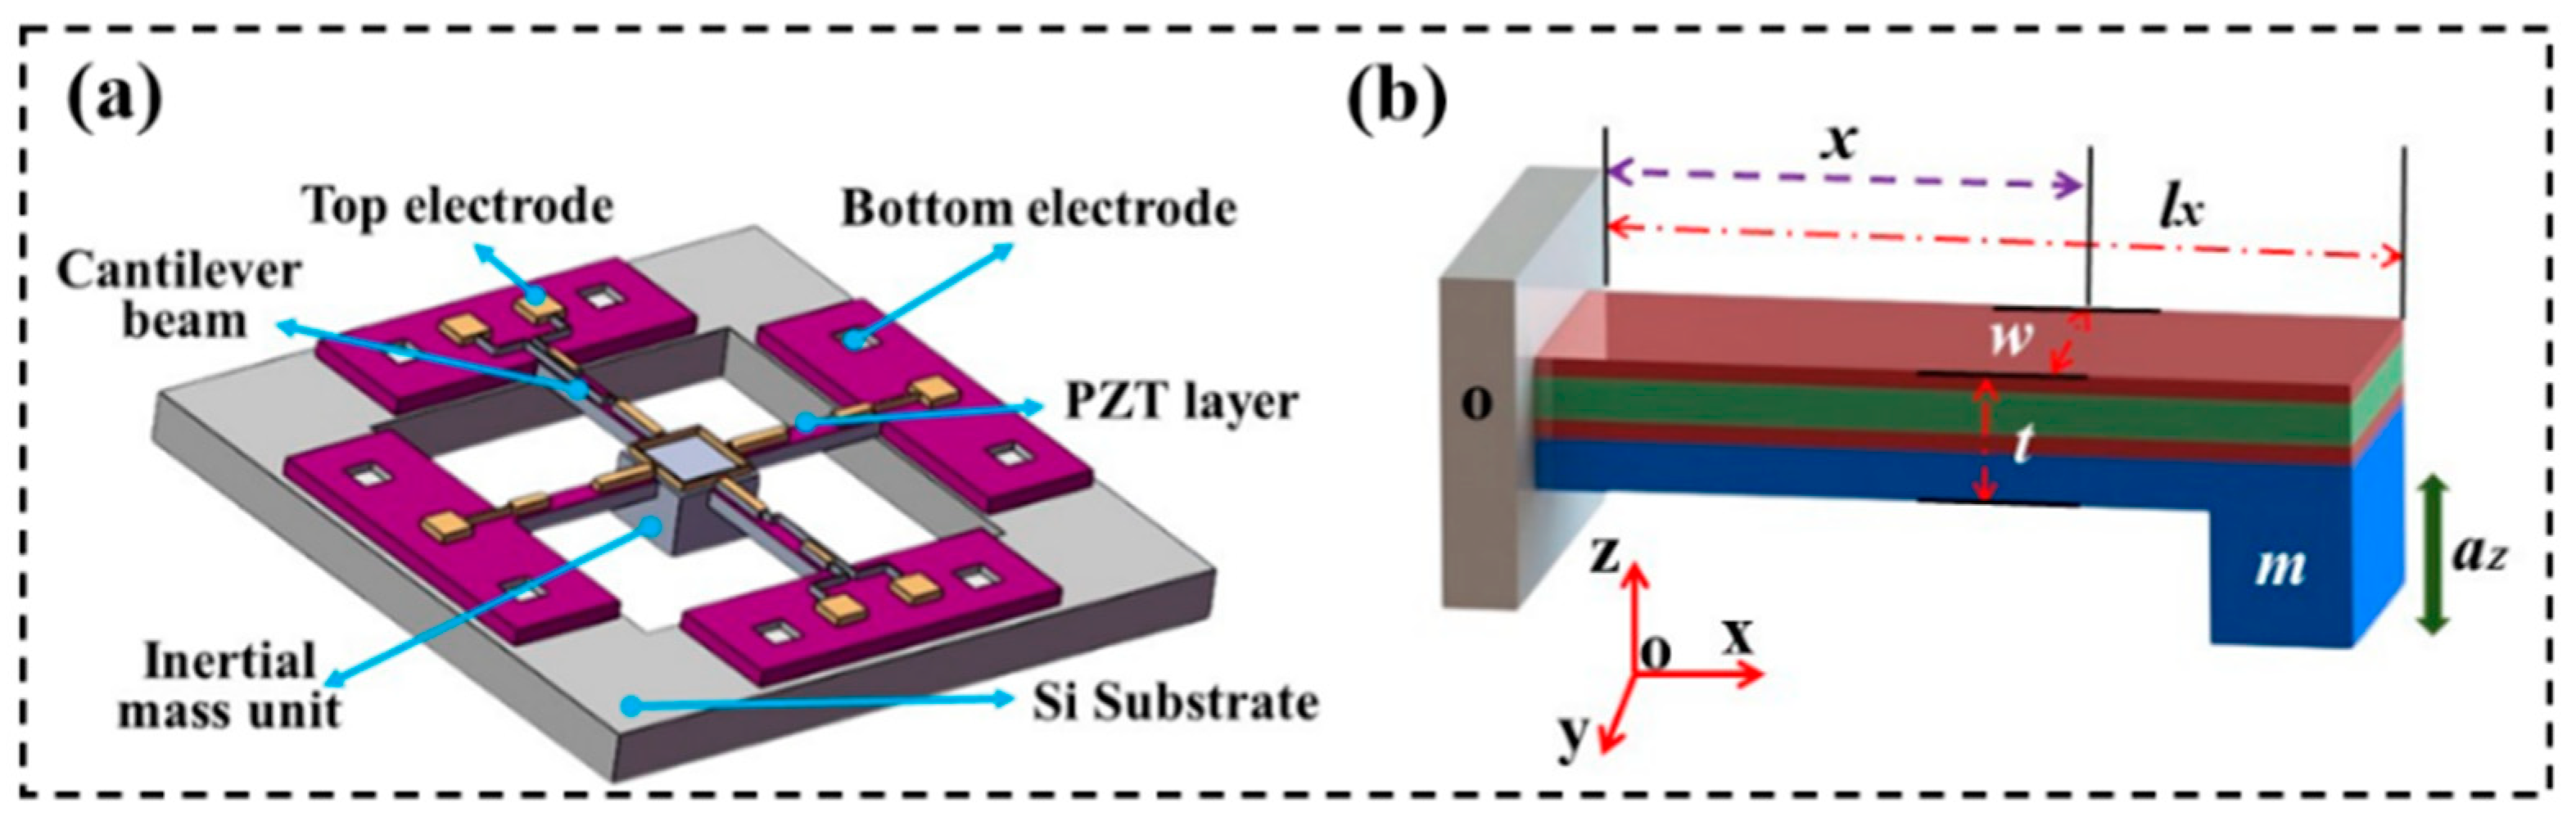
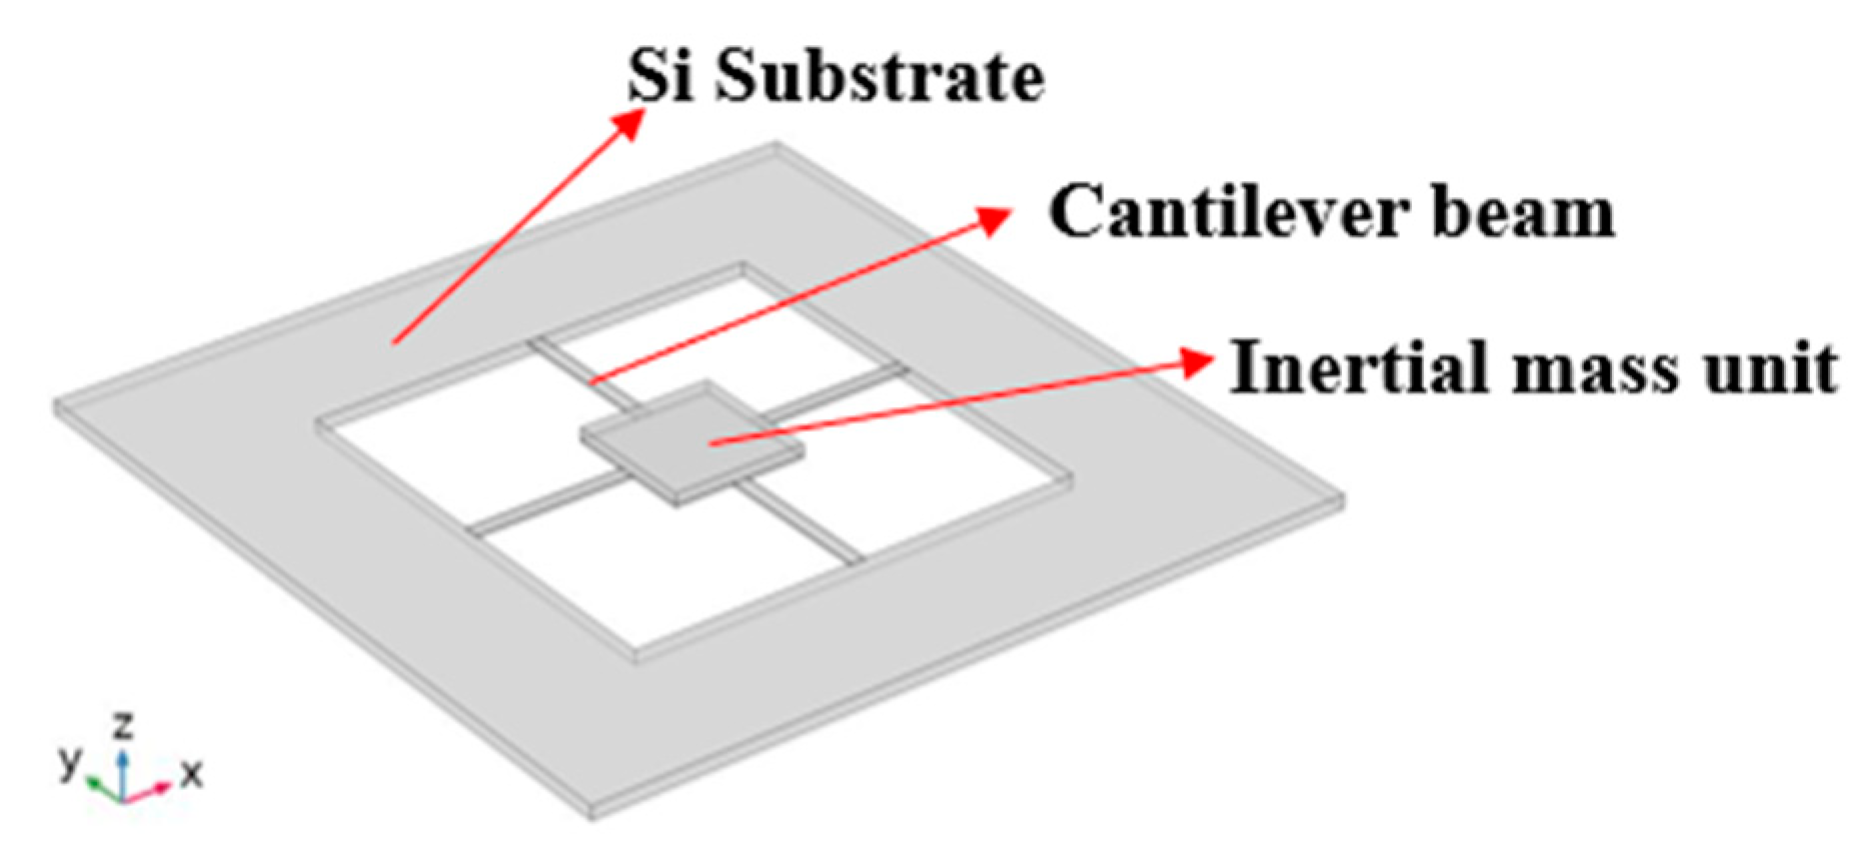
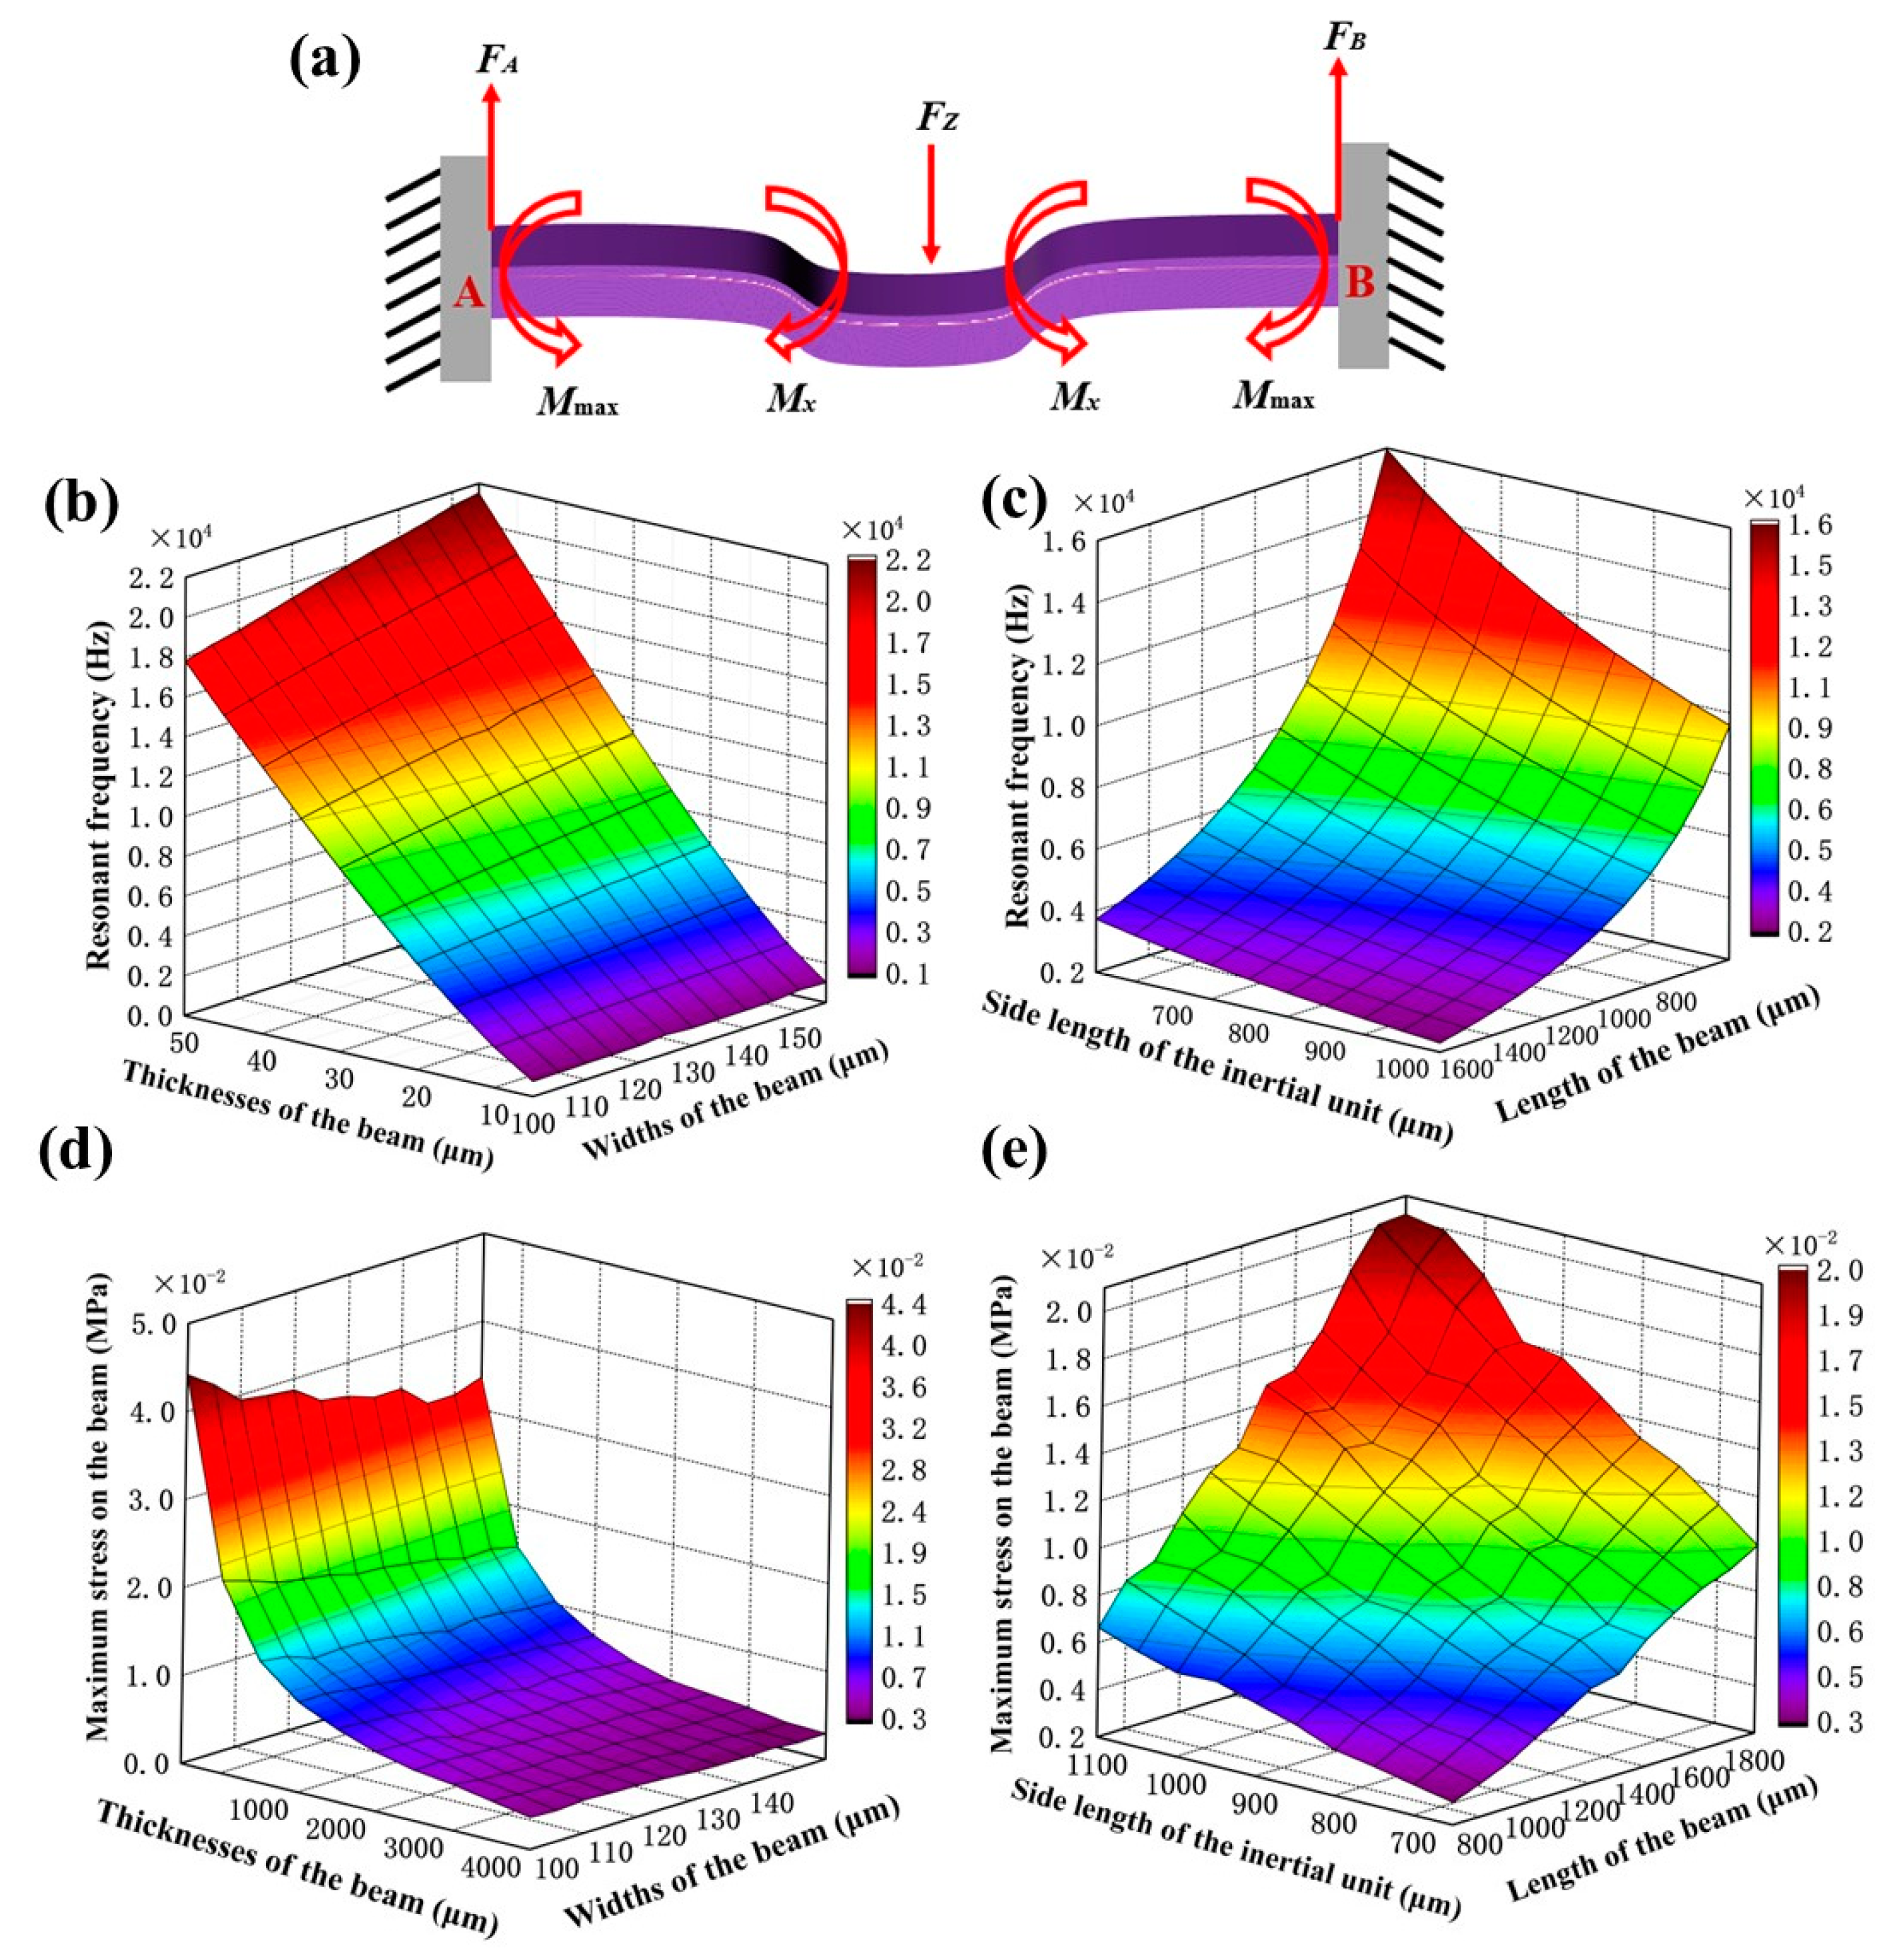
3.1. Design of the Sensor Microstructure
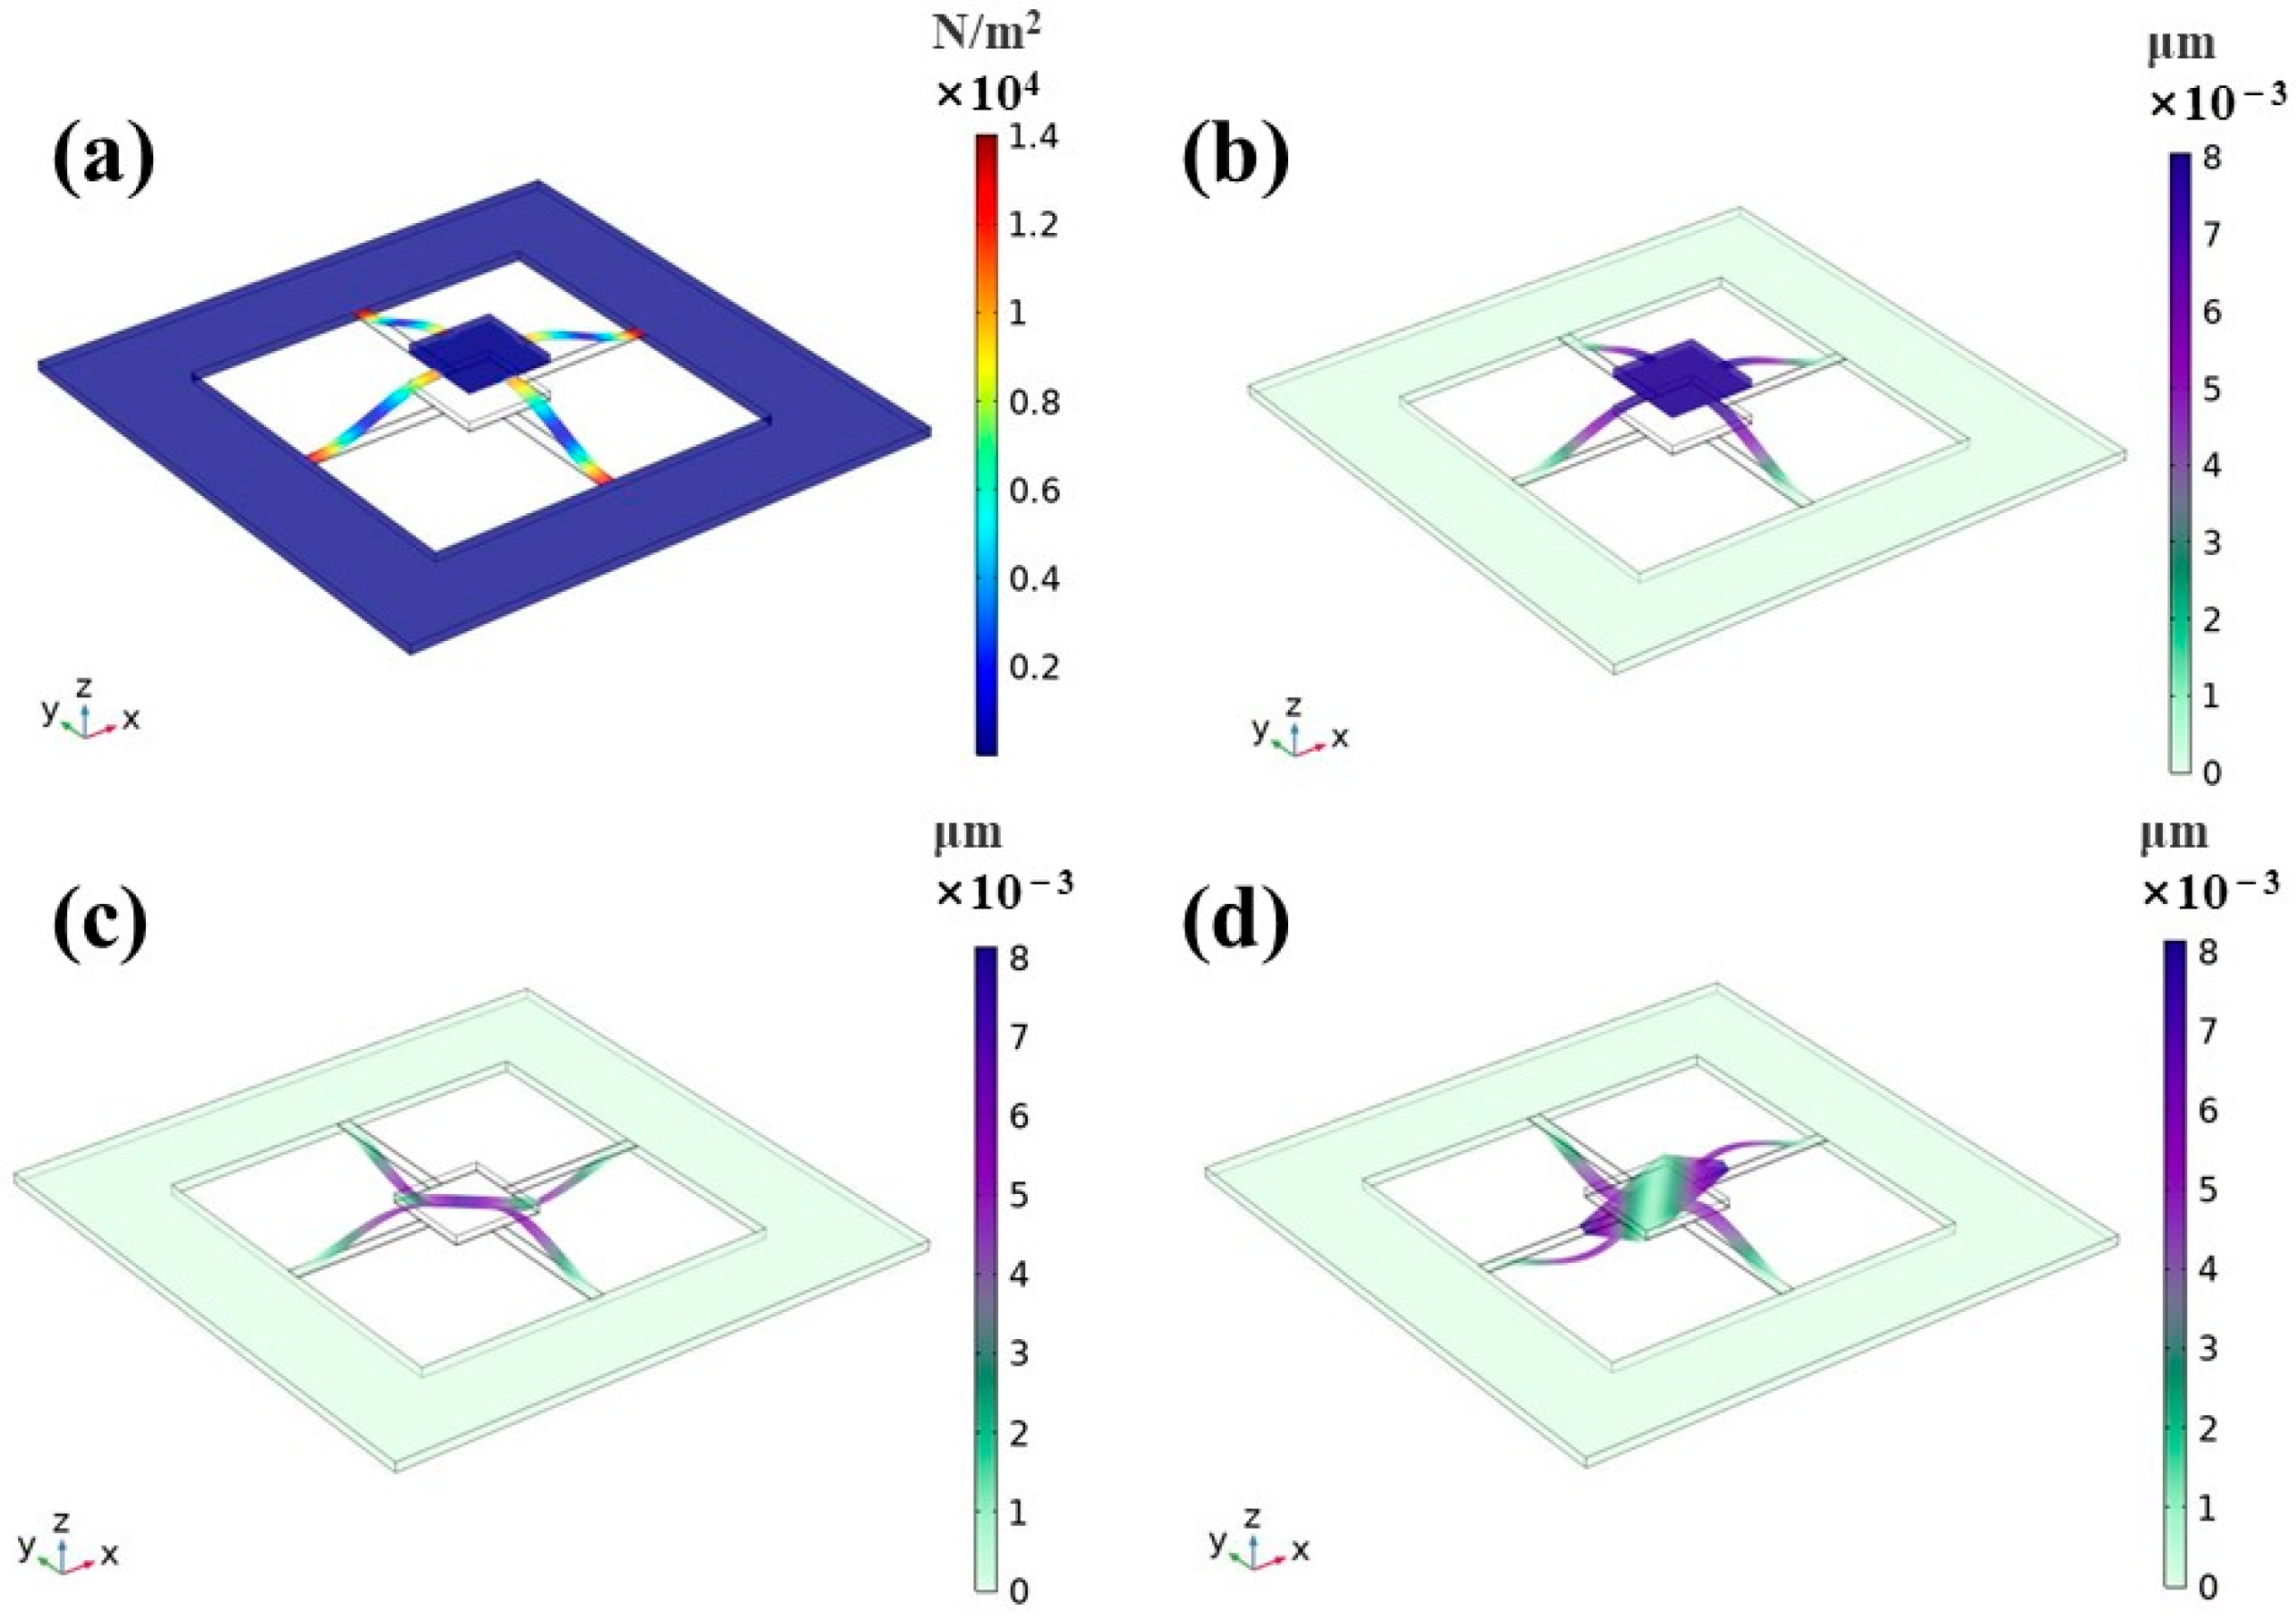
3.2. Simulation
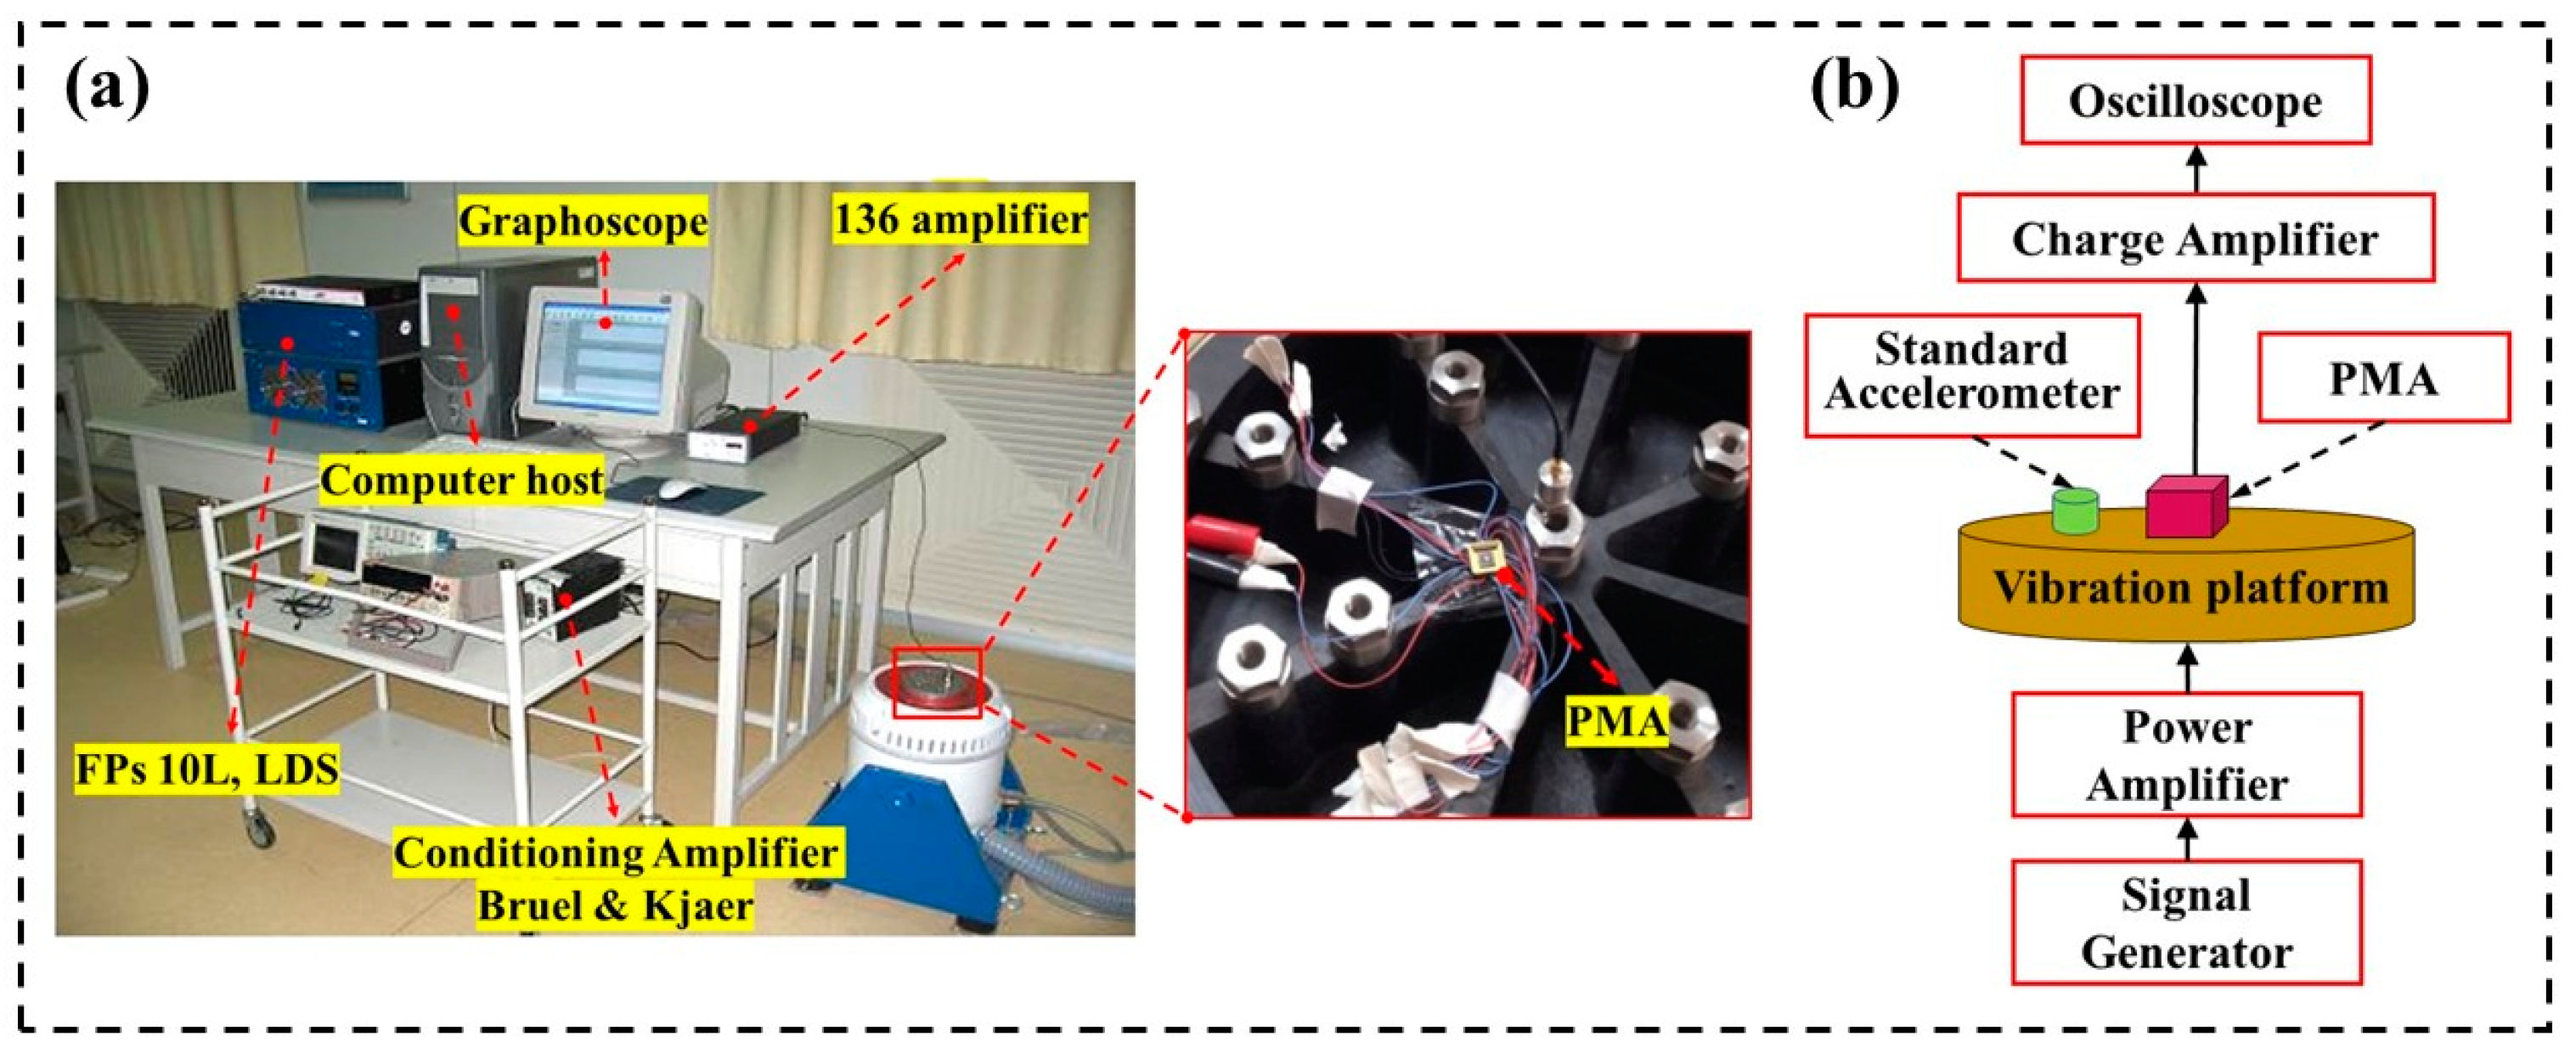
4. Fabrication and Testing
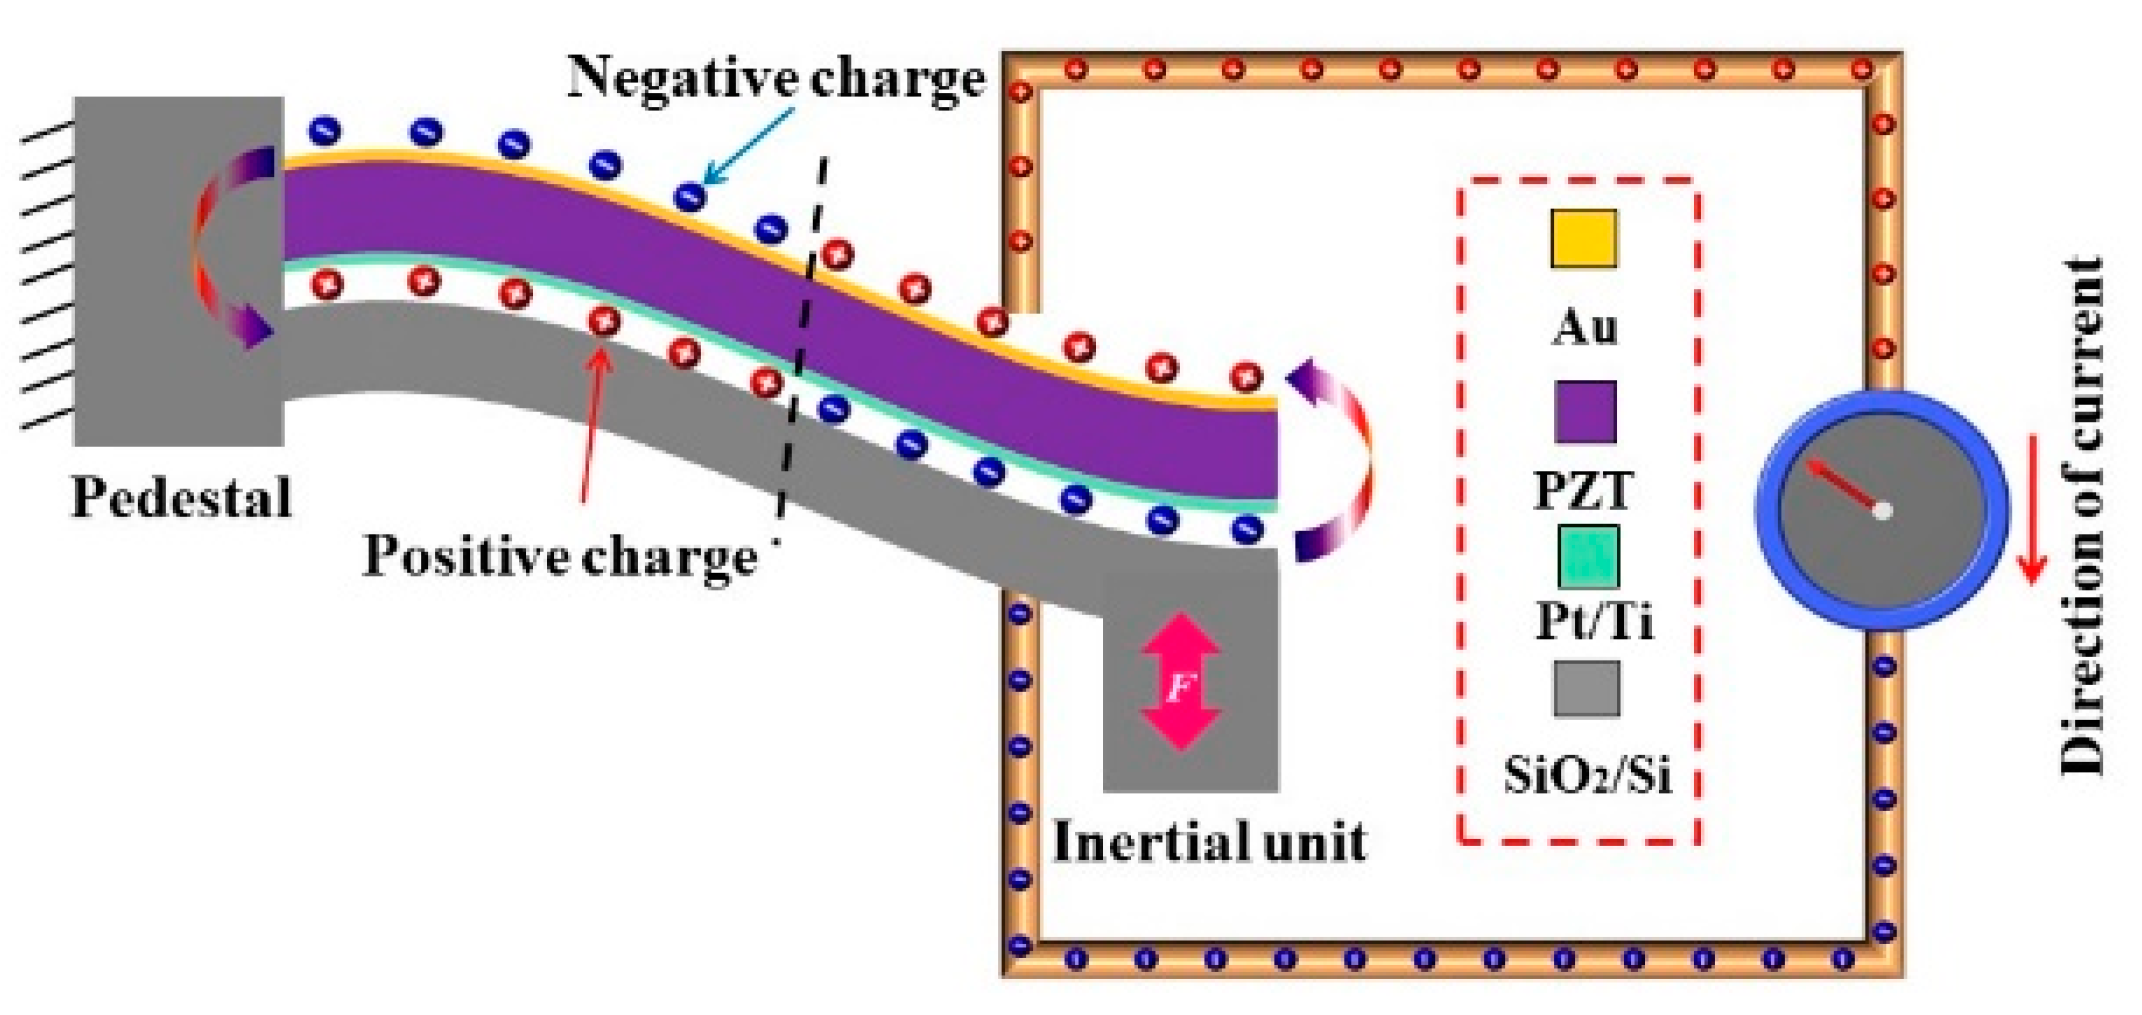
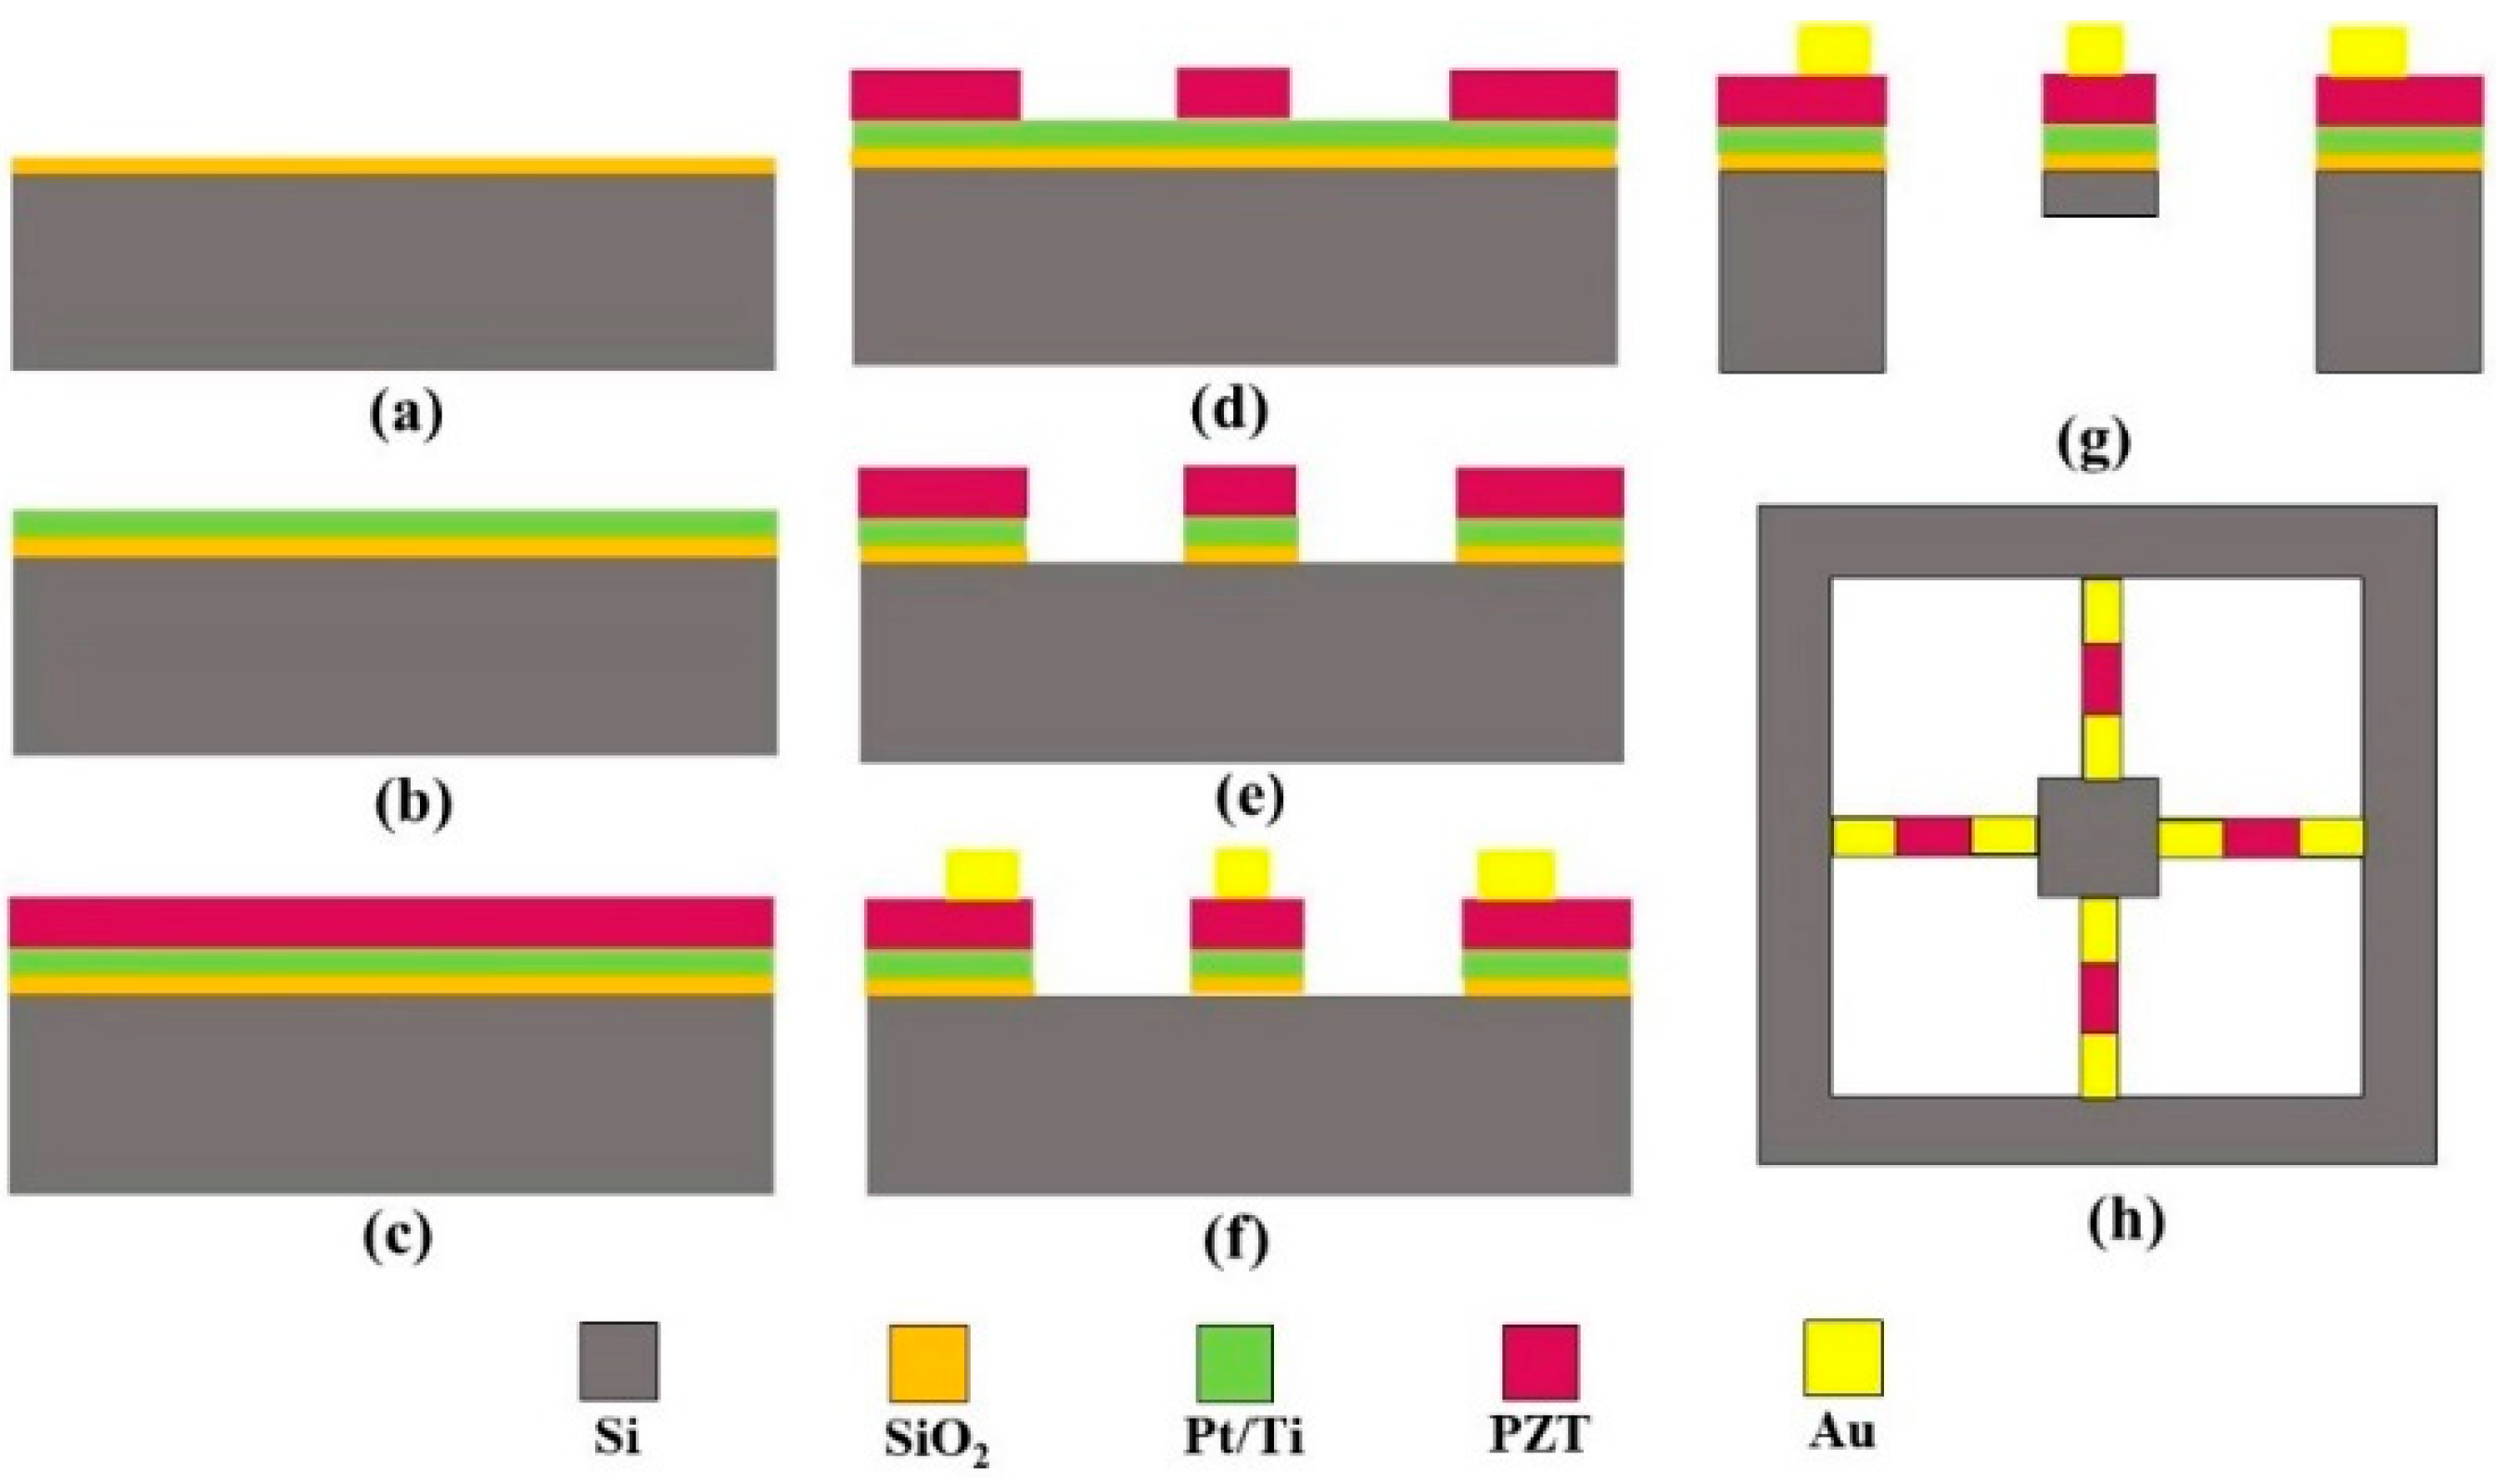
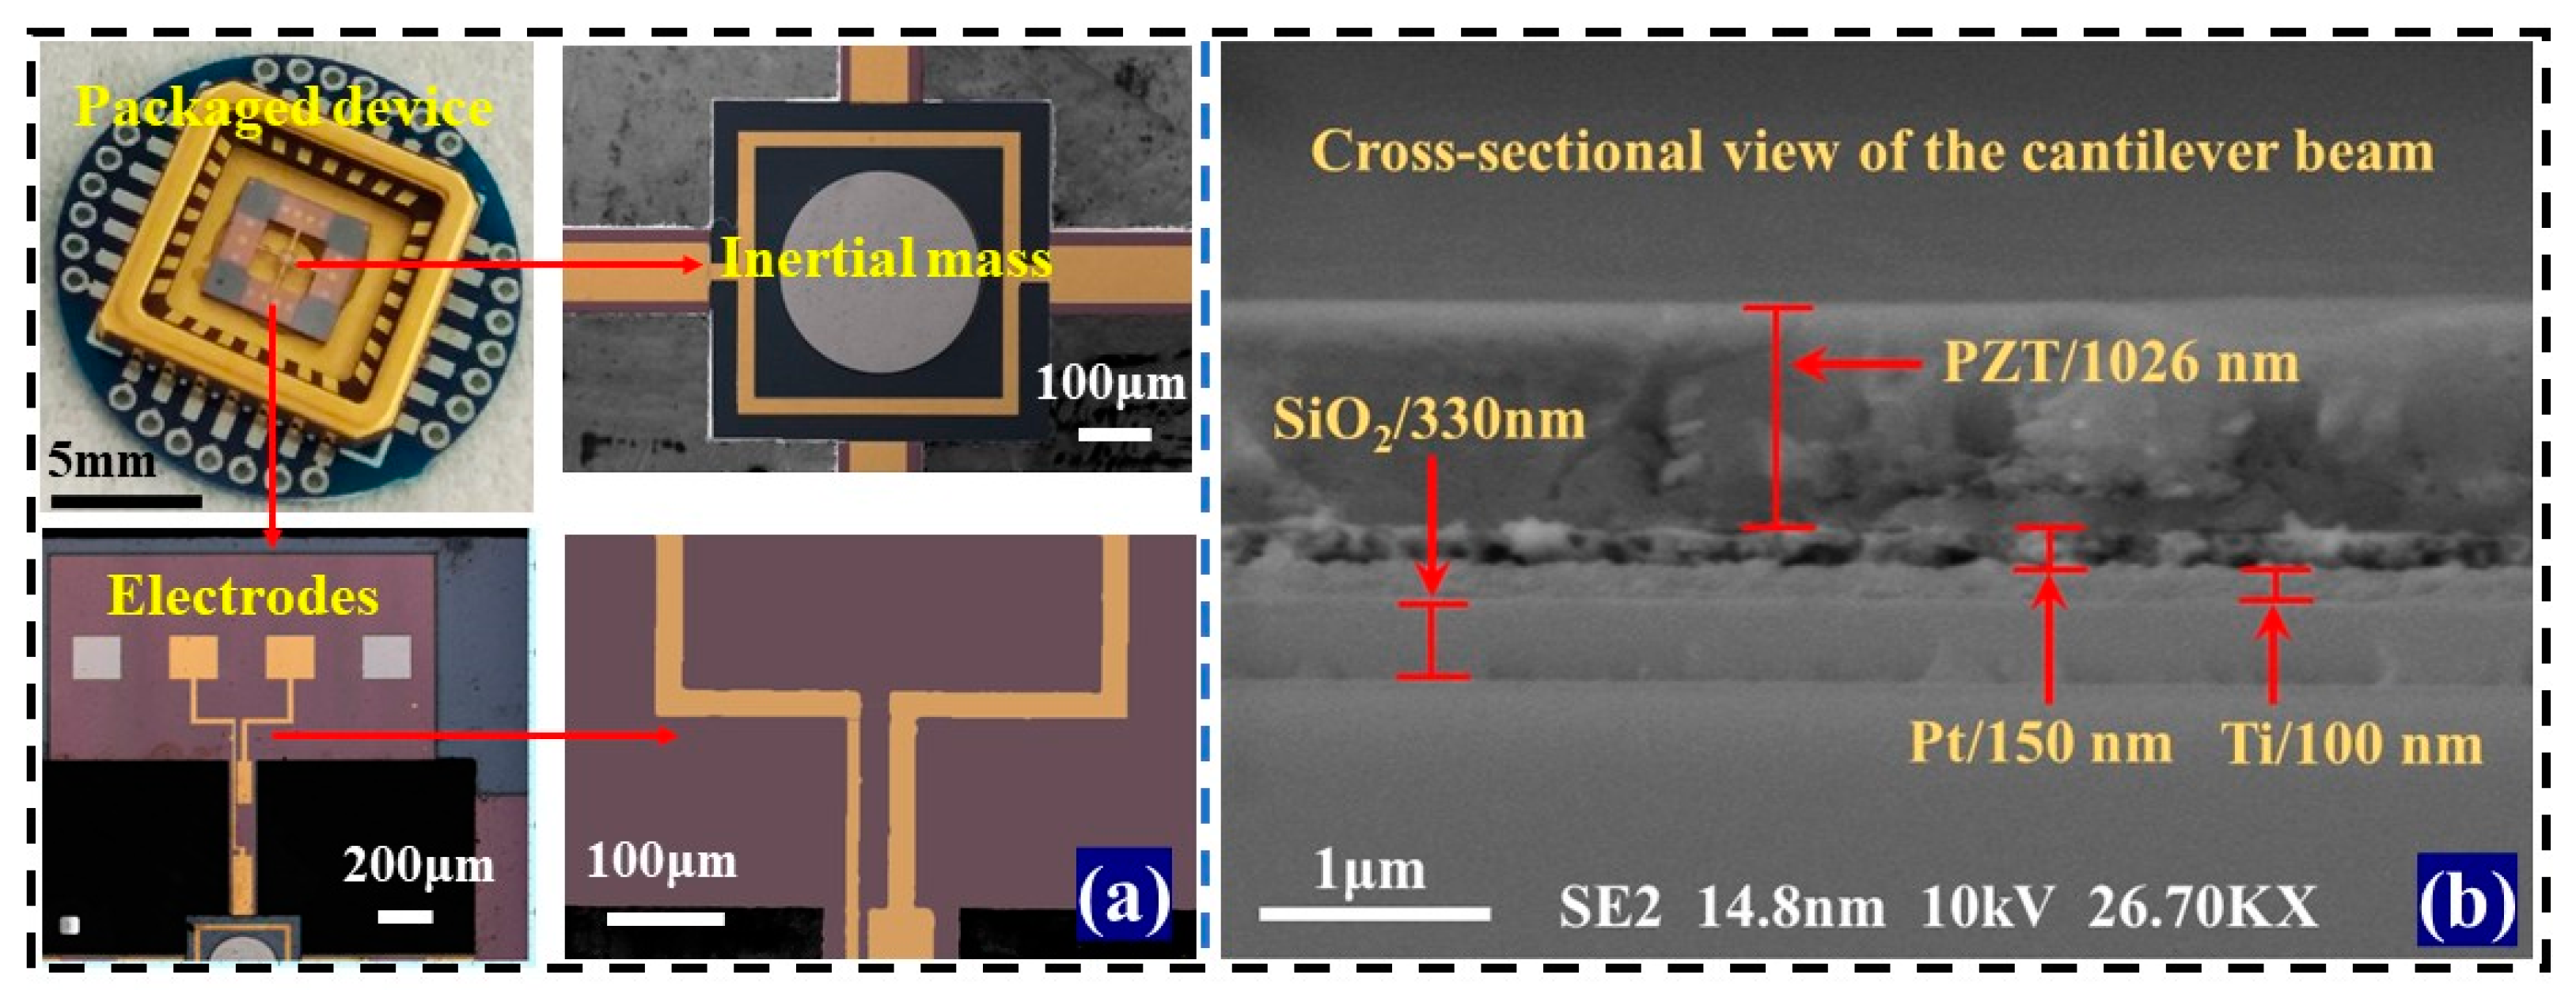
4.1. Fabrication of the MEMS Acceleration Microstructure
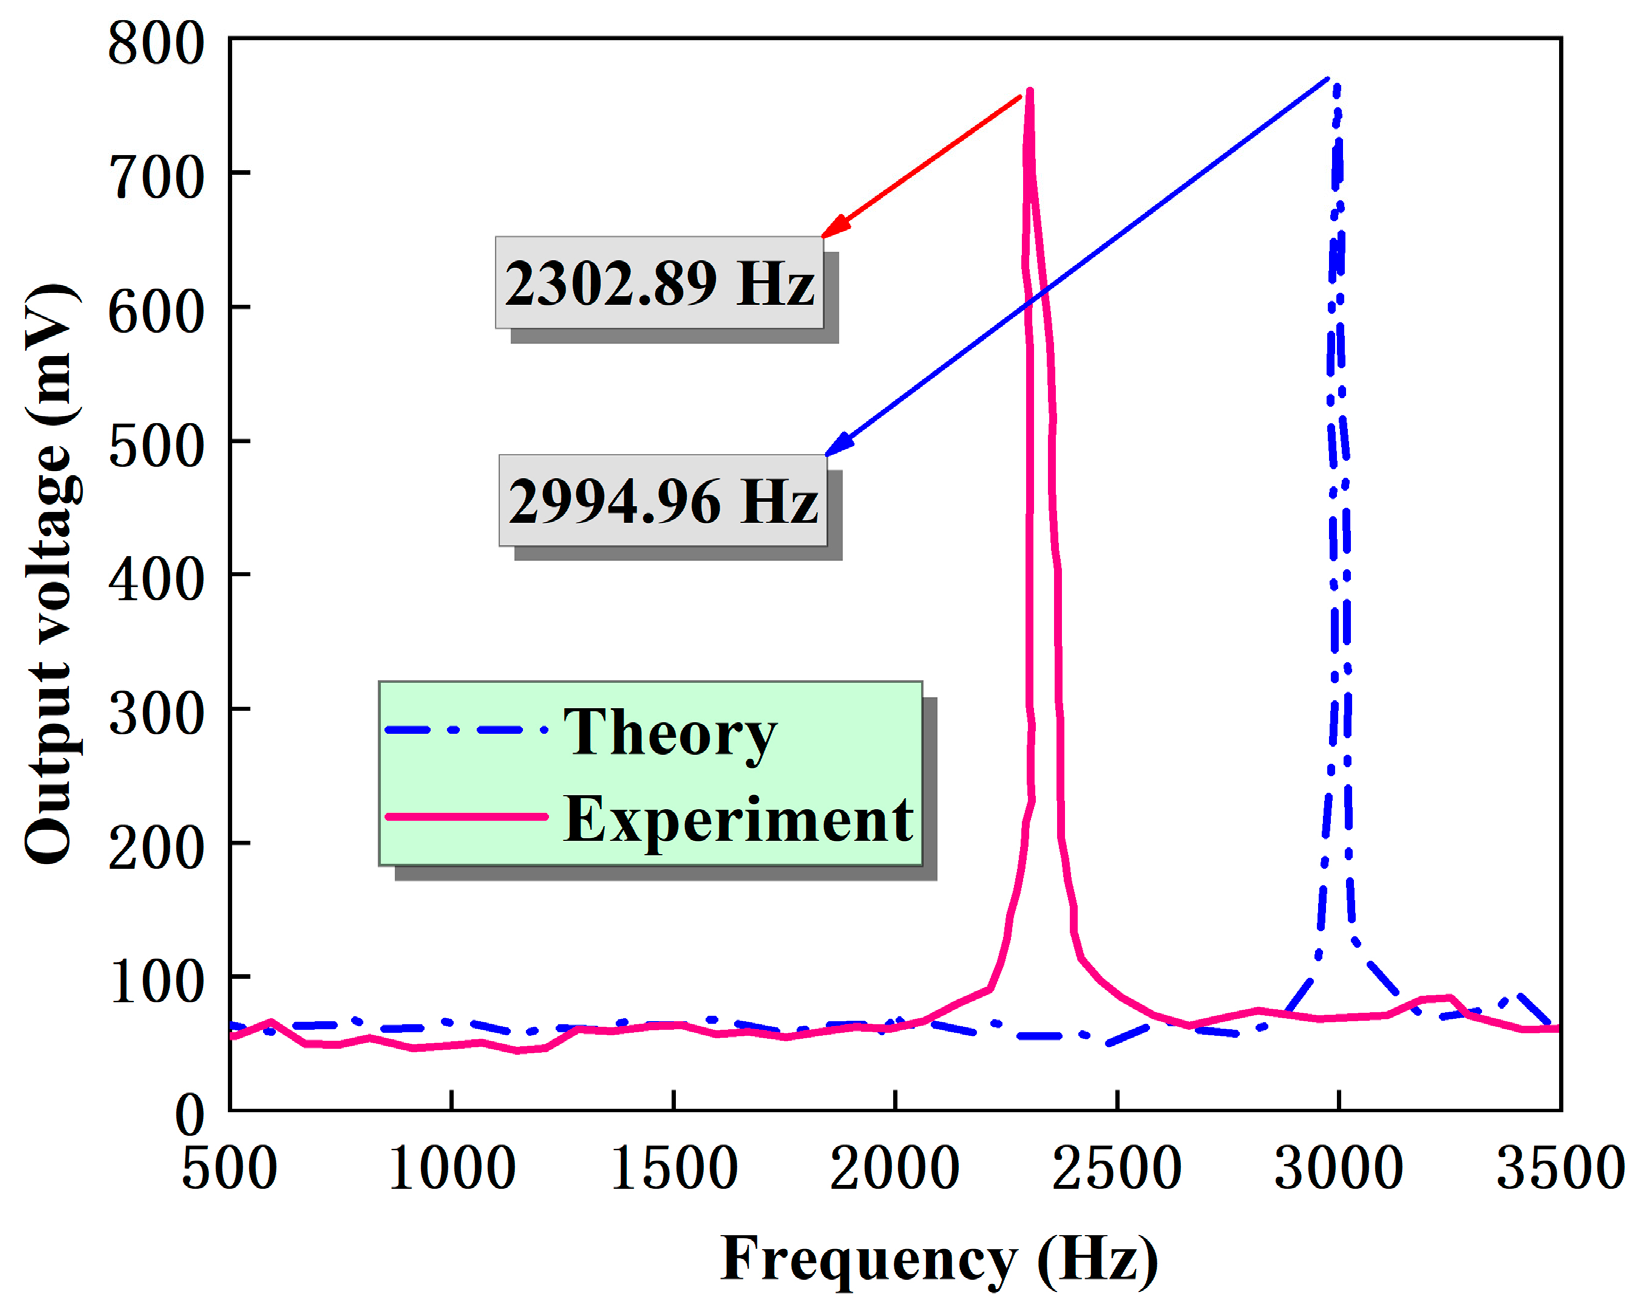
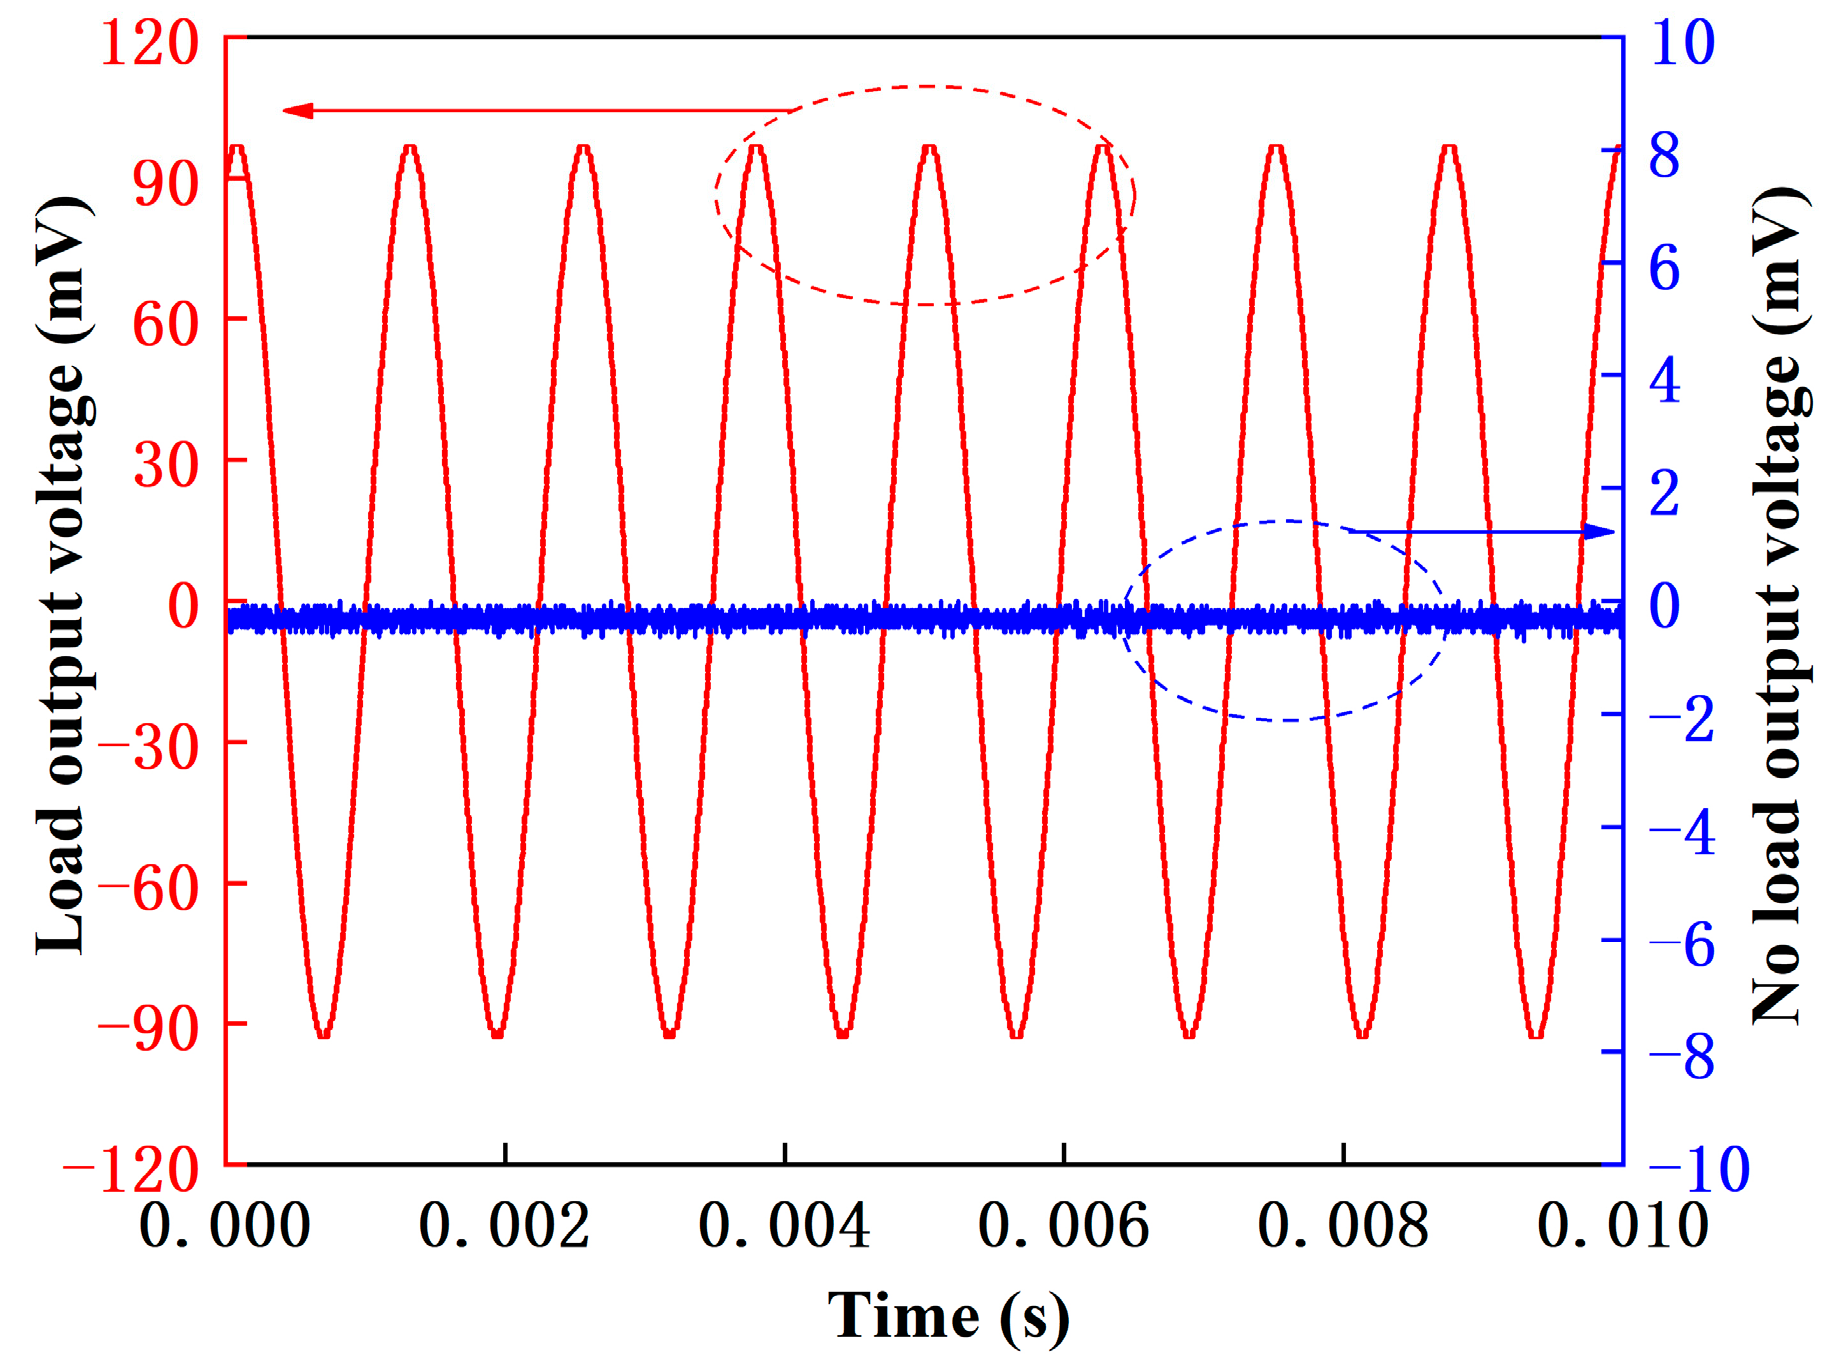
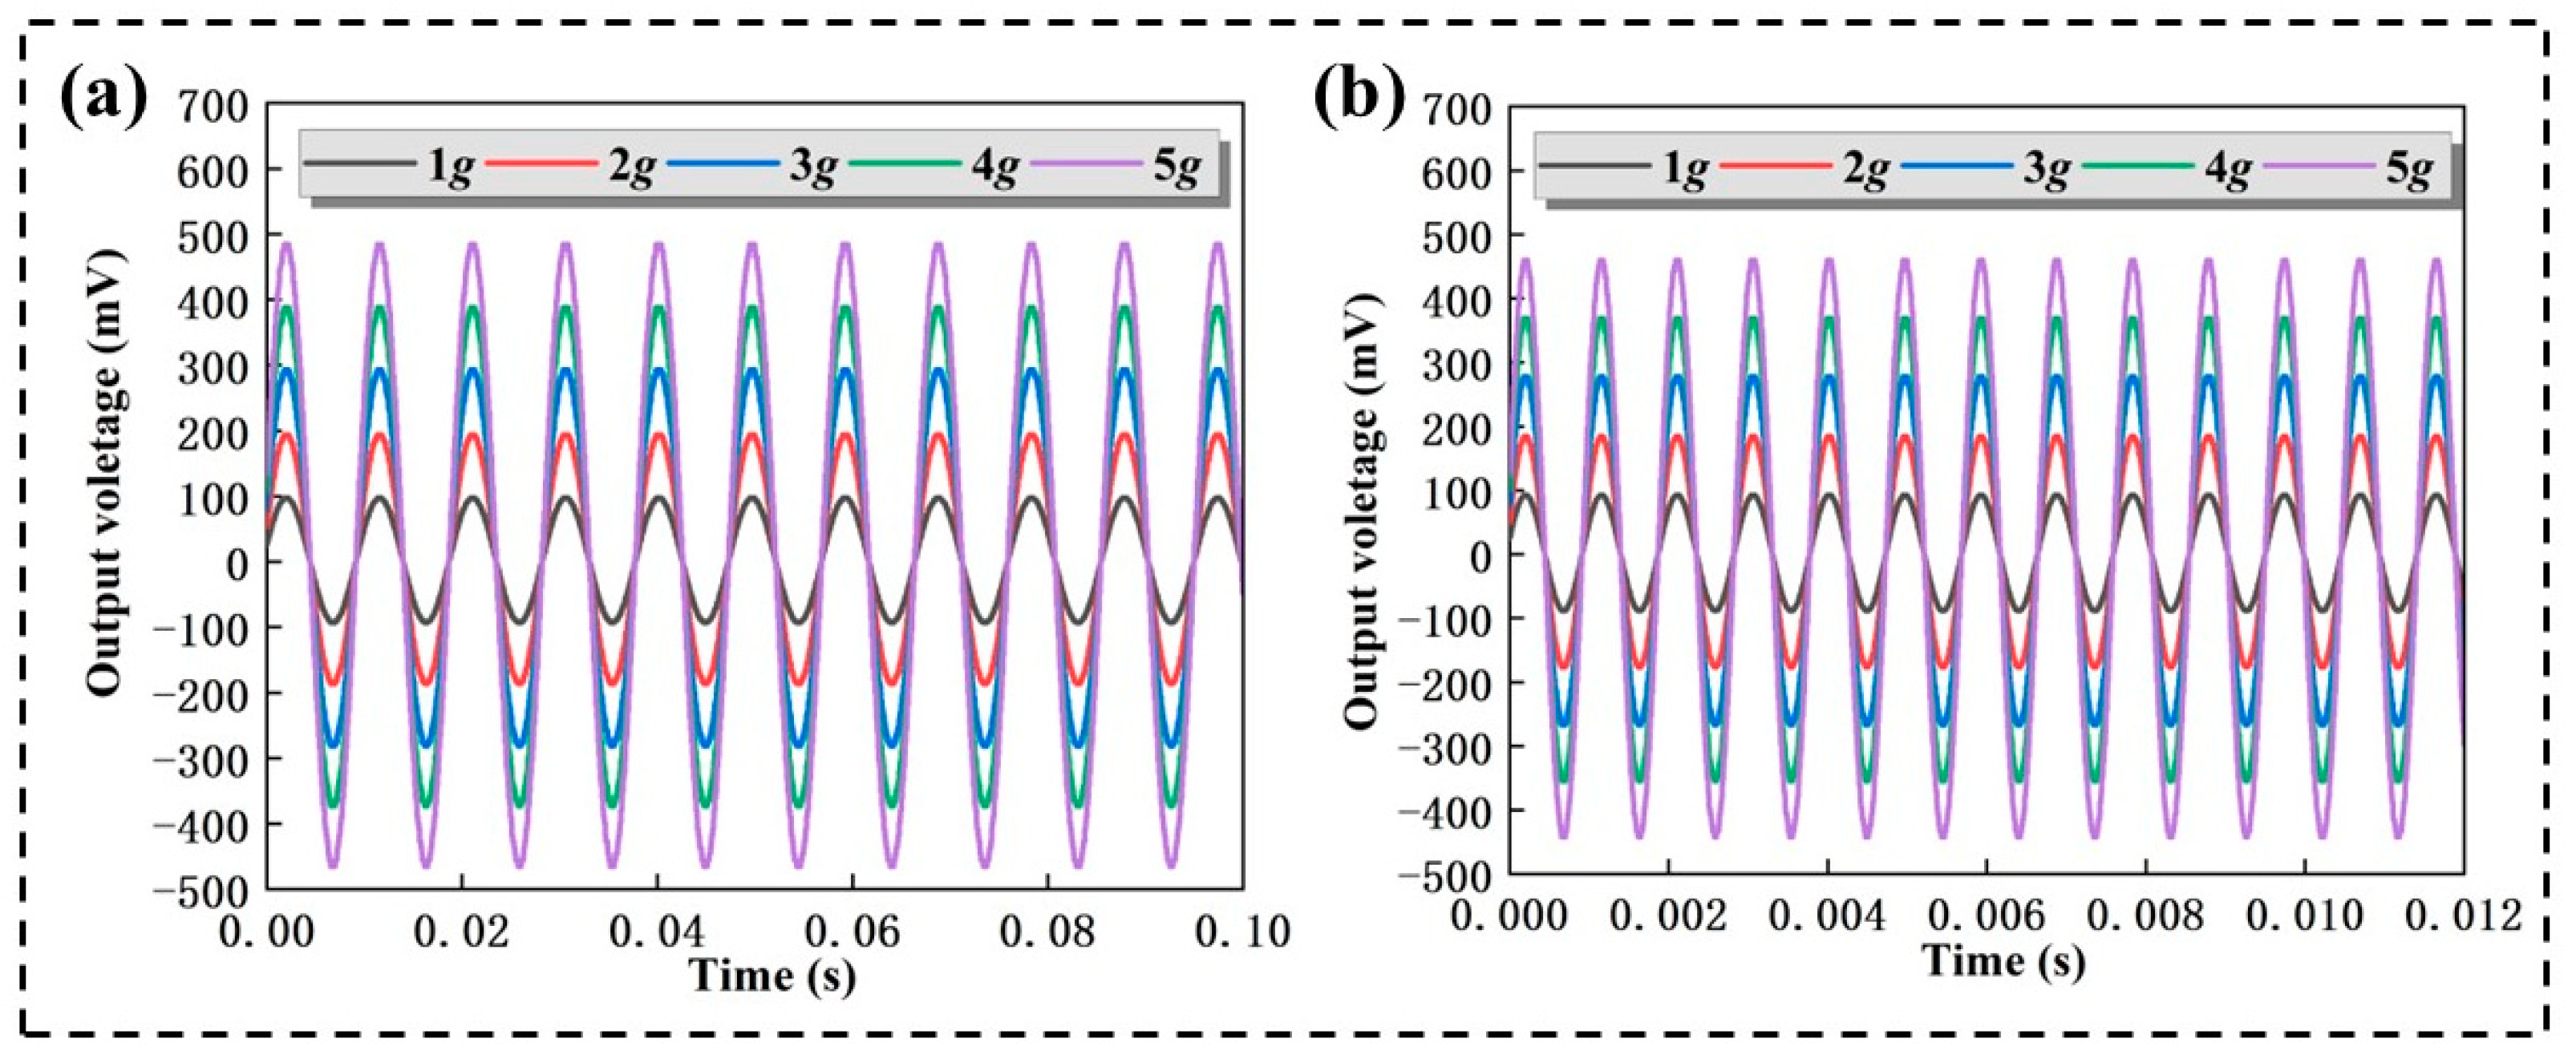
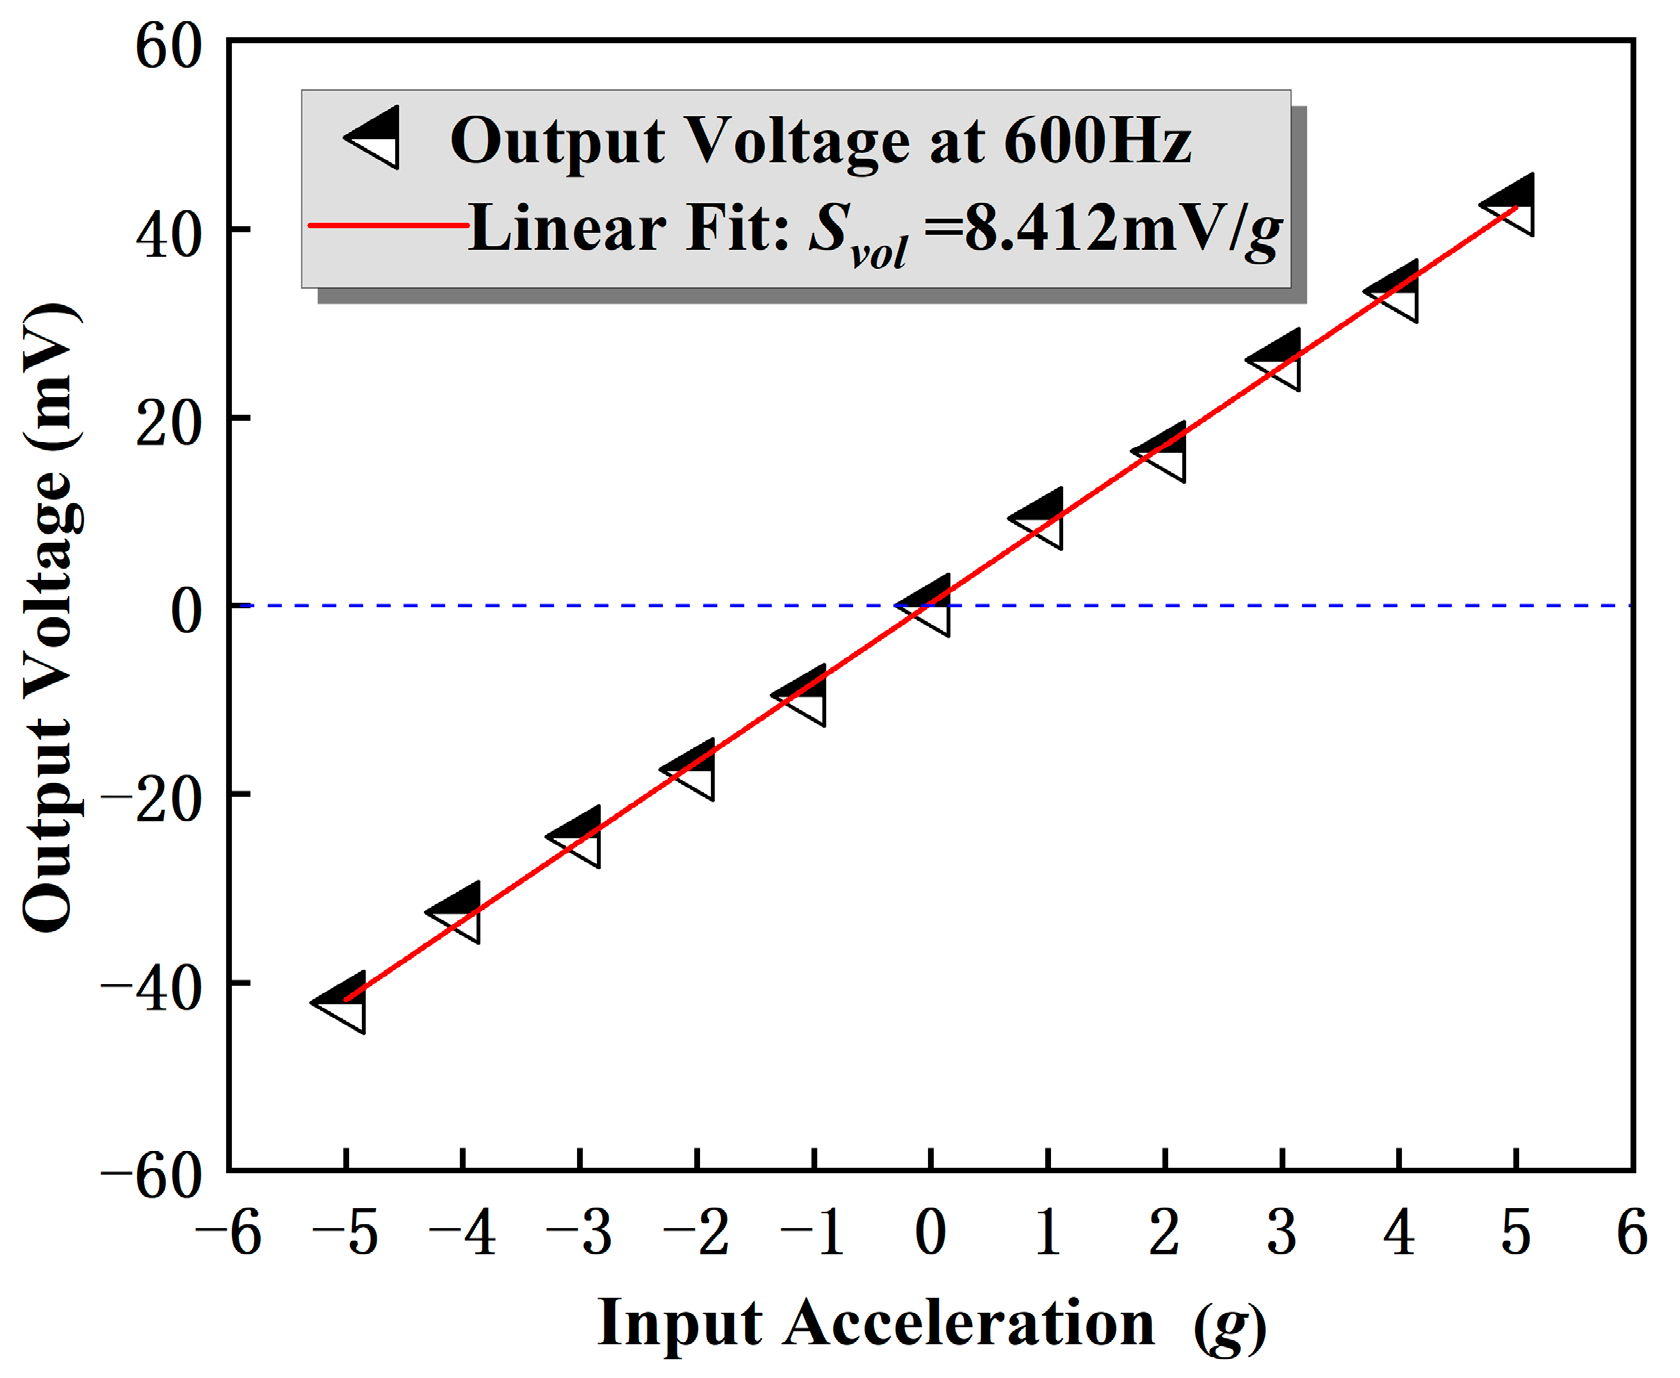
4.2. Performance of the MEMS Accelerometer
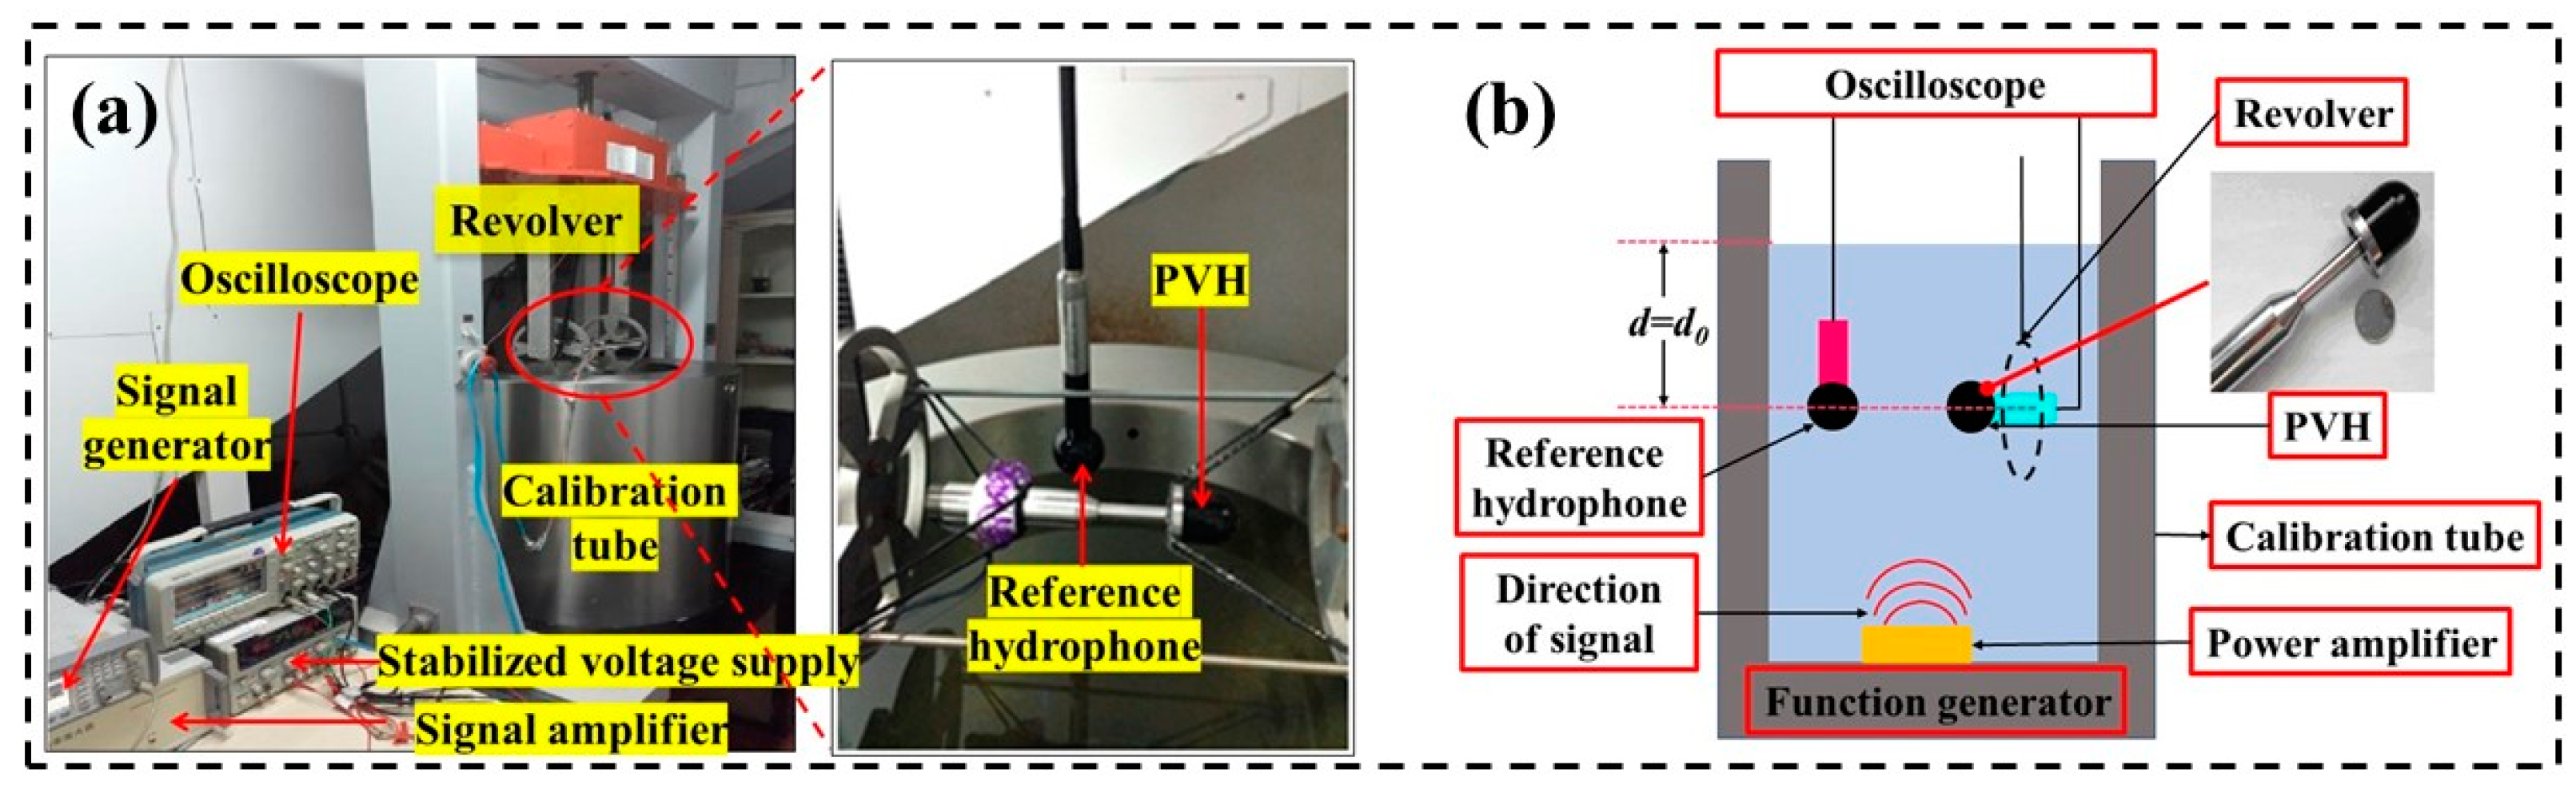
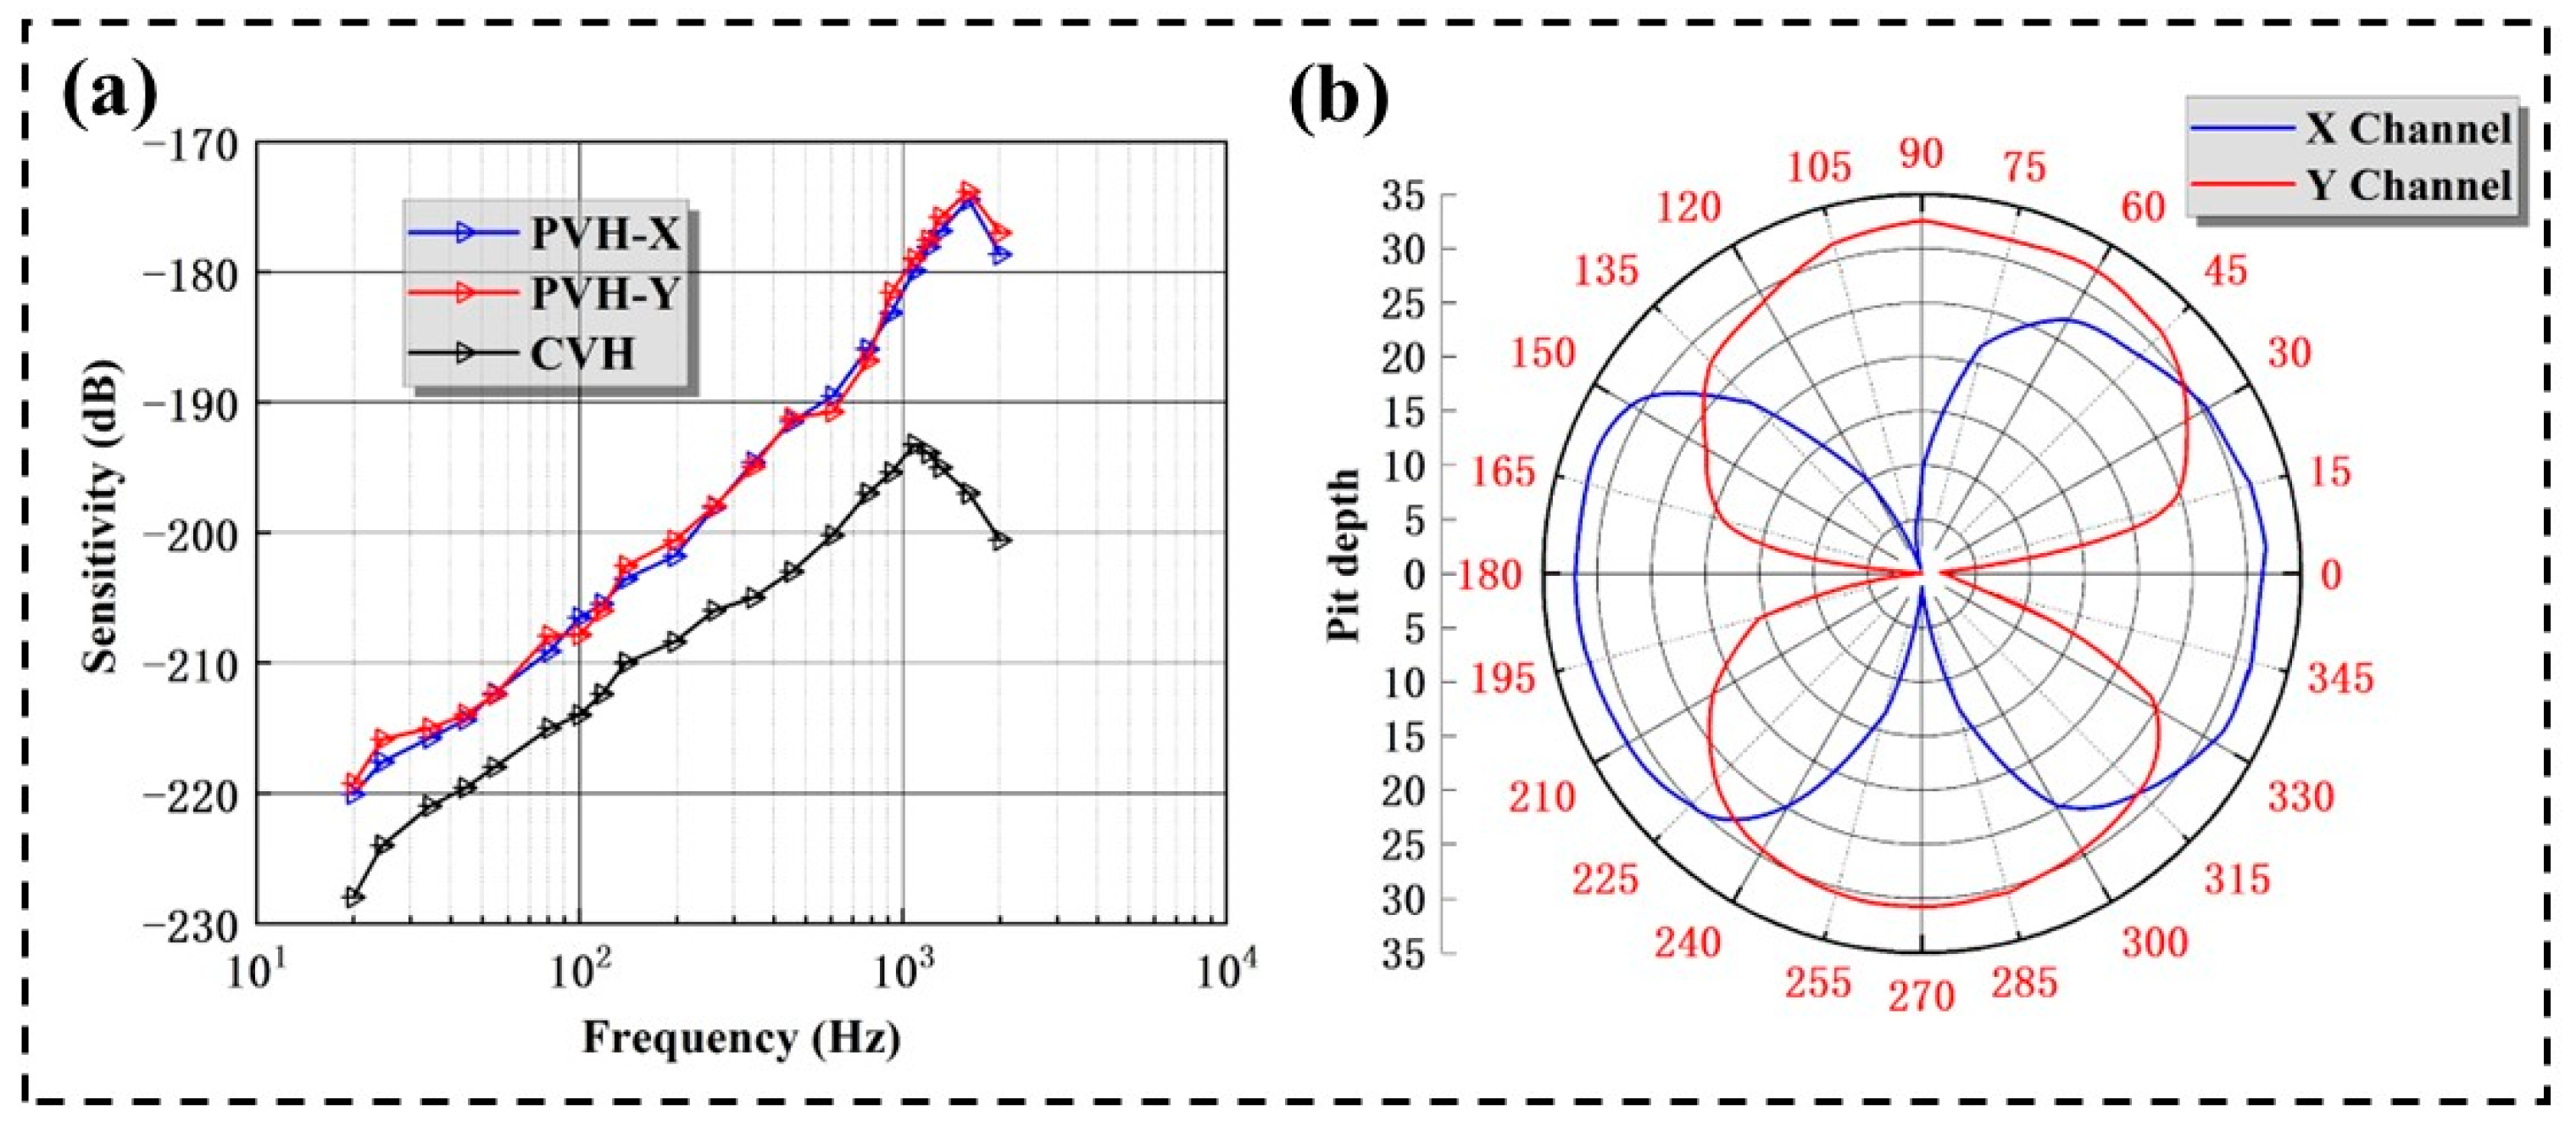
4.3. Performance of the MEMS Hydrophone
5. Conclusions
Author Contributions
Funding
Data Availability Statement
Conflicts of Interest
References
- Saheban, H.; Kordrostami, Z. Hydrophones, fundamental features, design considerations, and various structures: A review. Sens. Actuators A Phys. 2021, 329, 112790. [Google Scholar] [CrossRef]
- Abdul, B.; Mastronardi, V.M.; Qualtieri, A.; Algieri, L.; Guido, F.; Rizzi, F.; De Vittorio, M. Sensitivity and Directivity Analysis of Piezoelectric Ultrasonic Cantilever-Based MEMS Hydrophone for Underwater Applications. J. Mar. Sci. Eng. 2020, 8, 748. [Google Scholar] [CrossRef]
- Ozevin, D. MEMS Acoustic Emission Sensors. Appl. Sci. 2020, 10, 8966. [Google Scholar] [CrossRef]
- Zhang, G.; Liu, M.; Shen, N.; Wang, X.; Zhang, W. The development of the differential MEMS vector hydrophone. Sensors 2017, 17, 1332. [Google Scholar] [CrossRef] [PubMed] [Green Version]
- Wang, R.; Shen, W.; Zhang, W.; Song, J.; Zhang, W. Design and implementation of a jellyfish otolith-inspired MEMS vector hydrophone for low-frequency detection. Microsyst. Nanoeng. 2021, 7, 1. [Google Scholar] [CrossRef]
- Sun, Y.; Yu, Y.; Zhang, C.; Ma, J.; Zheng, Y. Single-sensor pressure-gradient piezoelectric cylindrical tube vector hydrophone. Vibroeng. Procedia 2022, 41, 124–130. [Google Scholar] [CrossRef]
- Xue, C.; Chen, S.; Zhang, W.; Zhang, B.; Zhang, G.; Qiao, H. Design, fabrication, and preliminary characterization of a novel MEMS bionic vector hydrophone. Microelectron. J. 2007, 38, 1021–1026. [Google Scholar] [CrossRef]
- Mireles, J., Jr.; Sauceda, Á.; Jiménez, A.; Ramos, M.; Gonzalez-Landaeta, R. Design and Development of a MOEMS Accelerometer Using SOI Technology. Micromachines 2023, 14, 231. [Google Scholar] [CrossRef] [PubMed]
- Khimunin, A.S. The maximum possible hydrophone size in the studies of the ultrasonic field structure. Acoust. Phys. 2008, 54, 279–287. [Google Scholar] [CrossRef]
- Zhu, J.; Liu, X.; Shi, Q.; He, T.; Sun, Z.; Guo, X.; Liu, W.; Sulaiman, O.B.; Dong, B.; Lee, C. Development trends and perspectives of future sensors and MEMS/NEMS. Micromachines 2019, 11, 7. [Google Scholar] [CrossRef] [Green Version]
- Song, J.; He, C.; Wang, R.; Xue, Y.; Zhang, W. A mathematical model of a piezoresistive eight-beam three-axis accelerometer with simulation and experimental validation. Sensors 2018, 18, 3641. [Google Scholar] [CrossRef] [PubMed] [Green Version]
- Gupta, N.; Dutta, S.; Panchal, A.; Yadav, I.; Kumar, S.; Parmar, Y. Design and fabrication of SOI technology based MEMS differential capacitive accelerometer structure. J. Mater. Sci. Mater. Electron. 2019, 30, 15705–15714. [Google Scholar] [CrossRef]
- Li, S.; Zhao, X.; Bai, Y.; Li, Y.; Ai, C.; Wen, D. Fabrication technology and characteristics research of the acceleration sensor based on Li-doped ZnO piezoelectric thin films. Micromachines 2018, 9, 178. [Google Scholar] [CrossRef] [Green Version]
- Cai, S.; Li, W.; Zou, H.; Bao, H.; Zhang, K.; Wang, J.; Song, Z.; Li, X. Design, Fabrication, and Testing of a Monolithically Integrated Tri-Axis High-Shock Accelerometer in Single (111)-Silicon Wafer. Micromachines 2019, 10, 227. [Google Scholar] [CrossRef] [Green Version]
- Benmessaoud, M.; Nasreddine, M.M. Optimization of MEMS capacitive accelerometer. Microsyst. Technol. 2013, 19, 713–720. [Google Scholar] [CrossRef] [Green Version]
- Kanda, K.; Aiba, T.; Maenaka, K. Piezoelectric MEMS Energy Harvester from Airflow at Low Flow Velocities. Sens. Mater. 2022, 34, 1879–1888. [Google Scholar] [CrossRef]
- Trolier-McKinstry, S.; Muralt, P. Thin Film Piezoelectrics for MEMS. J. Electroceram. 2004, 12, 7–17. [Google Scholar] [CrossRef]
- Ding, X.; Wu, Z.; Gao, M.; Chen, M.; Li, J.; Wu, T.; Lou, L. A High-Sensitivity Bowel Sound Electronic Monitor Based on Piezoelectric Micromachined Ultrasonic Transducers. Micromachines 2022, 13, 2221. [Google Scholar] [CrossRef]
- Hindrichsen, C.C.; Thomsen, E.V.; Lou-Moller, R.; Bove, T. MEMS accelerometer with screen printed piezoelectric thick film. In Proceedings of the 2006 IEEE Sensors, Daegu, Republic of Korea, 22–25 October 2006. [Google Scholar]
- Hindrichsen, C.C.; Almind, N.S.; Brodersen, S.H.; Hansen, O.; Thomsen, E.V. Analytical model of a PZT thick-film triaxial accelerometer for optimum design. IEEE Sens. J. 2009, 9, 419–429. [Google Scholar] [CrossRef] [Green Version]
- Hindrichsen, C.C.; Almind, N.S.; Brodersen, S.H.; Lou-Møller, R.; Hansen, K.; Thomsen, E.V. Triaxial MEMS accelerometer with screen printed PZT thick film. J. Electroceram. 2010, 25, 108–115. [Google Scholar] [CrossRef]
- Xu, M.H.; Zhou, H.; Zhu, L.H.; Shen, J.N.; Guo, H. Design and fabrication of a d33-mode piezoelectric micro-accelerometer. Microsyst. Technol. 2019, 25, 4465–4474. [Google Scholar] [CrossRef]
- Lee, Y.C.; Tsai, C.C.; Li, C.Y.; Liou, Y.C.; Chu, S.Y. Fabrication and function examination of PZT-based MEMS accelerometers. Ceram. Int. 2021, 47, 24458–24465. [Google Scholar] [CrossRef]
- Kim, J.; Pyo, S.; Roh, Y. Analysis of a thickness-shear mode vibrator for the accelerometer in vector hydrophones. Sens. Actuators A Phys. 2017, 266, 9–14. [Google Scholar] [CrossRef]
- Pyo, S.; Kim, J.; Kim, H.; Roh, Y. Development of vector hydrophone using thickness–shear mode piezoelectric single crystal accelerometer. Sens. Actuators A Phys. 2018, 283, 220–227. [Google Scholar] [CrossRef]
- Cho, Y.; Je, Y.; Jeong, W.B. A miniaturized acoustic vector sensor with PIN-PMN-PT single crystal cantilever beam accelerometers. Acta Acust. 2020, 4, 5. [Google Scholar] [CrossRef]
- Roh, T.; Yeo, H.G.; Joh, C.; Roh, Y.; Kim, K.; Seo, H.-s.; Choi, H. Fabrication and Underwater Testing of a Vector Hydrophone Comprising a Triaxial Piezoelectric Accelerometer and Spherical Hydrophone. Sensors 2022, 22, 9796. [Google Scholar] [CrossRef]
- Kim, S.B.; Park, H.; Kim, S.H.; Wikle, H.C.; Park, J.H.; Kim, D.J. Comparison of MEMS PZT Cantilevers Based on d31 and d33 Modes for Vibration Energy Harvesting. Microelectromechan. Syst. 2012, 22, 26–33. [Google Scholar] [CrossRef]
- Liu, H.C.; Zhong, J.W.; Lee, C.K.; Lee, S.-W.; Lin, L.W. A comprehensive review on piezoelectric energy harvesting technology: Materials, mechanisms, and applications. Appl. Phys. Rev. 2018, 5, 041306. [Google Scholar] [CrossRef] [Green Version]
- Li, H.D.; Tian, C.; Deng, Z.D. Energy harvesting from low frequency applications using piezoelectric materials. Appl. Phys. Rev. 2014, 1, 041301. [Google Scholar] [CrossRef] [Green Version]
- Zhang, Z.; Zhang, L.; Wu, Z.; Gao, Y.; Lou, L. A High-Sensitivity MEMS Accelerometer Using a Sc0.8Al0.2N-Based Four Beam Structure. Micromachines 2023, 14, 1069. [Google Scholar]
- Anton, S.R.; Sodono, H.A. A review of power harvesting using piezoelectric materials. Smart Mater. Struct. 2007, 16, R1–R21. [Google Scholar] [CrossRef]
- Wang, R.; Liu, Y.; Xu, W.; Bai, B.; Zhang, G.; Liu, J.; Xiong, J.; Zhang, W.; Xue, C.; Zhang, B. “Fitness-Wheel-Shaped” MEMS Vector Hydrophone for 3D Spatial Acoustic Orientation. J. Micromech. Microeng. 2017, 27, 045015. [Google Scholar] [CrossRef]
- Wei, H.; Geng, W.; Bi, K.; Li, T.; Li, X.; Qiao, X.; Shi, Y.; Zhang, H.; Zhao, C.; Xue, G.; et al. High-Performance Piezoelectric-Type MEMS Vibration Sensor Based on LiNbO3 Single-Crystal Cantilever Beams. Micromachines 2022, 13, 329. [Google Scholar] [CrossRef] [PubMed]
- Yang, X.; Xu, Q.; Zhang, G.; Zhang, L.; Wang, W.; Shang, Z.; Shi, Y.; Li, C.; Wang, R.; Zhang, W. Design and implementation of hollow cilium cylinder MEMS vector hydrophone. Measurement 2021, 168, 108309. [Google Scholar] [CrossRef]
- Zhao, A.B.; Zhou, B.; Li, J.Q. Calibration of vector hydrophones in deep water. Appl. Mech. Mater. 2013, 336, 303–308. [Google Scholar] [CrossRef]


| Material | Parameters | Value |
|---|---|---|
| Si | Density | 2330 kg·m−3 |
| Young’s modulus | 190 Gpa | |
| Poisson’s ratio | 0.26 | |
| Dielectric constant | 11.9 | |
| PZT | Density | 7500 kg·m−3 |
| Young’s modulus | 75 Gpa | |
| Poisson’s ratio | 0.32 | |
| Effective Coupling Co-efficient | 35 k2% | |
| Curie temperature | 365 °C | |
| Elastic modulus | 5 × 10¹⁰ N/m2 | |
| Tensile modulus | 2 × 10⁷ N/m2 | |
| Dielectric constant | 1300 | |
| Piezoelectric charge constant d31 | −270 pC/N | |
| Mechanical quality factor | 32 |
| Parameters | Range | Steps |
|---|---|---|
| Length of cantilever beams | 700~1800 | 100 μm |
| Width of cantilever beams | 100~150 | 5 μm |
| Thicknesses of cantilever beams | 10~50 | 5 μm |
| Side length of inertial mass unit | 600~1100 | 50 μm |
| Parameters for Scanning | Numerical Value |
|---|---|
| Length of single beams | 1100 μm |
| Width of beams | 120 μm |
| Thicknesses of beams | 25 μm |
| Side length of the inertial unit | 700 μm |
| Thicknesses of PZT | 1 μm |
| Microstructure size | 5000 μm × 5000 μm |
Disclaimer/Publisher’s Note: The statements, opinions and data contained in all publications are solely those of the individual author(s) and contributor(s) and not of MDPI and/or the editor(s). MDPI and/or the editor(s) disclaim responsibility for any injury to people or property resulting from any ideas, methods, instructions or products referred to in the content. |
© 2023 by the authors. Licensee MDPI, Basel, Switzerland. This article is an open access article distributed under the terms and conditions of the Creative Commons Attribution (CC BY) license (https://creativecommons.org/licenses/by/4.0/).
Share and Cite
Shi, S.; Ma, L.; Kang, K.; Zhu, J.; Hu, J.; Ma, H.; Pang, Y.; Wang, Z. High-Sensitivity Piezoelectric MEMS Accelerometer for Vector Hydrophones. Micromachines 2023, 14, 1598. https://doi.org/10.3390/mi14081598
Shi S, Ma L, Kang K, Zhu J, Hu J, Ma H, Pang Y, Wang Z. High-Sensitivity Piezoelectric MEMS Accelerometer for Vector Hydrophones. Micromachines. 2023; 14(8):1598. https://doi.org/10.3390/mi14081598
Chicago/Turabian StyleShi, Shuzheng, Liyong Ma, Kai Kang, Jie Zhu, Jinjiang Hu, Hong Ma, Yongjun Pang, and Zhanying Wang. 2023. "High-Sensitivity Piezoelectric MEMS Accelerometer for Vector Hydrophones" Micromachines 14, no. 8: 1598. https://doi.org/10.3390/mi14081598