
A Modified-Herringbone Micromixer for Assessing Zebrafish Sperm (MAGS)

 , ,
, ,  , and
, and 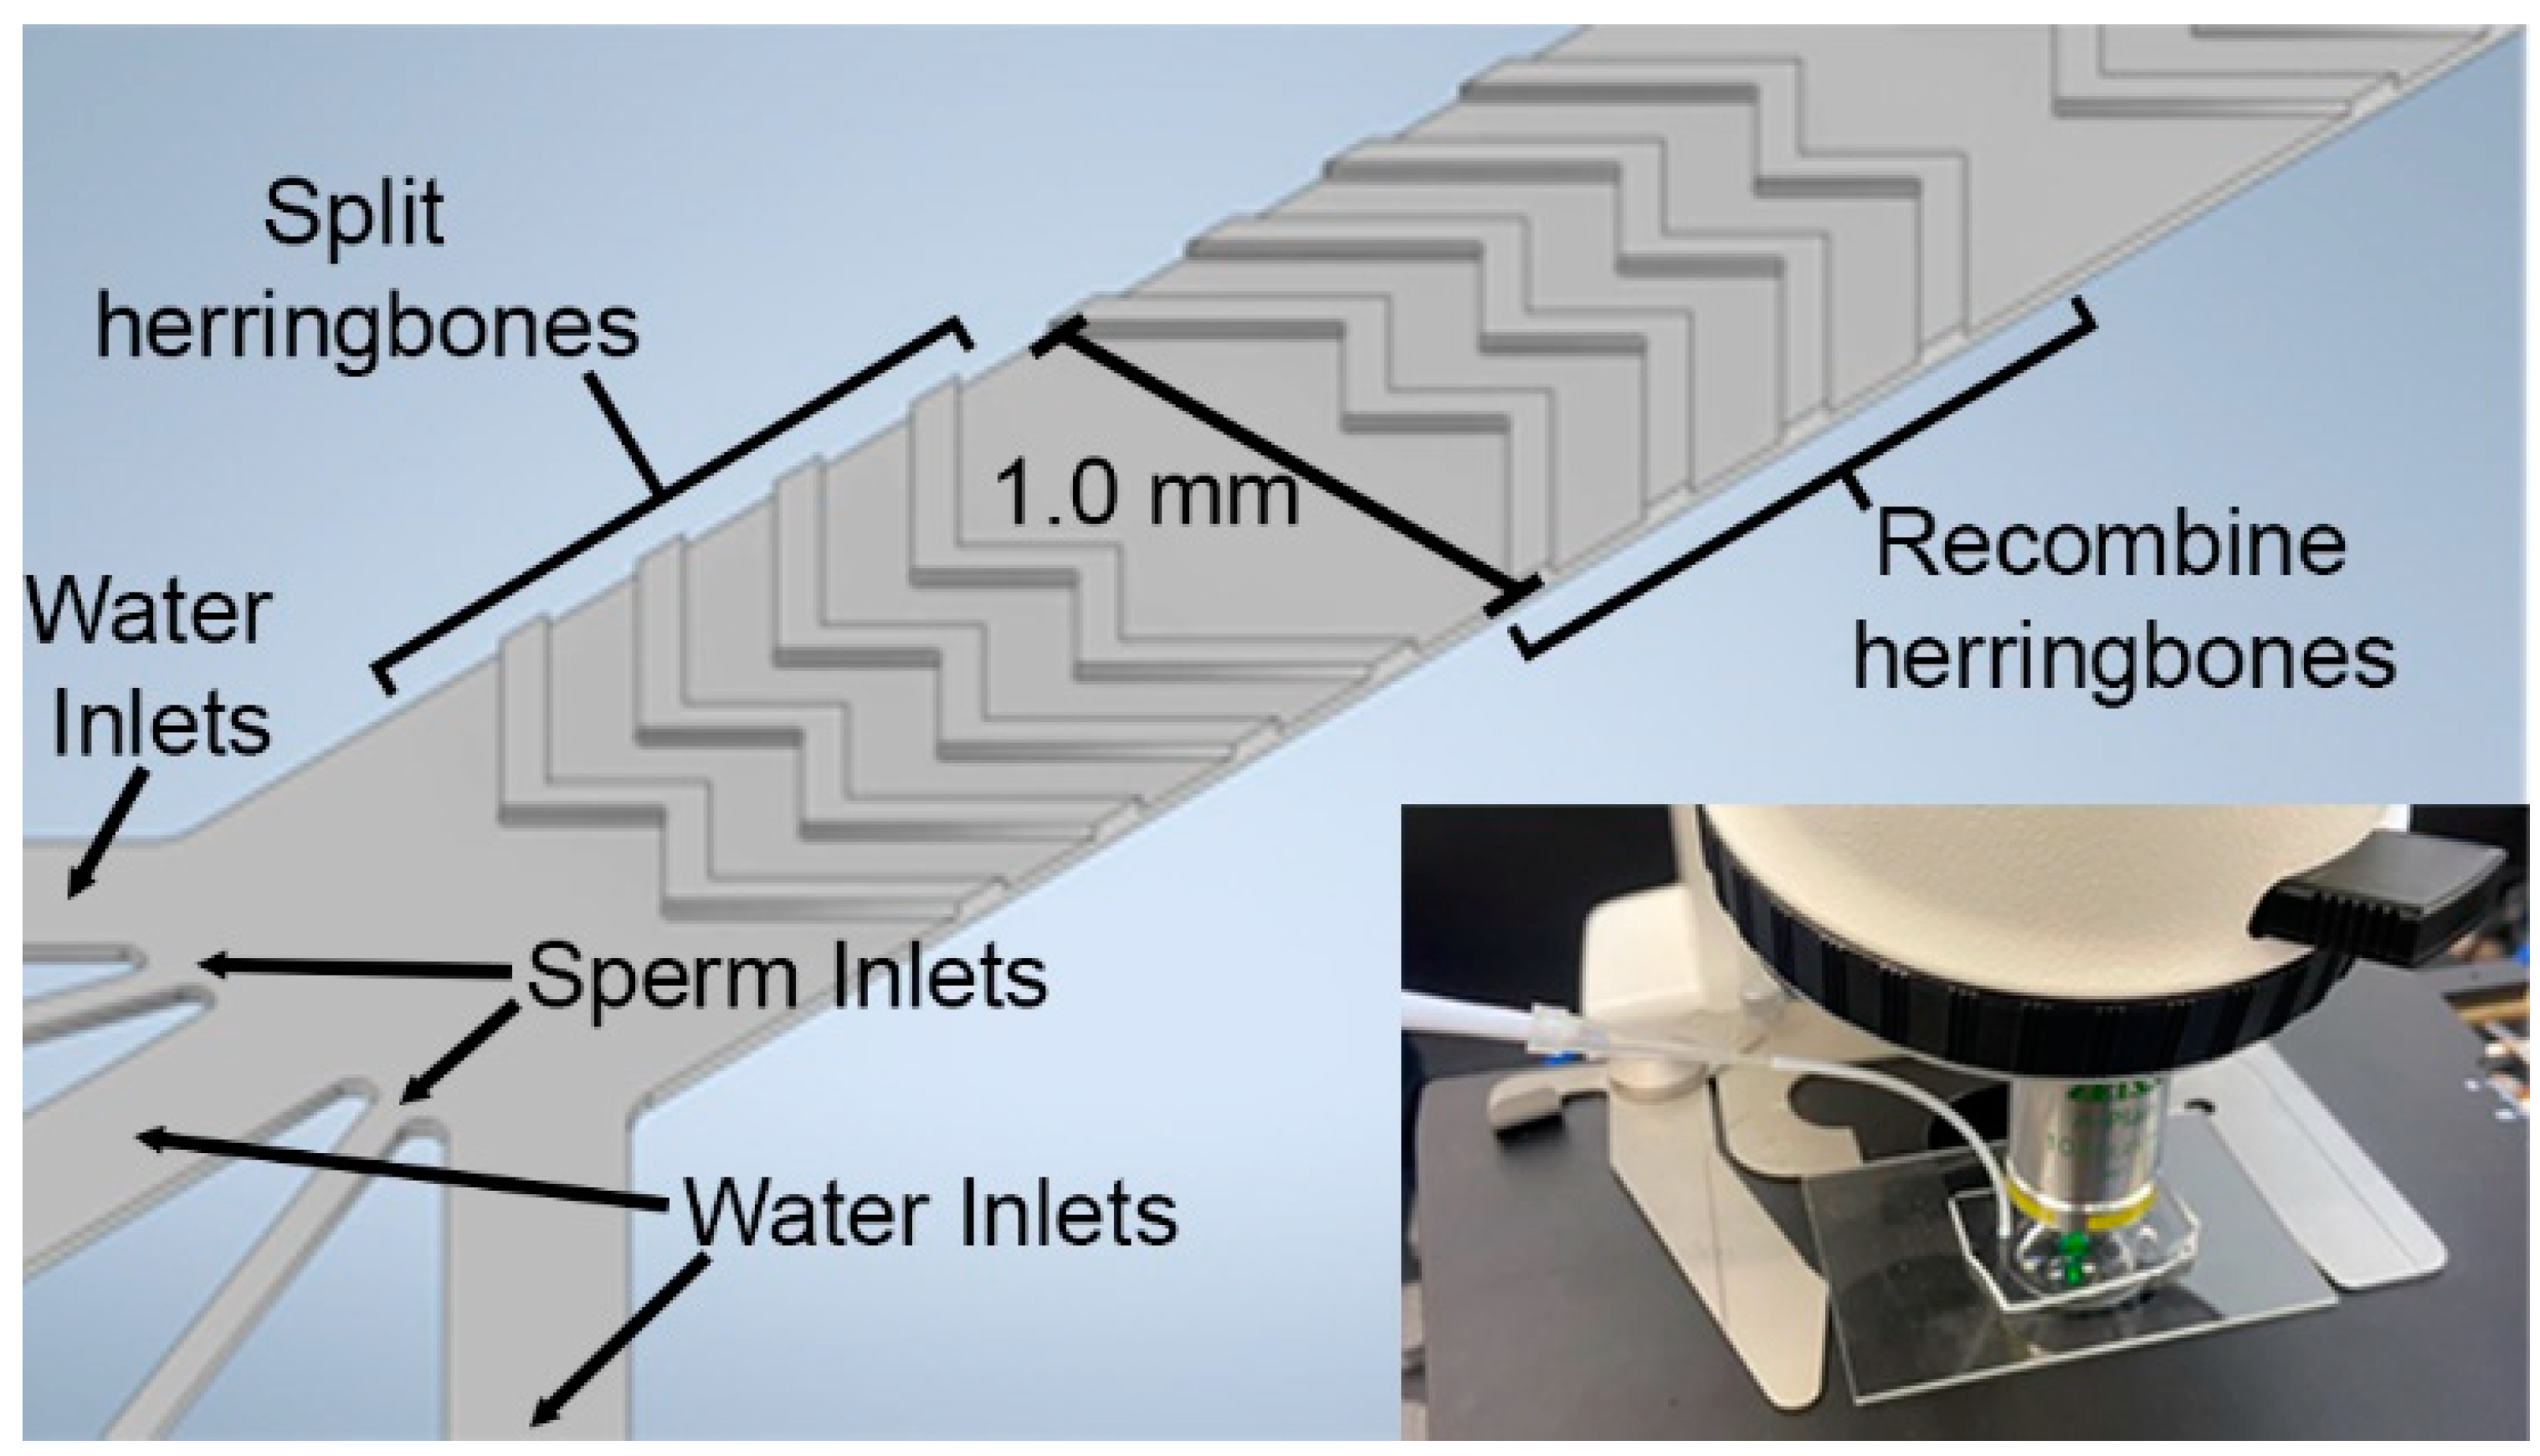
Abstract
:1. Introduction
2. Materials and Methods
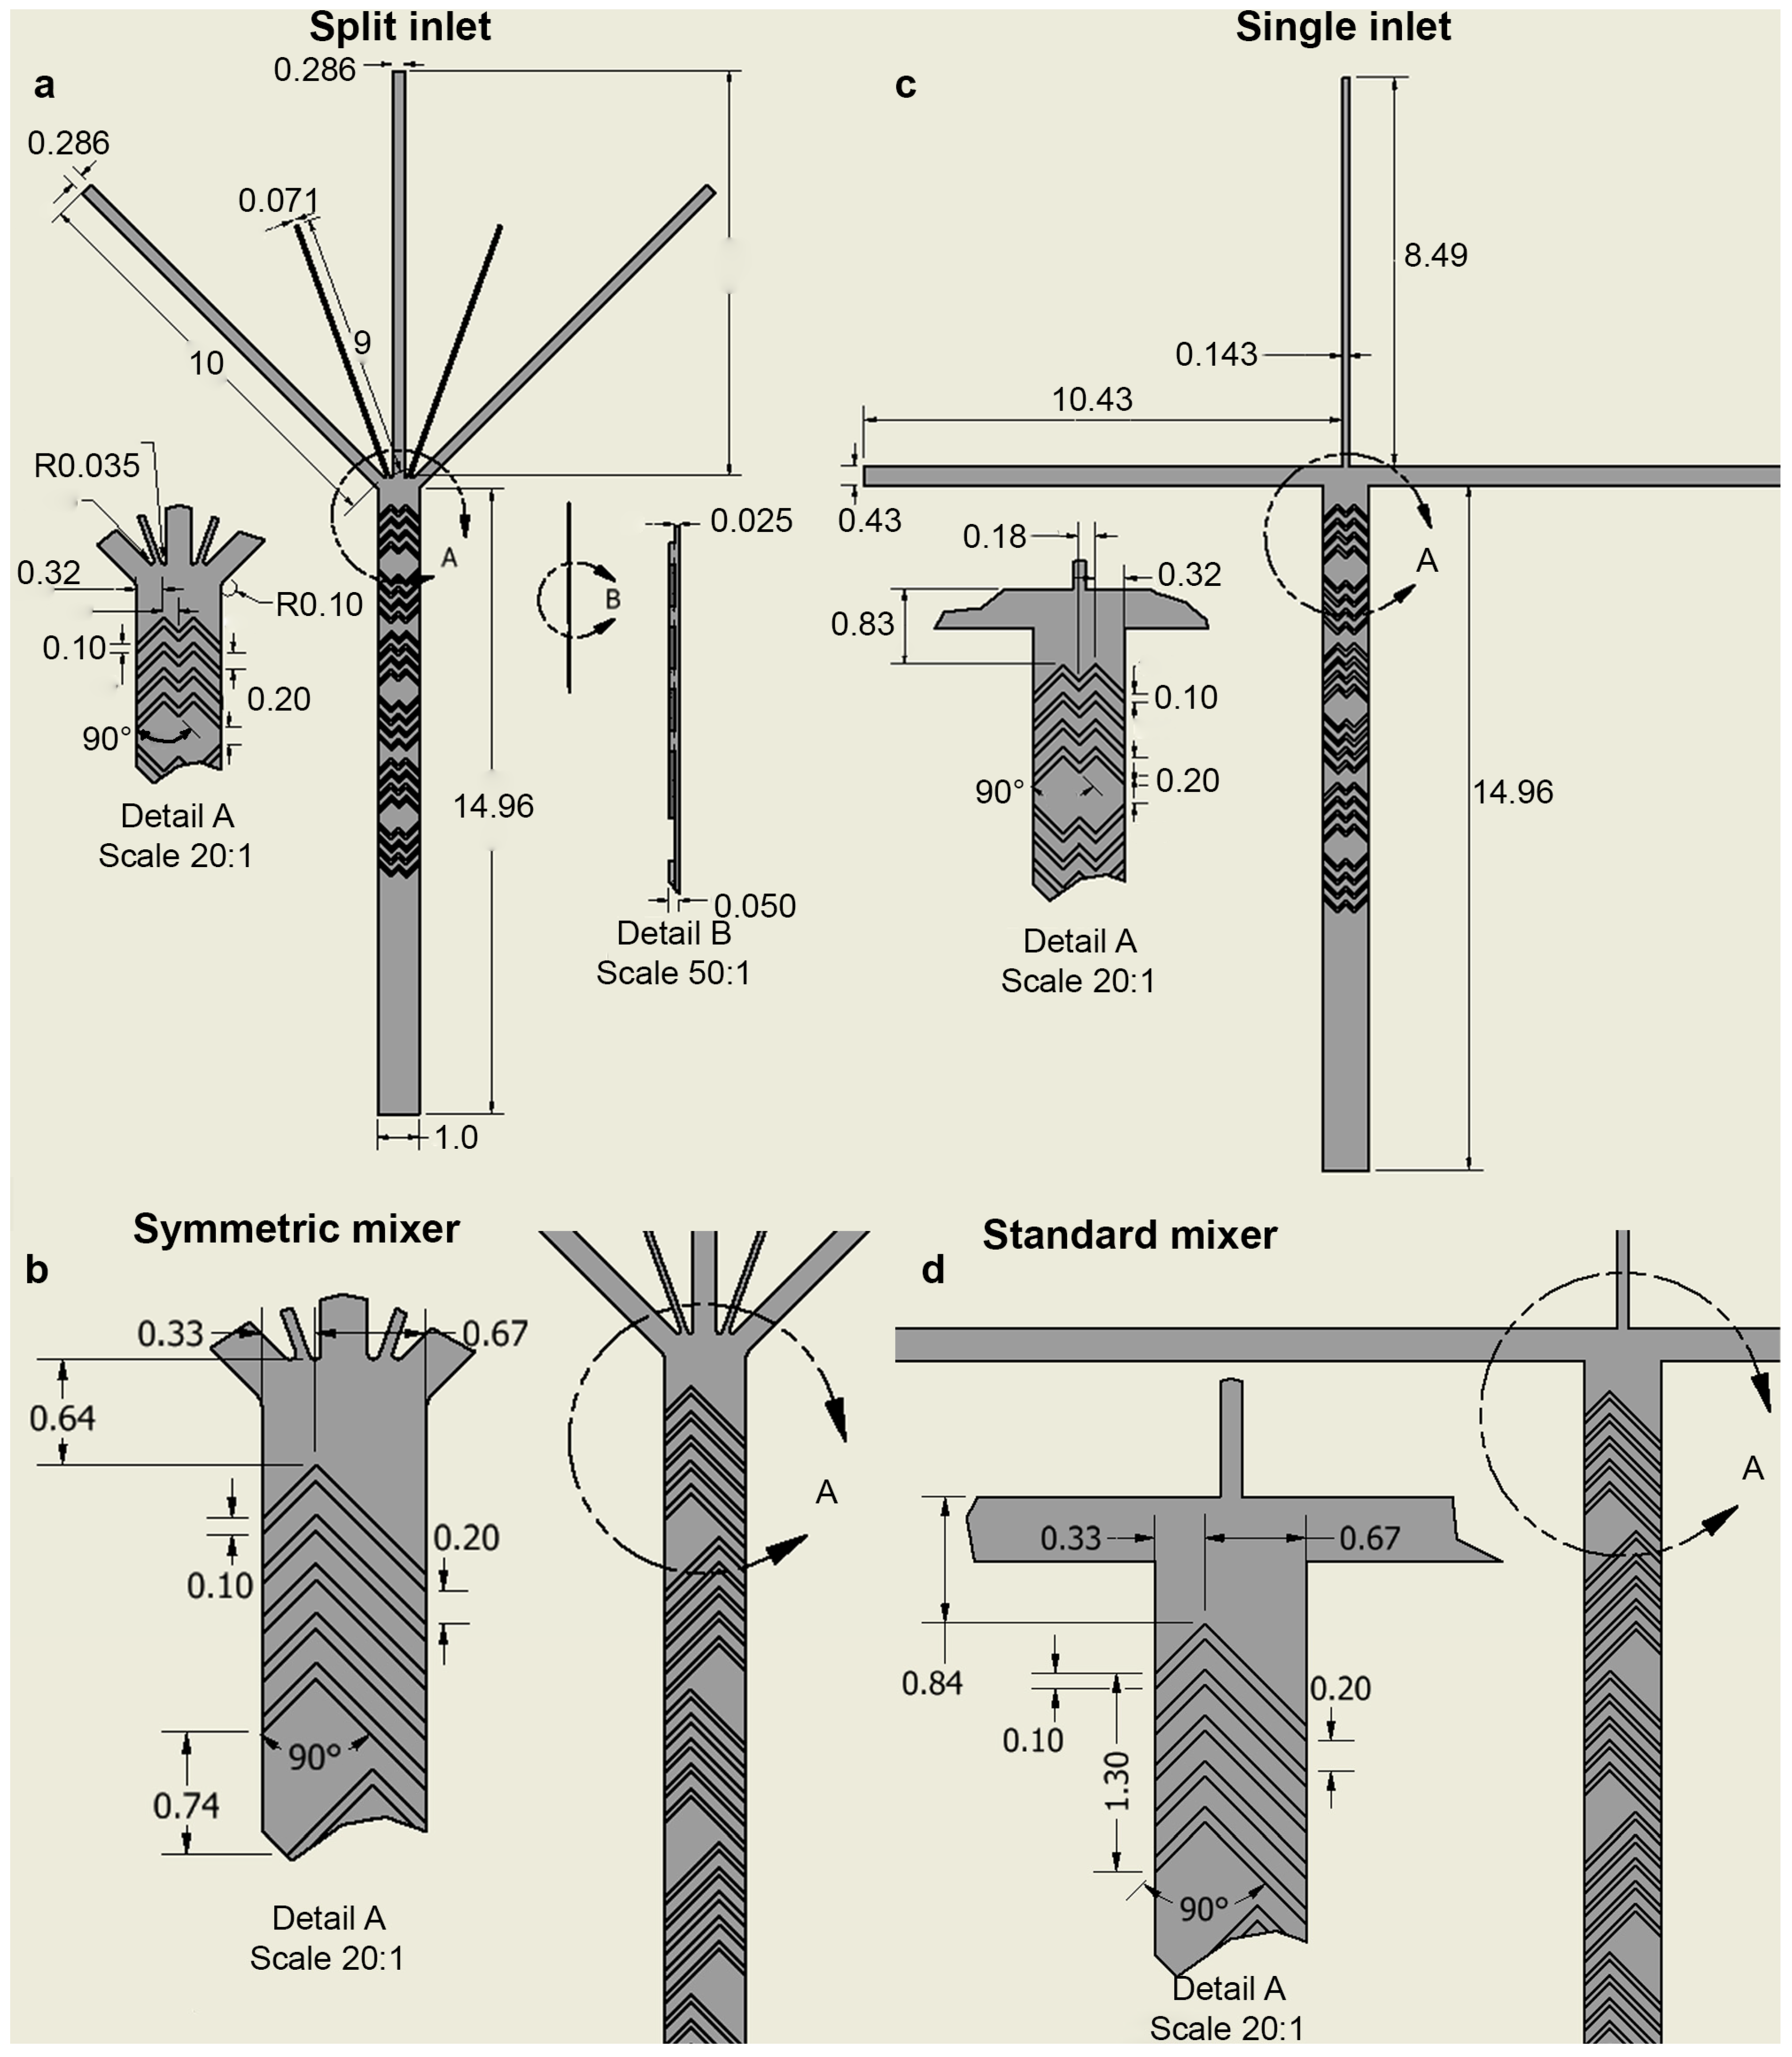
2.1. Device Design of Inlet and Passive Micromixers
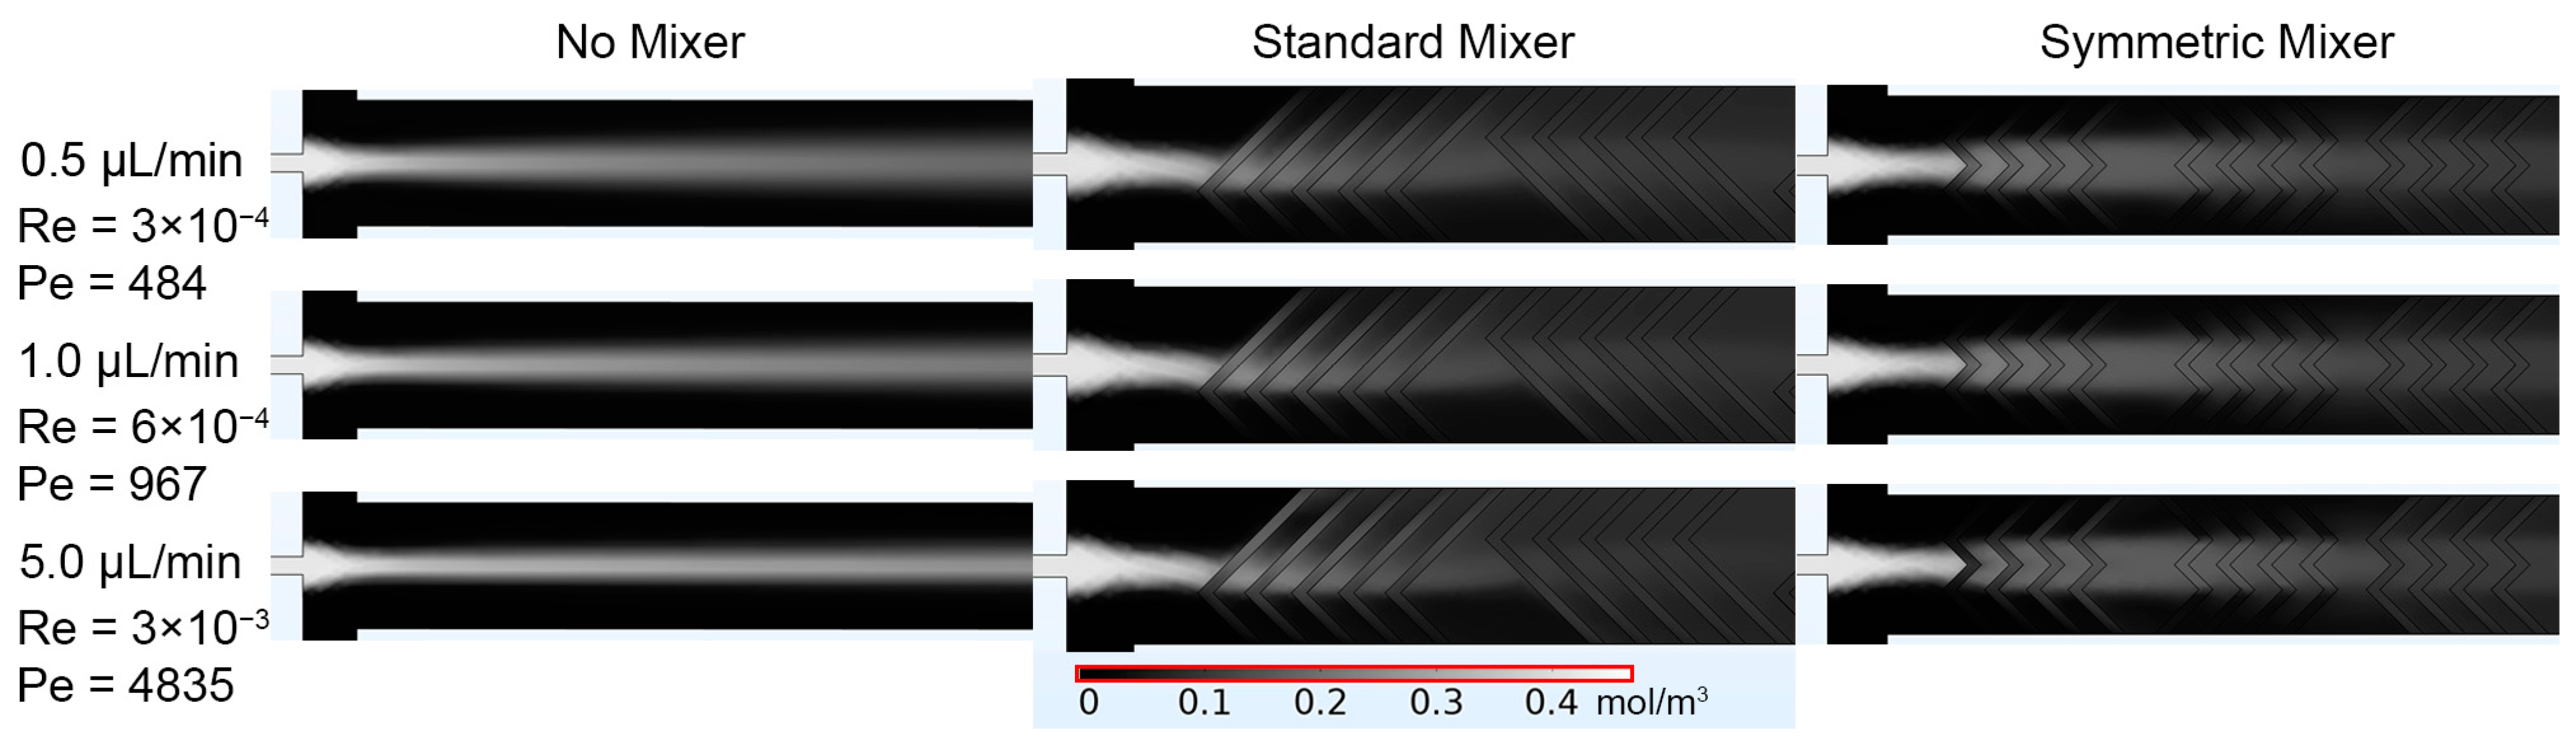
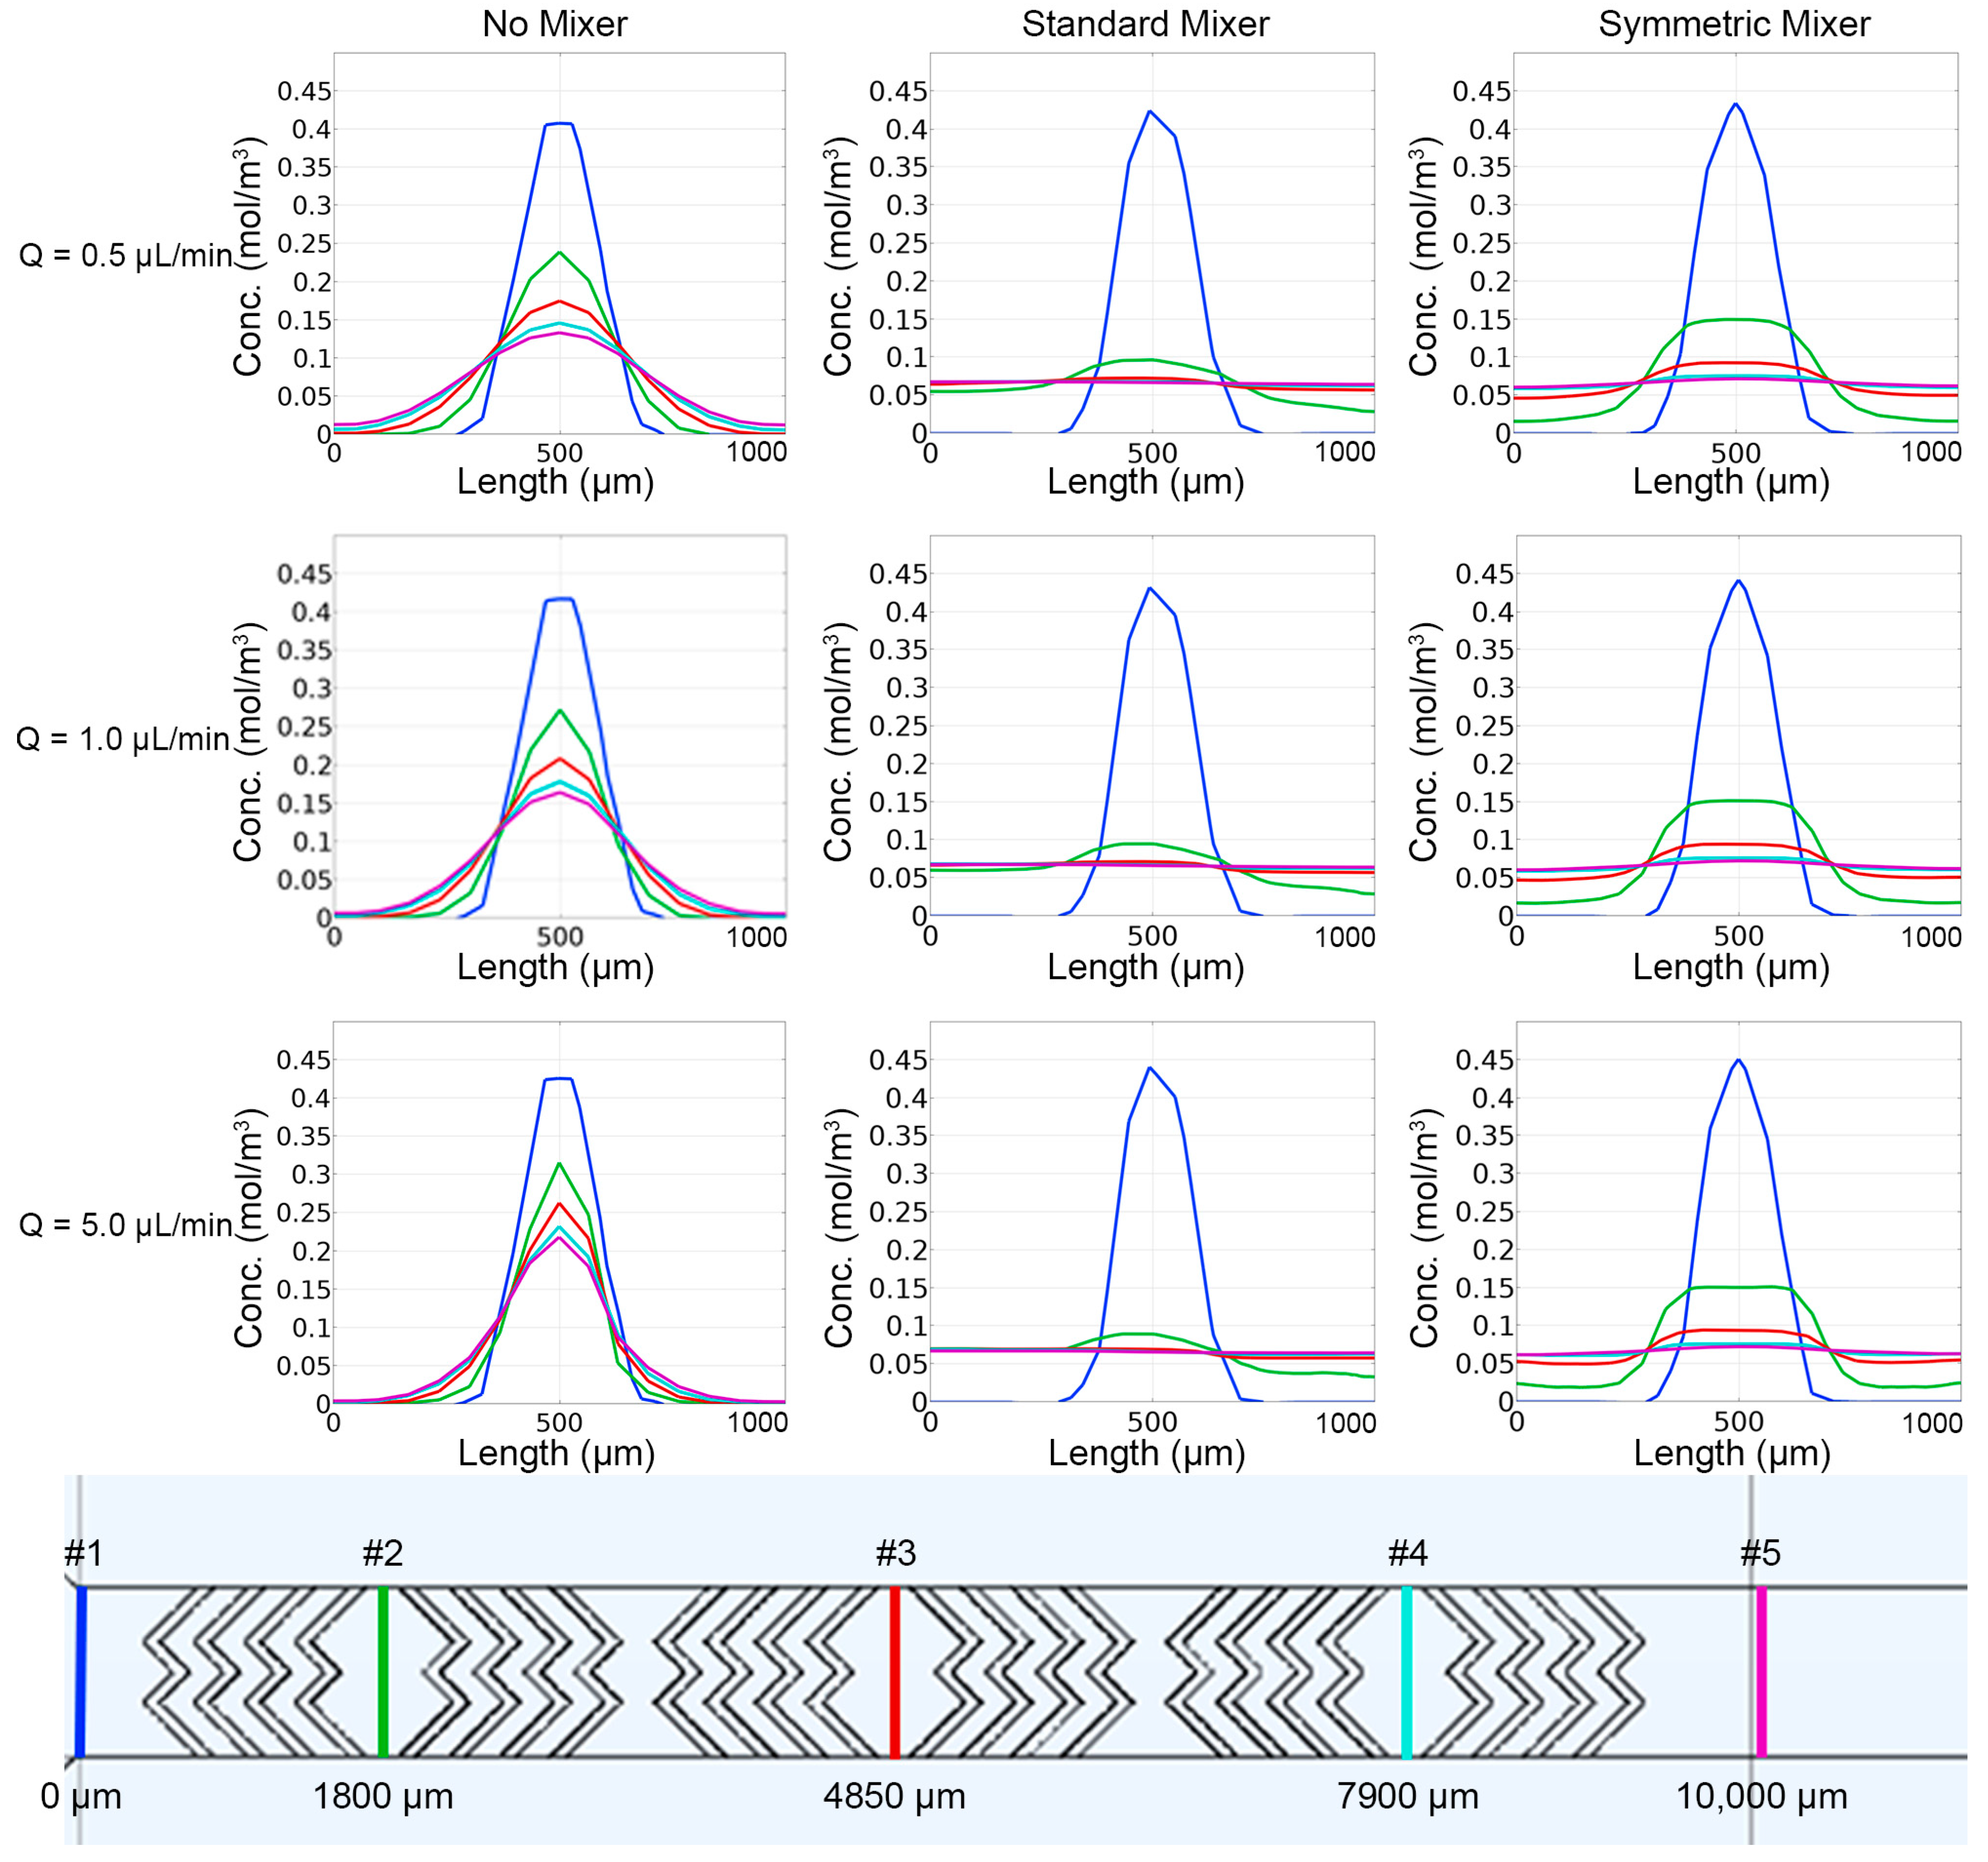
2.2. COMSOL Modeling of Prototyped Designs
2.3. Fabrication and Preliminary Testing
2.3.1. Soft Lithography Fabrication of Chips
2.3.2. Device Setup and Operation
2.3.3. Experimental Evaluation of Prototyped Designs
2.4. Application of the MAGS
2.4.1. Fish Husbandry
2.4.2. Recording Zebrafish Sperm Activation
2.5. Statistical Analysis
3. Results
3.1. Design of Inlet and Passive Micromixer Geometries
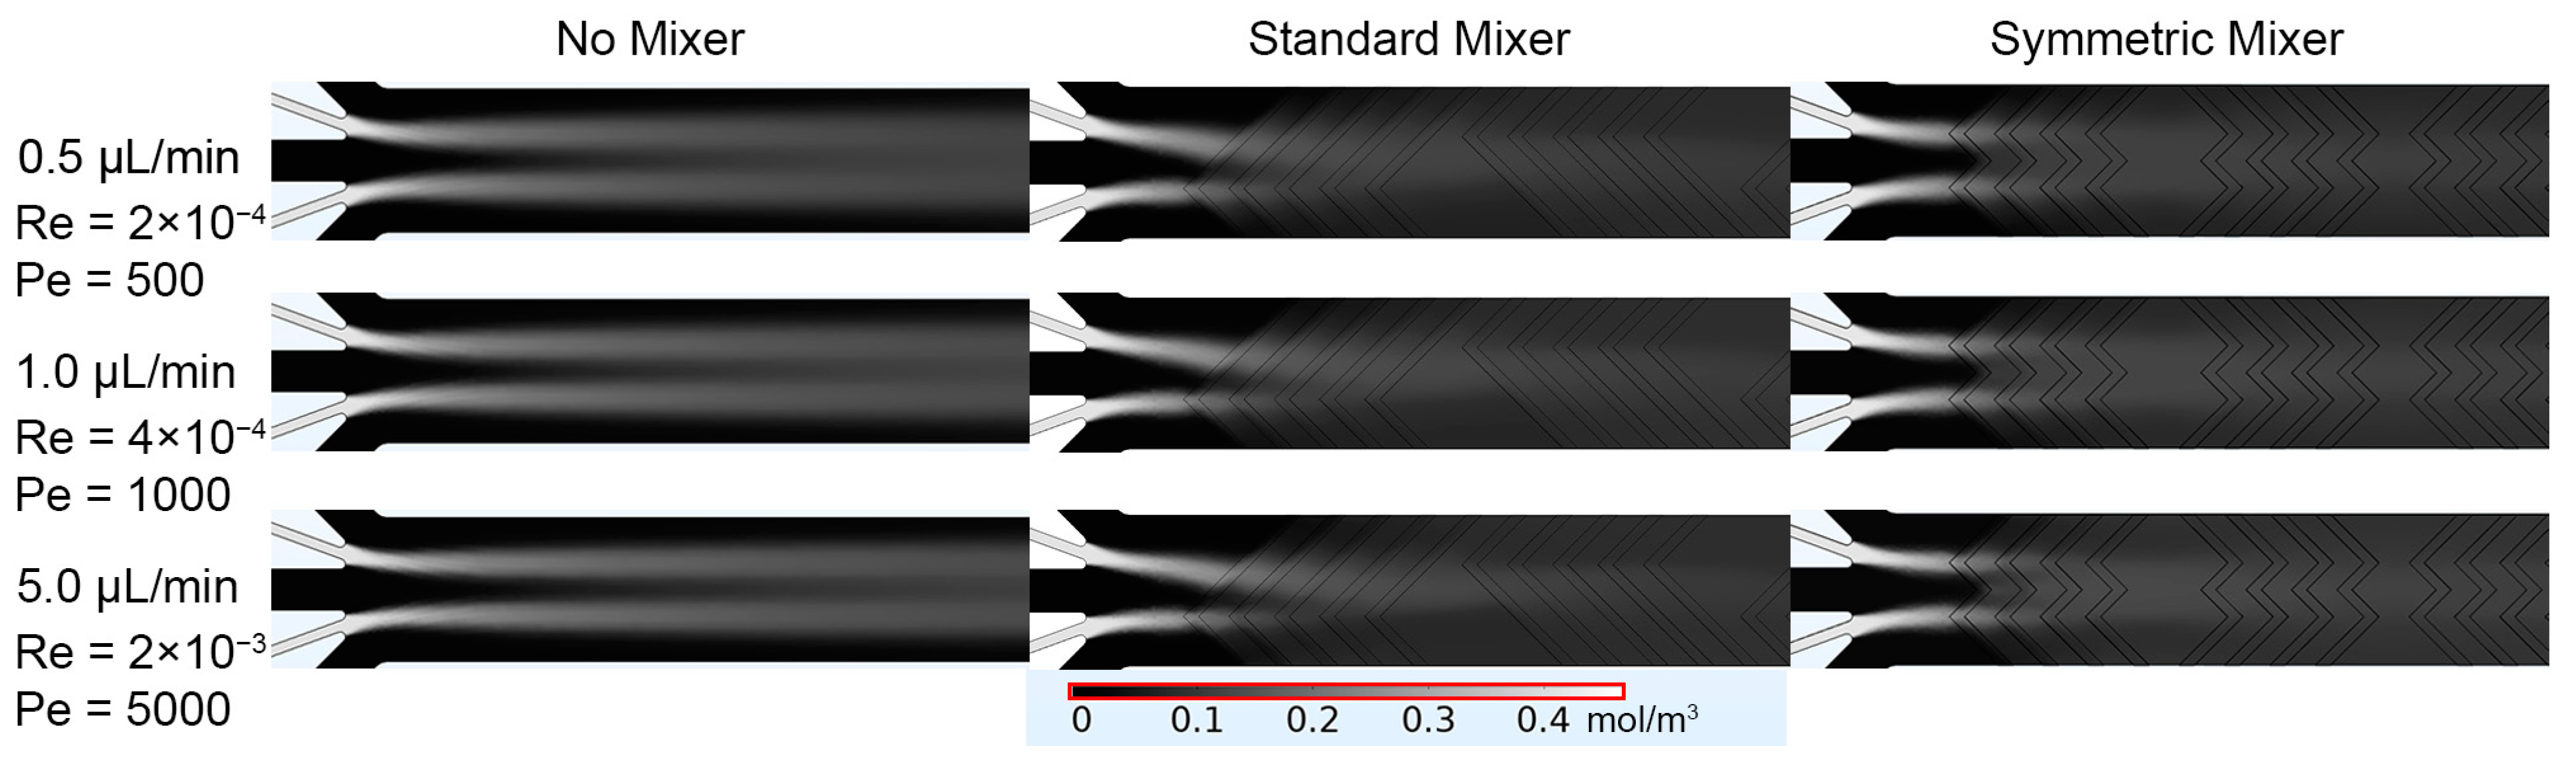
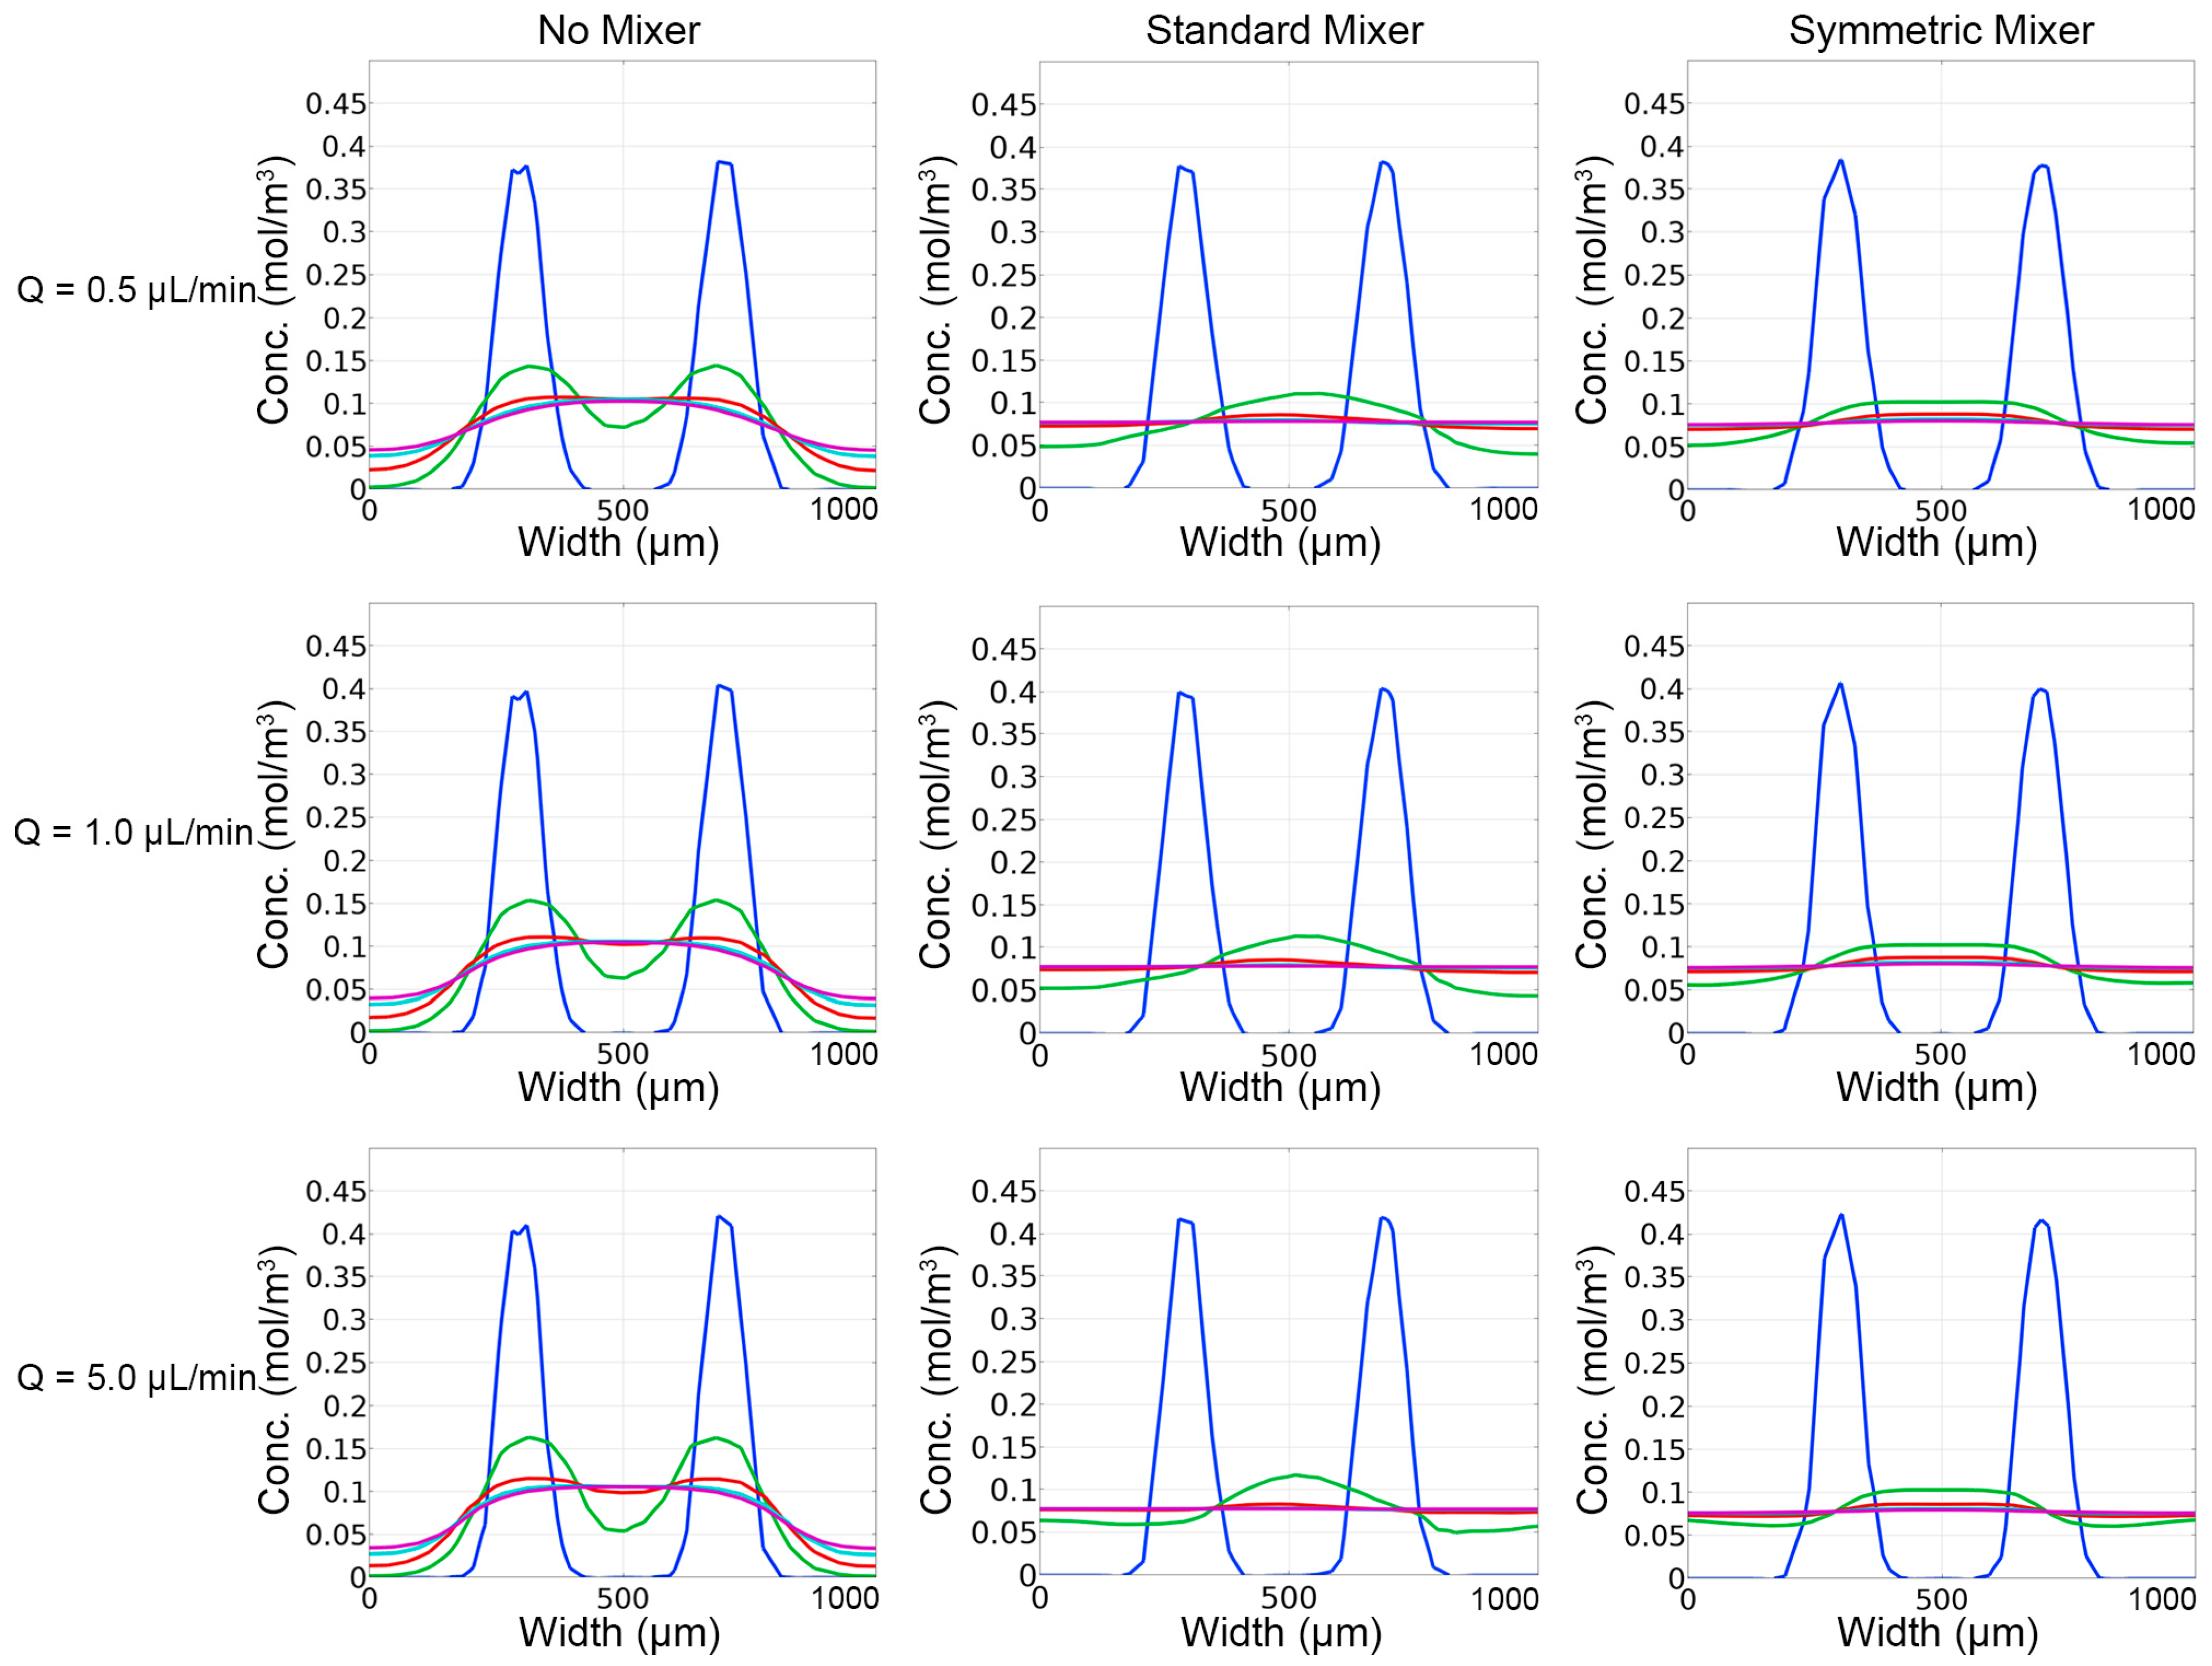
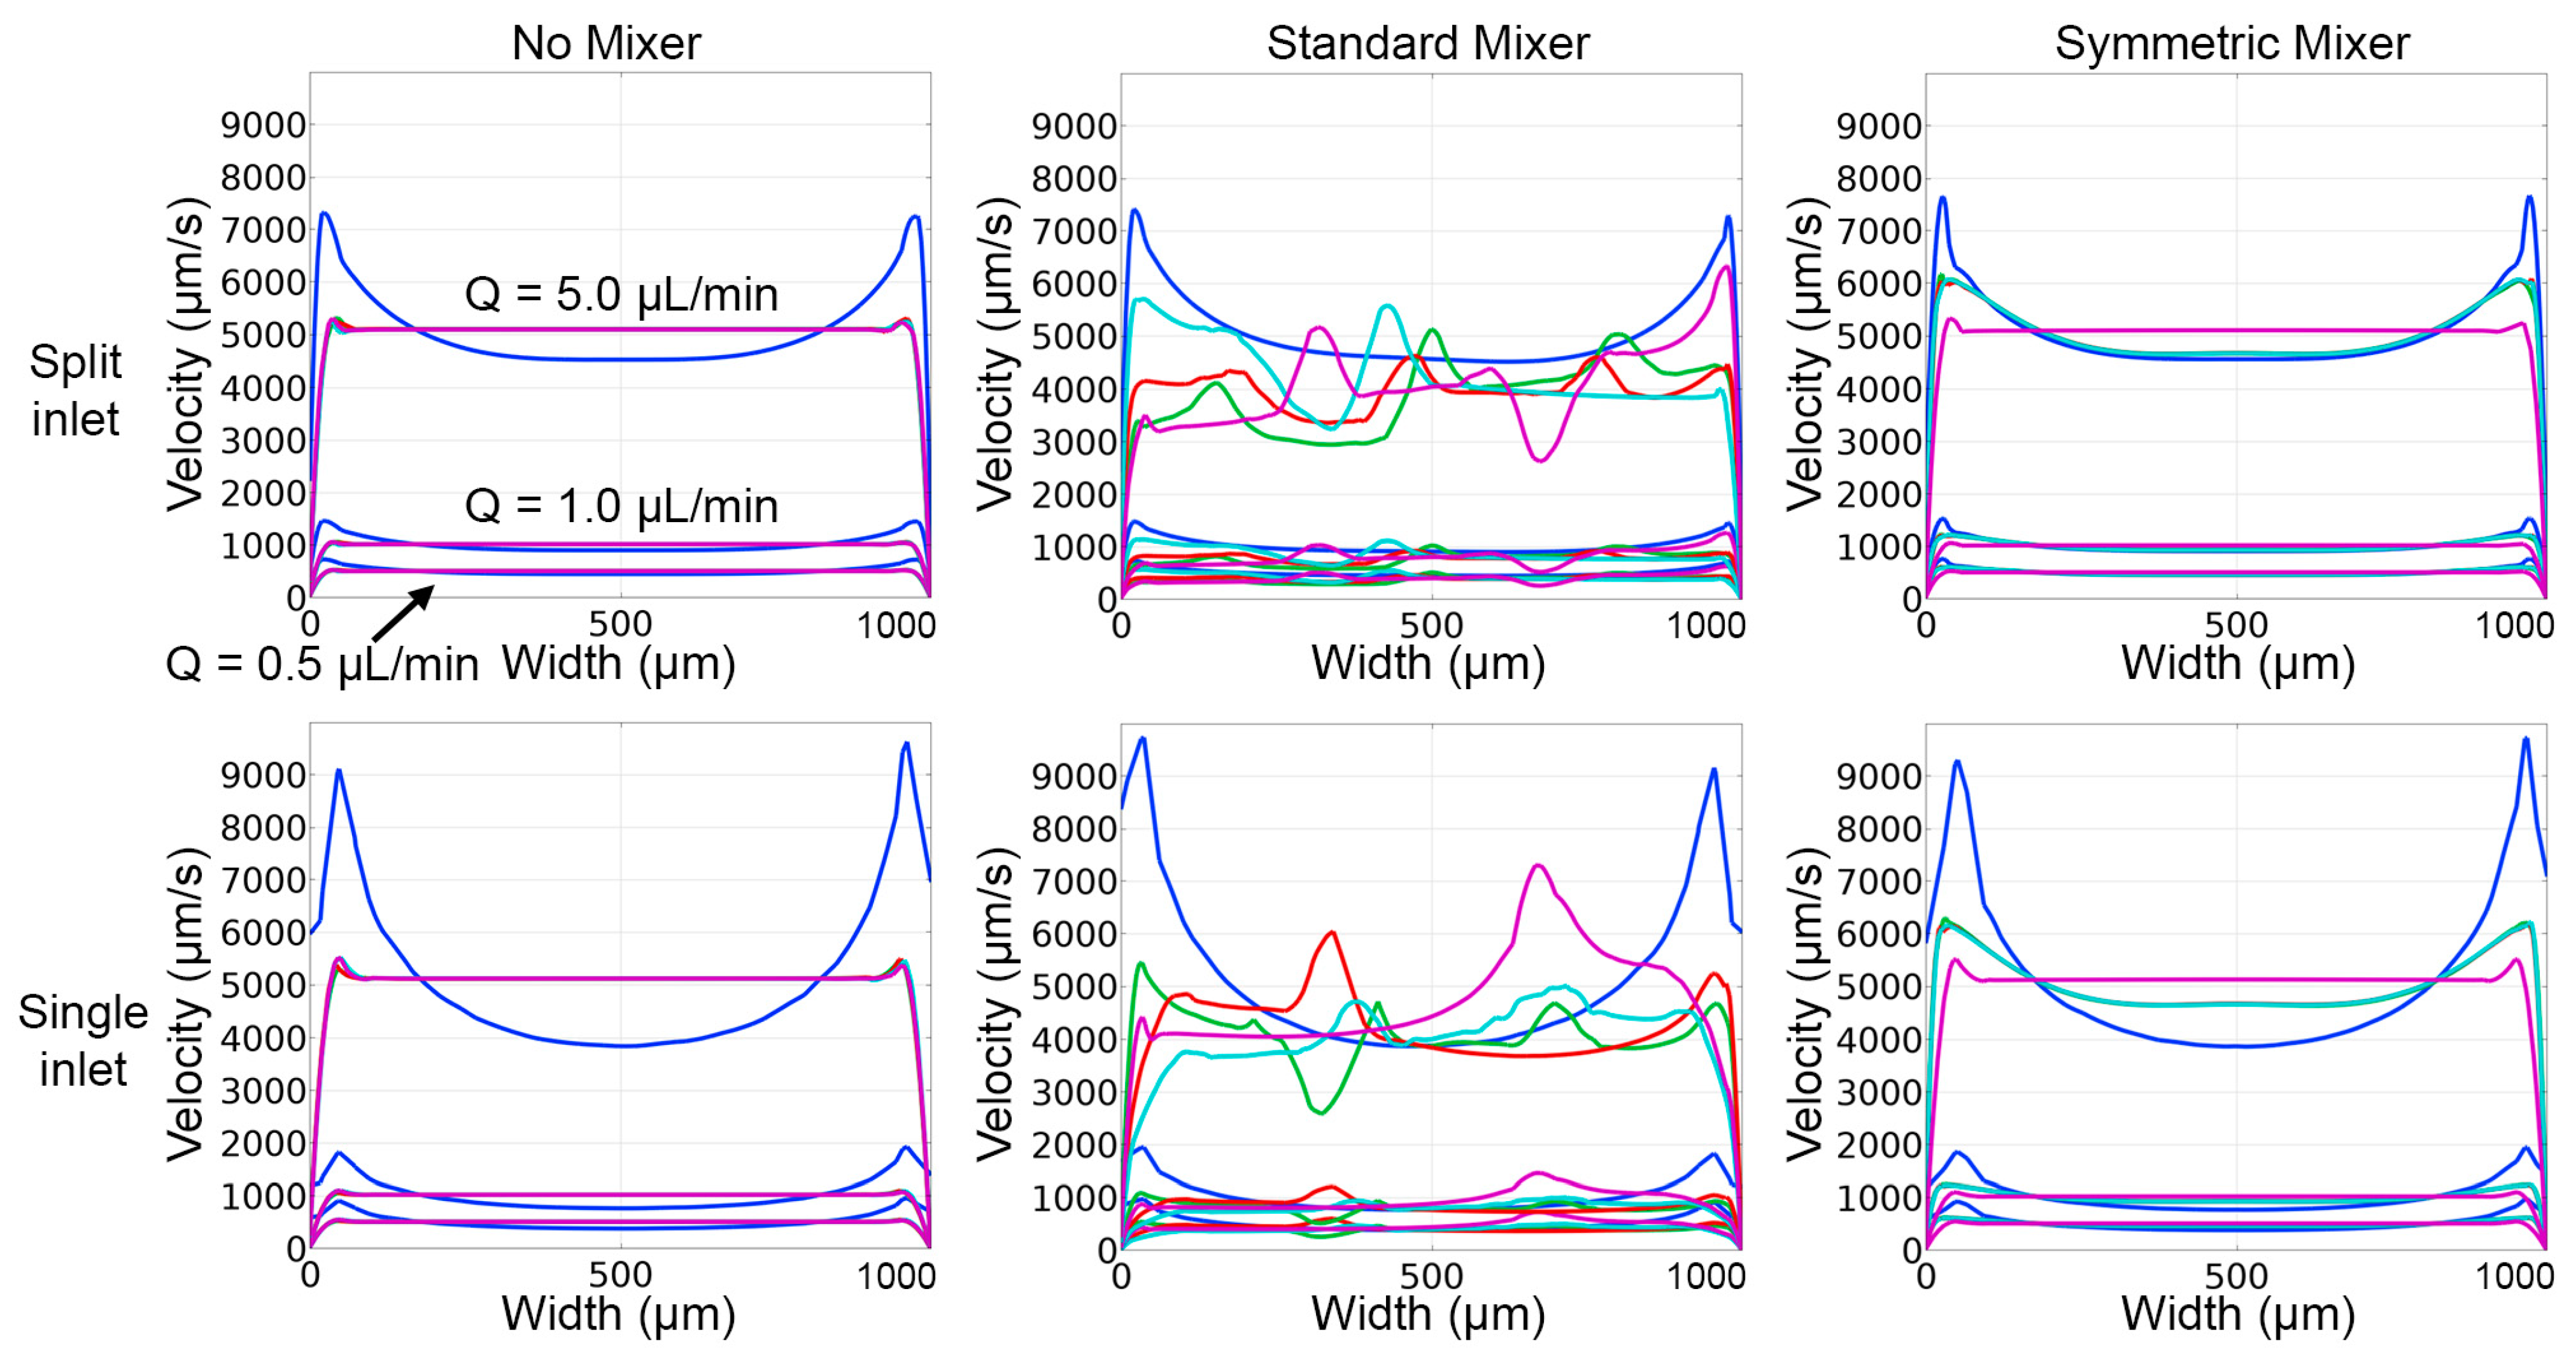
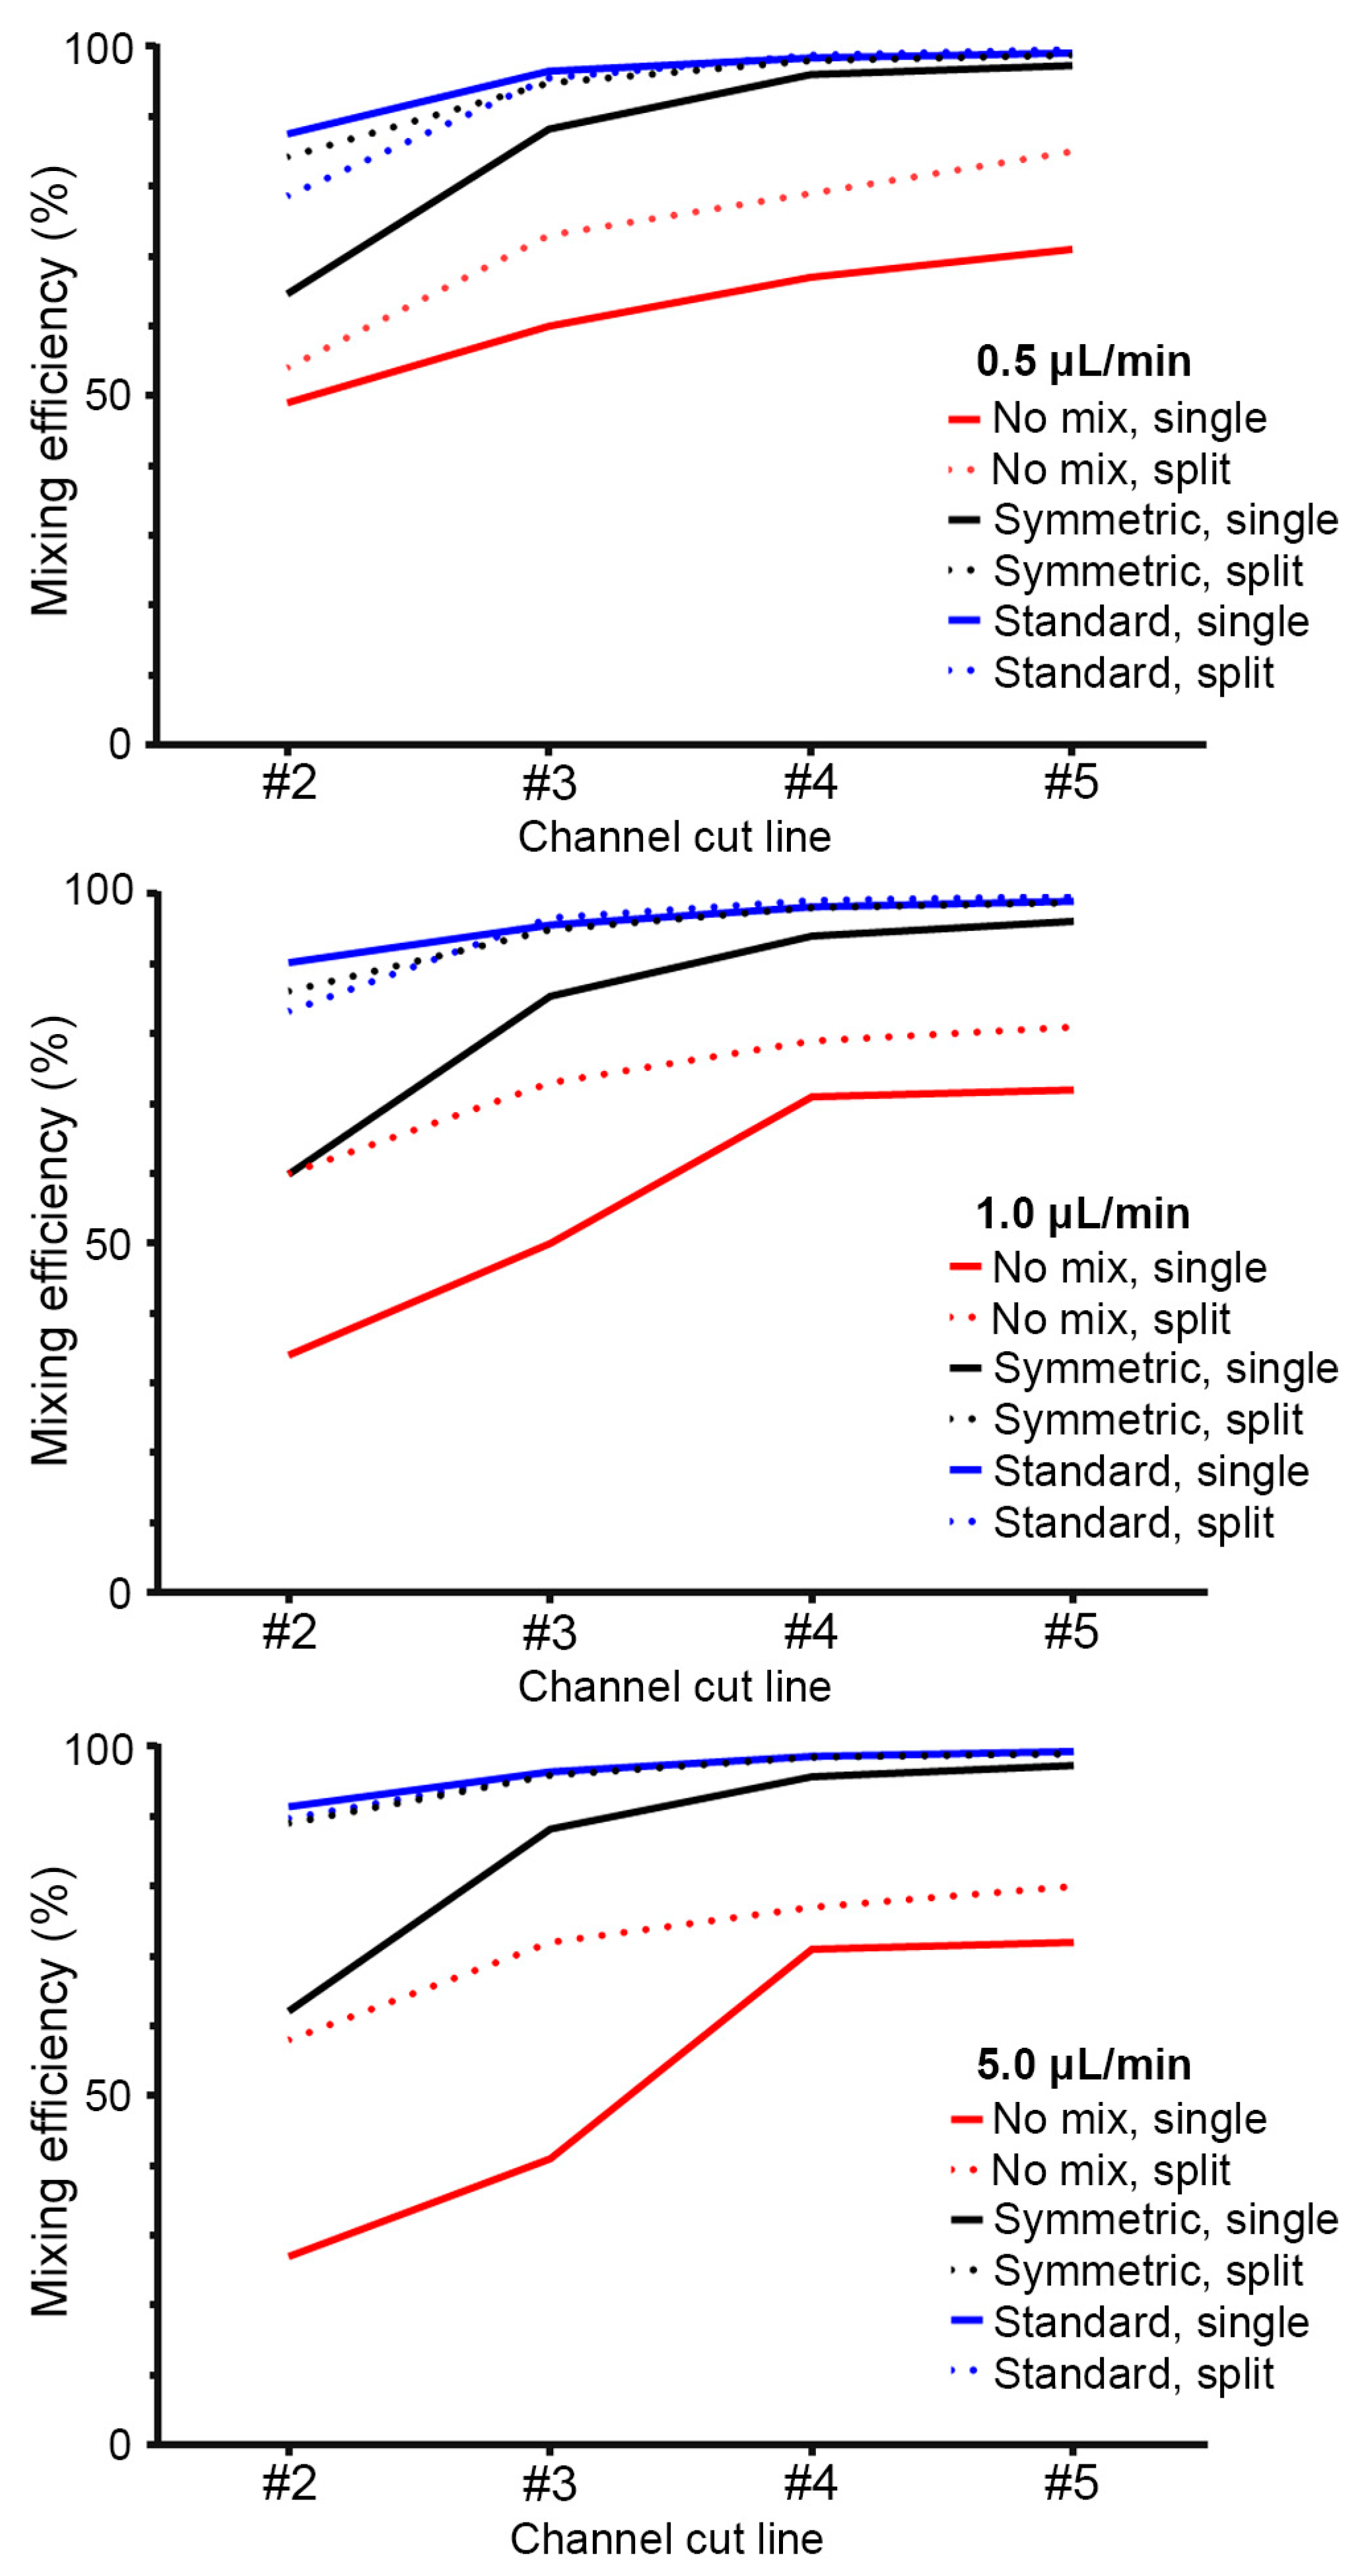
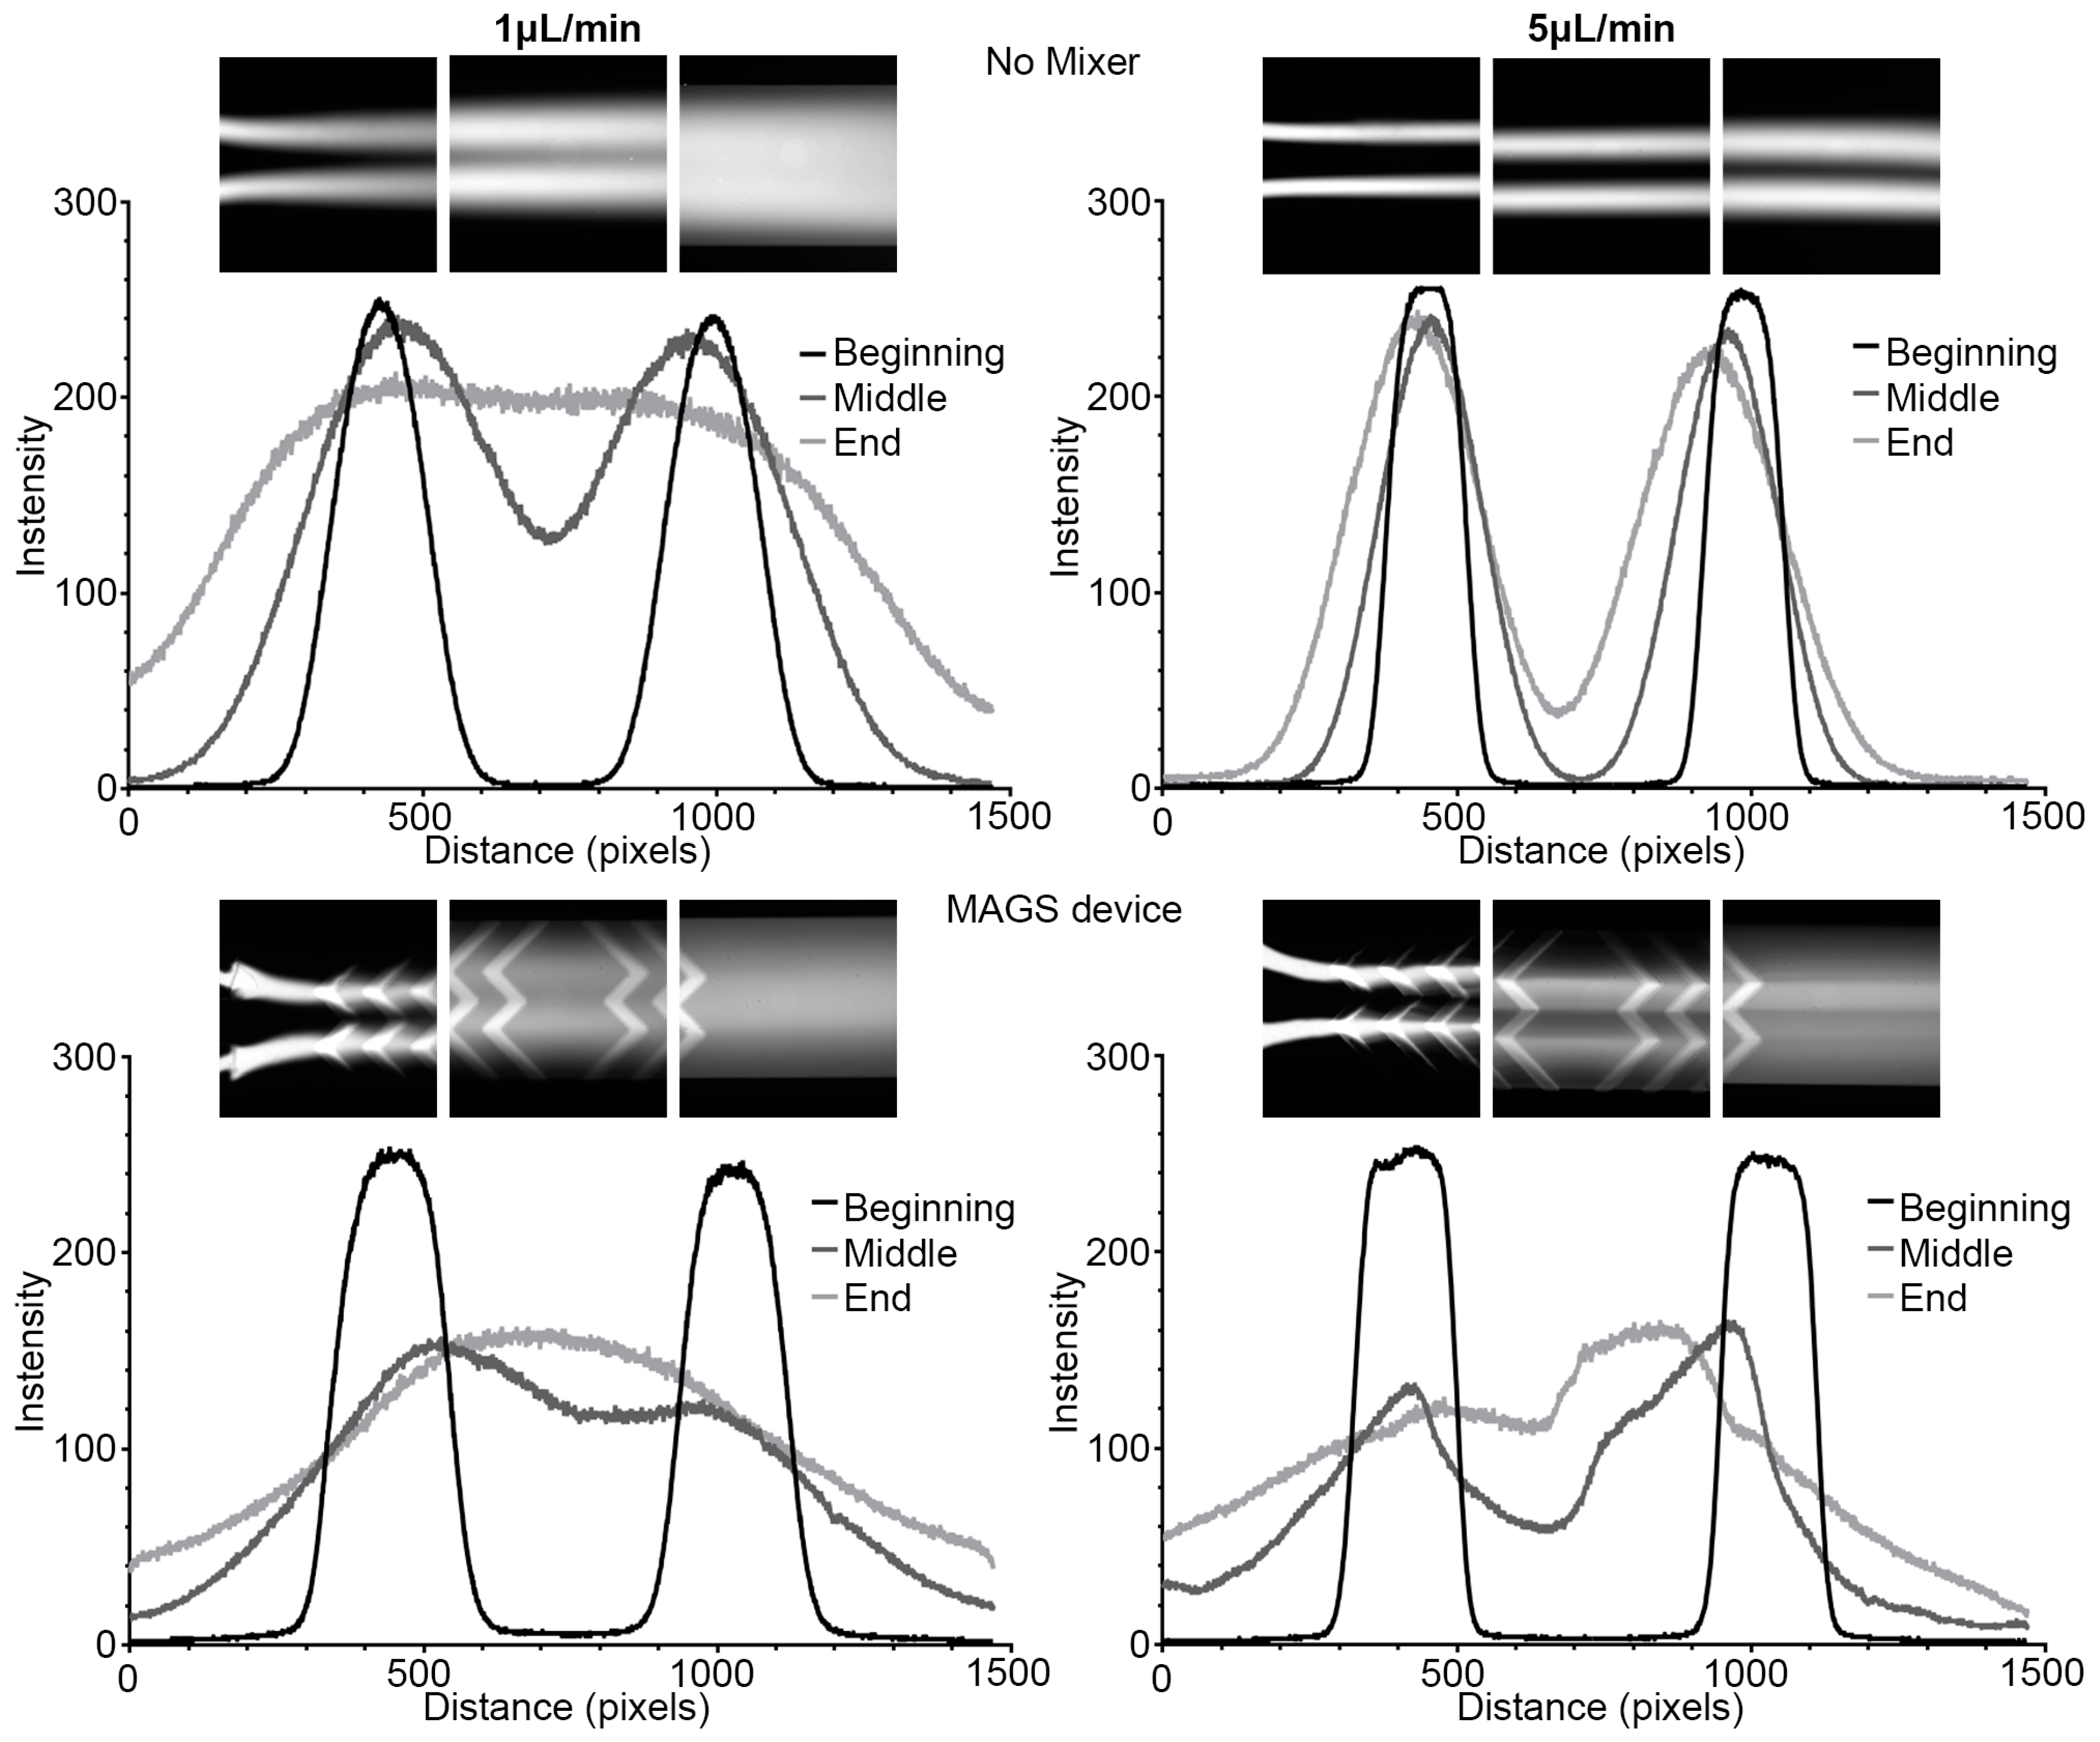
3.2. COMSOL Modeling of Prototyped Designs
3.3. Fabrication and Preliminary Testing
3.3.1. Device Setup and Operation
3.3.2. Experimental Evaluation of Prototyped Designs
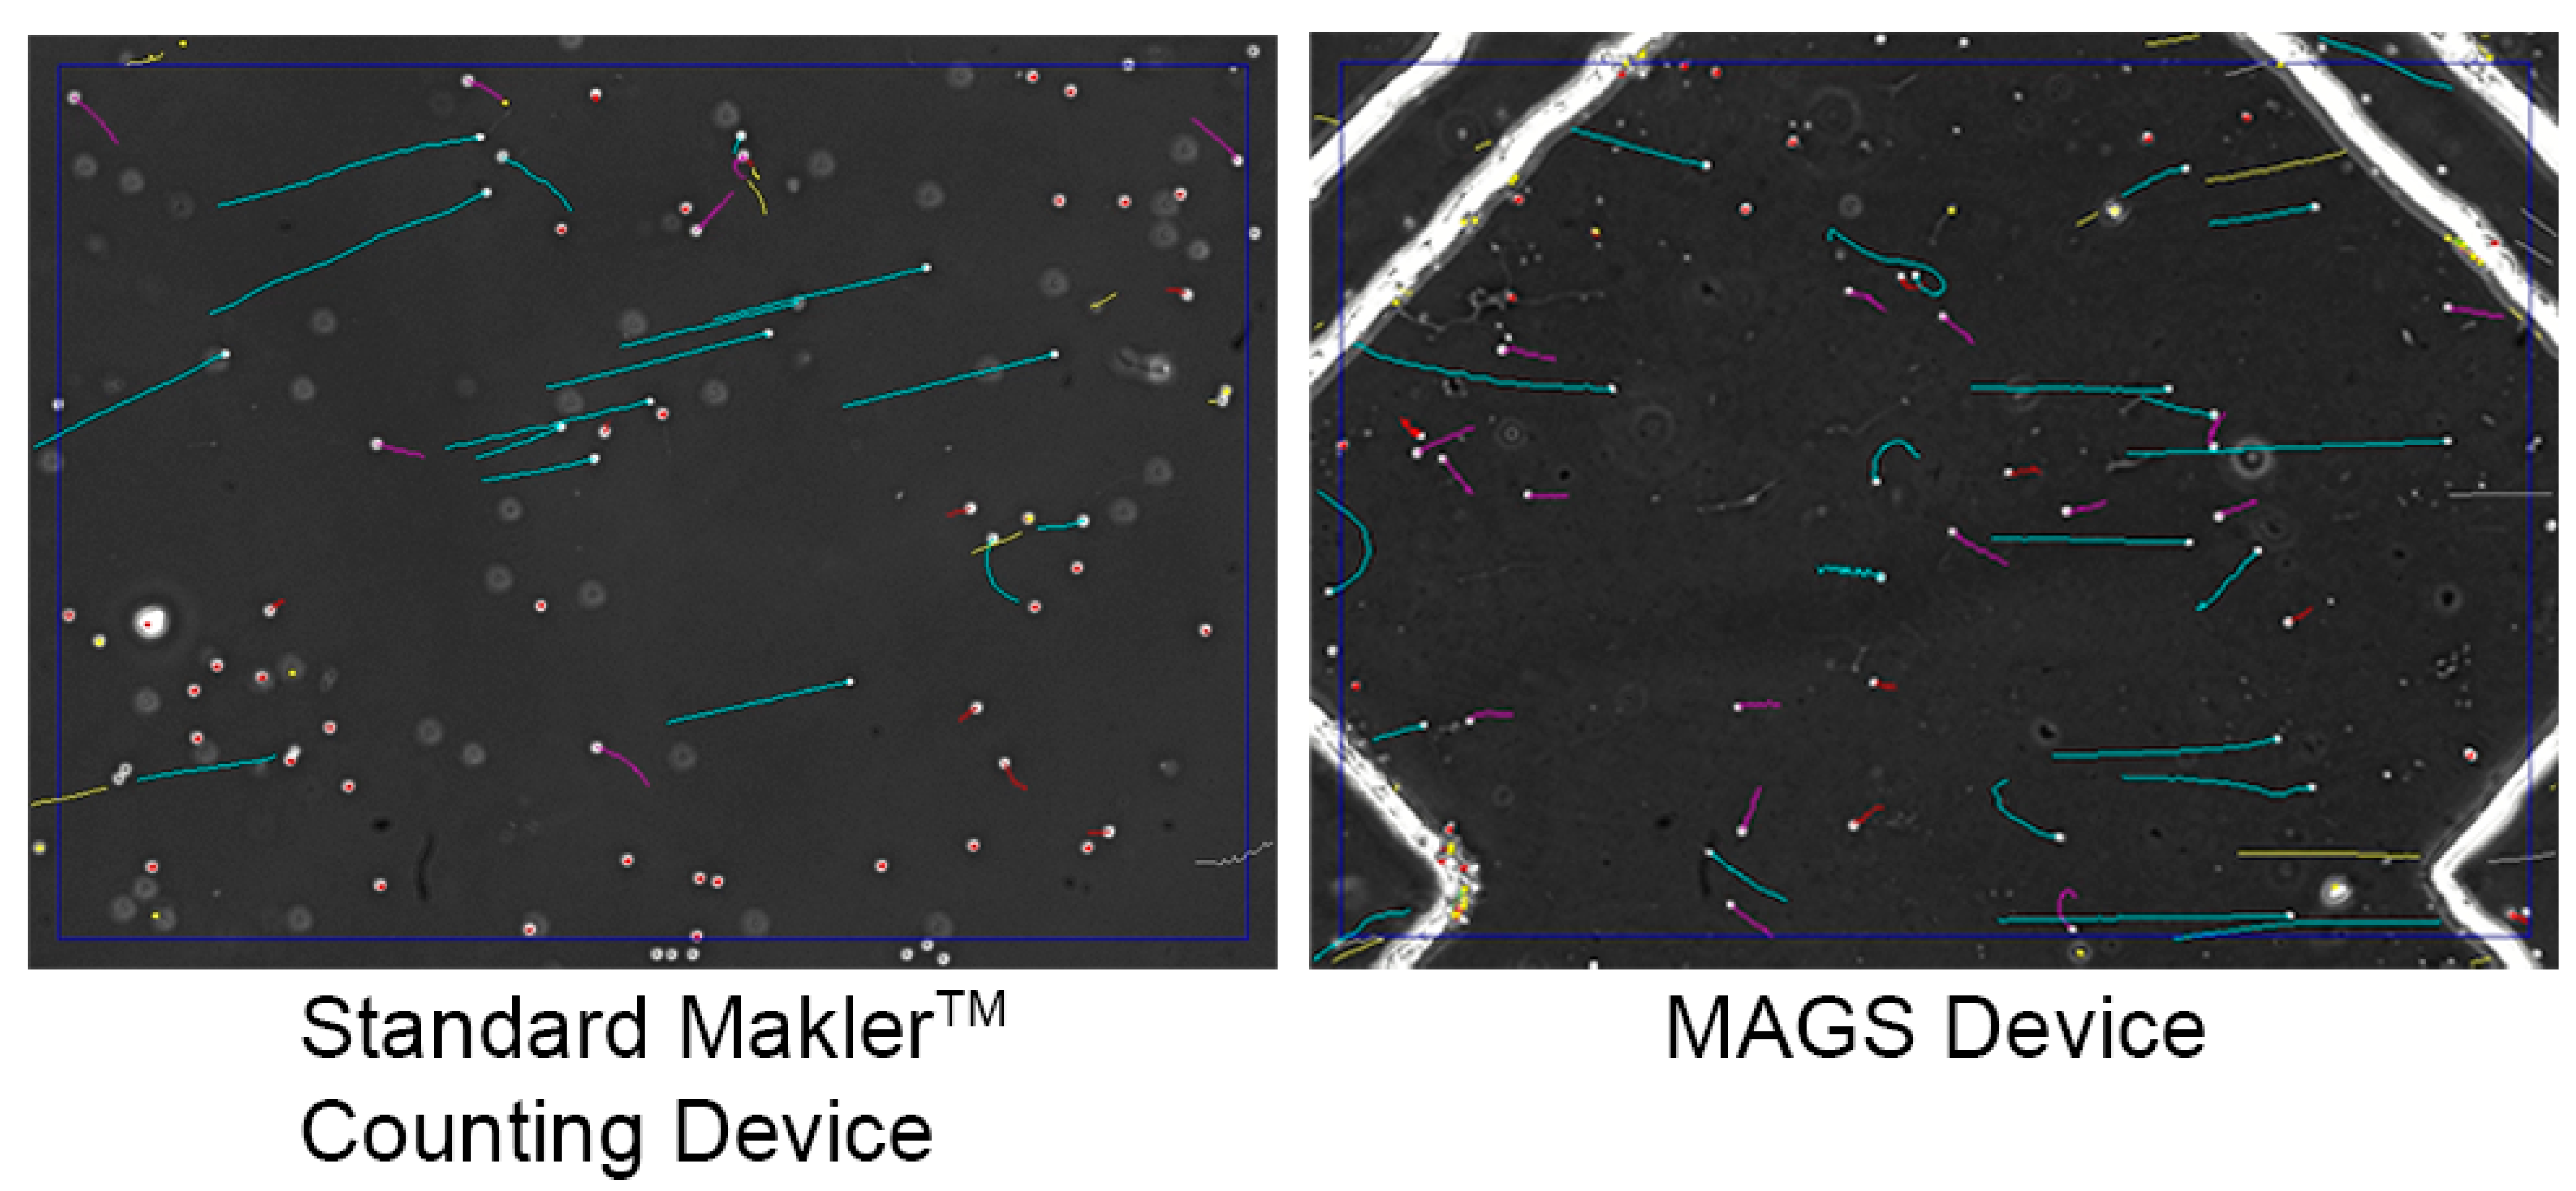
3.4. Zebrafish Sperm Activation Using the MAGS
4. Discussion
5. Conclusions
Author Contributions
Funding
Institutional Review Board Statement
Data Availability Statement
Acknowledgments
Conflicts of Interest
References
- Fauvel, C.; Suquet, M.; Cosson, J. Evaluation of fish sperm quality. J. Appl. Ichthyol. 2010, 26, 636–643. [Google Scholar] [CrossRef] [Green Version]
- Alavi, S.M.; Cosson, J. Sperm motility in fishes. I. Effects of temperature and pH: A review. Cell Biol. Int. 2005, 29, 101–110. [Google Scholar] [CrossRef] [PubMed]
- Amann, R.P.; Waberski, D. Computer-assisted sperm analysis (CASA): Capabilities and potential developments. Theriogenology 2014, 81, 5–17.e3. [Google Scholar] [CrossRef] [PubMed]
- Chan, S.Y.; Wang, C.; Song, B.L.; Lo, T.; Leung, A.; Tsoi, W.L.; Leung, J. Computer-assisted image analysis of sperm concentration in human semen before and after swim-up separation: Comparison with assessment by haemocytometer. Int. J. Androl. 1989, 12, 339–345. [Google Scholar] [CrossRef]
- Liu, Y.; Blackburn, H.; Taylor, S.S.; Tiersch, T.R. Development of germplasm repositories to assist conservation of endangered fishes: Examples from small-bodied livebearing fishes. Theriogenology 2019, 135, 138–151. [Google Scholar] [CrossRef]
- Hagedorn, M.; Varga, Z.; Walter, R.B.; Tiersch, T.R. Workshop report: Cryopreservation of aquatic biomedical models. Cryobiology 2019, 86, 120–129. [Google Scholar] [CrossRef] [PubMed]
- Nosrati, R.; Graham, P.J.; Zhang, B.; Riordon, J.; Lagunov, A.; Hannam, T.G.; Escobedo, C.; Jarvi, K.; Sinton, D. Microfluidics for sperm analysis and selection. Nat. Rev. Urol. 2017, 14, 707–730. [Google Scholar] [CrossRef]
- Chinnasamy, T.; Kingsley, J.L.; Inci, F.; Turek, P.J.; Rosen, M.P.; Behr, B.; Tuzel, E.; Demirci, U. Guidance and Self-Sorting of Active Swimmers: 3D Periodic Arrays Increase Persistence Length of Human Sperm Selecting for the Fittest. Adv. Sci. 2018, 5, 1700531. [Google Scholar] [CrossRef]
- Asghar, W.; Velasco, V.; Kingsley, J.L.; Shoukat, M.S.; Shafiee, H.; Anchan, R.M.; Mutter, G.L.; Tüzel, E.; Demirci, U. Selection of functional human sperm with higher DNA integrity and fewer reactive oxygen species. Adv. Healthc. Mater. 2014, 3, 1671–1679. [Google Scholar] [CrossRef]
- Kashaninejad, N.; Shiddiky, M.J.A.; Nguyen, N.-T. Advances in Microfluidics-Based Assisted Reproductive Technology: From Sperm Sorter to Reproductive System-on-a-Chip. Adv. Biosyst. 2018, 2, 1700197. [Google Scholar] [CrossRef]
- Vasilescu, S.A.; Khorsandi, S.; Ding, L.; Bazaz, S.R.; Nosrati, R.; Gook, D.; Warkiani, M.E. A microfluidic approach to rapid sperm recovery from heterogeneous cell suspensions. Sci. Rep. 2021, 11, 7917. [Google Scholar] [CrossRef]
- Phiphattanaphiphop, C.; Leksakul, K.; Phatthanakun, R.; Khamlor, T. A novel microfluidic chip-based sperm-sorting device constructed using design of experiment method. Sci. Rep. 2020, 10, 17143. [Google Scholar] [CrossRef]
- Jeon, H.; Cremers, C.; Le, D.; Abell, J.; Han, J. Multi-dimensional-double-spiral (MDDS) inertial microfluidic platform for sperm isolation directly from the raw semen sample. Sci. Rep. 2022, 12, 4212. [Google Scholar] [CrossRef]
- Weng, L. IVF-on-a-Chip: Recent Advances in Microfluidics Technology for In Vitro Fertilization. SLAS Technol. 2019, 24, 373–385. [Google Scholar] [CrossRef] [PubMed]
- Warkiani, M.E.; Vasilescu, S.; Ding, L.; Parast, F.Y.; Nosrati, R. A Biomimetic Microfluidic Selection Platform Providing Improved Sperm Quality Metrics Compared to Swim-Up. Res. Sq. 2022. [Google Scholar] [CrossRef]
- Cai, G.; Xue, L.; Zhang, H.; Lin, J. A Review on Micromixers. Micromachines 2017, 8, 274. [Google Scholar] [CrossRef]
- Wang, A.; Boroujeni, S.M.; Schneider, P.J.; Christie, L.B.; Mancuso, K.A.; Andreadis, S.T.; Oh, K.W. An Integrated Centrifugal Degassed PDMS-Based Microfluidic Device for Serial Dilution. Micromachines 2021, 12, 482. [Google Scholar] [CrossRef] [PubMed]
- Li, Z.H.; Zhang, B.L.; Dang, D.; Yang, X.L.; Yang, W.G.; Liang, W.F. A review of microfluidic-based mixing methods. Sens. Actuators A Phys. 2022, 344, 113757. [Google Scholar] [CrossRef]
- Serhan, M.; Jackemeyer, D.; Long, M.; Sprowls, M.; Perez, I.D.; Maret, W.; Chen, F.; Tao, N.; Forzani, E. Total Iron Measurement in Human Serum With a Novel Smartphone-Based Assay. IEEE J. Transl. Eng. Health Med. 2020, 8, 2800309. [Google Scholar] [CrossRef]
- Ren, Y.; Liu, W.; Tao, Y.; Hui, M.; Wu, Q. On AC-Field-Induced Nonlinear Electroosmosis next to the Sharp Corner-Field-Singularity of Leaky Dielectric Blocks and Its Application in on-Chip Micro-Mixing. Micromachines 2018, 9, 102. [Google Scholar] [CrossRef] [Green Version]
- Chen, C.-C.; Diamond, P.H. Potential Vorticity Mixing in a Tangled Magnetic Field. Astrophys. J. 2020, 892, 24. [Google Scholar] [CrossRef]
- Nam, J.; Lim, C.S. Micromixing using swirling induced by three-dimensional dual surface acoustic waves (3D-dSAW). Sens. Actuators B Chem. 2018, 255, 3434–3440. [Google Scholar] [CrossRef]
- Mirzajani, H.; Cheng, C.; Wu, J.; Ivanoff, C.S.; Najafi Aghdam, E.; Badri Ghavifekr, H. Design and characterization of a passive, disposable wireless AC-electroosmotic lab-on-a-film for particle and fluid manipulation. Sens. Actuators B Chem. 2016, 235, 330–342. [Google Scholar] [CrossRef]
- Ward, K.; Fan, Z.H. Mixing in microfluidic devices and enhancement methods. J. Micromech. Microeng. 2015, 25, 9. [Google Scholar] [CrossRef] [Green Version]
- Huang, P.-Y.; Panigrahi, B.; Lu, C.-H.; Huang, P.-F.; Chen, C.-Y. An artificial cilia-based micromixer towards the activation of zebrafish sperms. Sens. Actuators B Chem. 2017, 244, 541–548. [Google Scholar] [CrossRef]
- Panigrahi, B.; Lu, C.-H.; Ghayal, N.; Chen, C.-Y. Sperm activation through orbital and self-axis revolutions using an artificial cilia embedded serpentine microfluidic platform. Sci. Rep. 2018, 8, 4605. [Google Scholar] [CrossRef] [Green Version]
- Wang, X.; Liu, Z.; Cai, Y.; Wang, B.; Luo, X. A cost-effective serpentine micromixer utilizing ellipse curve. Anal. Chim. Acta 2021, 1155, 338355. [Google Scholar] [CrossRef]
- Cao, X.; Zhou, B.; Yu, C.; Liu, X. Droplet-based mixing characteristics in bumpy serpentine microchannel. Chem. Eng. Process. Process. Intensif. 2021, 159, 108246. [Google Scholar] [CrossRef]
- Chen, K.; Lu, H.; Sun, M.; Zhu, L.; Cui, Y. Mixing enhancement of a novel C-SAR microfluidic mixer. Chem. Eng. Res. Des. 2018, 132, 338–345. [Google Scholar] [CrossRef]
- Dai, B.; Long, Y.; Wu, J.; Huang, S.; Zhao, Y.; Zheng, L.; Tao, C.; Guo, S.; Lin, F.; Fu, Y.; et al. Generation of flow and droplets with an ultra-long-range linear concentration gradient. Lab Chip 2021, 21, 4390–4400. [Google Scholar] [CrossRef]
- Juraeva, M.; Kang, D.-J. Mixing Performance of a Passive Micro-Mixer with Mixing Units Stacked in Cross Flow Direction. Micromachines 2021, 12, 1530. [Google Scholar] [CrossRef]
- Oevreeide, I.H.; Zoellner, A.; Stokke, B.T. Characterization of Mixing Performance Induced by Double Curved Passive Mixing Structures in Microfluidic Channels. Micromachines 2021, 12, 556. [Google Scholar] [CrossRef]
- Stroock, A.D.; Dertinger, S.K.W.; Ajdari, A.; Mezić, I.; Stone, H.A.; Whitesides, G.M. Chaotic Mixer for Microchannels. Science 2002, 295, 647–651. [Google Scholar] [CrossRef] [Green Version]
- Kee, S.P.; Gavriilidis, A. Design and characterisation of the staggered herringbone mixer. Chem. Eng. J. 2008, 142, 109–121. [Google Scholar] [CrossRef]
- Tofteberg, T.; Skolimowski, M.; Andreassen, E.; Geschke, O. A novel passive micromixer: Lamination in a planar channel system. Microfluid. Nanofluidics 2009, 8, 209–215. [Google Scholar] [CrossRef] [Green Version]
- Park, D.S.; Egnatchik, R.A.; Bordelon, H.; Tiersch, T.R.; Monroe, W.T. Microfluidic mixing for sperm activation and motility analysis of pearl Danio zebrafish. Theriogenology 2012, 78, 334–344. [Google Scholar] [CrossRef] [Green Version]
- Scherr, T.; Quitadamo, C.; Tesvich, P.; Park, D.S.; Tiersch, T.; Hayes, D.; Choi, J.W.; Nandakumar, K.; Monroe, W.T. A Planar Microfluidic Mixer Based on Logarithmic Spirals. J. Micromech Microeng 2012, 22, 55019. [Google Scholar] [CrossRef] [Green Version]
- Beckham, J.; Alam, F.; Omojola, V.; Scherr, T.; Guitreau, A.; Melvin, A.; Park, D.S.; Choi, J.W.; Tiersch, T.R.; Todd Monroe, W. A microfluidic device for motility and osmolality analysis of zebrafish sperm. Biomed. Microdevices 2018, 20, 67. [Google Scholar] [CrossRef]
- Jing, R.; Huang, C.; Bai, C.; Tanguay, R.; Dong, Q. Optimization of activation, collection, dilution, and storage methods for zebrafish sperm. Aquaculture 2009, 290, 165–171. [Google Scholar] [CrossRef]
- Neils, C.; Tyree, Z.; Finlayson, B.; Folch, A. Combinatorial mixing of microfluidic streams. Lab Chip 2004, 4, 342–350. [Google Scholar] [CrossRef] [PubMed]
- Kim, C.; Lee, K.; Kim, J.H.; Shin, K.S.; Lee, K.-J.; Kim, T.S.; Kang, J.Y. A serial dilution microfluidic device using a ladder network generating logarithmic or linear concentrations. Lab Chip 2008, 8, 473. [Google Scholar] [CrossRef]
- Grigorov, E.; Kirov, B.; Marinov, M.B.; Galabov, V. Review of Microfluidic Methods for Cellular Lysis. Micromachines 2021, 12, 498. [Google Scholar] [CrossRef] [PubMed]
- Ding, L.; Bazaz, S.R.; Fardjahromi, M.A.; McKinnirey, F.; Saputro, B.; Banerjee, B.; Vesey, G.; Warkiani, M.E. A modular 3D printed microfluidic system: A potential solution for continuous cell harvesting in large-scale bioprocessing. Bioresour. Bioprocess. 2022, 9, 64. [Google Scholar] [CrossRef]
- Stroock, A.D.; McGraw, G.J. Investigation of the staggered herringbone mixer with a simple analytical model. Philos. Trans. R. Soc. London Ser. A Math. Phys. Eng. Sci. 2004, 362, 971–986. [Google Scholar] [CrossRef]
- Casalini, T.; Salvalaglio, M.; Perale, G.; Masi, M.; Cavallotti, C. Diffusion and Aggregation of Sodium Fluorescein in Aqueous Solutions. J. Phys. Chem. B 2011, 115, 12896–12904. [Google Scholar] [CrossRef] [Green Version]
- Culbertson, C.T.; Jacobson, S.C.; Michael Ramsey, J. Diffusion coefficient measurements in microfluidic devices. Talanta 2002, 56, 365–373. [Google Scholar] [CrossRef] [PubMed]
- Johnson, T.J.; Ross, D.; Locascio, L.E. Rapid Microfluidic Mixing. Anal. Chem. 2002, 74, 45–51. [Google Scholar] [CrossRef]
- Blackburn, H.; Torres, L.; Liu, Y.; Tiersch, T.R. The Need for a Framework Addressing the Temporal Aspects of Fish Sperm Motility Leading to Community-Level Standardization. Zebrafish 2022, 19, 119–130. [Google Scholar] [CrossRef]
- Wilson-Leedy, J.G.; Ingermann, R.L. Development of a novel CASA system based on open source software for characterization of zebrafish sperm motility parameters. Theriogenology 2007, 67, 661–672. [Google Scholar] [CrossRef]
- Yang, H.; Carmichael, C.; Varga, Z.M.; Tiersch, T.R. Development of a simplified and standardized protocol with potential for high-throughput for sperm cryopreservation in zebrafish Danio rerio. Theriogenology 2007, 68, 128–136. [Google Scholar] [CrossRef] [Green Version]
- Lopez-Garcia, M.D.; Monson, R.L.; Haubert, K.; Wheeler, M.B.; Beebe, D.J. Sperm motion in a microfluidic fertilization device. Biomed. Microdevices 2008, 10, 709–718. [Google Scholar] [CrossRef]
- Liu, Y.; Torres, L.; Tiersch, T.R. Quality evaluation of sperm from livebearing fishes: Standardized assessment of sperm bundles (spermatozeugmata) from Xenotoca eiseni (Goodeidae). Theriogenology 2018, 107, 50–56. [Google Scholar] [CrossRef]
- Scherr, T.; Wu, C.L.; Monroe, W.T.; Nandakumar, K. Computational fluid dynamics as a tool to understand the motility of microorganisms. Comput. Fluids 2015, 114, 274–283. [Google Scholar] [CrossRef]
- Hadjigeorgiou, A.G.; Boudouvis, A.G.; Kokkoris, G. Thorough computational analysis of the staggered herringbone micromixer reveals transport mechanisms and enables mixing efficiency-based improved design. Chem. Eng. J. 2021, 414, 128775. [Google Scholar] [CrossRef]
- Schwing, M.J.; Liu, Y.; Belgodere, J.A.; Monroe, W.T.; Tiersch, T.R.; Abdelmoneim, A. Initial assessment of the toxicologic effects of leachates from 3-dimensional (3-D) printed objects on sperm quality in two model fish species. Aquat. Toxicol. 2023, 256, 106400. [Google Scholar] [CrossRef]
- Belgodere, J.A.; Liu, Y.; Reich, E.L.; Eades, J.; Tiersch, T.R.; Monroe, W.T. Development of a Single-Piece Sperm Counting Chamber (SSCC) for Aquatic Species. Fishes 2022, 7, 231. [Google Scholar] [CrossRef]
- Eddings, M.A.; Johnson, M.A.; Gale, B.K. Determining the optimal PDMS–PDMS bonding technique for microfluidic devices. J. Micromech. Microeng. 2008, 18, 067001. [Google Scholar] [CrossRef]
- Liu, Y.; Todd Monroe, W.; Belgodere, J.A.; Choi, J.W.; Teresa Gutierrez-Wing, M.; Tiersch, T.R. The emerging role of open technologies for community-based improvement of cryopreservation and quality management for repository development in aquatic species. Anim. Reprod. Sci. 2022, 246, 106871. [Google Scholar] [CrossRef]
- Zuchowicz, N.C.; Belgodere, J.A.; Liu, Y.; Semmes, I.; Monroe, W.T.; Tiersch, T.R. Low-Cost Resin 3-D Printing for Rapid Prototyping of Microdevices: Opportunities for Supporting Aquatic Germplasm Repositories. Fishes 2022, 7, 49. [Google Scholar] [CrossRef]


Disclaimer/Publisher’s Note: The statements, opinions and data contained in all publications are solely those of the individual author(s) and contributor(s) and not of MDPI and/or the editor(s). MDPI and/or the editor(s) disclaim responsibility for any injury to people or property resulting from any ideas, methods, instructions or products referred to in the content. |
© 2023 by the authors. Licensee MDPI, Basel, Switzerland. This article is an open access article distributed under the terms and conditions of the Creative Commons Attribution (CC BY) license (https://creativecommons.org/licenses/by/4.0/).
Share and Cite
Belgodere, J.A.; Alam, M.; Browning, V.E.; Eades, J.; North, J.; Armand, J.A.; Liu, Y.; Tiersch, T.R.; Monroe, W.T. A Modified-Herringbone Micromixer for Assessing Zebrafish Sperm (MAGS). Micromachines 2023, 14, 1310. https://doi.org/10.3390/mi14071310
Belgodere JA, Alam M, Browning VE, Eades J, North J, Armand JA, Liu Y, Tiersch TR, Monroe WT. A Modified-Herringbone Micromixer for Assessing Zebrafish Sperm (MAGS). Micromachines. 2023; 14(7):1310. https://doi.org/10.3390/mi14071310
Chicago/Turabian StyleBelgodere, Jorge A., Mustafa Alam, Valentino E. Browning, Jason Eades, Jack North, Julie A. Armand, Yue Liu, Terrence R. Tiersch, and W. Todd Monroe. 2023. "A Modified-Herringbone Micromixer for Assessing Zebrafish Sperm (MAGS)" Micromachines 14, no. 7: 1310. https://doi.org/10.3390/mi14071310