
Bioaffinity Nanoprobes for Foodborne Pathogen Sensing
Abstract
:1. Introduction
2. Overview of Bioaffinity Nanoprobes
2.1. Antibodies
- Adsorption using electrostatic or hydrophobic interactions;
- Entrapment;
- Covalent coupling using amine coupling, thiol coupling, or coupling through glycan moiety;
- Affinity: immobilization is performed through intermediate proteins such as in the case of avidin–biotin [13].
2.2. Enzymes
- The first option is that the concentration of the enzyme can be estimated by measuring the catalytic transformation of the analyte, which is metabolized by the enzyme.
- Secondly, the enzyme is inhibited or activated by the analyte, hence the concentration of the analyte is proportional to the decrease in enzymatic product generation.
- The last option is by tracking the alteration in the characteristics of the enzyme.
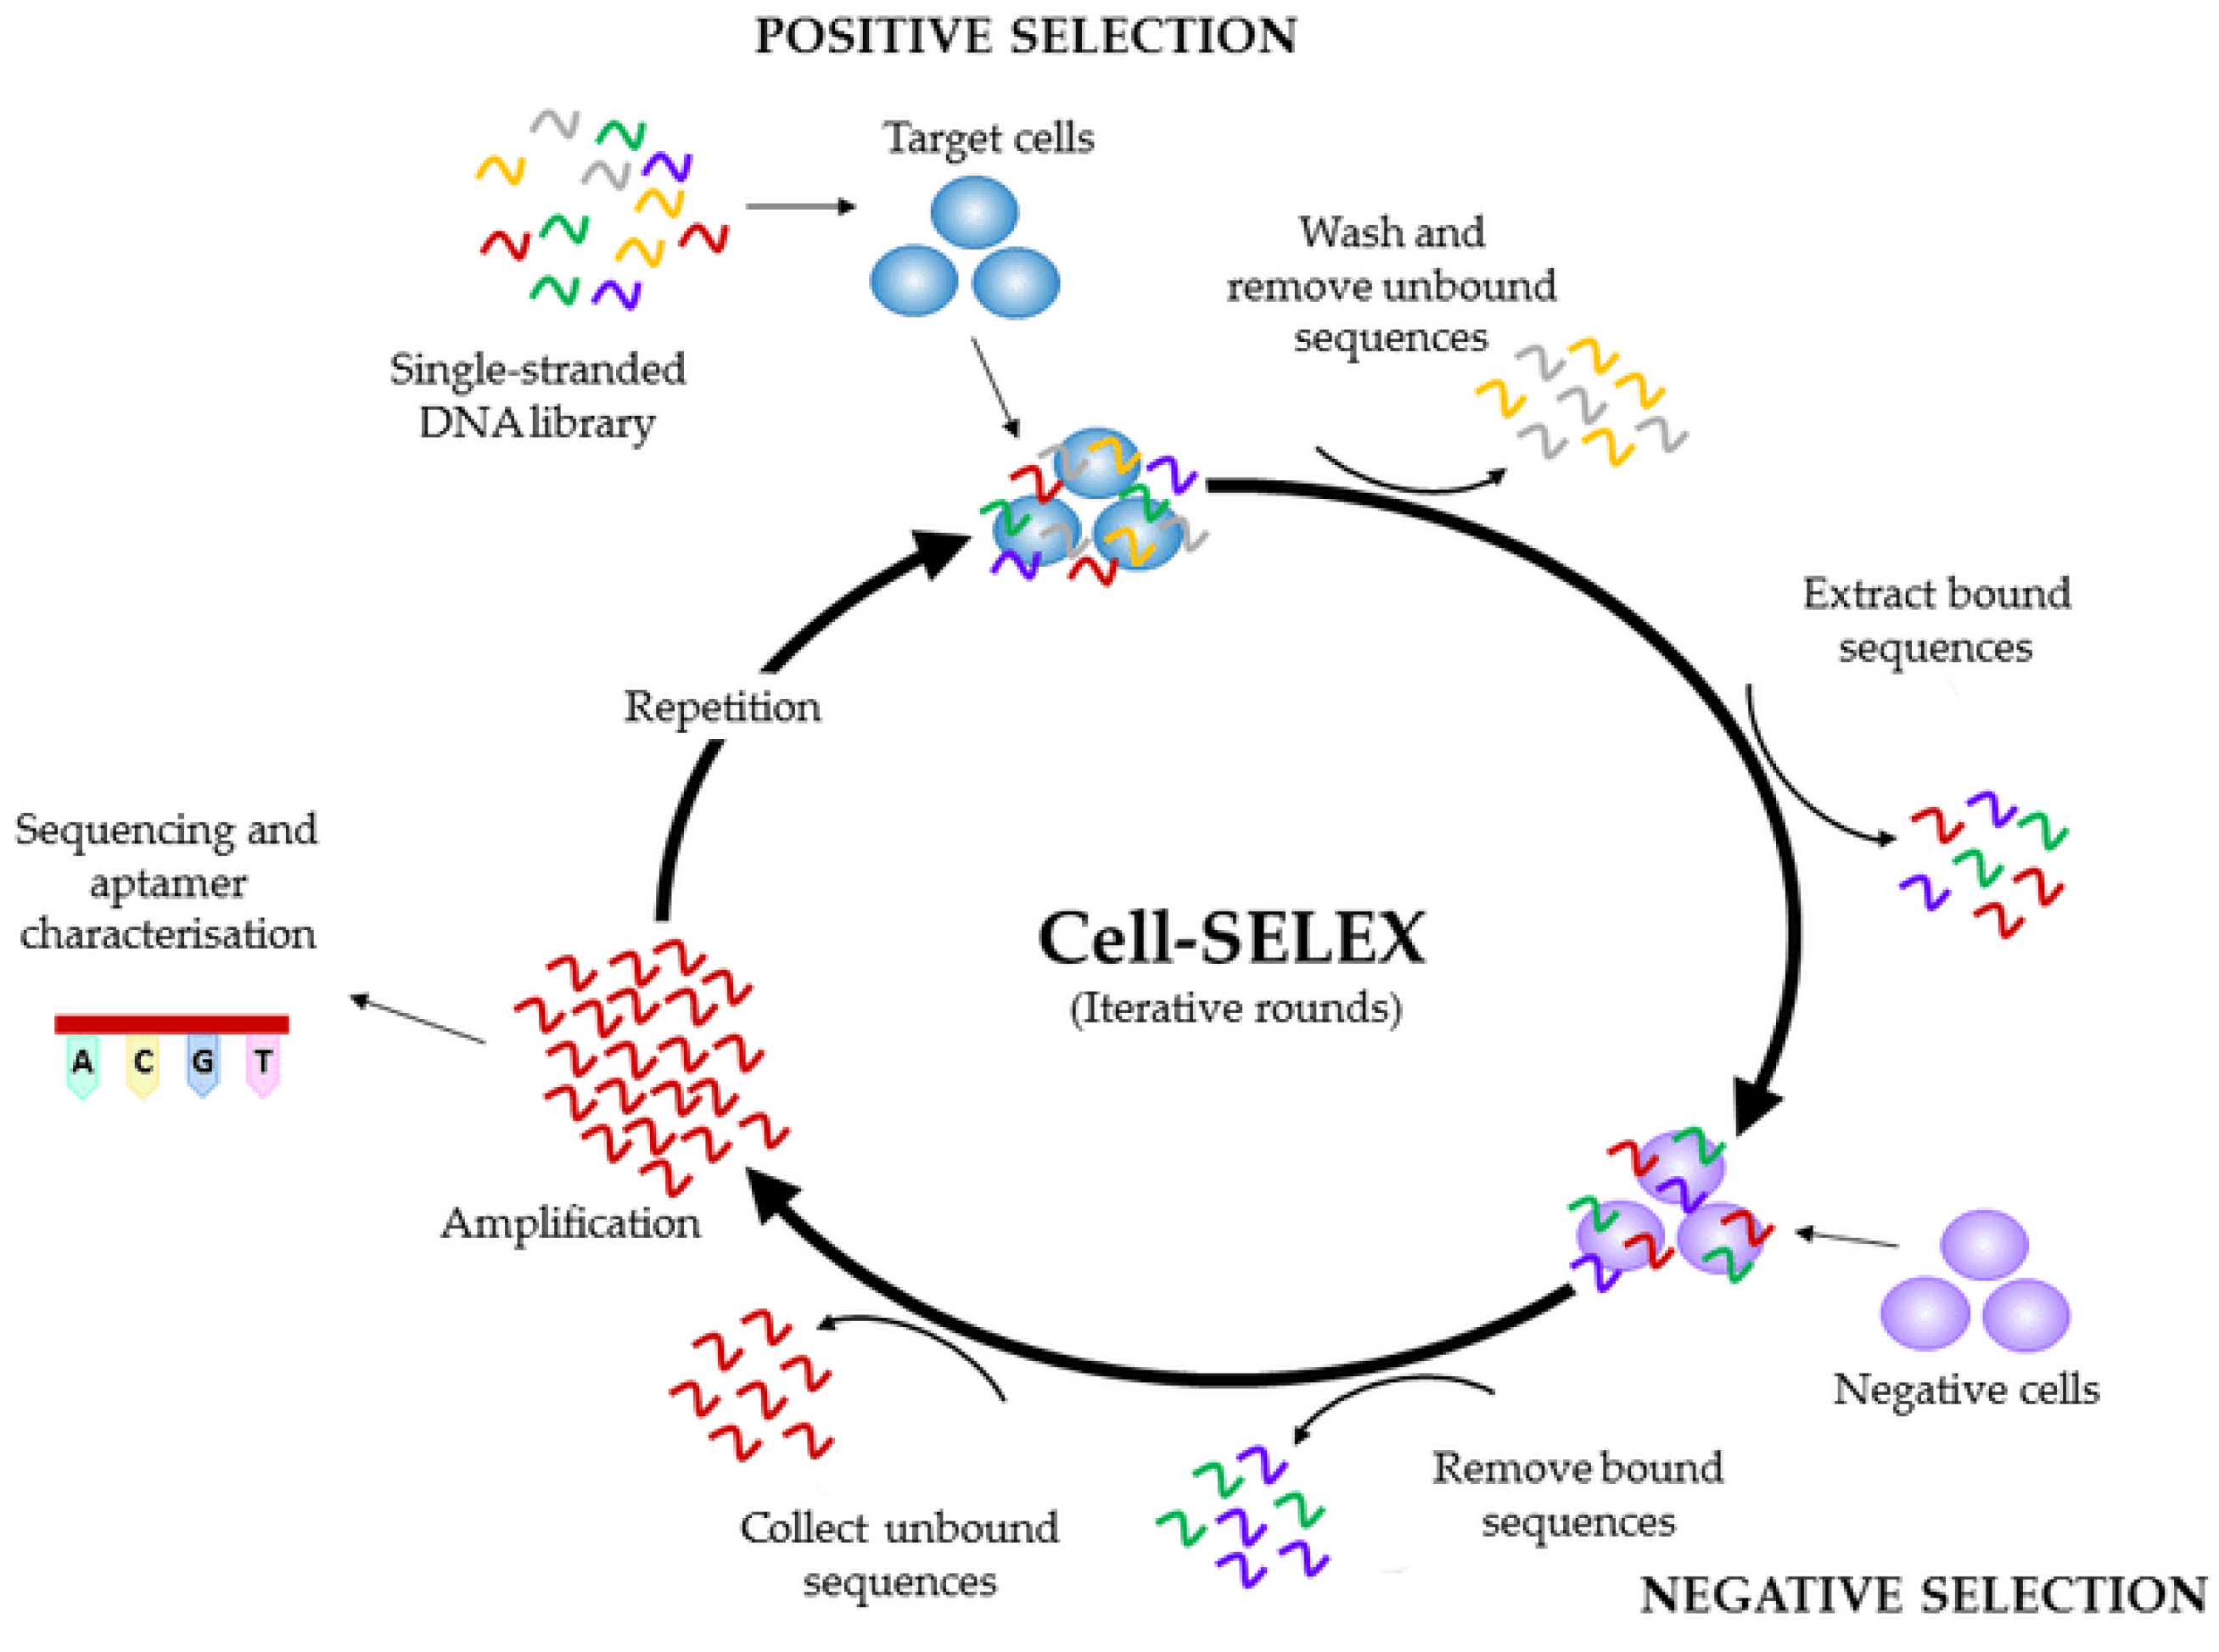
2.3. Aptamers
2.4. Other Bioaffinity Nanoprobes
2.4.1. Non-Antibody Binding Proteins
2.4.2. Molecularly Imprinted Polymers
- Incubation: Monomers are incubated with a dummy, epitope, or template molecule, which facilitates the formation and stabilization of non-covalent interactions between the functional monomers and the template.
- Polymer Formation: The polymer is formed around the template with the help of cross-linkers, resulting in the creation of a network structure.
3. Analytical Approaches for the Assessment of Bioaffinity Nanoprobes
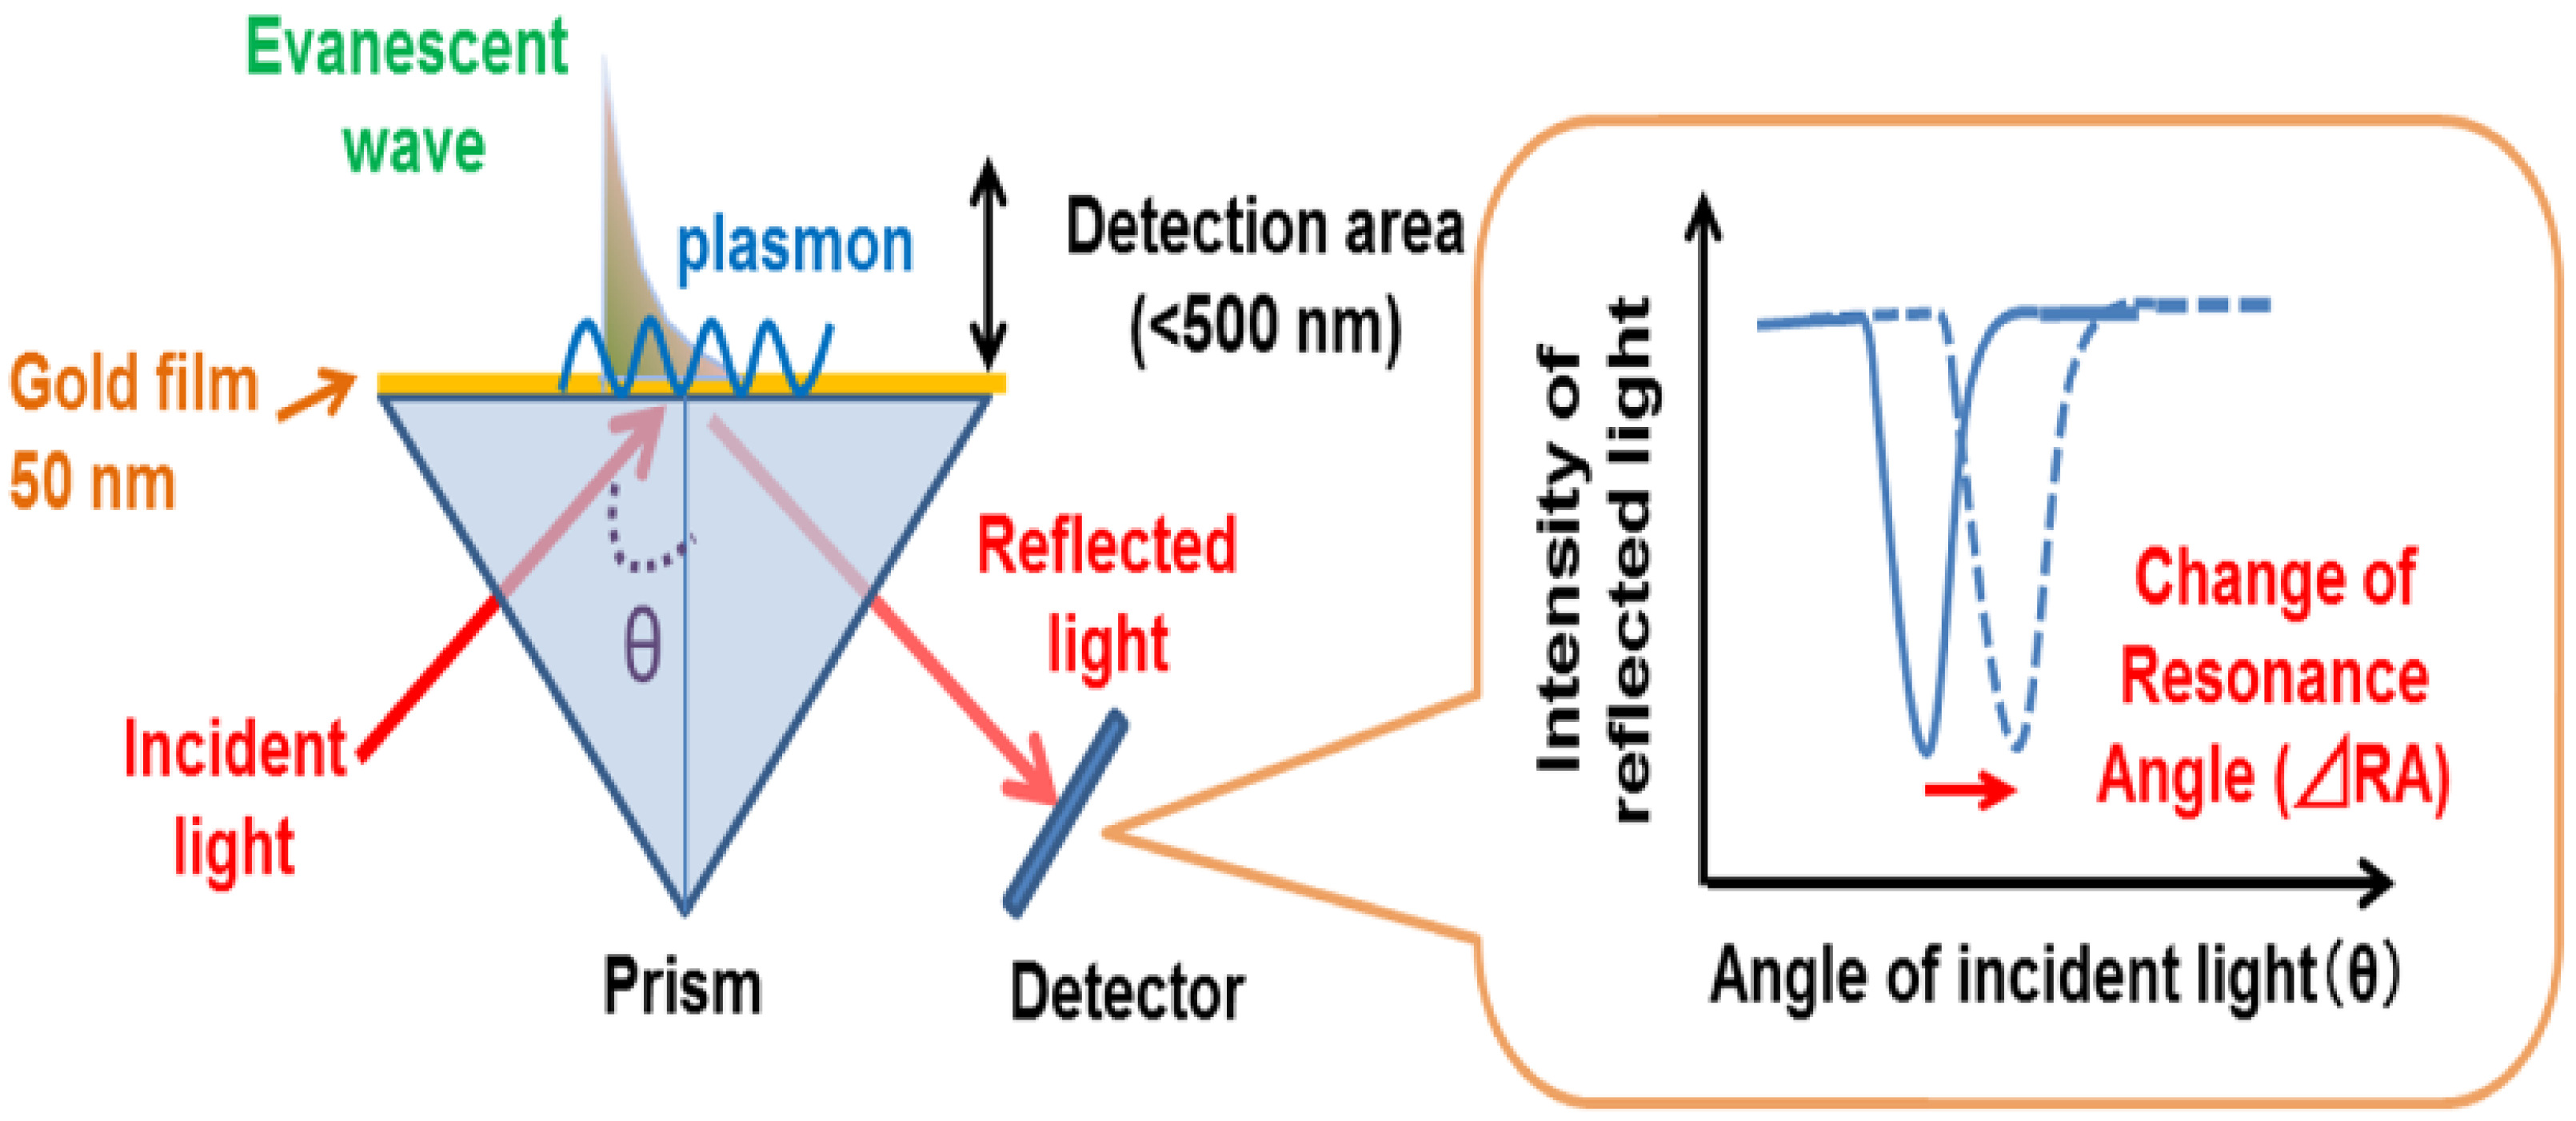
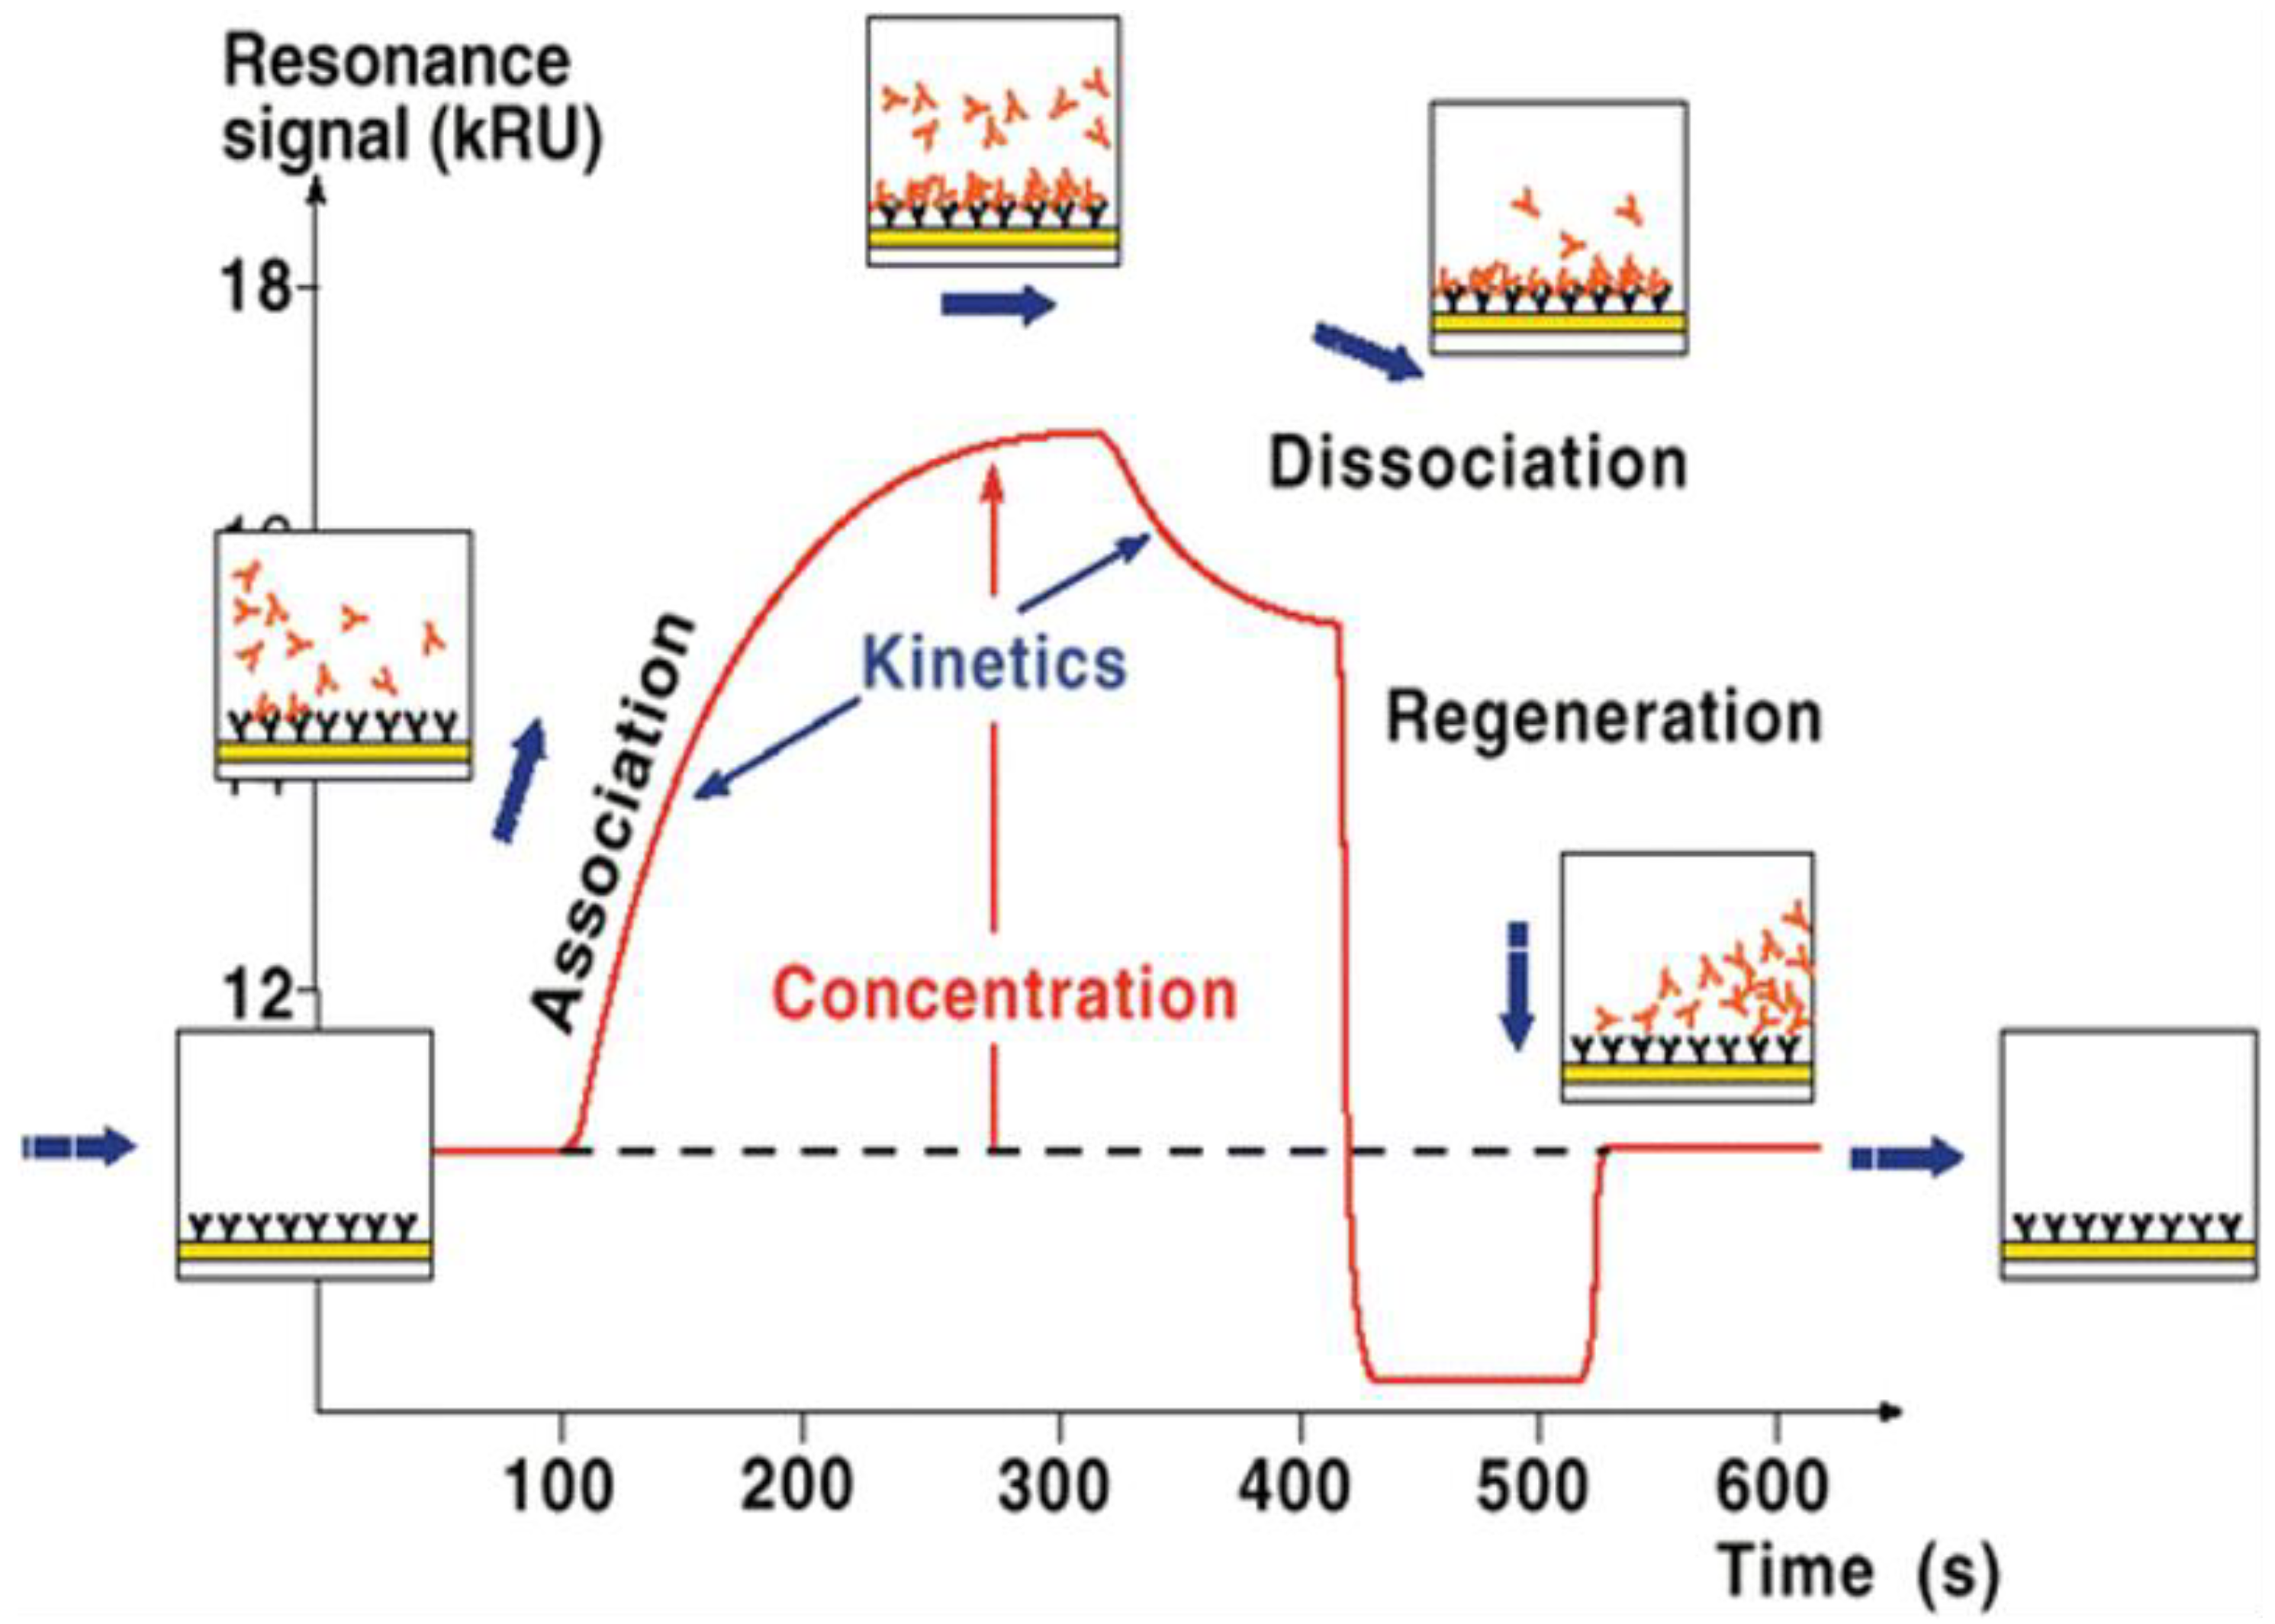
3.1. SPR
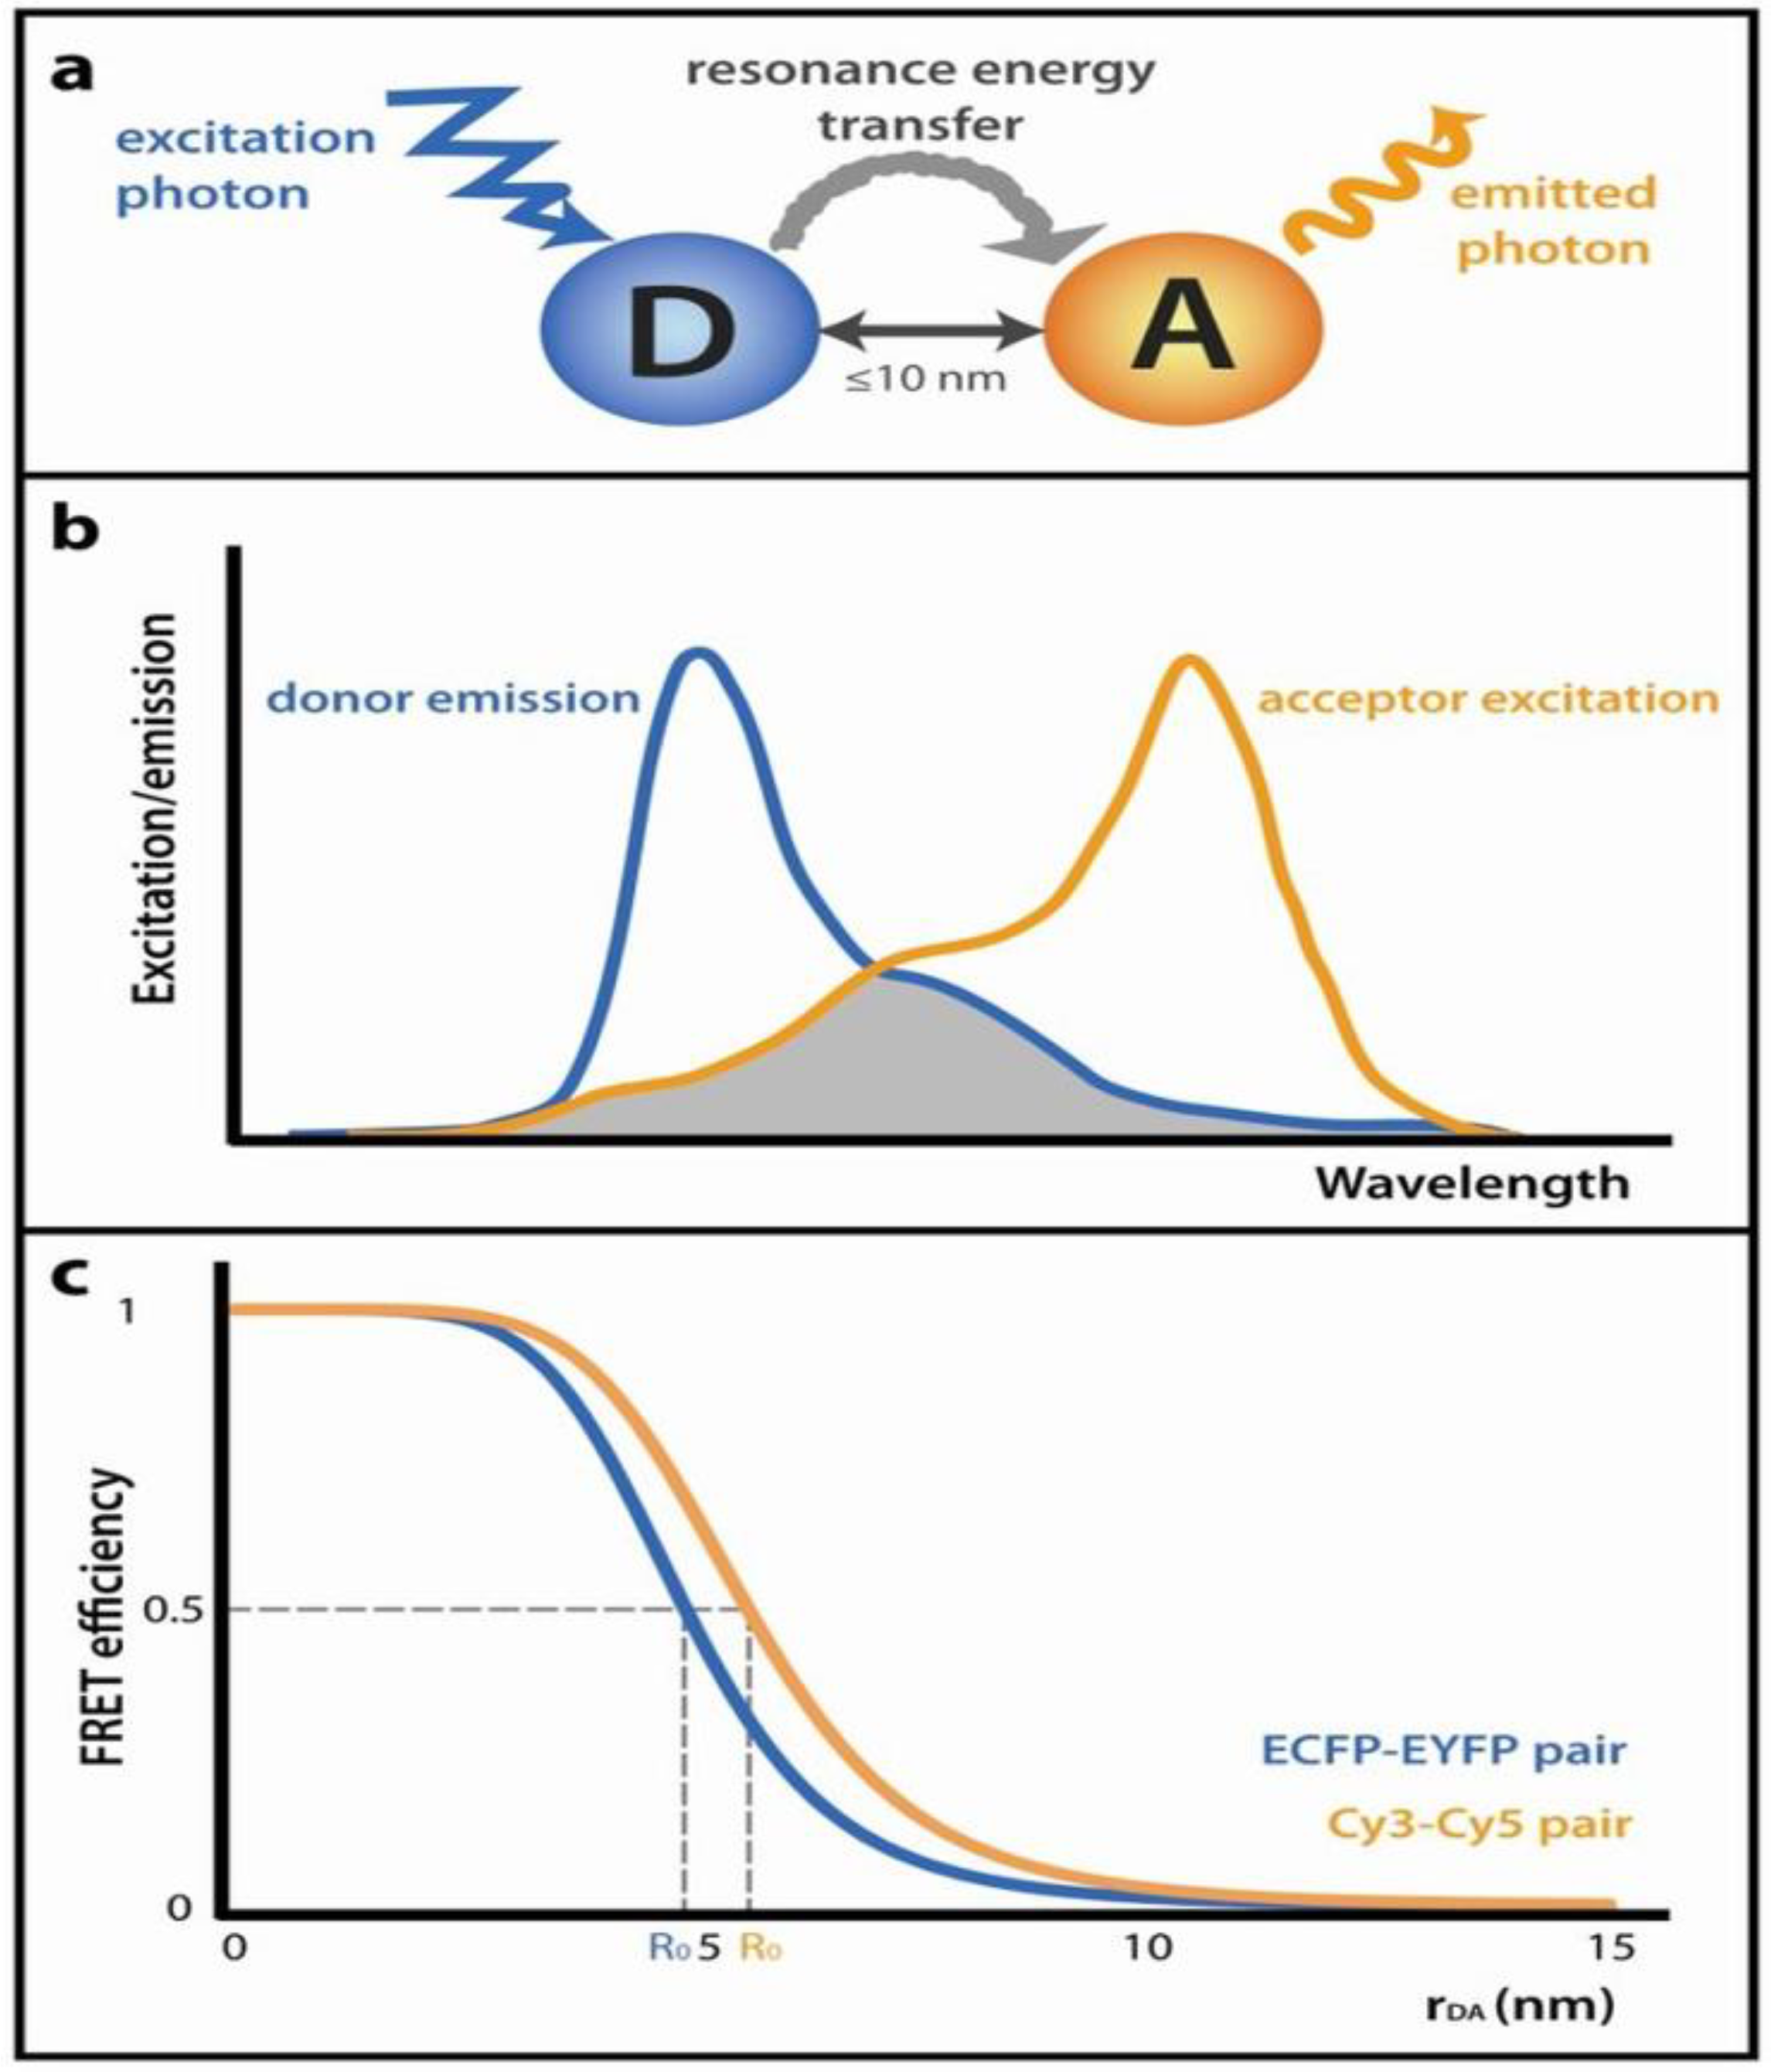
3.2. FRET
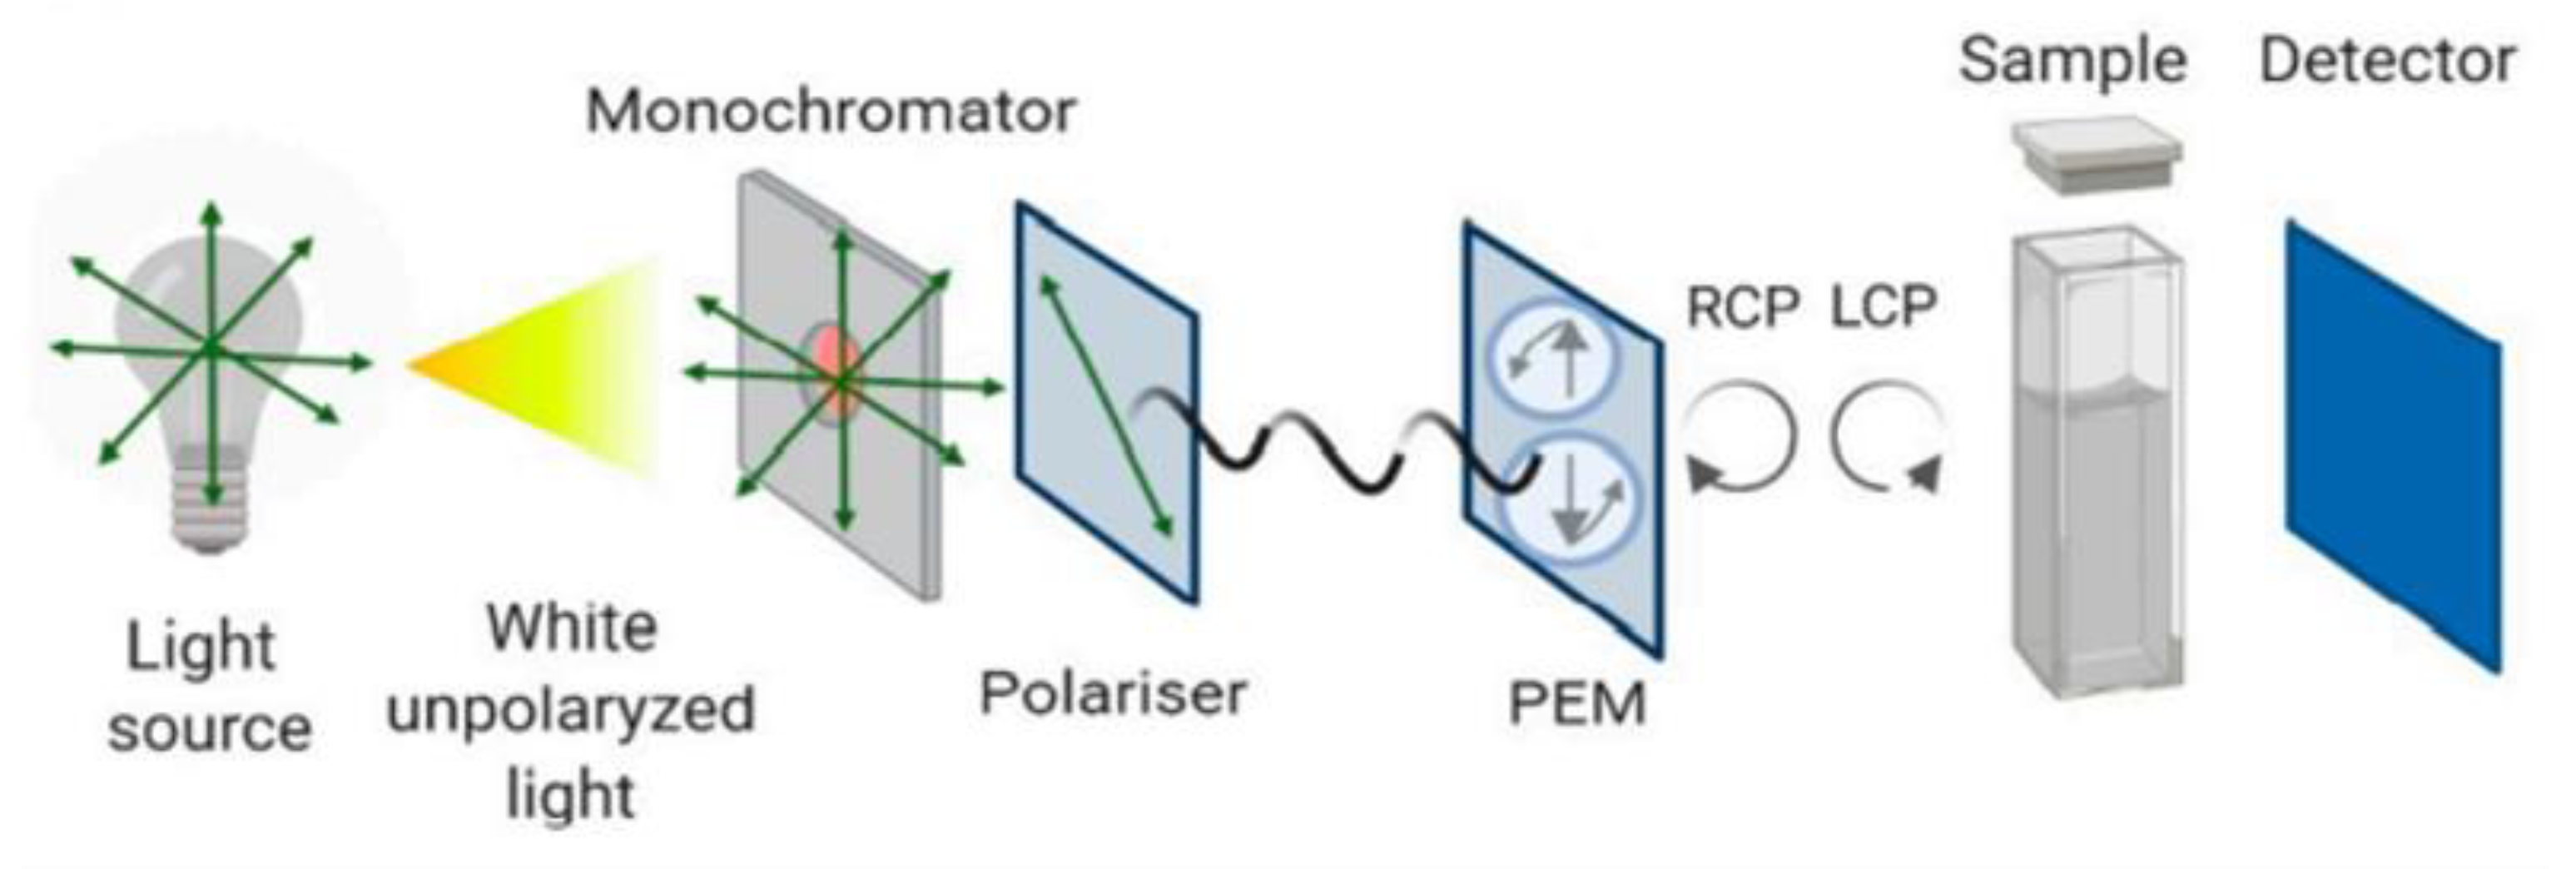
3.3. CD
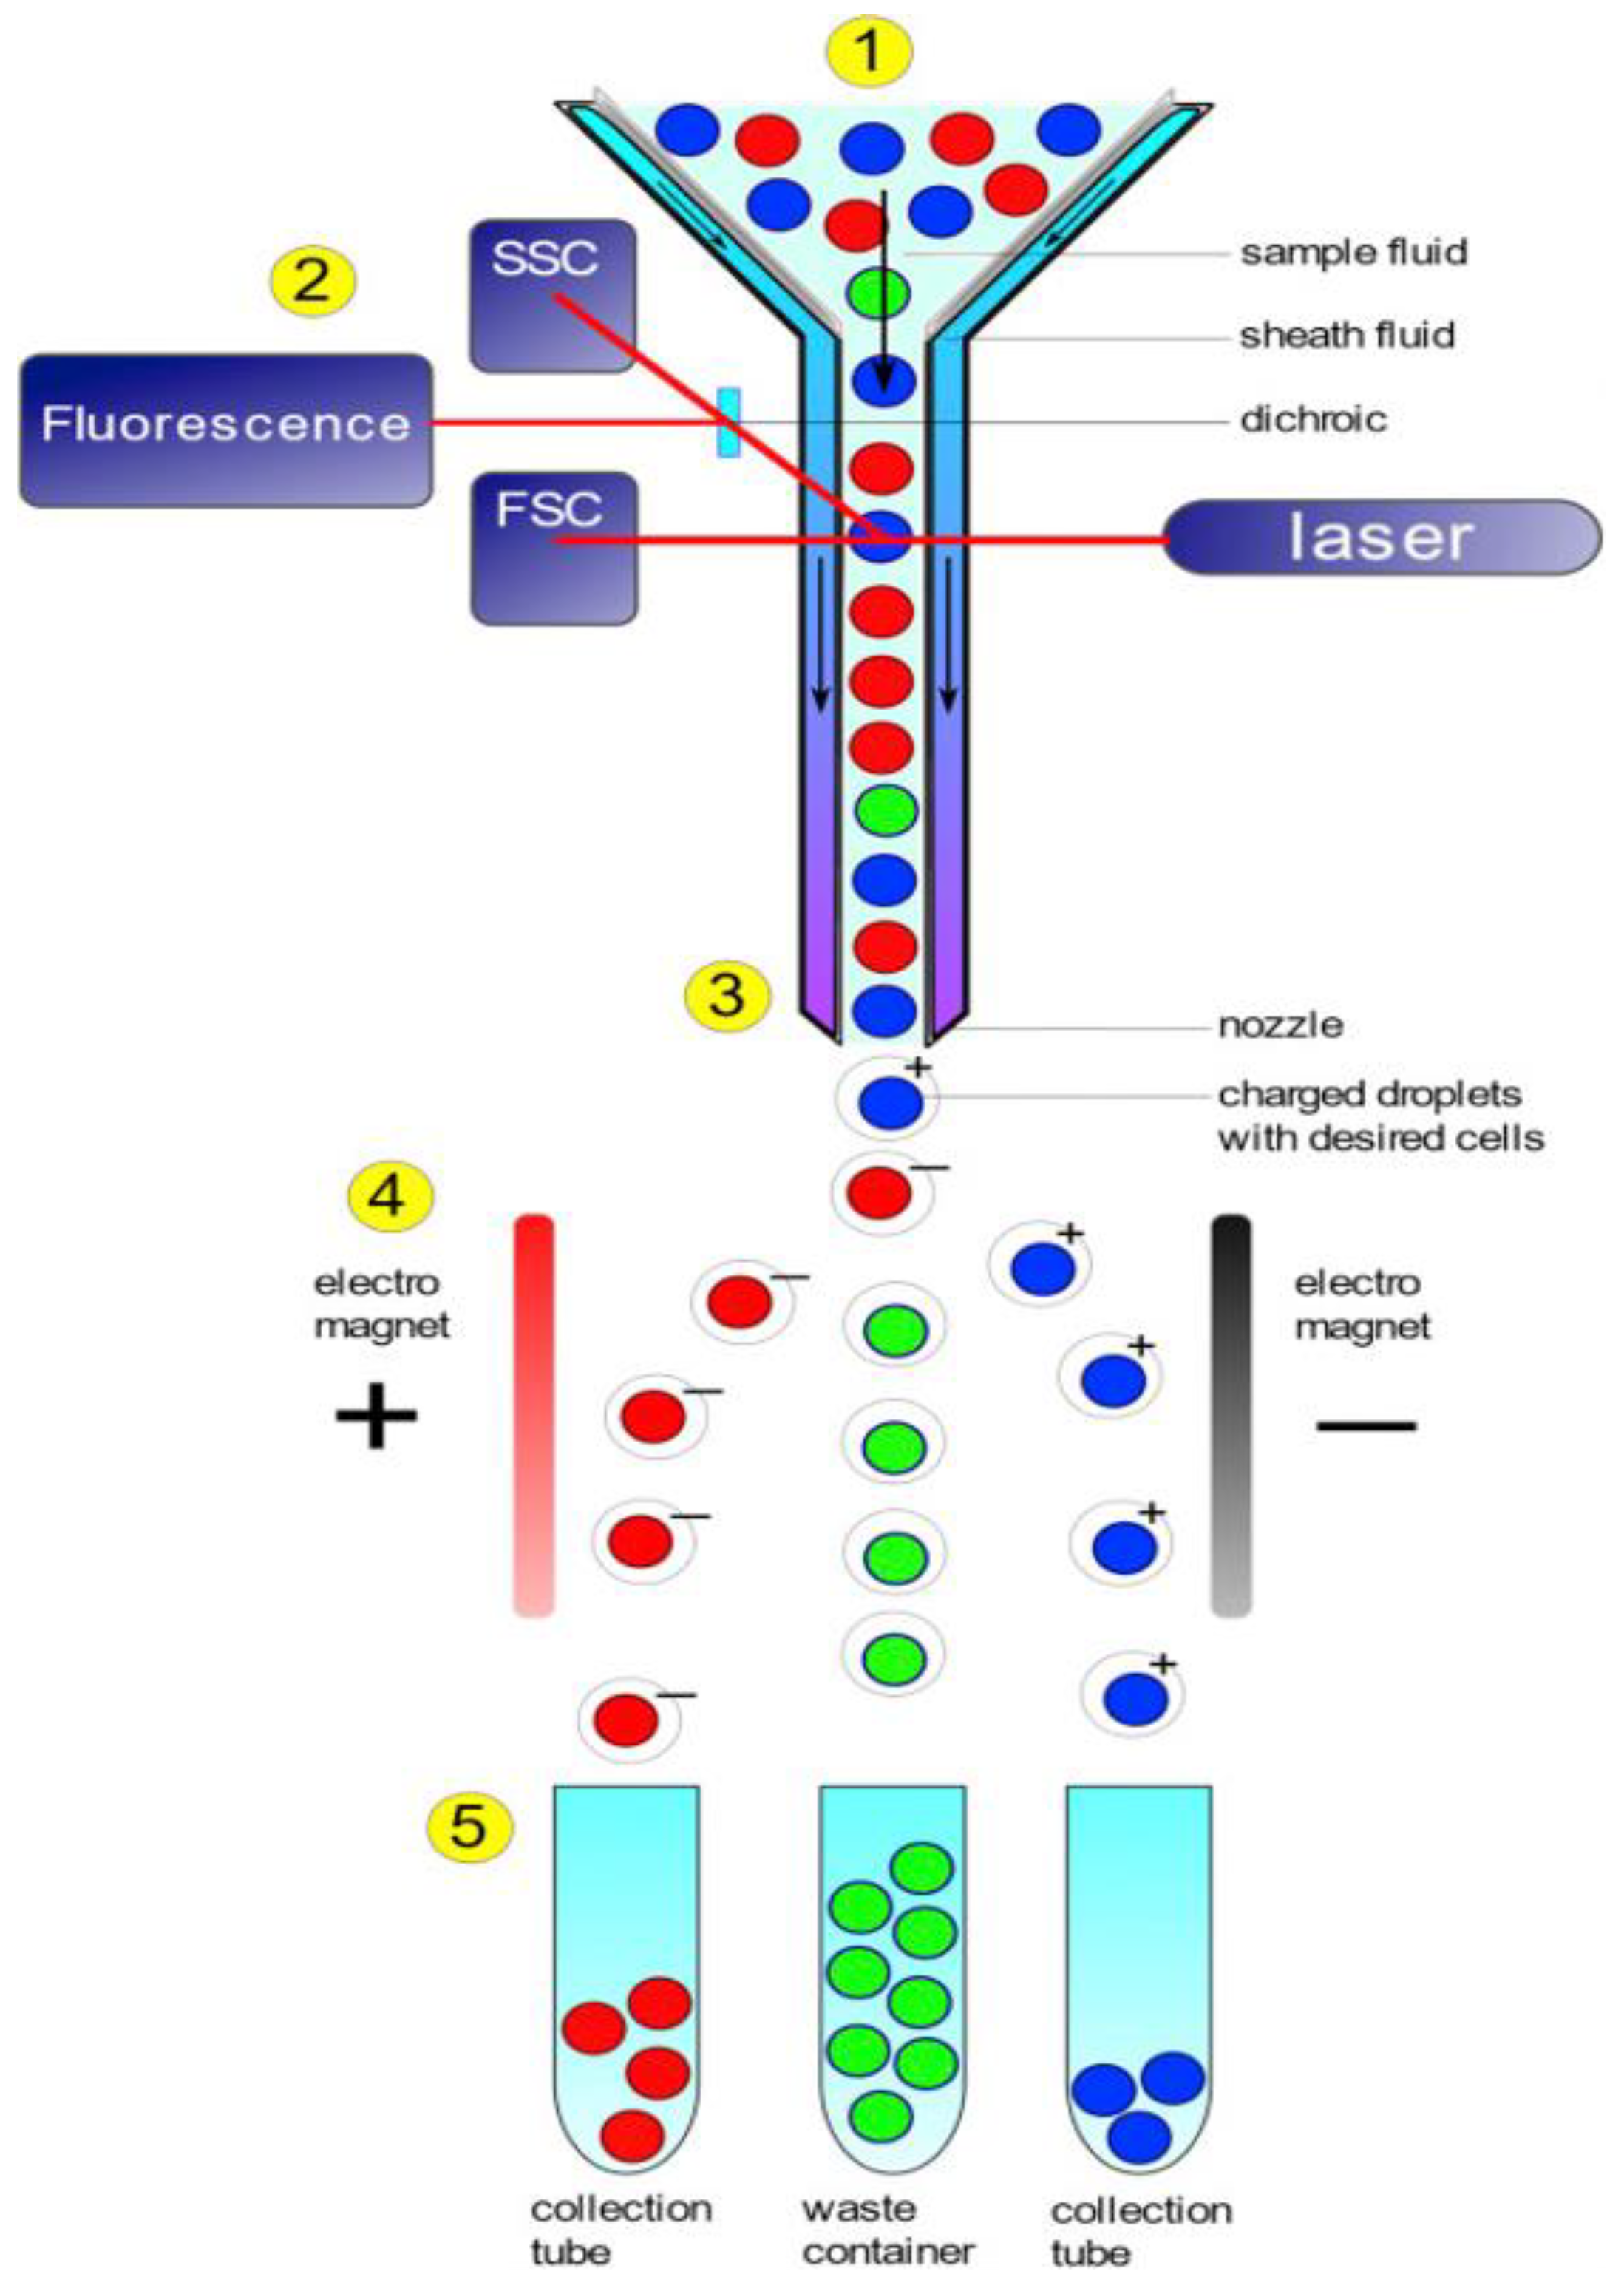
3.4. FC
4. Application of Bioaffinity Nanoprobes in Food Biosensing
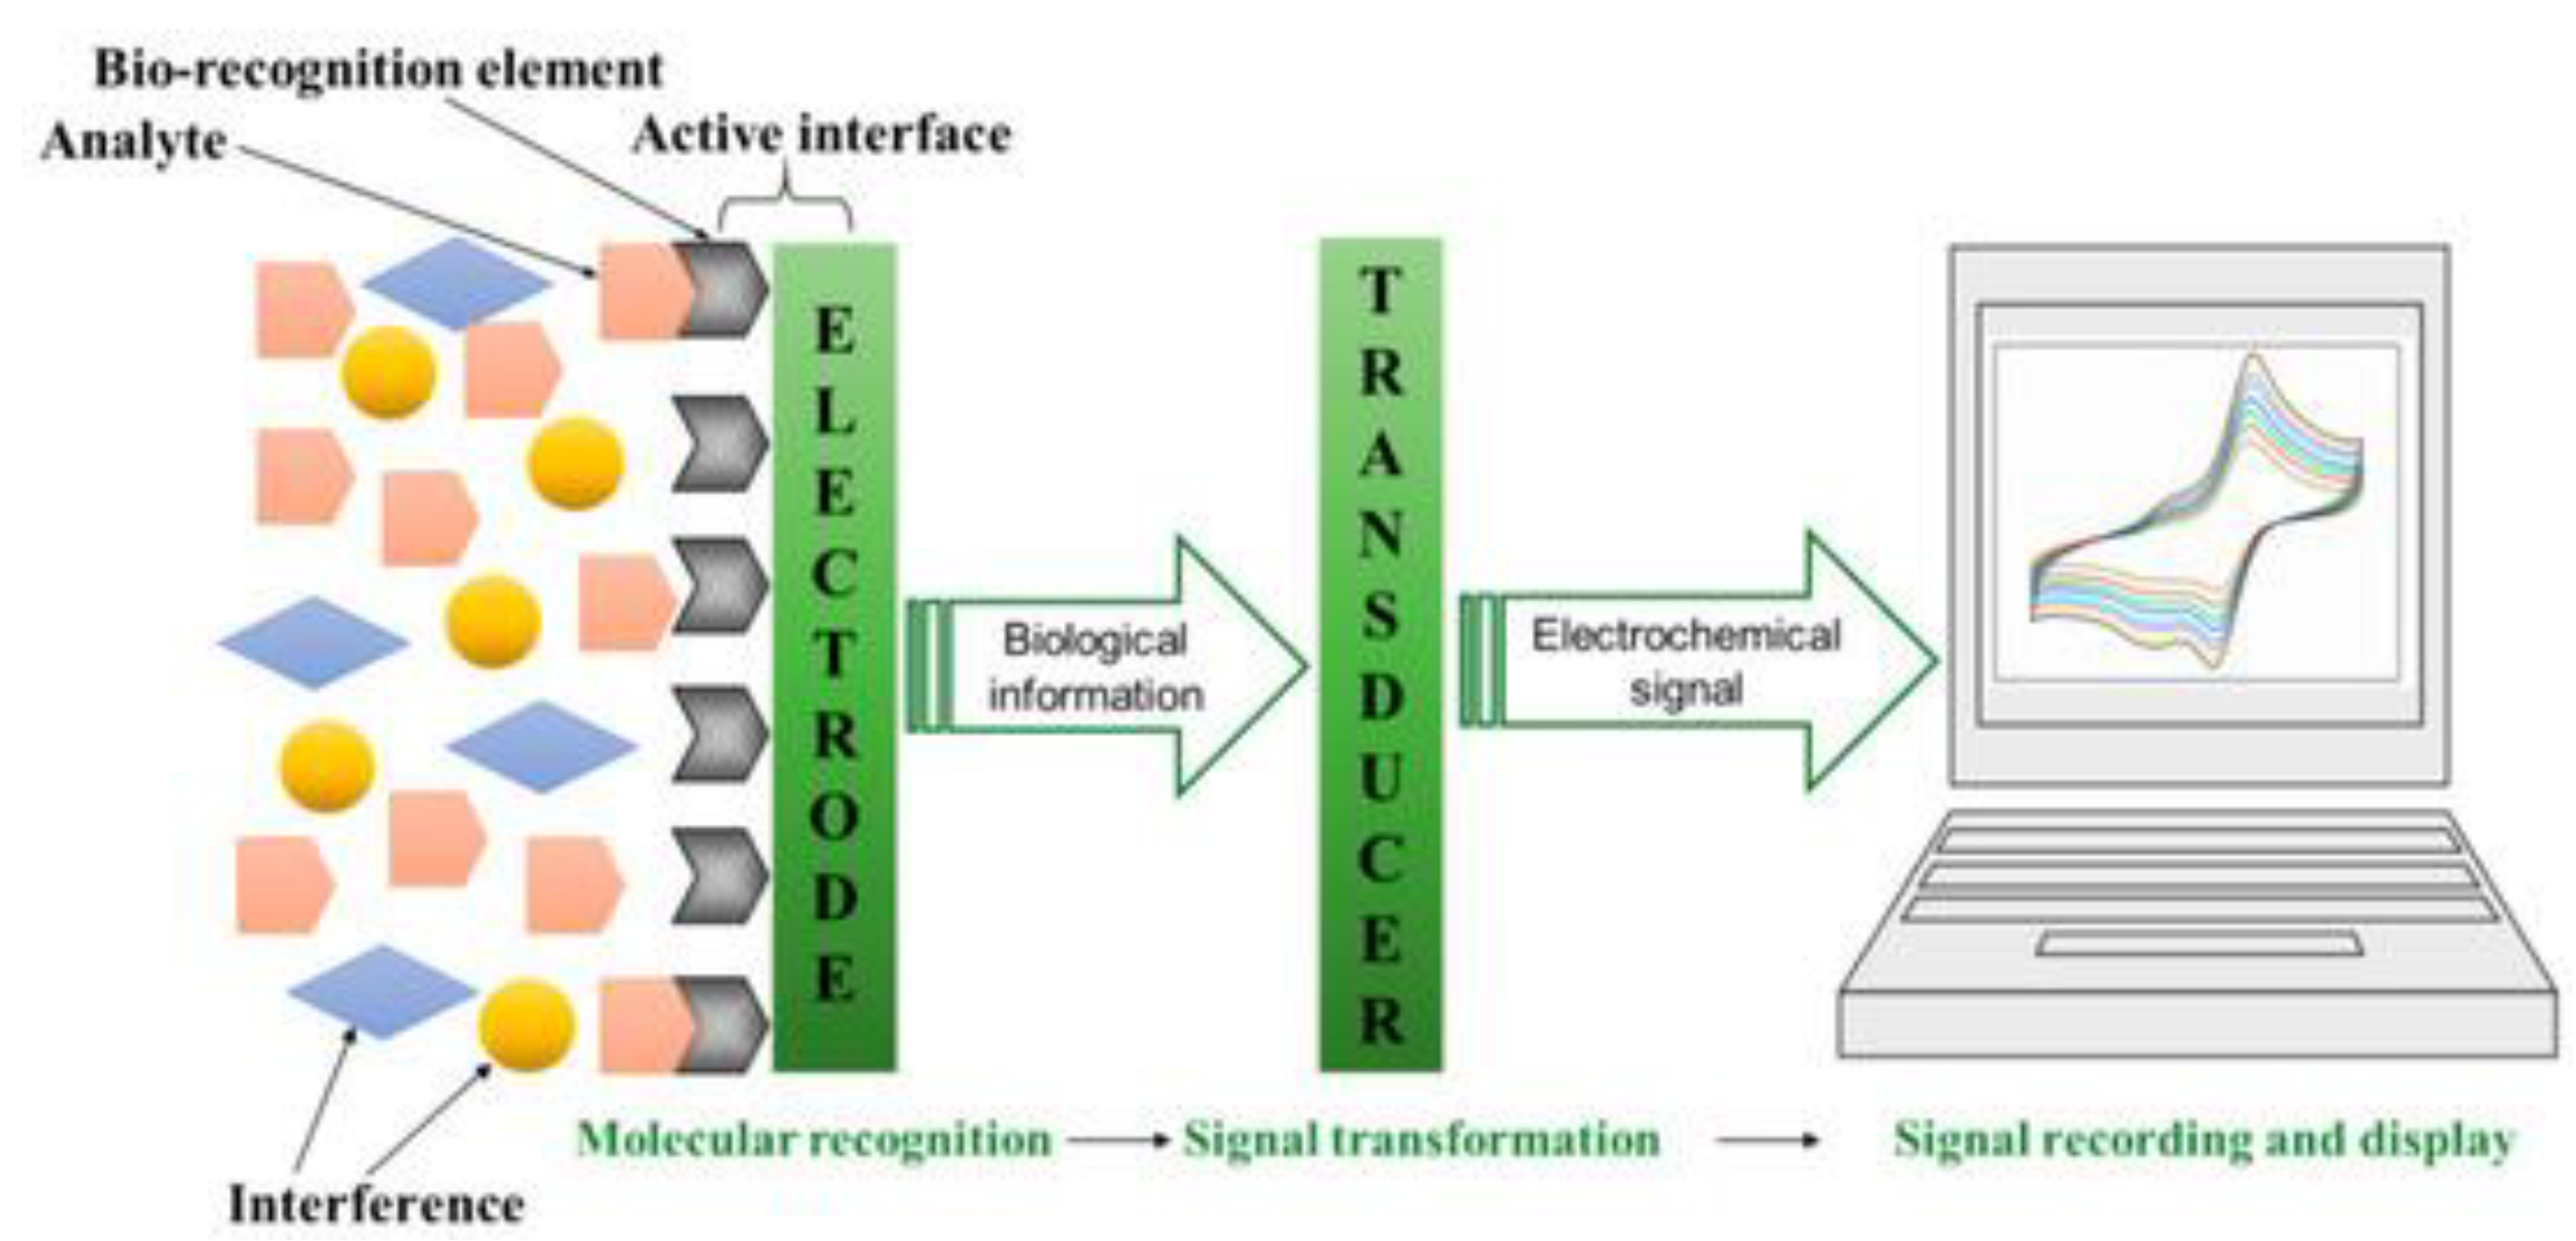
4.1. Electrochemical Sensors
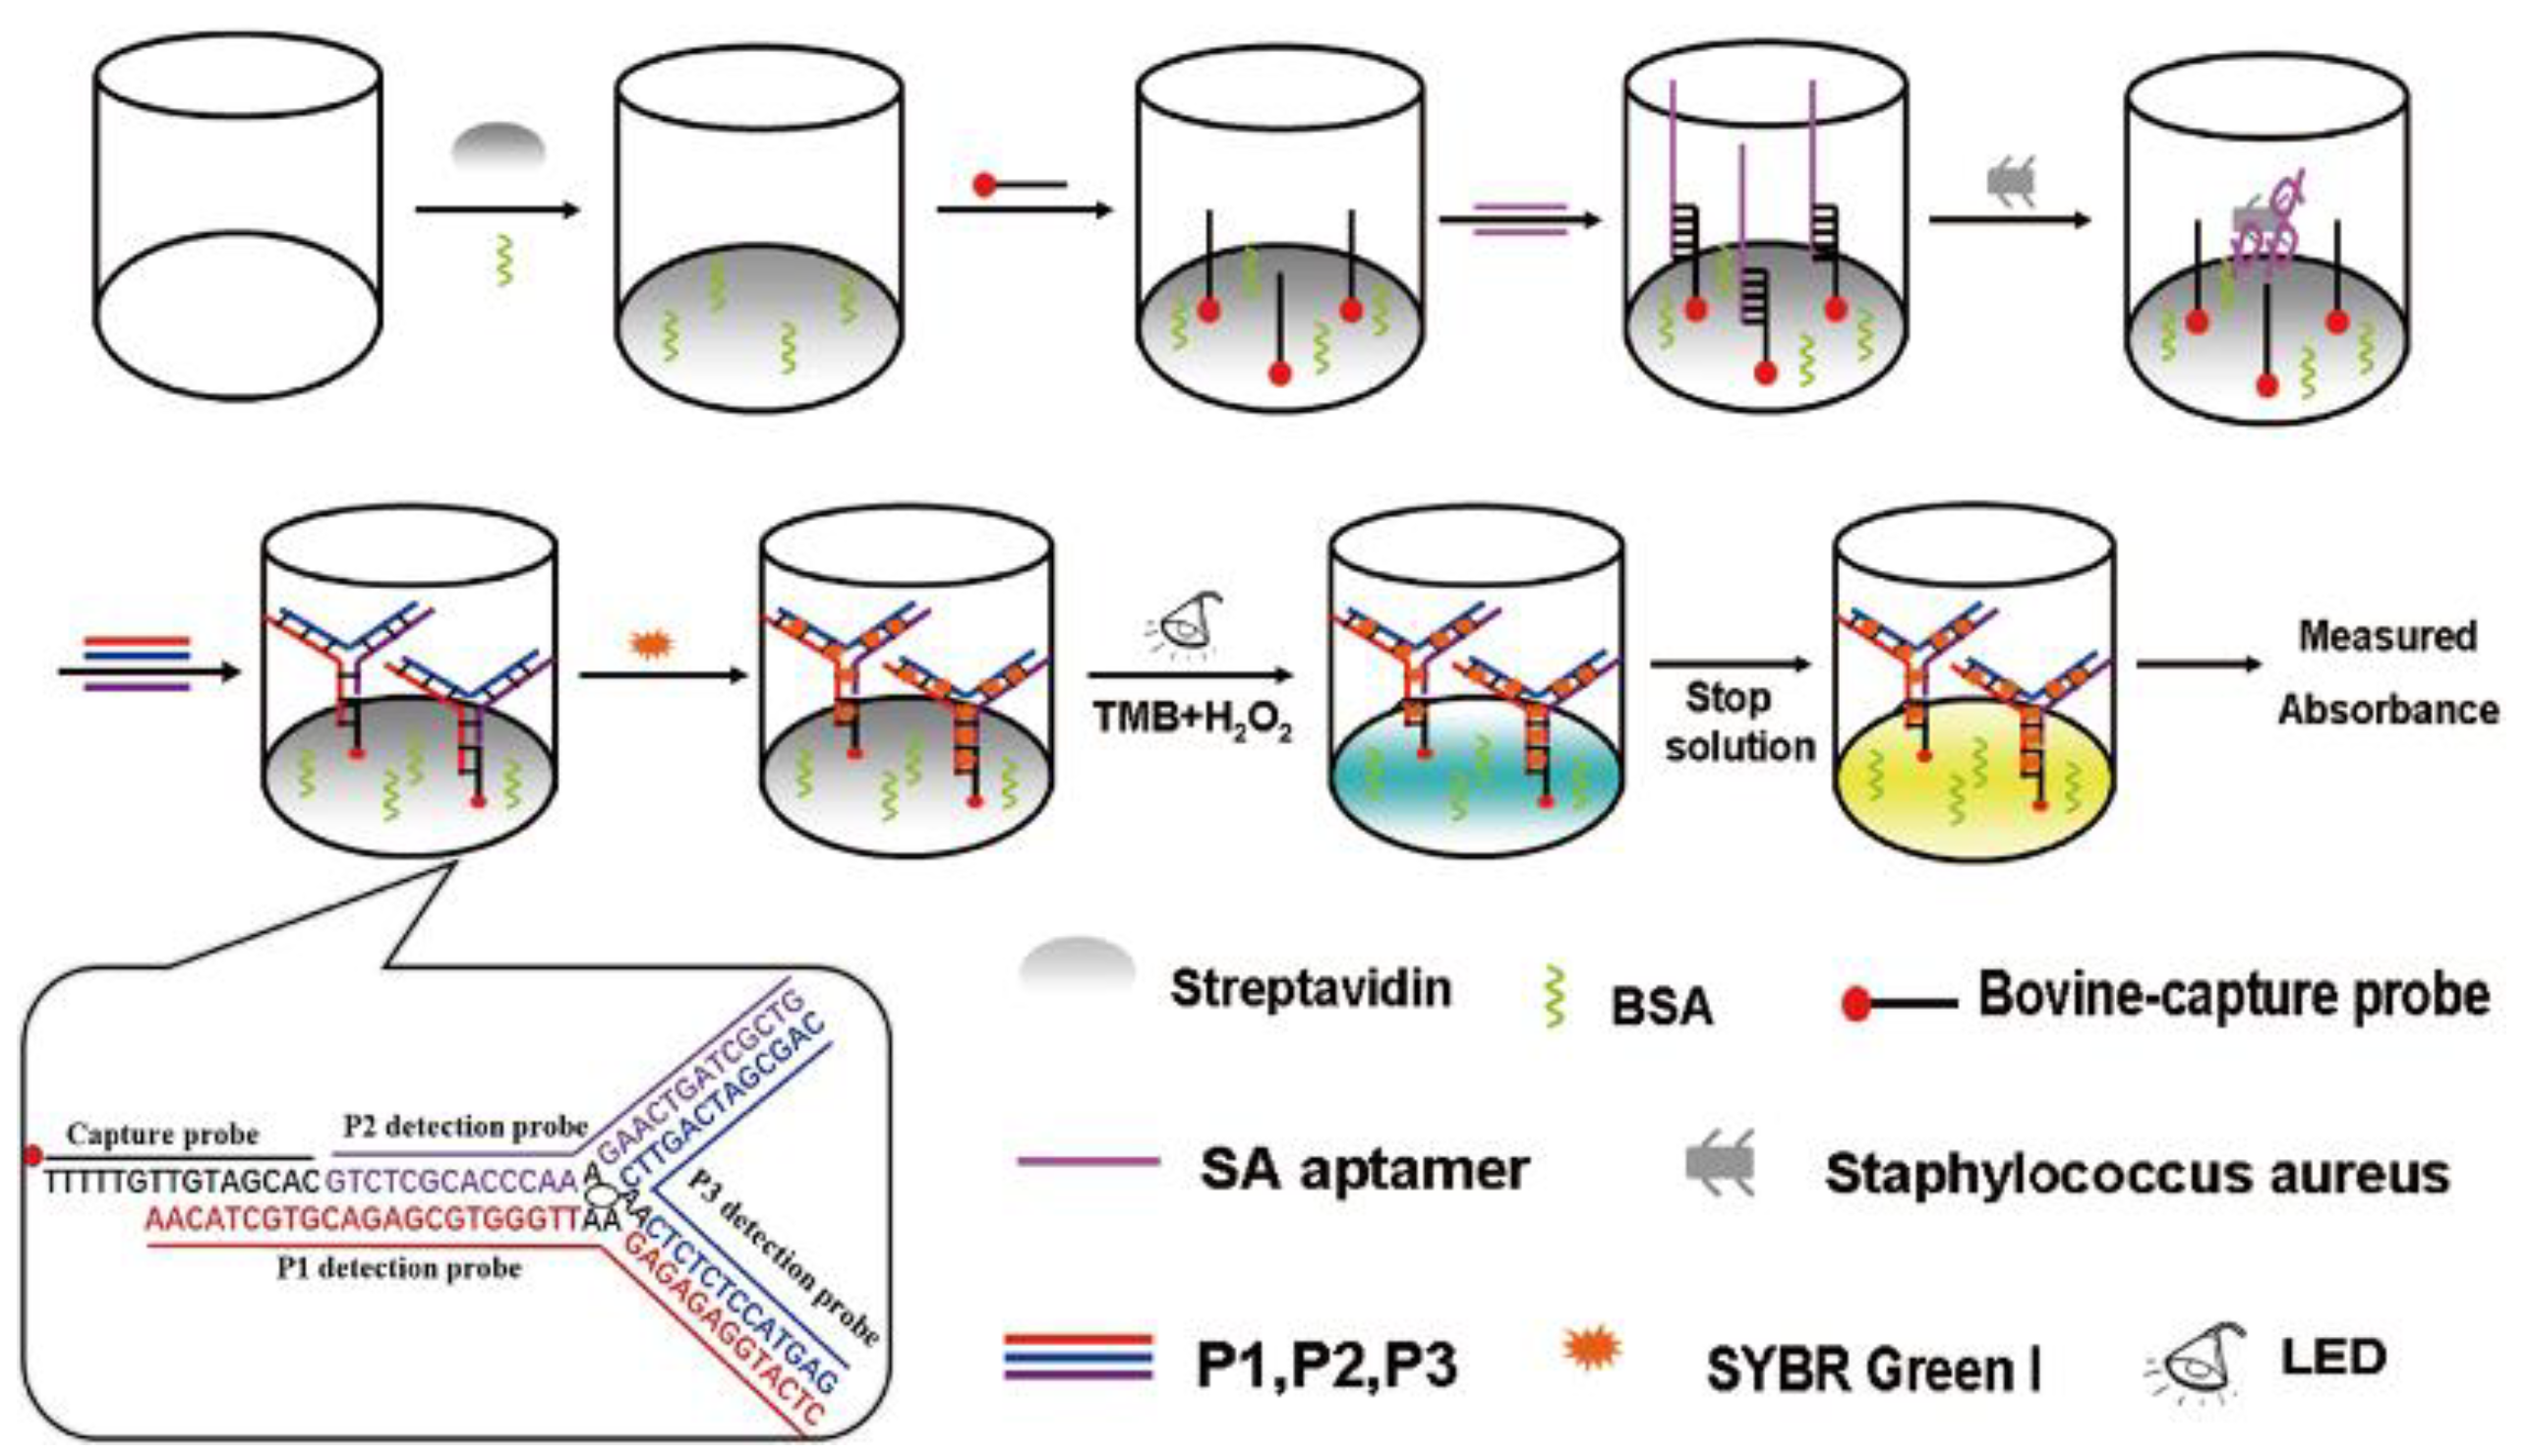
4.2. Colorimetric Sensors
4.3. Optical Sensors
4.4. Piezoelectric Sensors
4.5. Newer Technologies—Microfluidic Detection Methods
5. Future Perspective
6. Conclusions
Author Contributions
Funding
Data Availability Statement
Conflicts of Interest
References
- Bintsis, T. Foodborne pathogens. AIMS Microbiol. 2017, 3, 529–563. [Google Scholar] [CrossRef] [PubMed]
- Zhao, X.; Lin, C.W.; Wang, J.; Oh, D.H. Advances in rapid detection methods for foodborne pathogens. J. Microbiol. Biotechnol. 2014, 24, 297–312. [Google Scholar] [CrossRef] [PubMed]
- Gao, D.; Ma, Z.; Jiang, Y. Recent advances in microfluidic devices for foodborne pathogens detection. TrAC—Trends Anal. Chem. 2022, 157, 116788. [Google Scholar] [CrossRef]
- Inbaraj, B.S.; Chen, B.H. Nanomaterial-based sensors for detection of foodborne bacterial pathogens and toxins as well as pork adulteration in meat products. J. Food Drug Anal. 2016, 24, 15–28. [Google Scholar] [CrossRef]
- Zaid, M.H.M.; Saidykhan, J.; Abdullah, J. Nanosensors based detection of foodborne pathogens. In Nanotechnology: Applications in Energy, Drug and Food; Springer International Publishing: Cham, Switzerland, 2019; pp. 377–422. [Google Scholar] [CrossRef]
- Manoj, D.; Shanmugasundaram, S.; Anandharamakrishnan, C. Nanosensing and nanobiosensing: Concepts, methods, and applications for quality evaluation of liquid foods. Food Control. 2021, 126, 108017. [Google Scholar] [CrossRef]
- Adam, T.; Dhahi, T.S. Nanosensors: Recent perspectives on attainments and future promise of downstream applications. Process. Biochemistry 2022, 117, 153–173. [Google Scholar] [CrossRef]
- Javaid, M.; Haleem, A.; Singh, R.P.; Rab, S.; Suman, R. Exploring the potential of nanosensors: A brief overview. Sens. Int. 2021, 2, 100130. [Google Scholar] [CrossRef]
- Gatoo, M.A.; Naseem, S.; Arfat, M.Y.; Dar, A.M.; Qasim, K.; Zubair, S. Physicochemical properties of nanomaterials: Implication in associated toxic manifestations. Biomed. Res. Int. 2014, 2014, 498420. [Google Scholar] [CrossRef]
- Bhalla, N.; Jolly, P.; Formisano, N.; Estrela, P. Introduction to biosensors. Essays Biochem. 2016, 60, 1. [Google Scholar] [CrossRef]
- Kaur, R.; Tripathy, S.K.; Sharma, S.K. Advantages and Limitations of Environmental Nanosensors. In Advances in Nanosensors for Biological and Environmental Analysis; Elsevier: Amsterdam, The Netherlands, 2019; pp. 119–132. [Google Scholar] [CrossRef]
- Gaudin, V. Advances in biosensor development for the screening of antibiotic residues in food products of animal origin—A comprehensive review. Biosens. Bioelectron. 2017, 90, 363–377. [Google Scholar] [CrossRef]
- Sharma, S.; Byrne, H.; O’Kennedy, R.J. Antibodies and antibody-derived analytical biosensors. Essays Biochem. 2016, 60, 9–18. [Google Scholar] [CrossRef]
- Aziz, M.; Iheanacho, F.; Hashmi, M.F. Physiology, Antibody. StatPearls. May 2022. Available online: https://www.ncbi.nlm.nih.gov/books/NBK546670/ (accessed on 6 March 2023).
- Forthal, D.N. Functions of Antibodies. Microbiol. Spectr. 2014, 2, 25–48. [Google Scholar] [CrossRef]
- Weiner, L.M.; Surana, R.; Wang, S. Monoclonal antibodies: Versatile platforms for cancer immunotherapy. Nat. Rev. Immunol. 2010, 10, 317–327. [Google Scholar] [CrossRef] [PubMed]
- Conroy, P.J.; Hearty, S.; Leonard, P.; O’Kennedy, R.J. Antibody production, design and use for biosensor-based applications. Semin Cell Dev. Biol. 2009, 20, 10–26. [Google Scholar] [CrossRef]
- Hopkins, N.A.E. Antibody engineering for biosensor applications. In Recognition Receptors in Biosensors; Springer: Berlin/Heidelberg, Germany, 2010; pp. 451–529. [Google Scholar] [CrossRef]
- Singh, A.; Chaudhary, S.; Agarwal, A.; Verma, A.S. Antibodies: Monoclonal and Polyclonal. In Animal Biotechnology Models in Discovery and Translation; Academic Press: Cambridge, MA, USA, 2014; pp. 265–287. [Google Scholar] [CrossRef]
- Byrne, B.; Stack, E.; Gilmartin, N.; O’Kennedy, R. Antibody-based sensors: Principles, problems and potential for detection of pathogens and associated toxins. Sensors 2009, 9, 4407–4445. [Google Scholar] [CrossRef]
- Leonard, P.; Hearty, S.; Brennan, J.; Dunne, L.; Quinn, J.; Chakraborty, T.; O’kennedy, R. Advances in biosensors for detection of pathogens in food and water. Enzym. Microb. Technol. 2003, 32, 3–13. [Google Scholar] [CrossRef]
- Rudenko, N.; Fursova, K.; Shepelyakovskaya, A.; Karatovskaya, A.; Brovko, F. Antibodies as Biosensors’ Key Components: State-of-the-Art in Russia 2020–2021. Sensors 2021, 21, 7614. [Google Scholar] [CrossRef] [PubMed]
- Peltomaa, R.; Barderas, R.; Benito-Peña, E.; Moreno-Bondi, M.C. Recombinant antibodies and their use for food immunoanalysis. Anal. Bioanal. Chem. 2022, 414, 193–217. [Google Scholar] [CrossRef]
- Plückthun, A.; Skerra, A. Expression of functional antibody Fv and Fab fragments in Escherichia coli. Methods Enzym. 1989, 178, 497–515. [Google Scholar] [CrossRef]
- Trilling, A.K.; Beekwilder, J.; Zuilhof, H. Antibody orientation on biosensor surfaces: A minireview. Analyst 2013, 138, 1619–1627. [Google Scholar] [CrossRef]
- Naresh, V.; Lee, N. A Review on Biosensors and Recent Development of Nanostructured Materials-Enabled Biosensors. Sensors 2021, 21, 1109. [Google Scholar] [CrossRef] [PubMed]
- Biochemistry, Proteins Enzymes—PubMed. Available online: https://pubmed.ncbi.nlm.nih.gov/32119368/ (accessed on 7 March 2023).
- Blanco, A.; Blanco, G. Chapter 8—Enzymes. In Medical Biochemistry; Academic Press: Cambridge, MA, USA, 2017; pp. 153–175. [Google Scholar] [CrossRef]
- Robinson, P.K. Enzymes: Principles and biotechnological applications. Essays Biochem. 2015, 59, 1–41. [Google Scholar] [CrossRef] [PubMed]
- Cutlan, R.; De Rose, S.; Isupov, M.N.; Littlechild, J.A.; Harmer, N.J. Using enzyme cascades in biocatalysis: Highlight on transaminases and carboxylic acid reductases. Biochim. Biophys. Acta Proteins Proteom. 2020, 1868, 140322. [Google Scholar] [CrossRef] [PubMed]
- Cass, T. Enzymology. In Handbook of Biosensors and Biochips; John Wiley & Sons: Hoboken, NJ, USA, 2008. [Google Scholar] [CrossRef]
- Turner, A.; Malhotra, B.D. Advances in Biosensors: Perspectives in Biosensors; JAI Press: Stamford, CT, USA, 2003. [Google Scholar]
- Perumal, V.; Hashim, U. Advances in biosensors: Principle, architecture and applications. J. Appl. Biomed. 2014, 12, 1–15. [Google Scholar] [CrossRef]
- Liu, H.; Ge, J.; Ma, E.; Yang, L. Advanced biomaterials for biosensor and theranostics. In Biomaterials in Translational Medicine; Academic Press: Cambridge, MA, USA, 2019; pp. 213–255. [Google Scholar] [CrossRef]
- Zhuo, Z.; Yu, Y.; Wang, M.; Li, J.; Zhang, Z.; Liu, J.; Wu, X.; Lu, A.; Zhang, G.; Zhang, B. Recent Advances in SELEX Technology and Aptamer Applications in Biomedicine. Int. J. Mol. Sci. 2017, 18, 2142. [Google Scholar] [CrossRef]
- Villalonga, A.; Pérez-Calabuig, A.M.; Villalonga, R. Electrochemical biosensors based on nucleic acid aptamers. Anal. Bioanal. Chem. 2020, 412, 55–72. [Google Scholar] [CrossRef]
- Ellington, A.D.; Szostak, J.W. In vitro selection of RNA molecules that bind specific ligands. Nature 1990, 346, 818–822. [Google Scholar] [CrossRef]
- Tuerk, C.; Gold, L. Systematic evolution of ligands by exponential enrichment: RNA ligands to bacteriophage T4 DNA polymerase. Science 1990, 249, 505–510. [Google Scholar] [CrossRef]
- Colas, P.; Cohen, B.; Jessen, T.; Grishina, I.; McCoy, J.; Brent, R. Genetic selection of peptide aptamers that recognize and inhibit cyclin-dependent kinase 2. Nature 1996, 380, 548–550. [Google Scholar] [CrossRef]
- Hays, E.M.; Duan, W.; Shigdar, S. Aptamers and glioblastoma: Their potential use for imaging and therapeutic applications. Int. J. Mol. Sci. 2017, 18, 2576. [Google Scholar] [CrossRef]
- Gan, Z.; Roslan, M.A.M.; Shukor, M.Y.A.; Halim, M.; Yasid, N.A.; Abdullah, J.; Yasin, I.S.M.; Wasoh, H. Advances in Aptamer-Based Biosensors and Cell-Internalizing SELEX Technology for Diagnostic and Therapeutic Application. Biosensors 2022, 12, 922. [Google Scholar] [CrossRef]
- Zou, X.; Wu, J.; Gu, J.; Shen, L.; Mao, L. Application of aptamers in virus detection and antiviral therapy. Front. Microbiol. 2019, 10, 1462. [Google Scholar] [CrossRef]
- Mehlhorn, A.; Rahimi, P.; Joseph, Y. Aptamer-Based Biosensors for Antibiotic Detection: A Review. Biosensors 2018, 8, 54. [Google Scholar] [CrossRef]
- Wang, Q.L.; Cui, H.F.; Du, J.F.; Lv, Q.Y.; Song, X. In silico post-SELEX screening and experimental characterizations for acquisition of high affinity DNA aptamers against carcinoembryonic antigen. RSC Adv. 2019, 9, 6328–6334. [Google Scholar] [CrossRef]
- Sun, H.; Zhu, X.; Lu, P.Y.; Rosato, R.R.; Tan, W.; Zu, Y. Oligonucleotide aptamers: New tools for targeted cancer therapy. Mol. Ther. Nucleic Acids 2014, 3, E182. [Google Scholar] [CrossRef]
- Yoo, H.; Jo, H.; Oh, S.S. Detection and beyond: Challenges and advances in aptamer-based biosensors. Mater. Adv. 2020, 1, 2663–2687. [Google Scholar] [CrossRef]
- Skerra, A. Alternative non-antibody scaffolds for molecular recognition. Curr. Opin. Biotechnol. 2007, 18, 295–304. [Google Scholar] [CrossRef]
- Yasui, N.; Nakamura, K.; Yamashita, A. A sweet protein monellin as a non-antibody scaffold for synthetic binding proteins. J. Biochem. 2021, 169, 585–599. [Google Scholar] [CrossRef]
- Wang, X.; Li, F.; Qiu, W.; Xu, B.; Li, Y.; Lian, X.; Yu, H.; Zhang, Z.; Wang, J.; Li, Z.; et al. SYNBIP: Synthetic binding proteins for research, diagnosis and therapy. Nucleic Acids Res. 2022, 50, D560–D570. [Google Scholar] [CrossRef]
- Estrela, P.; Ferrigno, P.K. Non-antibody protein-based biosensors. Essays Biochem. 2016, 60, 19–25. [Google Scholar] [CrossRef]
- Crapnell, R.D.; Hudson, A.; Foster, C.W.; Eersels, K.; van Grinsven, B.; Cleij, T.J.; Banks, C.E.; Peeters, M. Recent Advances in Electrosynthesized Molecularly Imprinted Polymer Sensing Platforms for Bioanalyte Detection. Sensors 2019, 19, 1204. [Google Scholar] [CrossRef] [PubMed]
- Uzun, L.; Turner, A.P.F. Molecularly-imprinted polymer sensors: Realising their potential. Biosens. Bioelectron. 2016, 76, 131–144. [Google Scholar] [CrossRef]
- Hasseb, A.A.; Ghani, N.D.T.A.; Shehab, O.R.; El Nashar, R.M. Application of molecularly imprinted polymers for electrochemical detection of some important biomedical markers and pathogens. Curr. Opin. Electrochem. 2022, 31, 100848. [Google Scholar] [CrossRef]
- Crapnell, R.D.; Dempsey-Hibbert, N.C.; Peeters, M.; Tridente, A.; Banks, C.E. Molecularly imprinted polymer based electrochemical biosensors: Overcoming the challenges of detecting vital biomarkers and speeding up diagnosis. Talanta Open 2020, 2, 100018. [Google Scholar] [CrossRef]
- Cui, B.; Liu, P.; Liu, X.; Liu, S.; Zhang, Z. Molecularly imprinted polymers for electrochemical detection and analysis: Progress and perspectives. J. Mater. Res. Technol. 2020, 9, 12568–12584. [Google Scholar] [CrossRef]
- Nguyen, H.H.; Park, J.; Kang, S.; Kim, M. Surface plasmon resonance: A versatile technique for biosensor applications. Sensors 2015, 15, 10481–10510. [Google Scholar] [CrossRef] [PubMed]
- Vachali, P.P.; Li, B.; Bartschi, A.; Bernstein, P.S. Surface Plasmon Resonance (SPR)-Based Biosensor Technology for the Quantitative Characterization of Protein-Carotenoid Interactions. Arch. Biochem. Biophys. 2014, 572, 66–72. [Google Scholar] [CrossRef]
- Yanase, Y.; Hiragun, T.; Ishii, K.; Kawaguchi, T.; Yanase, T.; Kawai, M.; Sakamoto, K.; Hide, M. Surface Plasmon Resonance for Cell-Based Clinical Diagnosis. Sensors 2014, 14, 4948–4959. [Google Scholar] [CrossRef]
- Schasfoort, R.B.M. (Ed.) Handbook of Surface Plasmon Resonance; The Royal Society of Chemistry: London, UK, 2017. [Google Scholar] [CrossRef]
- Drescher, D.G.; Drescher, M.J.; Ramakrishnan, N.A. Surface plasmon resonance (SPR) analysis of binding interactions of proteins in inner-ear sensory epithelia. Methods Mol. Biol. 2009, 493, 323–343. [Google Scholar] [CrossRef]
- Real-Time and Label-Free Bio-Sensing of Molecular Interactions by Surface Plasmon Resonance: A Laboratory Medicine Perspective—PubMed. Available online: https://pubmed.ncbi.nlm.nih.gov/23267248/ (accessed on 9 March 2023).
- Puiu, M.; Bala, C. SPR and SPR imaging: Recent trends in developing nanodevices for detection and real-time monitoringof biomolecular events. Sensors 2016, 16, 870. [Google Scholar] [CrossRef]
- Xu, J.; Wang, L. Carbon Nanomaterials. In Nano-Inspired Biosensors for Protein Assay with Clinical Applications; Elsevier: Amsterdam, The Netherlands, 2018; pp. 3–38. [Google Scholar] [CrossRef]
- Kooyman, R.P.H.; Corn, R.M.; Wark, A.; Lee, H.J.; Gedig, E.; Engbers, G.; Walstrom, L.; de Mol, N.J.; Hall, D.R.; Yager, P.; et al. Handbook of Surface Plasmon Resonance; The Royal Society of Chemistry: London, UK, 2008. [Google Scholar] [CrossRef]
- Boutilier, J.; Moulton, H.M. Surface plasmon resonance-based concentration determination assay: Label-free and antibody-free quantification of morpholinos. Methods Mol. Biol. 2017, 1565, 251–263. [Google Scholar] [CrossRef]
- Önell, A.; Andersson, K. Kinetic determinations of molecular interactions using Biacore—Minimum data requirements for efficient experimental design. J. Mol. Recognit. 2005, 18, 307–317. [Google Scholar] [CrossRef]
- Bakhtiar, R. Surface plasmon resonance spectroscopy: A versatile technique in a biochemist’s toolbox. J. Chem. Educ. 2013, 90, 203–209. [Google Scholar] [CrossRef]
- Visser, N.F.C.; Heck, A.J.R. Surface plasmon resonance mass spectrometry in proteomics. Expert Rev. Proteom. 2014, 5, 425–433. [Google Scholar] [CrossRef]
- Kuroki, K.; Maenaka, K. Analysis of Receptor–Ligand Interactions by Surface Plasmon Resonance. Methods Mol. Biol. 2011, 748, 83–106. [Google Scholar] [CrossRef]
- Thillaivinayagalingam, P.; O’Donovan, K.; Newcombe, A.R.; Keshavarz-Moore, E. Characterisation of an industrial affinity process used in the manufacturing of digoxin-specific polyclonal Fab fragments. J. Chromatogr. B Analyt. Technol. Biomed Life Sci. 2007, 848, 88–96. [Google Scholar] [CrossRef]
- Thillaivinayagalingam, P.; Gommeaux, J.; McLoughlin, M.; Collins, D.; Newcombe, A.R. Biopharmaceutical production: Applications of surface plasmon resonance biosensors. J. Chromatogr. B 2010, 878, 149–153. [Google Scholar] [CrossRef]
- Sustarsic, M.; Kapanidis, A.N. Taking the ruler to the jungle: Single-molecule FRET for understanding biomolecular structure and dynamics in live cells. Curr. Opin. Struct. Biol. 2015, 34, 52–59. [Google Scholar] [CrossRef]
- Okamoto, K.; Sako, Y. Recent advances in FRET for the study of protein interactions and dynamics. Curr. Opin. Struct. Biol. 2017, 46, 16–23. [Google Scholar] [CrossRef]
- Algar, W.R.; Hildebrandt, N.; Vogel, S.S.; Medintz, I.L. FRET as a biomolecular research tool—understanding its potential while avoiding pitfalls. Nat. Methods 2019, 16, 815–829. [Google Scholar] [CrossRef]
- Obeng, E.M.; Dullah, E.C.; Danquah, M.K.; Budiman, C.; Ongkudon, C.M. FRET spectroscopy-towards effective biomolecular probing. Anal. Methods 2016, 8, 5323–5337. [Google Scholar] [CrossRef]
- Kaur, A.; Dhakal, S. Recent applications of FRET-based multiplexed techniques. TrAC Trends Anal. Chem. 2020, 123, 115777. [Google Scholar] [CrossRef]
- Sanders, J.C.; Holmstrom, E.D. Integrating single-molecule FRET and biomolecular simulations to study diverse interactions between nucleic acids and proteins. Essays Biochem. 2021, 65, 37–49. [Google Scholar] [CrossRef] [PubMed]
- ATTO-TECGmbh: Fluorescent Labels and Dyes—Google Scholar. Available online: https://scholar.google.com/scholar_lookup?title=Fluorescent%20labels%20and%20dyes&author=A.-T.%20Gmbh&publication_year=2009&book=ATTO-TEC%20Gmbh%20Fluorescent%20Labels%20and%20Dyes%20Catalogue (accessed on 21 March 2023).
- Son, H.; Mo, W.; Park, J.; Lee, J.-W.; Lee, S. Single-Molecule FRET Detection of Sub-Nanometer Distance Changes in the Range Below a 3-Nanometer Scale. Biosensors 2020, 10, 168. Available online: https://www.mdpi.com/883394 (accessed on 21 March 2023). [CrossRef]
- Lakowicz, J. Principles of Fluorescence Spectroscopy; Springer: Berlin/Heidelberg, Germany, 2006; Available online: https://link.springer.com/chapter/10.1007/978-0-387-46312-4_2 (accessed on 21 March 2023).
- Šimková, E.; Staněk, D. Probing nucleic acid interactions and pre-mRNA splicing by förster resonance energy transfer (FRET) microscopy. Int. J. Mol. Sci. 2012, 13, 14929–14945. [Google Scholar] [CrossRef]
- Sahoo, H. Förster resonance energy transfer—A spectroscopic nanoruler: Principle and applications. J. Photochem. Photobiol. C Photochem. Rev. 2011, 12, 20–30. [Google Scholar] [CrossRef]
- Qu, S.; Liu, C.; Liu, Q.; Wu, W.; Du, B.; Wang, J. Solvent effect on FRET spectroscopic ruler. J. Chem. Phys. 2018, 148, 123331. [Google Scholar] [CrossRef]
- Bunt, G.; Wouters, F.S. FRET from single to multiplexed signaling events. Biophys. Rev. 2017, 9, 119–129. [Google Scholar] [CrossRef]
- Scarlett, G.; Siligardi, G.; Kneale, G.G. Circular Dichroism for the Analysis of Protein-DNA Interactions. Methods Mol. Biol. 2015, 1334, 299–312. [Google Scholar] [CrossRef]
- Circular Dichroism–Chemistry LibreTexts. Available online: https://chem.libretexts.org/Bookshelves/Physical_and_Theoretical_Chemistry_Textbook_Maps/Supplemental_Modules_(Physical_and_Theoretical_Chemistry)/Spectroscopy/Electronic_Spectroscopy/Circular_Dichroism (accessed on 21 March 2023).
- Siligardi, G.; Hussain, R. Circular dichroism, applications. In Encyclopedia of Spectroscopy and Spectrometry; Academic Press: Cambridge, MA, USA, 2016; pp. 293–298. [Google Scholar] [CrossRef]
- Dodero, V.I.; Quirolo, Z.B.; Sequeira, M.A. Biomolecular studies by circular dichroism. Front. Biosci. 2011, 16, 61–73. [Google Scholar] [CrossRef]
- Pignataro, M.F.; Herrera, M.G.; Dodero, V.I. Evaluation of Peptide/Protein Self-Assembly and Aggregation by Spectroscopic Methods. Molecules 2020, 20, 4854. [Google Scholar] [CrossRef]
- Rodger, A.; Marshall, D. Beginners guide to circular dichroism. Biochemist 2021, 43, 58–64. [Google Scholar] [CrossRef]
- Garbett, N.C.; Ragazzon, P.A.; Chaires, J.B. Circular dichroism to determine binding mode and affinity of ligand-DNA interactions. Nat. Protoc. 2007, 2, 3166–3172. [Google Scholar] [CrossRef]
- Chang, Y.-M.; Chen, C.K.-M.; Hou, M.-H. Conformational Changes in DNA upon Ligand Binding Monitored by Circular Dichroism. Open Access Int. J. Mol. Sci. 2012, 13, 13. [Google Scholar] [CrossRef]
- McKinnon, K.M. Flow Cytometry: An Overview. Curr. Protoc. Immunol. 2018, 120, 5.1.1–5.1.11. [Google Scholar] [CrossRef]
- Brehm-Stecher, B.F. Flow Cytometry. In Encyclopedia of Food Microbiology, 2nd ed.; Academic Press: Cambridge, MA, USA, 2014; pp. 943–953. [Google Scholar] [CrossRef]
- Mudroňová, D. Flow cytometry as an auxiliary tool for the selection of probiotic bacteria. Benef. Microbes 2015, 6, 727–734. [Google Scholar] [CrossRef]
- Shapiro, H.M. Practical Flow Cytometry; John Wiley & Sons: Hoboken, NJ, USA, 2003; p. 681. Available online: https://www.wiley.com/en-us/Practical+Flow+Cytometry%2C+4th+Edition-p-9780471411253 (accessed on 22 March 2023).
- Fleisher, T.A.; Oliveira, J.B. Flow Cytometry. In Clinical Immunology Principles and Practice; Elsevier: Amsterdam, The Netherlands, 2019; pp. 1239–1251.e1. [Google Scholar] [CrossRef]
- Chattopadhyay, P.K.; Hogerkorp, C.M.; Roederer, M. A chromatic explosion: The development and future of multiparameter flow cytometry. Immunology 2008, 125, 441–449. [Google Scholar] [CrossRef]
- Gruden, C.; Skerlos, S.; Adriaens, P. Flow cytometry for microbial sensing in environmental sustainability applications: Current status and future prospects. FEMS Microbiol. Ecol. 2004, 49, 37–49. [Google Scholar] [CrossRef] [PubMed]
- Barteneva, N.S.; Fasler-Kan, E.; Vorobjev, I.A. Imaging Flow Cytometry: Coping with Heterogeneity in Biological Systems. J. Histochem. Cytochem. 2012, 60, 723–733. [Google Scholar] [CrossRef]
- Leipold, M.D.; Newell, E.W.; Maecker, H.T. Multiparameter phenotyping of human pbmcs using mass cytometry. Methods Mol. Biol. 2015, 1343, 81–95. [Google Scholar] [CrossRef]
- Mei, H.E.; Leipold, M.D.; Maecker, H.T. Platinum-conjugated antibodies for application in mass cytometry. Cytom. Part A 2016, 89, 292–300. [Google Scholar] [CrossRef] [PubMed]
- Kennedy, D.; Wilkinson, M.G. Application of flow cytometry to the detection of pathogenic bacteria. Curr. Issues Mol. Biol. 2017, 23, 21–38. [Google Scholar] [CrossRef] [PubMed]
- Buzatu, D.A.; Moskal, T.J.; Williams, A.J.; Cooper, W.M.; Mattes, W.B.; Wilkes, J.G. An integrated flow cytometry-based system for real-time, high sensitivity bacterial detection and identification. PLoS ONE 2014, 9, e94254. [Google Scholar] [CrossRef]
- Bleichrodt, R.J.; Read, N.D. Flow cytometry and FACS applied to filamentous fungi. Fungal Biol. Rev. 2019, 33, 1–15. [Google Scholar] [CrossRef]
- Zhang, Z.; Zhou, J.; Du, X. Electrochemical Biosensors for Detection of Foodborne Pathogens. Micromachines 2019, 10, 222. [Google Scholar] [CrossRef]
- Mishra, G.K.; Sharma, V.; Mishra, R.K. Electrochemical Aptasensors for Food and Environmental Safeguarding: A Review. Biosensors 2018, 8, 28. [Google Scholar] [CrossRef]
- Cesewski, E.; Johnson, B.N. Electrochemical biosensors for pathogen detection. Biosens. Bioelectron. 2020, 159, 112214. [Google Scholar] [CrossRef]
- Reta, N.; Saint, C.P.; Michelmore, A.; Prieto-Simon, B.; Voelcker, N.H. Nanostructured Electrochemical Biosensors for Label-Free Detection of Water- and Food-Borne Pathogens. ACS Appl. Mater. Interfaces 2018, 10, 6055–6072. [Google Scholar] [CrossRef]
- Silva, N.F.D.; Magalhães, J.M.C.S.; Freire, C.; Delerue-Matos, C. Electrochemical biosensors for Salmonella: State of the art and challenges in food safety assessment. Biosens. Bioelectron. 2018, 99, 667–682. [Google Scholar] [CrossRef]
- Soares, R.R.A.; Hjort, R.G.; Pola, C.C.; Parate, K.; Reis, E.L.; Soares, N.F.F.; McLamore, E.S.; Claussen, J.C.; Gomes, C.L. Laser-Induced Graphene Electrochemical Immunosensors for Rapid and Label-Free Monitoring of Salmonella enterica in Chicken Broth. ACS Sens. 2020, 5, 1900–1911. [Google Scholar] [CrossRef]
- Topkaya, S.N.; Azimzadeh, M.; Ozsoz, M. Electrochemical biosensors for cancer biomarkers detection: Recent advances and challenges. Electroanalysis 2016, 28, 1402–1419. [Google Scholar] [CrossRef]
- Kaya, H.O.; Cetin, A.E.; Azimzadeh, M.; Topkaya, S.N. Pathogen detection with electrochemical biosensors: Advantages, challenges and future perspectives. J. Electroanal. Chem. 2021, 882, 114989. [Google Scholar] [CrossRef] [PubMed]
- Bekir, K.; Barhoumi, H.; Braiek, M.; Chrouda, A.; Zine, N.; Abid, N.; Maaref, A.; Bakhrouf, A.; Ouada, H.B.; Jaffrezic-Renault, N.; et al. Electrochemical impedance immunosensor for rapid detection of stressed pathogenic Staphylococcus aureus bacteria. Environ. Sci. Pollut. Res. 2015, 22, 15796–15803. [Google Scholar] [CrossRef]
- Dong, J.; Zhao, H.; Xu, M.; Maa, Q.; Ai, S. A label-free electrochemical impedance immunosensor based on AuNPs/PAMAM-MWCNT-Chi nanocomposite modified glassy carbon electrode for detection of Salmonella typhimurium in milk. Food Chem. 2013, 141, 1980–1986. [Google Scholar] [CrossRef]
- Helali, S.; Alatawi, A.S.E.; Abdelghani, A. Pathogenic Escherichia coli biosensor detection on chicken food samples. J. Food. Saf. 2018, 38, e12510. [Google Scholar] [CrossRef]
- Eissa, S.; Zourob, M. Ultrasensitive peptide-based multiplexed electrochemical biosensor for the simultaneous detection of Listeria monocytogenes and Staphylococcus aureus. Microchim. Acta 2020, 187, 486. [Google Scholar] [CrossRef]
- Nassau, K. Chapter 4: Color produced by vibrations and rotations. In The Physics and Chemistry of Color: The Fifteen Causes of Color; John Wiley & Sons, Inc.: Hoboken, NJ, USA, 2001; pp. 69–79. Available online: https://www.wiley.com/en-us/The+Physics+and+Chemistry+of+Color%3A+The+Fifteen+Causes+of+Color%2C+2nd+Edition-p-9780471391067 (accessed on 23 March 2023).
- Krishnan, S.; Syed, Z.U.Q. Colorimetric Visual Sensors for Point-of-needs Testing. Sens. Actuators Rep. 2022, 4, 100078. [Google Scholar] [CrossRef]
- Zhao, V.X.T.; Wong, T.I.; Zheng, X.T.; Tan, Y.N.; Zhou, X. Colorimetric biosensors for point-of-care virus detections. Mater. Sci. Energy Technol. 2020, 3, 237–249. [Google Scholar] [CrossRef]
- Li, Z.; Askim, J.R.; Suslick, K.S. The Optoelectronic Nose: Colorimetric and Fluorometric Sensor Arrays. Chem. Rev. 2019, 119, 231–292. [Google Scholar] [CrossRef]
- Yu, T.; Xu, H.; Zhao, Y.; Han, Y.; Zhang, Y.; Zhang, J.; Xu, C.; Wang, W.; Guo, Q.; Ge, J. Aptamer based high throughput colorimetric biosensor for detection of staphylococcus aureus. Sci. Rep. 2020, 10, 9190. [Google Scholar] [CrossRef]
- Majdinasab, M.; Hayat, A.; Marty, J.L. Aptamer-based assays and aptasensors for detection of pathogenic bacteria in food samples. TrAC Trends Anal. Chem. 2018, 107, 60–77. [Google Scholar] [CrossRef]
- Zhang, L.; Huang, R.; Liu, W.; Liu, H.; Zhou, X.; Xing, D. Rapid and visual detection of Listeria monocytogenes based on nanoparticle cluster catalyzed signal amplification. Biosens. Bioelectron. 2016, 86, 1–7. [Google Scholar] [CrossRef]
- Yuan, J.; Tao, Z.; Yu, Y.; Ma, X.; Xia, Y.; Wang, L.; Wang, Z. A visual detection method for Salmonella Typhimurium based on aptamer recognition and nanogold labeling. Food Control. 2014, 37, 188–192. [Google Scholar] [CrossRef]
- Ren, W.; Ballou, D.R.; FitzGerald, R.; Irudayaraj, J. Plasmonic enhancement in lateral flow sensors for improved sensing of E. coli O157:H7. Biosens. Bioelectron. 2019, 126, 324–331. [Google Scholar] [CrossRef]
- Geng, T.; Bhunia, A.K. Optical biosensors in foodborne pathogen detection. In Smart Biosensor Technology; CRC Press: Boca Raton, FL, USA, 2006; pp. 505–519. [Google Scholar] [CrossRef]
- Narsaiah, K.; Jha, S.N.; Bhardwaj, R.; Sharma, R.; Kumar, R. Optical biosensors for food quality and safety assurance—A review. J. Food Sci. Technol. 2011, 49, 383–406. [Google Scholar] [CrossRef]
- Sharma, H.; Mutharasan, R. Review of biosensors for foodborne pathogens and toxins. Sens. Actuators B Chem. 2013, 183, 535–549. [Google Scholar] [CrossRef]
- Masdor, N.A.; Altintas, Z.; Tothill, I.E. Surface Plasmon Resonance Immunosensor for the Detection of Campylobacter jejuni. Chemosensors 2017, 5, 16. [Google Scholar] [CrossRef]
- Sanati, P.; Hashemi, S.-S.; Bahadoran, M.; Babadi, A.A.; Akbari, E. Detection of Escherichia coli K12 in Water Using Slot Waveguide in Cascaded Ring Resonator. Silicon 2021, 14, 851–857. [Google Scholar] [CrossRef]
- Kim, D.W.; Chun, J.; Kim, J.-H.; Yoon, H.; Yoon, H.C. A non-spectroscopic optical biosensor for the detection of pathogenic Salmonella typhimurium based on a stem-loop DNA probe and retro-reflective signaling. Nano Converg. 2019, 6, 16. [Google Scholar] [CrossRef]
- Senturk, E.; Aktop, S.; Sanlibaba, P.; Tezel, B.U. Biosensors: A Novel Approach to Detect Food-borne Pathogens. Appl. Microbiol. Open Access 2018, 4, 1–8. [Google Scholar] [CrossRef]
- Nesakumar, N.; Lakshmanakumar, M.; Srinivasan, S.; JBB, A.J.; Rayappan, J.B.B. Principles and Recent Advances in Biosensors for Pathogens Detection. ChemistrySelect 2021, 6, 10063–10091. [Google Scholar] [CrossRef]
- Qiao, Z.; Fu, Y.; Lei, C.; Li, Y. Advances in antimicrobial peptides-based biosensing methods for detection of foodborne pathogens: A review. Food Control. 2020, 112, 107116. [Google Scholar] [CrossRef]
- Lim, H.J.; Saha, T.; Tey, B.T.; Tan, W.S.; Ooi, C.W. Quartz crystal microbalance-based biosensors as rapid diagnostic devices for infectious diseases. Biosens. Bioelectron. 2020, 168, 112513. [Google Scholar] [CrossRef]
- Lian, Y.; He, F.; Wang, H.; Tong, F. A new aptamer/graphene interdigitated gold electrode piezoelectric sensor for rapid and specific detection of Staphylococcus aureus. Biosens. Bioelectron. 2015, 65, 314–319. [Google Scholar] [CrossRef]
- Sharma, H.; Mutharasan, R. Rapid and sensitive immunodetection of Listeria monocytogenes in milk using a novel piezoelectric cantilever sensor. Biosens. Bioelectron. 2013, 45, 158–162. [Google Scholar] [CrossRef]
- Wang, S.; Peng, T.; Meng, Q.; Zhu, X.; Guo, L.; Yao, K.; Wang, Z.; Zheng, P.; Ren, Z.; He, Z.; et al. Rapid and ultrasensitive detection of Salmonella typhimurium using a novel impedance biosensor based on SiO2@MnO2 nanocomposites and interdigitated array microelectrodes. Sens. Actuators B Chem. 2020, 324, 128654. [Google Scholar] [CrossRef]
- Díaz-Amaya, S.; Lin, L.K.; Deering, A.J.; Stanciu, L.A. Aptamer-based SERS biosensor for whole cell analytical detection of E. coli O157:H7. Anal. Chim. Acta 2019, 1081, 146–156. [Google Scholar] [CrossRef]
- Hash, S.; Martinez-Viedma, M.P.; Fung, F.; Han, J.E.; Yang, P.; Wong, C.; Doraisamy, L.; Menon, S.; Lightner, D. Nuclear magnetic resonance biosensor for rapid detection of Vibrio parahaemolyticus. Biomed. J. 2019, 42, 187–192. [Google Scholar] [CrossRef]
- Muniandy, S.; Teh, S.J.; Appaturi, J.N.; Thong, K.L.; Lai, C.W.; Ibrahim, F.; Leo, B.F. A reduced graphene oxide-titanium dioxide nanocomposite based electrochemical aptasensor for rapid and sensitive detection of Salmonella enterica. Bioelectrochemistry 2019, 127, 136–144. [Google Scholar] [CrossRef]
- Luna-Moreno, D.; Sánchez-Álvarez, A.; Islas-Flores, I.; Canto-Canche, B.; Carrillo-Pech, M.; Villarreal-Chiu, J.F.; Rodríguez-Delgado, M. Early Detection of the Fungal Banana Black Sigatoka Pathogen Pseudocercospora fijiensis by an SPR Immunosensor Method. Sensors 2019, 19, 465. [Google Scholar] [CrossRef]
- Morlay, A.; Duquenoy, A.; Piat, F.; Calemczuk, R.; Mercey, T.; Livache, T.; Roupioz, Y. Label-free immuno-sensors for the fast detection of Listeria in food. Measurement 2017, 98, 305–310. [Google Scholar] [CrossRef]
- Alamer, S.; Eissa, S.; Chinnappan, R.; Herron, P.; Zourob, M. Rapid colorimetric lactoferrin-based sandwich immunoassay on cotton swabs for the detection of foodborne pathogenic bacteria. Talanta 2018, 185, 275–280. [Google Scholar] [CrossRef] [PubMed]
- Zhang, Y.; Zhu, L.; He, P.; Zi, F.; Hu, X.; Wang, Q. Sensitive assay of Escherichia coli in food samples by microchip capillary electrophoresis based on specific aptamer binding strategy. Talanta 2019, 197, 284–290. [Google Scholar] [CrossRef]
- Hong, S.A.; Kwon, J.; Kim, D.; Yang, S. A rapid, sensitive and selective electrochemical biosensor with concanavalin A for the preemptive detection of norovirus. Biosens. Bioelectron. 2015, 64, 338–344. [Google Scholar] [CrossRef]
- Can, M.H.T.; Kadam, U.S.; Trinh, K.H.; Cho, Y.; Lee, H.; Kim, Y.; Kim, S.; Kang, C.H.; Kim, S.H.; Chung, W.S.; et al. Engineering Novel Aptameric Fluorescent Biosensors for Analysis of the Neurotoxic Environmental Contaminant Insecticide Diazinon from Real Vegetable and Fruit Samples. Front. Biosci. Landmark 2022, 27, 92. [Google Scholar] [CrossRef]
- Sun, L.; Jiang, Y.; Pan, R.; Li, M.; Wang, R.; Chen, S.; Fu, S.; Man, C. A novel, simple and low-cost paper-based analytical device for colorimetric detection of Cronobacter spp. Anal. Chim. Acta 2018, 1036, 80–88. [Google Scholar] [CrossRef]
- Srisa-Art, M.; Boehle, K.E.; Geiss, B.J.; Henry, C.S. Highly Sensitive Detection of Salmonella typhimurium Using a Colorimetric Paper-Based Analytical Device Coupled with Immunomagnetic Separation. Anal. Chem. 2018, 90, 1035–1043. [Google Scholar] [CrossRef]
- Rani, A.; Ravindran, V.B.; Surapaneni, A.; Mantri, N.; Ball, A.S. Review: Trends in point-of-care diagnosis for Escherichia coli O157:H7 in food and water. Int. J. Food Microbiol. 2021, 349, 109233. [Google Scholar] [CrossRef]
- Cheng, N.; Song, Y.; Zeinhom, M.M.A.; Chang, Y.-C.; Sheng, L.; Li, H.; Du, D.; Li, L.; Zhu, M.-J.; Luo, Y.; et al. Nanozyme-Mediated Dual Immunoassay Integrated with Smartphone for Use in Simultaneous Detection of Pathogens. ACS Appl. Mater. Interfaces 2017, 9, 40671. [Google Scholar] [CrossRef]
- Jung, Y.; Heo, Y.; Lee, J.J.; Deering, A.; Bae, E. Smartphone-based lateral flow imaging system for detection of food-borne bacteria E. coli O157:H7. J. Microbiol. Methods 2020, 168, 105800. [Google Scholar] [CrossRef]
- Nehra, M.; Kumar, V.; Kumar, R.; Dilbaghi, N.; Kumar, S. Current Scenario of Pathogen Detection Techniques in Agro-Food Sector. Biosensors 2022, 12, 489. [Google Scholar] [CrossRef] [PubMed]
- Liu, S.; Zhao, K.; Huang, M.; Zeng, M.; Deng, Y.; Li, S.; Chen, H.; Li, W.; Chen, Z. Research progress on detection techniques for point-of-care testing of foodborne pathogens. Front. Bioeng. Biotechnol. 2022, 10, 1301. [Google Scholar] [CrossRef] [PubMed]
- Quintela, I.A.; Vasse, T.; Lin, C.S.; Wu, V.C.H. Advances, applications, and limitations of portable and rapid detection technologies for routinely encountered foodborne pathogens. Front. Microbiol. 2022, 13, 4879. [Google Scholar] [CrossRef]
- Wu, Q.; Zhang, Y.; Yang, Q.; Yuan, N.; Zhang, W. Review of Electrochemical DNA Biosensors for Detecting Food Borne Pathogens. Sensors 2019, 19, 4916. [Google Scholar] [CrossRef]


| Category | Monoclonal Antibodies | Polyclonal Antibodies |
|---|---|---|
| Synthesis | Synthesized by one clone | Synthesized by numerous clones |
| Production requires both in vitro and in vivo systems | Production is strictly in vivo (animal host is a must) | |
| Production requires trained personnel | Highly skilled personnel are not needed | |
| Short-term production is expensive but long-term production is cheap. | Short-term production is cheap but long-term production is expensive due to animal maintenance and deaths. | |
| Homogeneity | They are homogenous in nature, making it easy to characterize their chemical nature and an easy choice for conjugation to different probes. | They are difficult to characterize since they are not homogenous. |
| Specificity | Highly specific | They are specific but exhibits cross reactivity |
| Degradation | Vulnerable to degradation under slightly harsh conditions. | Less vulnerable to degradation. |
| Affinity Purification | An excellent tool for affinity purification. | They are not a good choice for affinity purification |
| Pathogen | Sample | Detection Method | Nanoprobe | Analysis Time (min) | LOD (CFU/mL) | Reference |
|---|---|---|---|---|---|---|
| Salmonella typhymurium | Milk | Electrochemical Impedance Spectroscopy (EIS) | Monoclonal antibodies | 20 | 21 | [139] |
| Escherichia coli O157:H7 | Beef | Surface enhanced Raman spectroscopy | Aptamer | 20 | 102 | [140] |
| Vibrio parahaemolyticus | Shrimp | Nuclear magnetic resonance spectroscopy | DNA | 10 | 105–108 | [141] |
| Salmonella enterica | Chicken | Differential pulse voltammetry | Aptamer | 5 | 10 | [142] |
| Pseudocercospora fijiensis | Banana | Surface plasmon resonance | Antibody | 40 | 11.7 µg/mL | [143] |
| Listeria | Smoked salmon, milk, duck leg | Surface plasmon resonance | Antibody | 60 | 10 | [144] |
| Campylobacter jejuni Staphylococcus aureus | Chicken meat surface | Colorimetric | Antibody | 120 | 10 100 | [145] |
| Escherichia coli | Milk, water | Fluorescence | Nucleic acid | 2.25 | 3.7 × 10² | [146] |
| Norovirus | Lettuce | Cyclic voltammetry | Concanavalin A | - | 60 copies/mL | [147] |
| Diazinon | Chinese cabbage, tomato, apple | Fluorescence | DNA aptamers | - | - | [148] |
Disclaimer/Publisher’s Note: The statements, opinions and data contained in all publications are solely those of the individual author(s) and contributor(s) and not of MDPI and/or the editor(s). MDPI and/or the editor(s) disclaim responsibility for any injury to people or property resulting from any ideas, methods, instructions or products referred to in the content. |
© 2023 by the authors. Licensee MDPI, Basel, Switzerland. This article is an open access article distributed under the terms and conditions of the Creative Commons Attribution (CC BY) license (https://creativecommons.org/licenses/by/4.0/).
Share and Cite
Bruce-Tagoe, T.A.; Danquah, M.K. Bioaffinity Nanoprobes for Foodborne Pathogen Sensing. Micromachines 2023, 14, 1122. https://doi.org/10.3390/mi14061122
Bruce-Tagoe TA, Danquah MK. Bioaffinity Nanoprobes for Foodborne Pathogen Sensing. Micromachines. 2023; 14(6):1122. https://doi.org/10.3390/mi14061122
Chicago/Turabian StyleBruce-Tagoe, Tracy Ann, and Michael K. Danquah. 2023. "Bioaffinity Nanoprobes for Foodborne Pathogen Sensing" Micromachines 14, no. 6: 1122. https://doi.org/10.3390/mi14061122