
Application of MEMS Accelerometers in Dynamic Vibration Monitoring of a Vehicle


Abstract
:1. Introduction
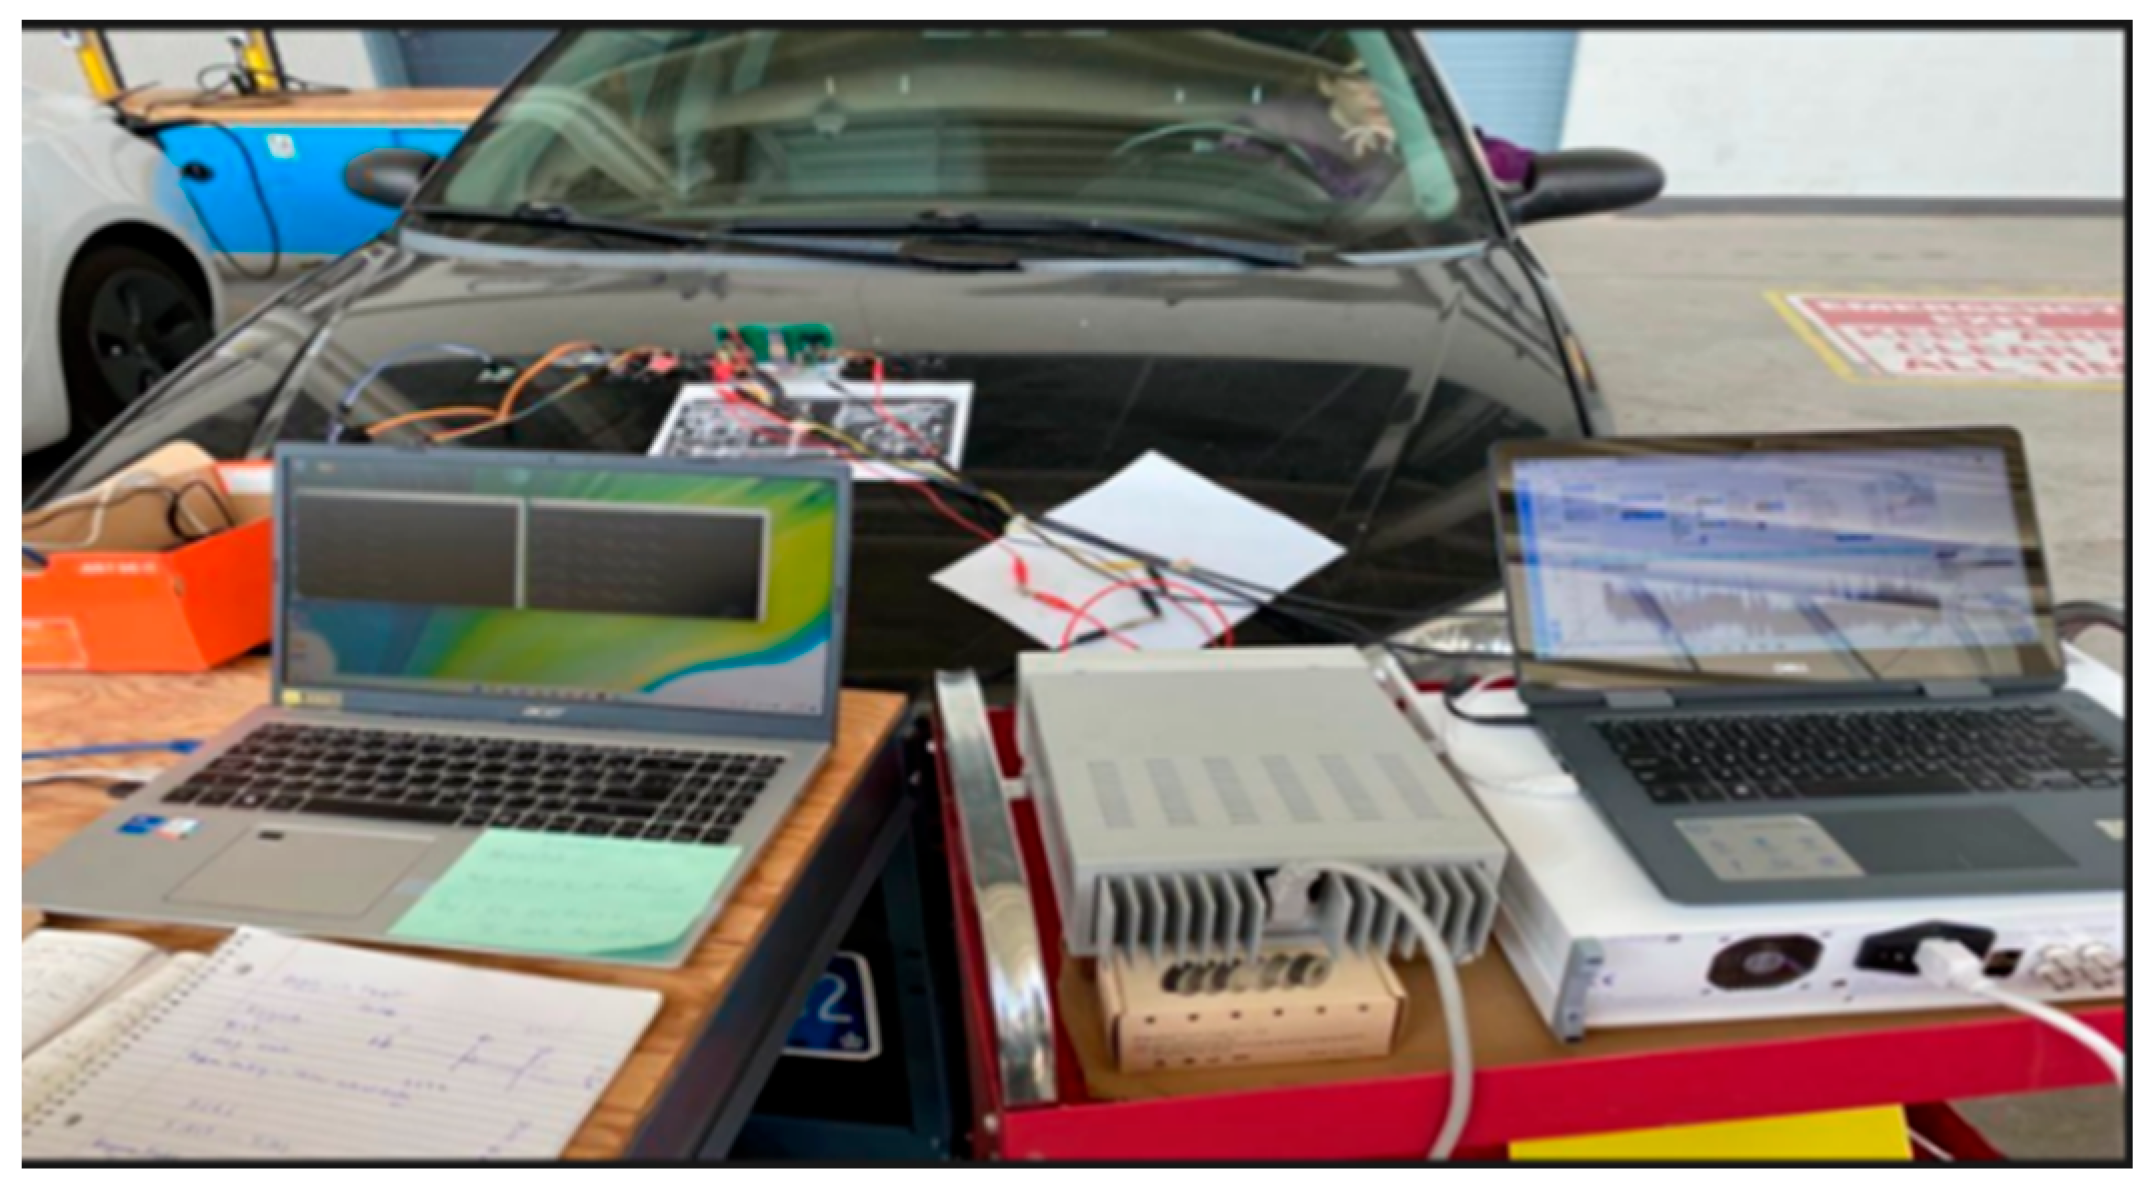
2. Sensors and Test Setup
3. Data Acquisition, Results, and Analysis
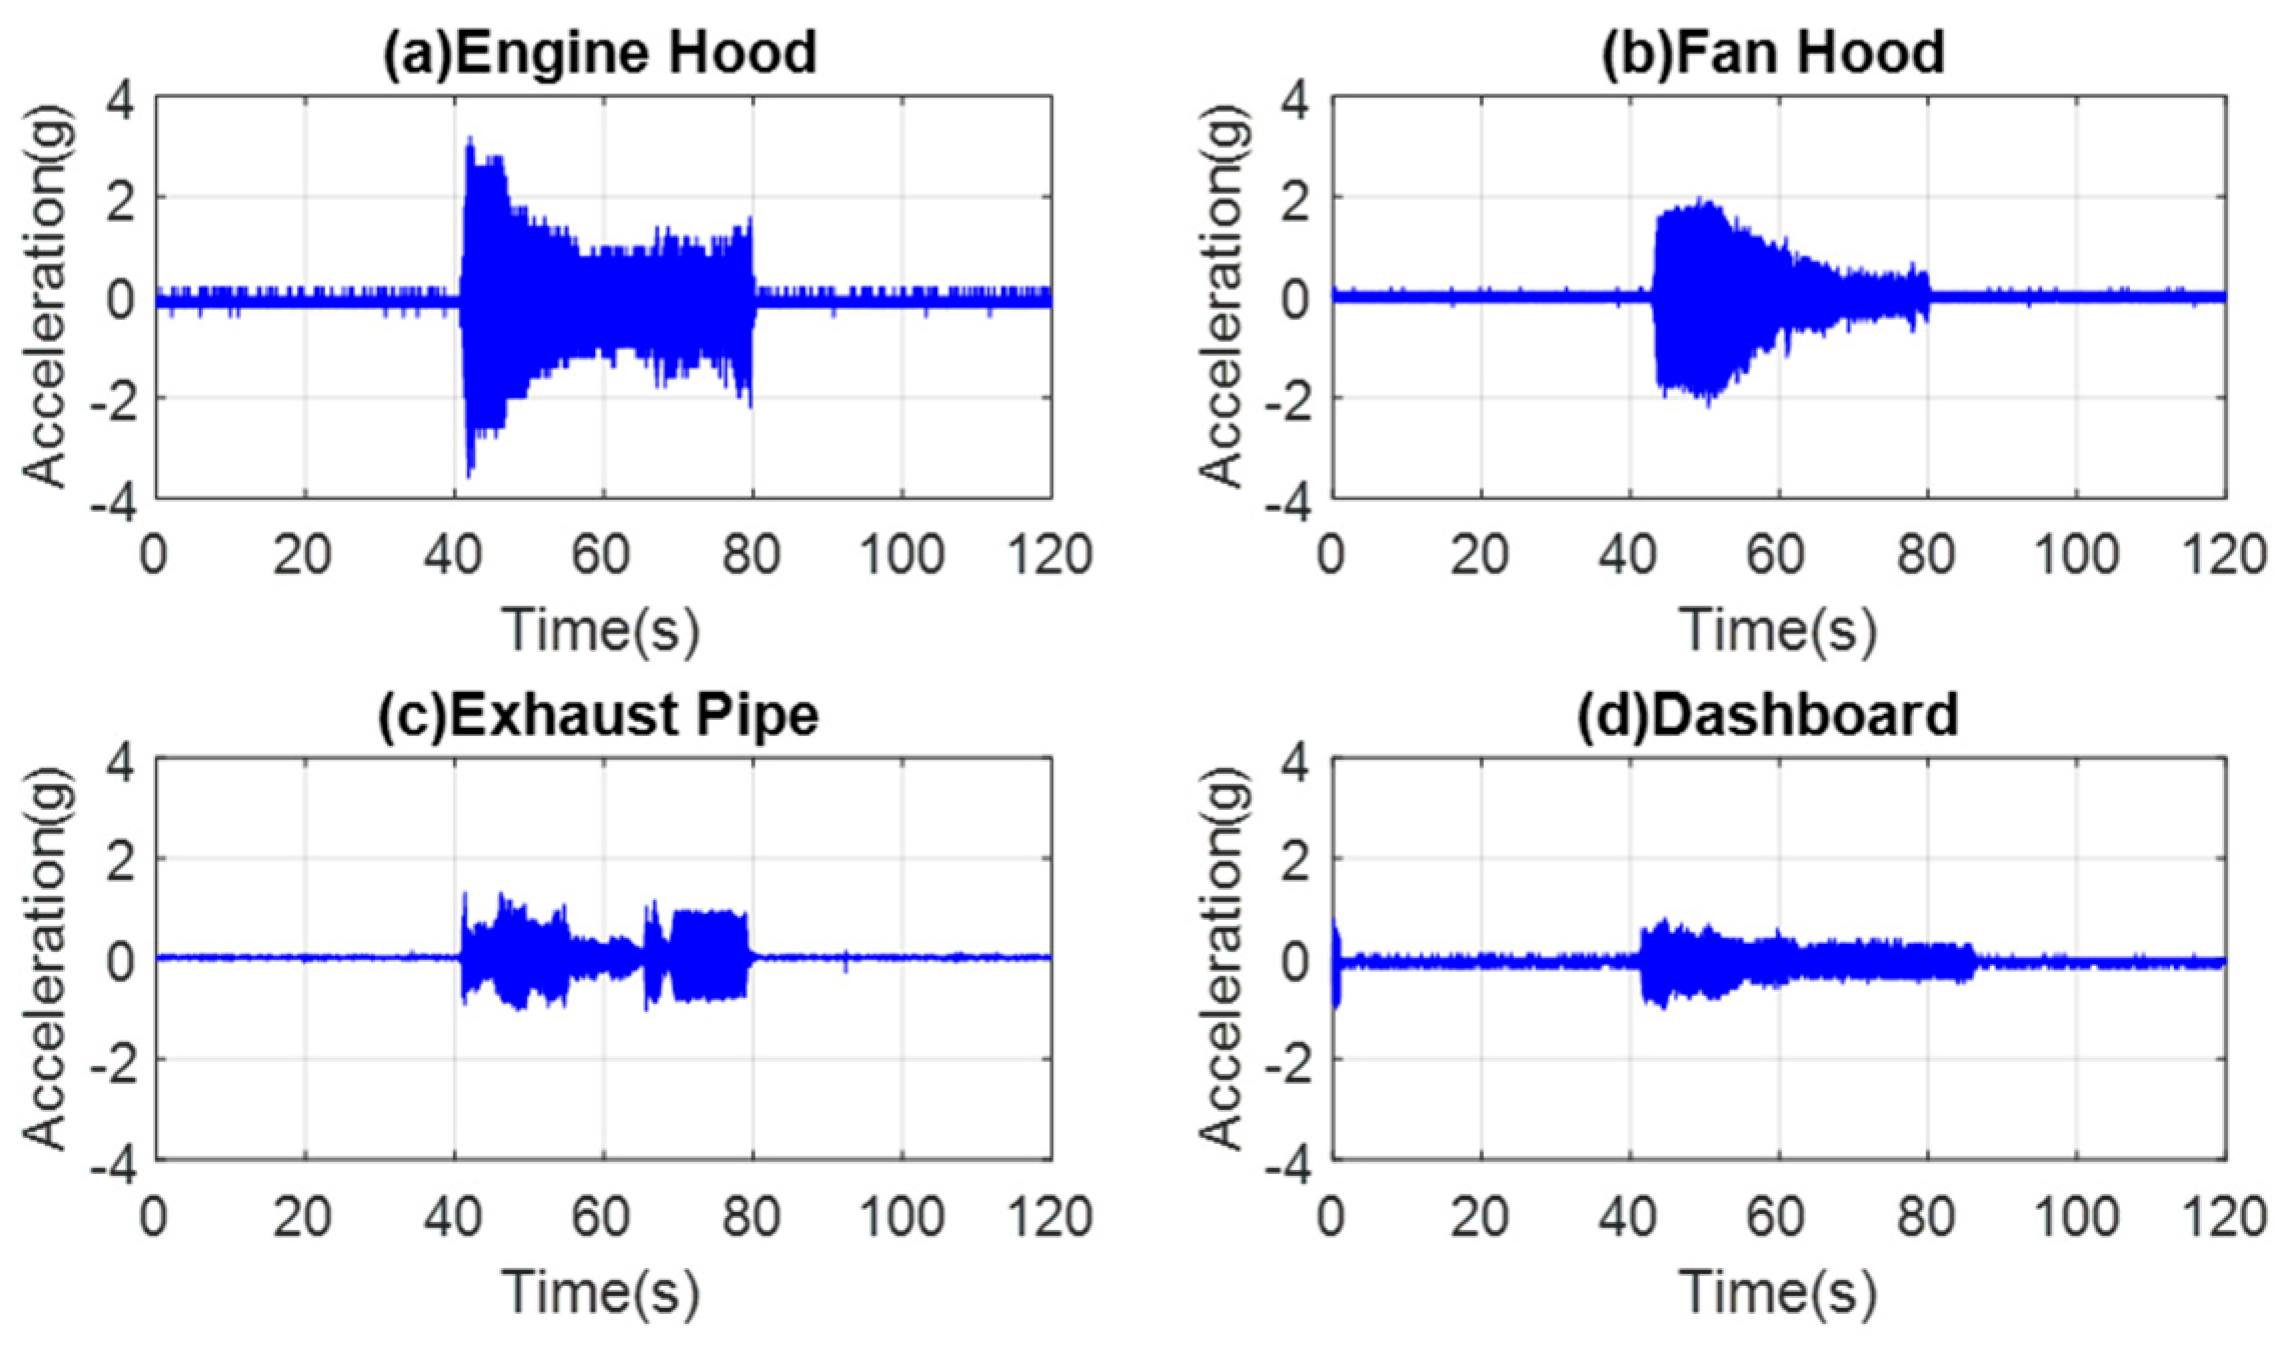
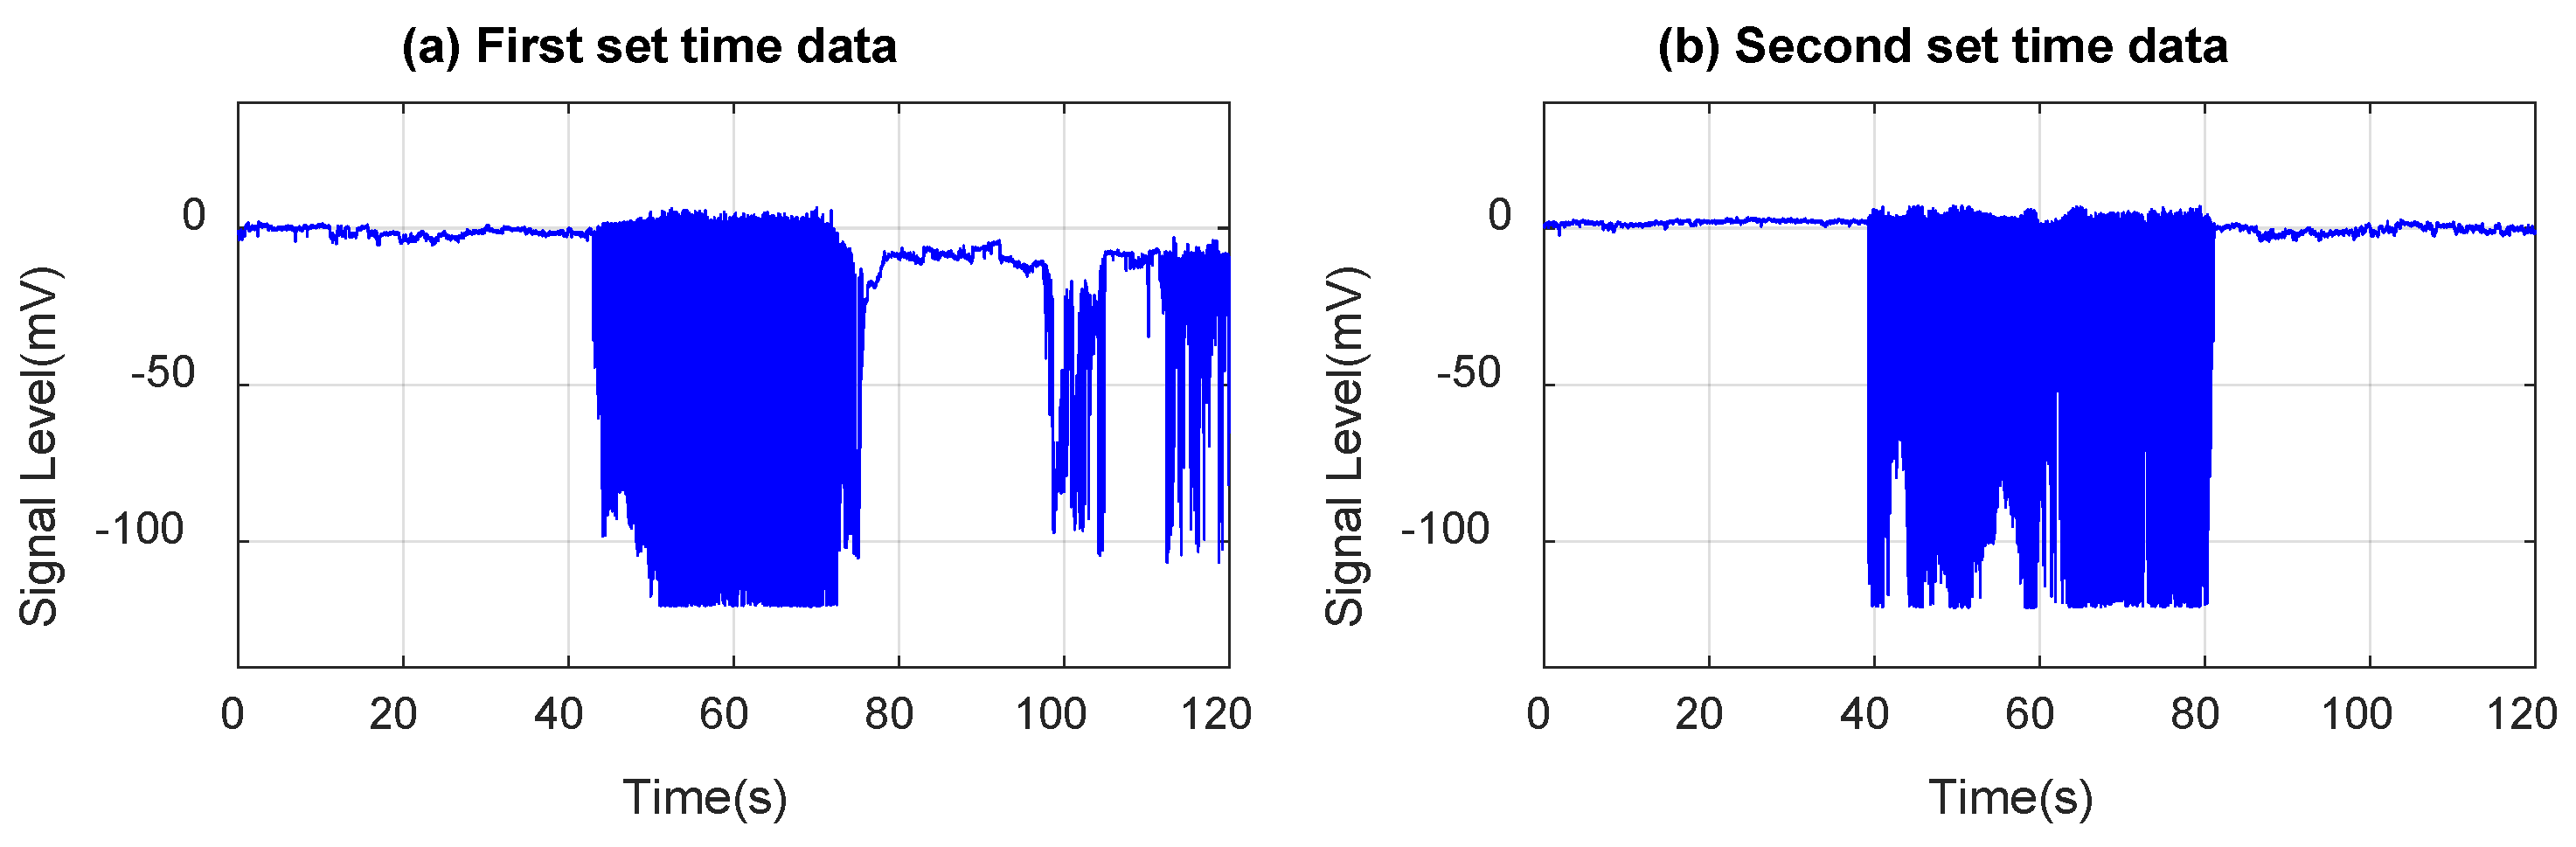
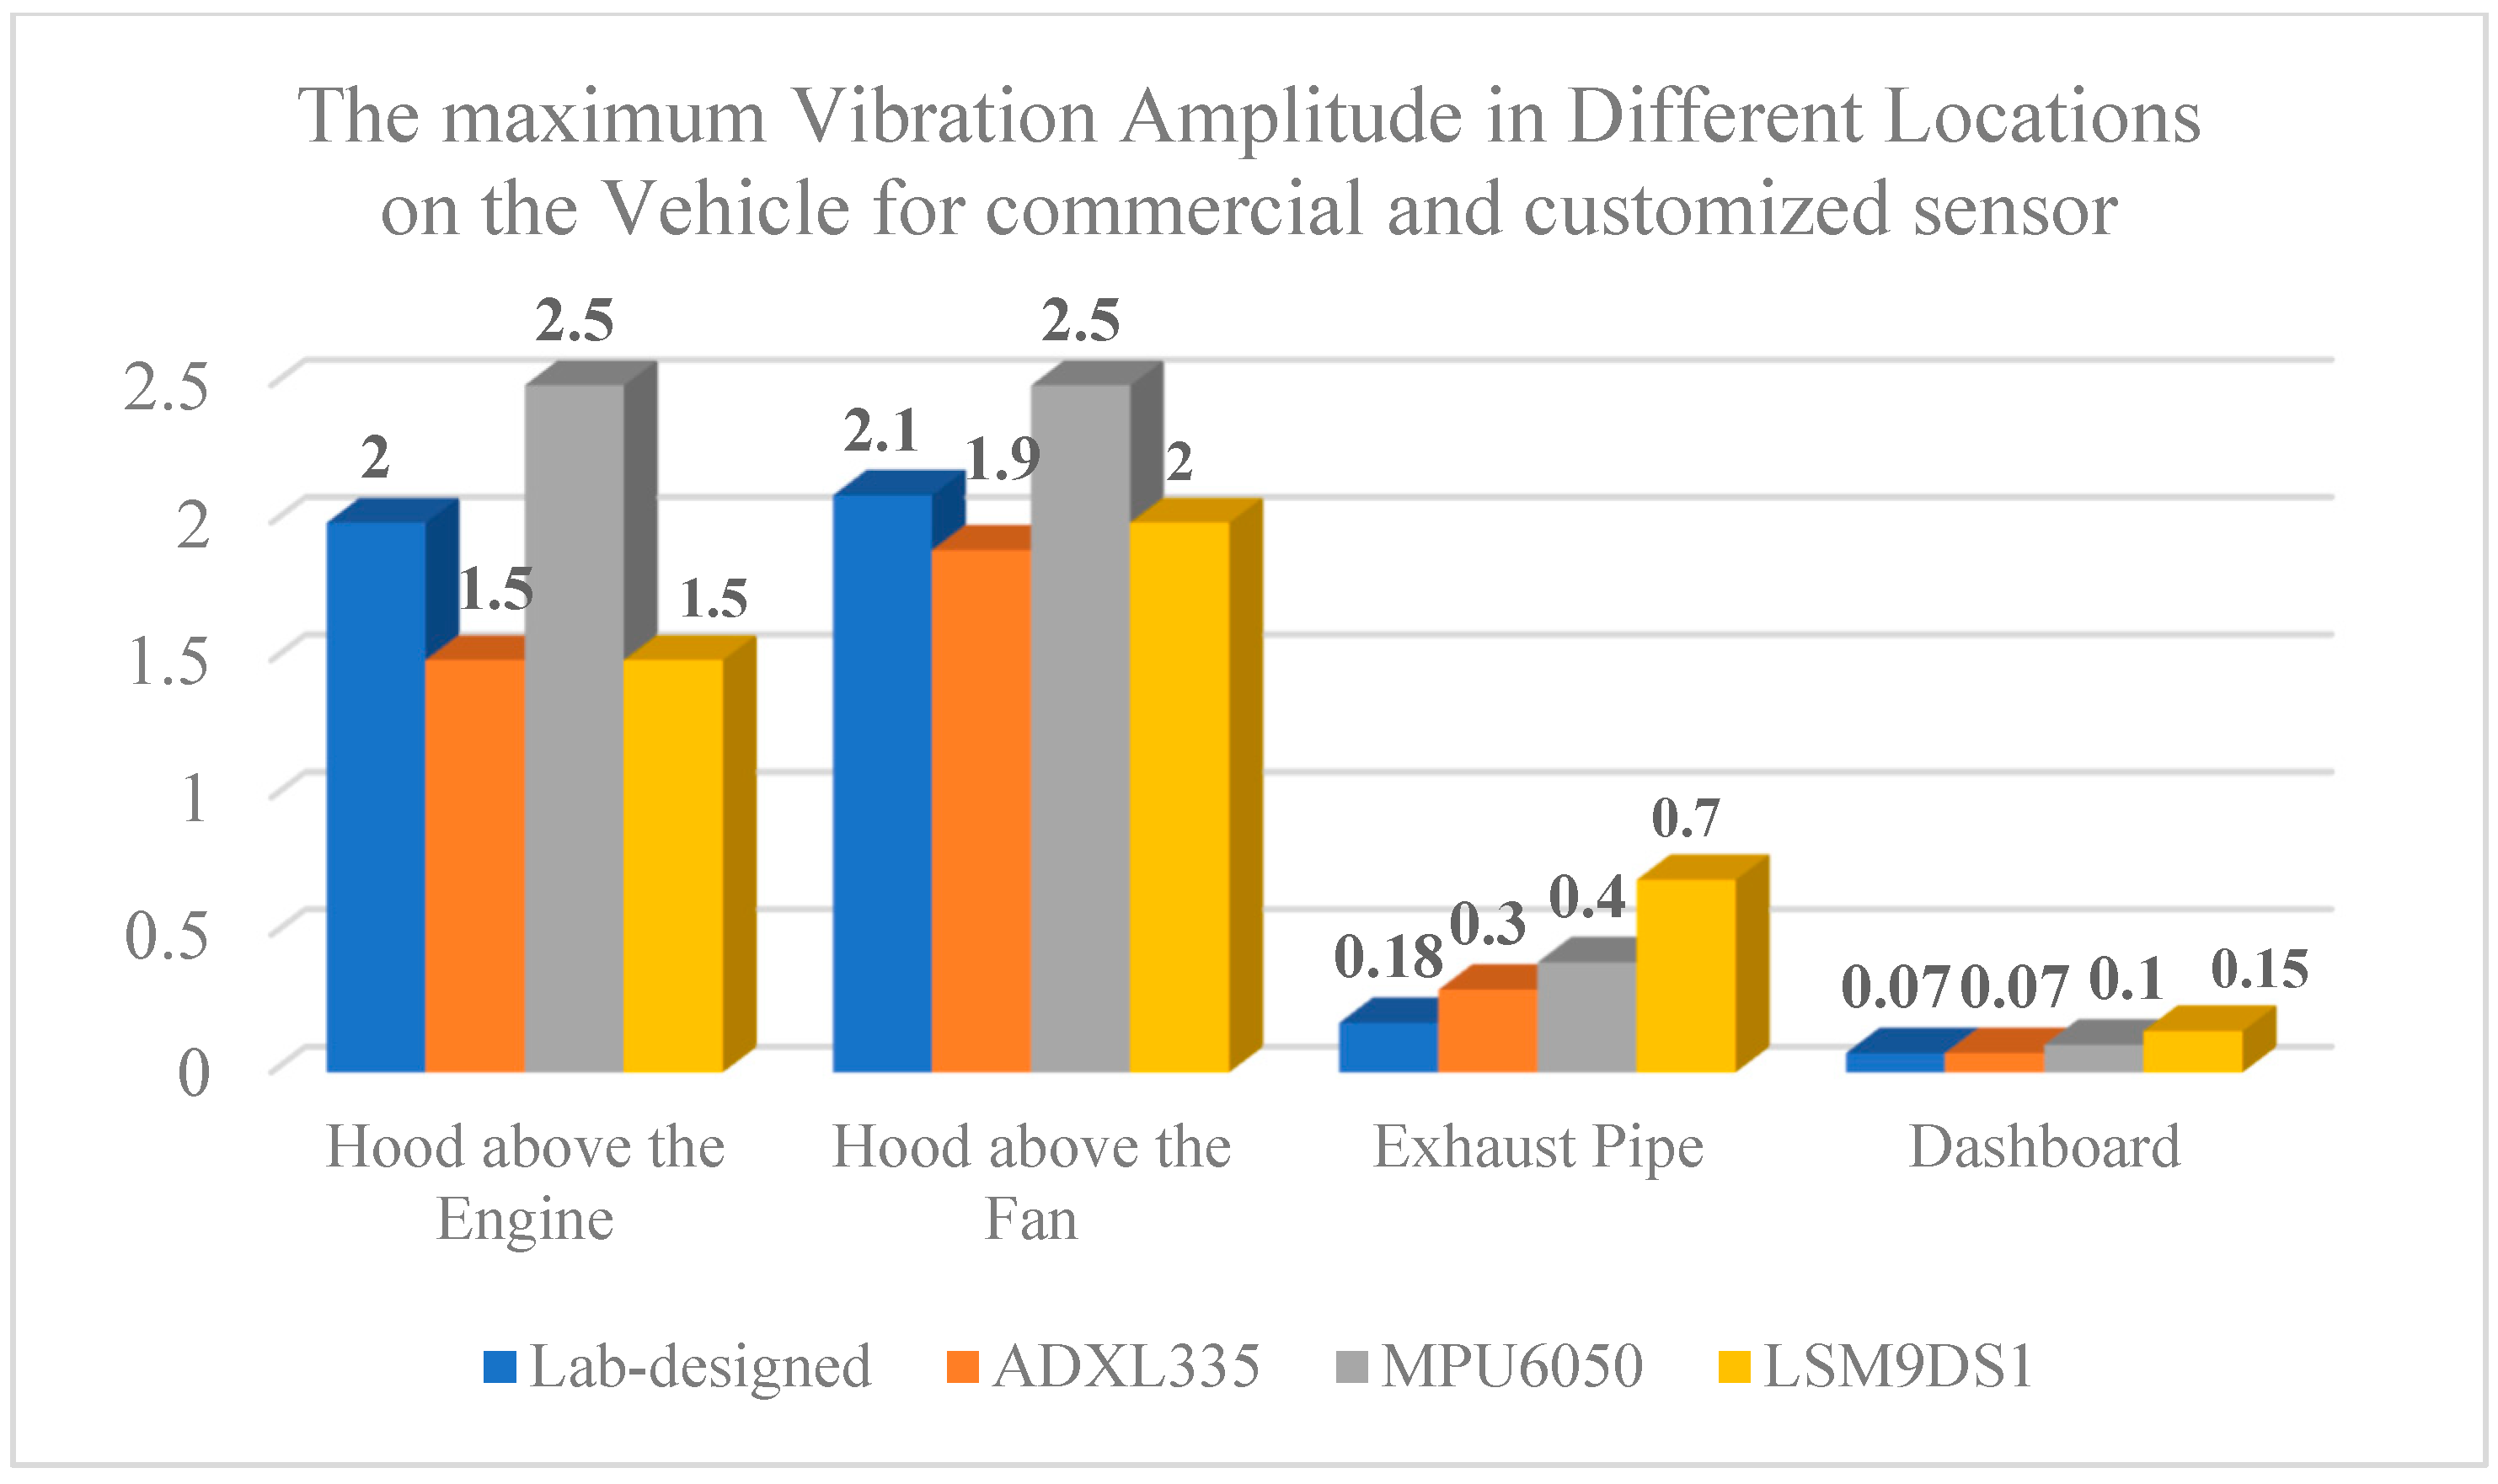
3.1. Dynamic Data of the Vehicle in Idle Engine Mode
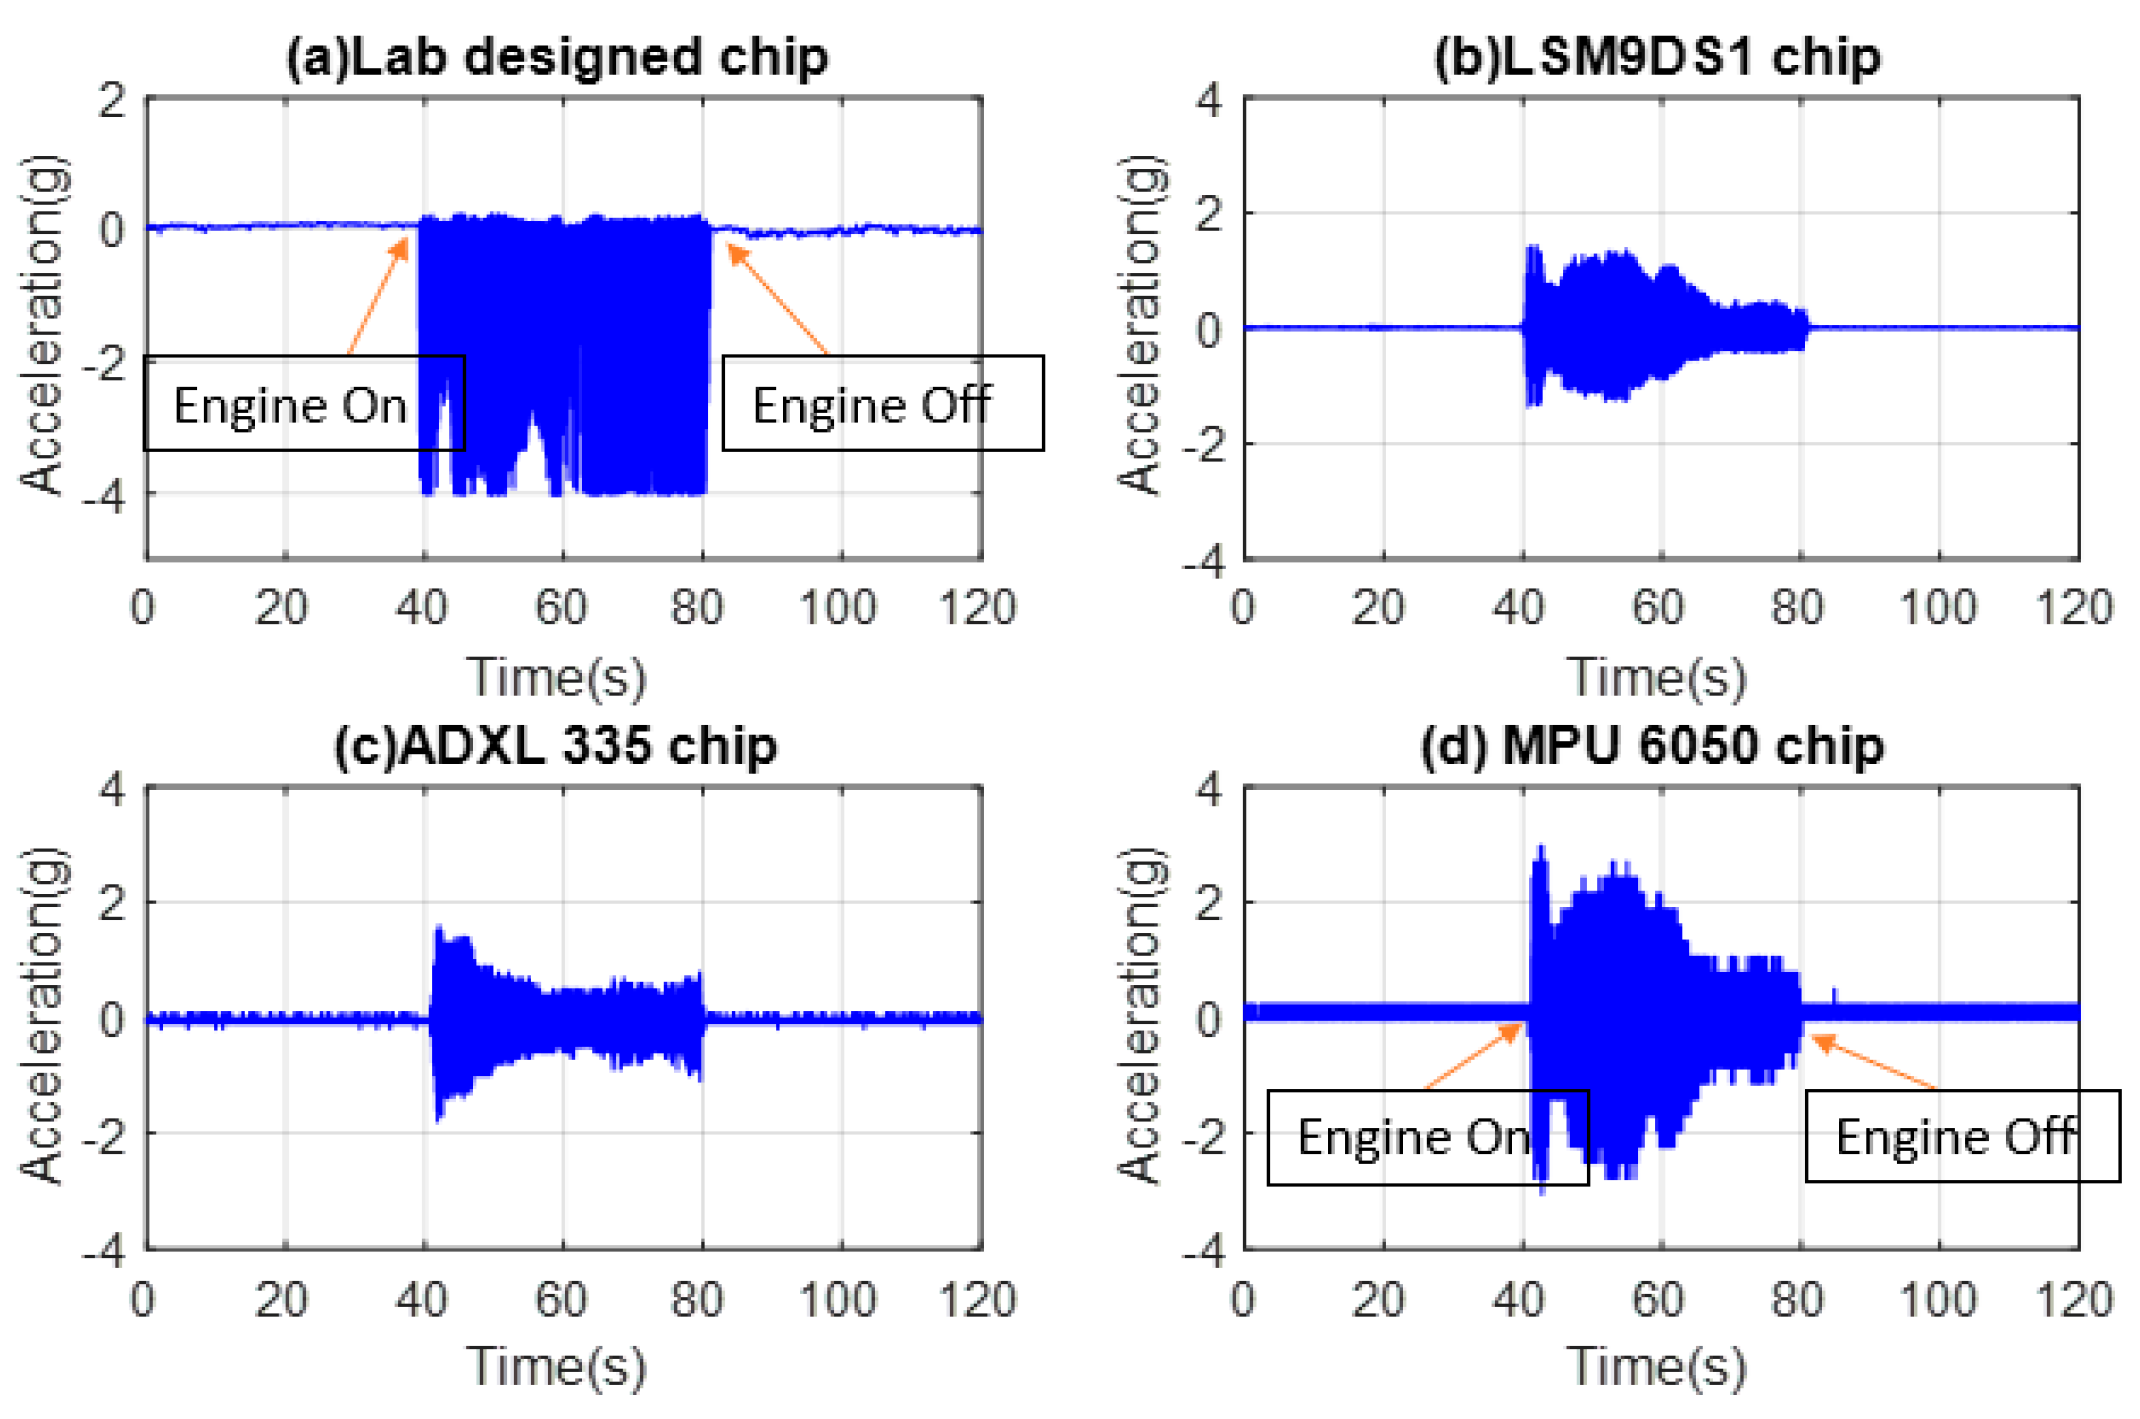
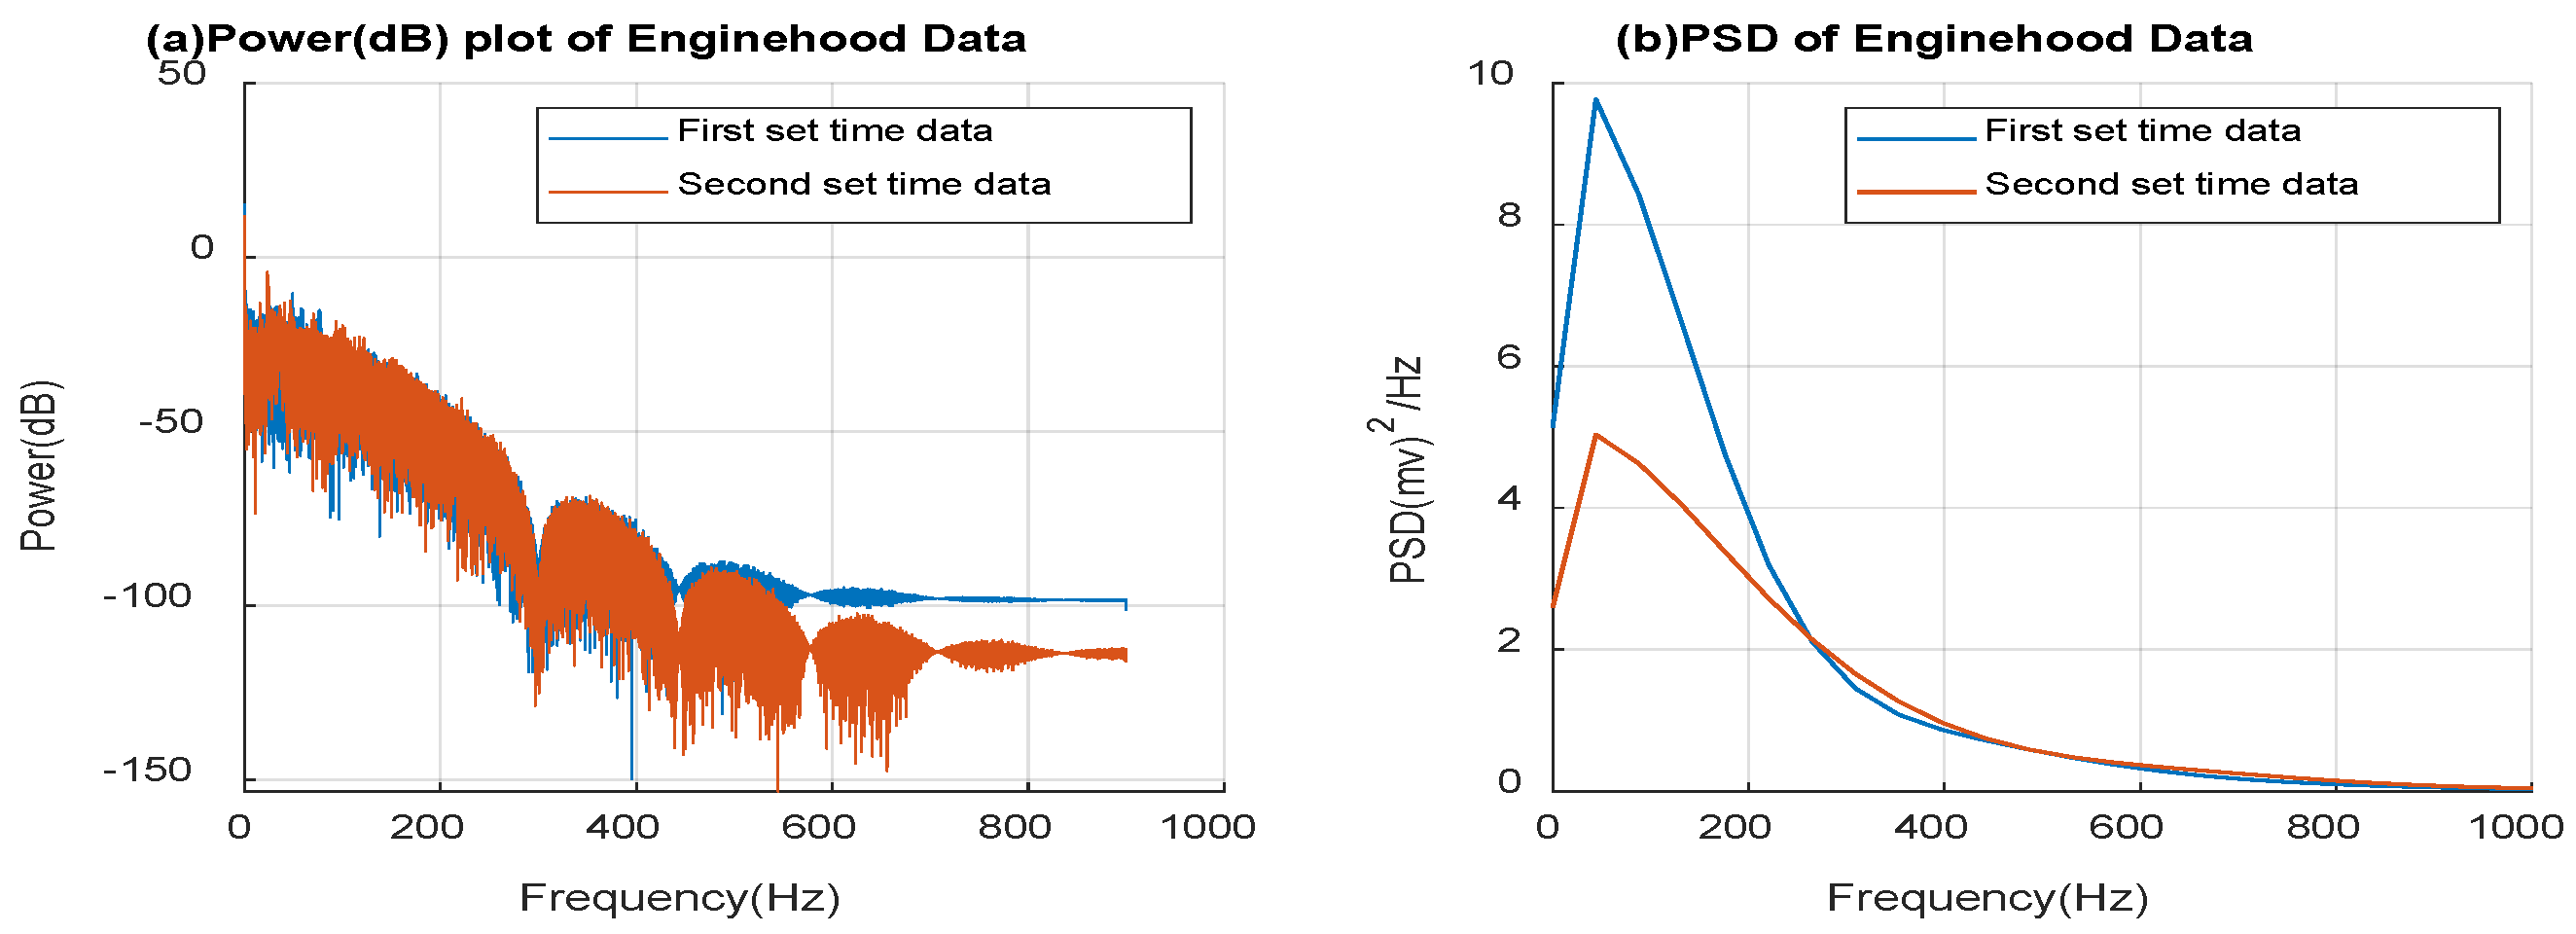
3.1.1. Accelerometers on the Hood above the Engine
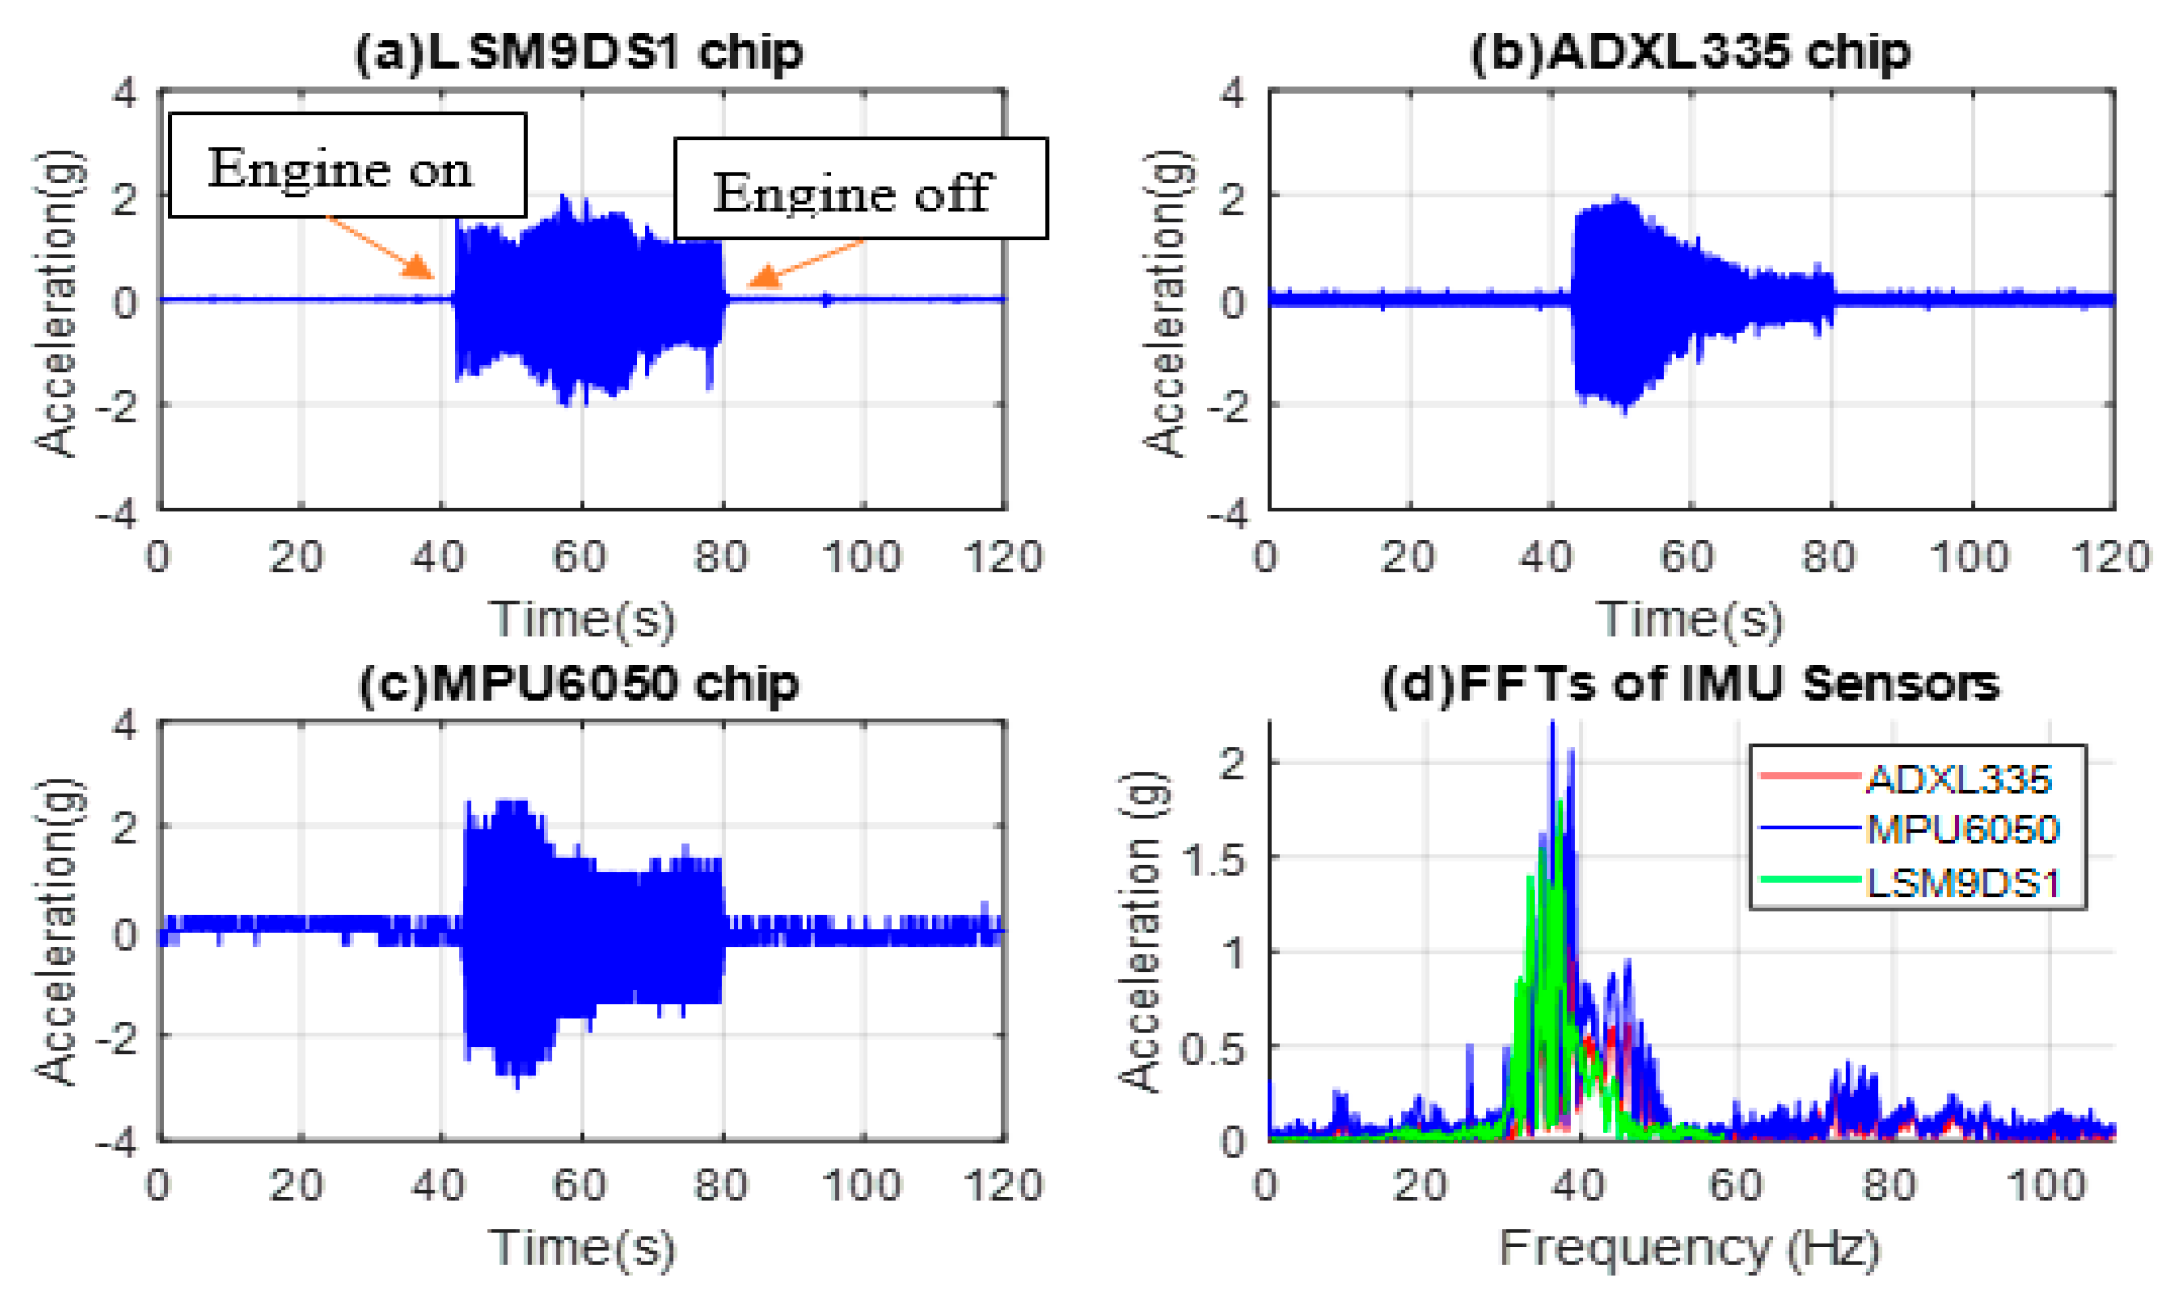
3.1.2. Accelerometers on the Hood above the Radiator Fan
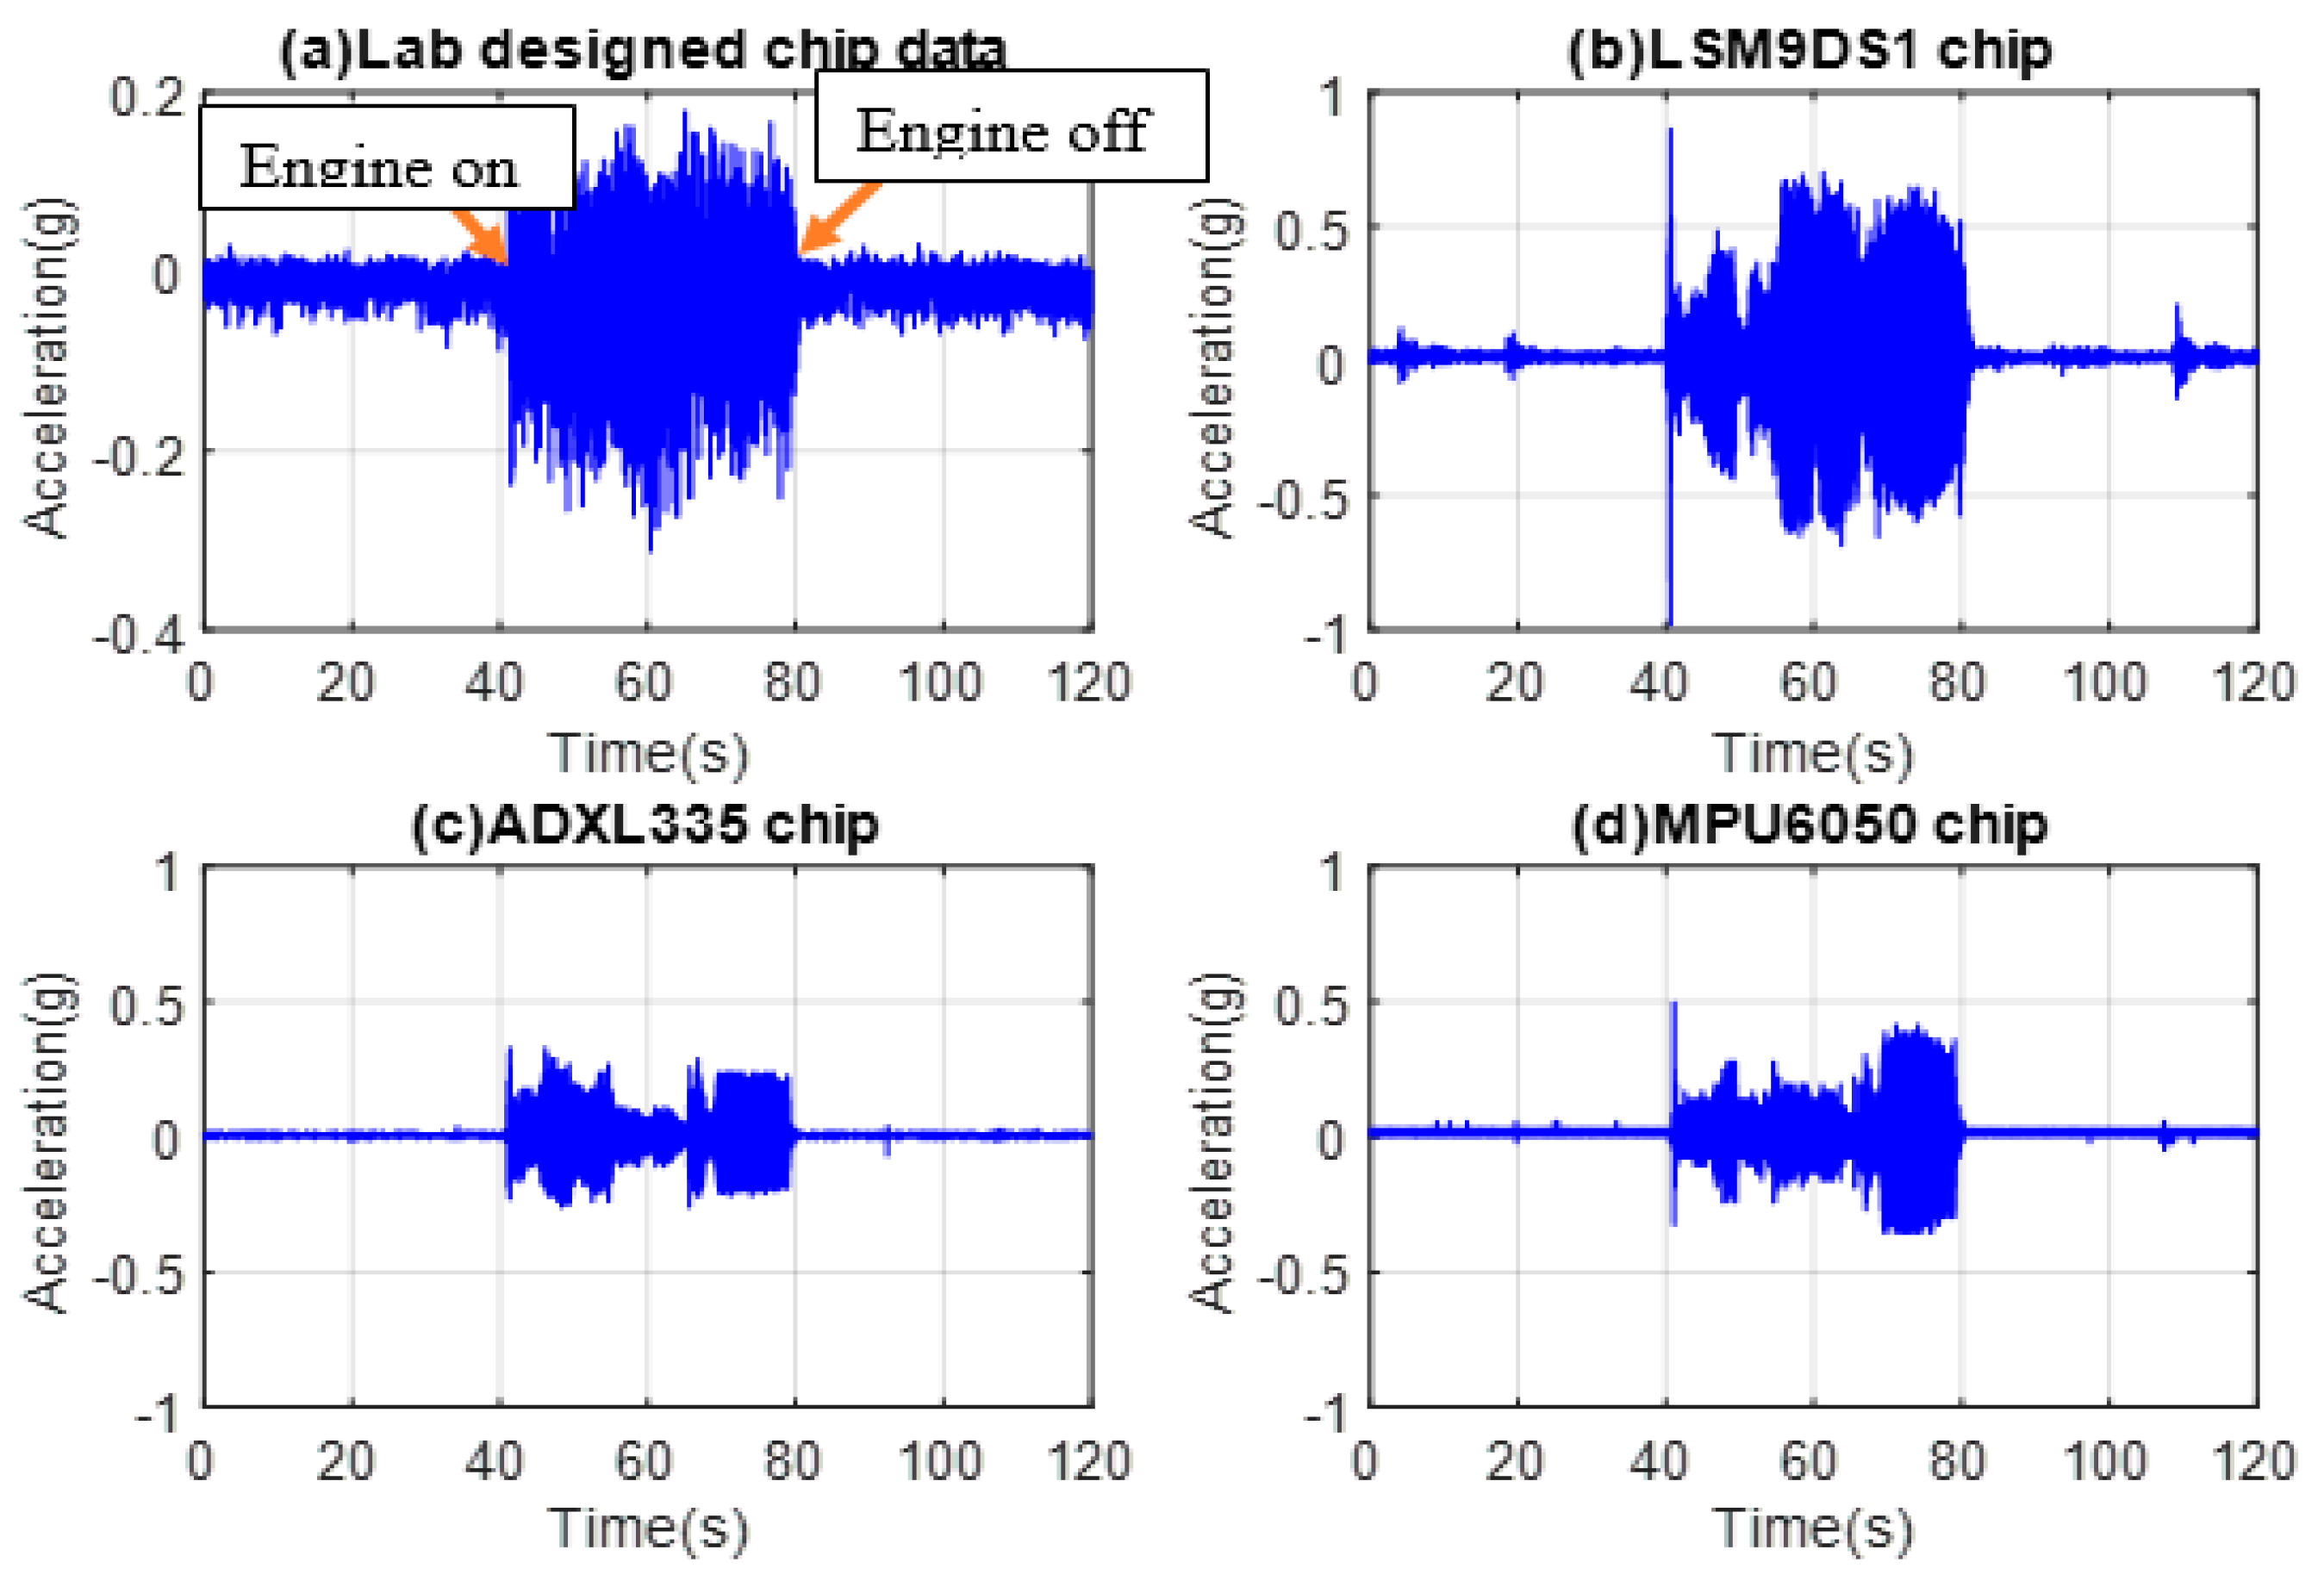
3.1.3. Accelerometers on the Exhaust Pipe
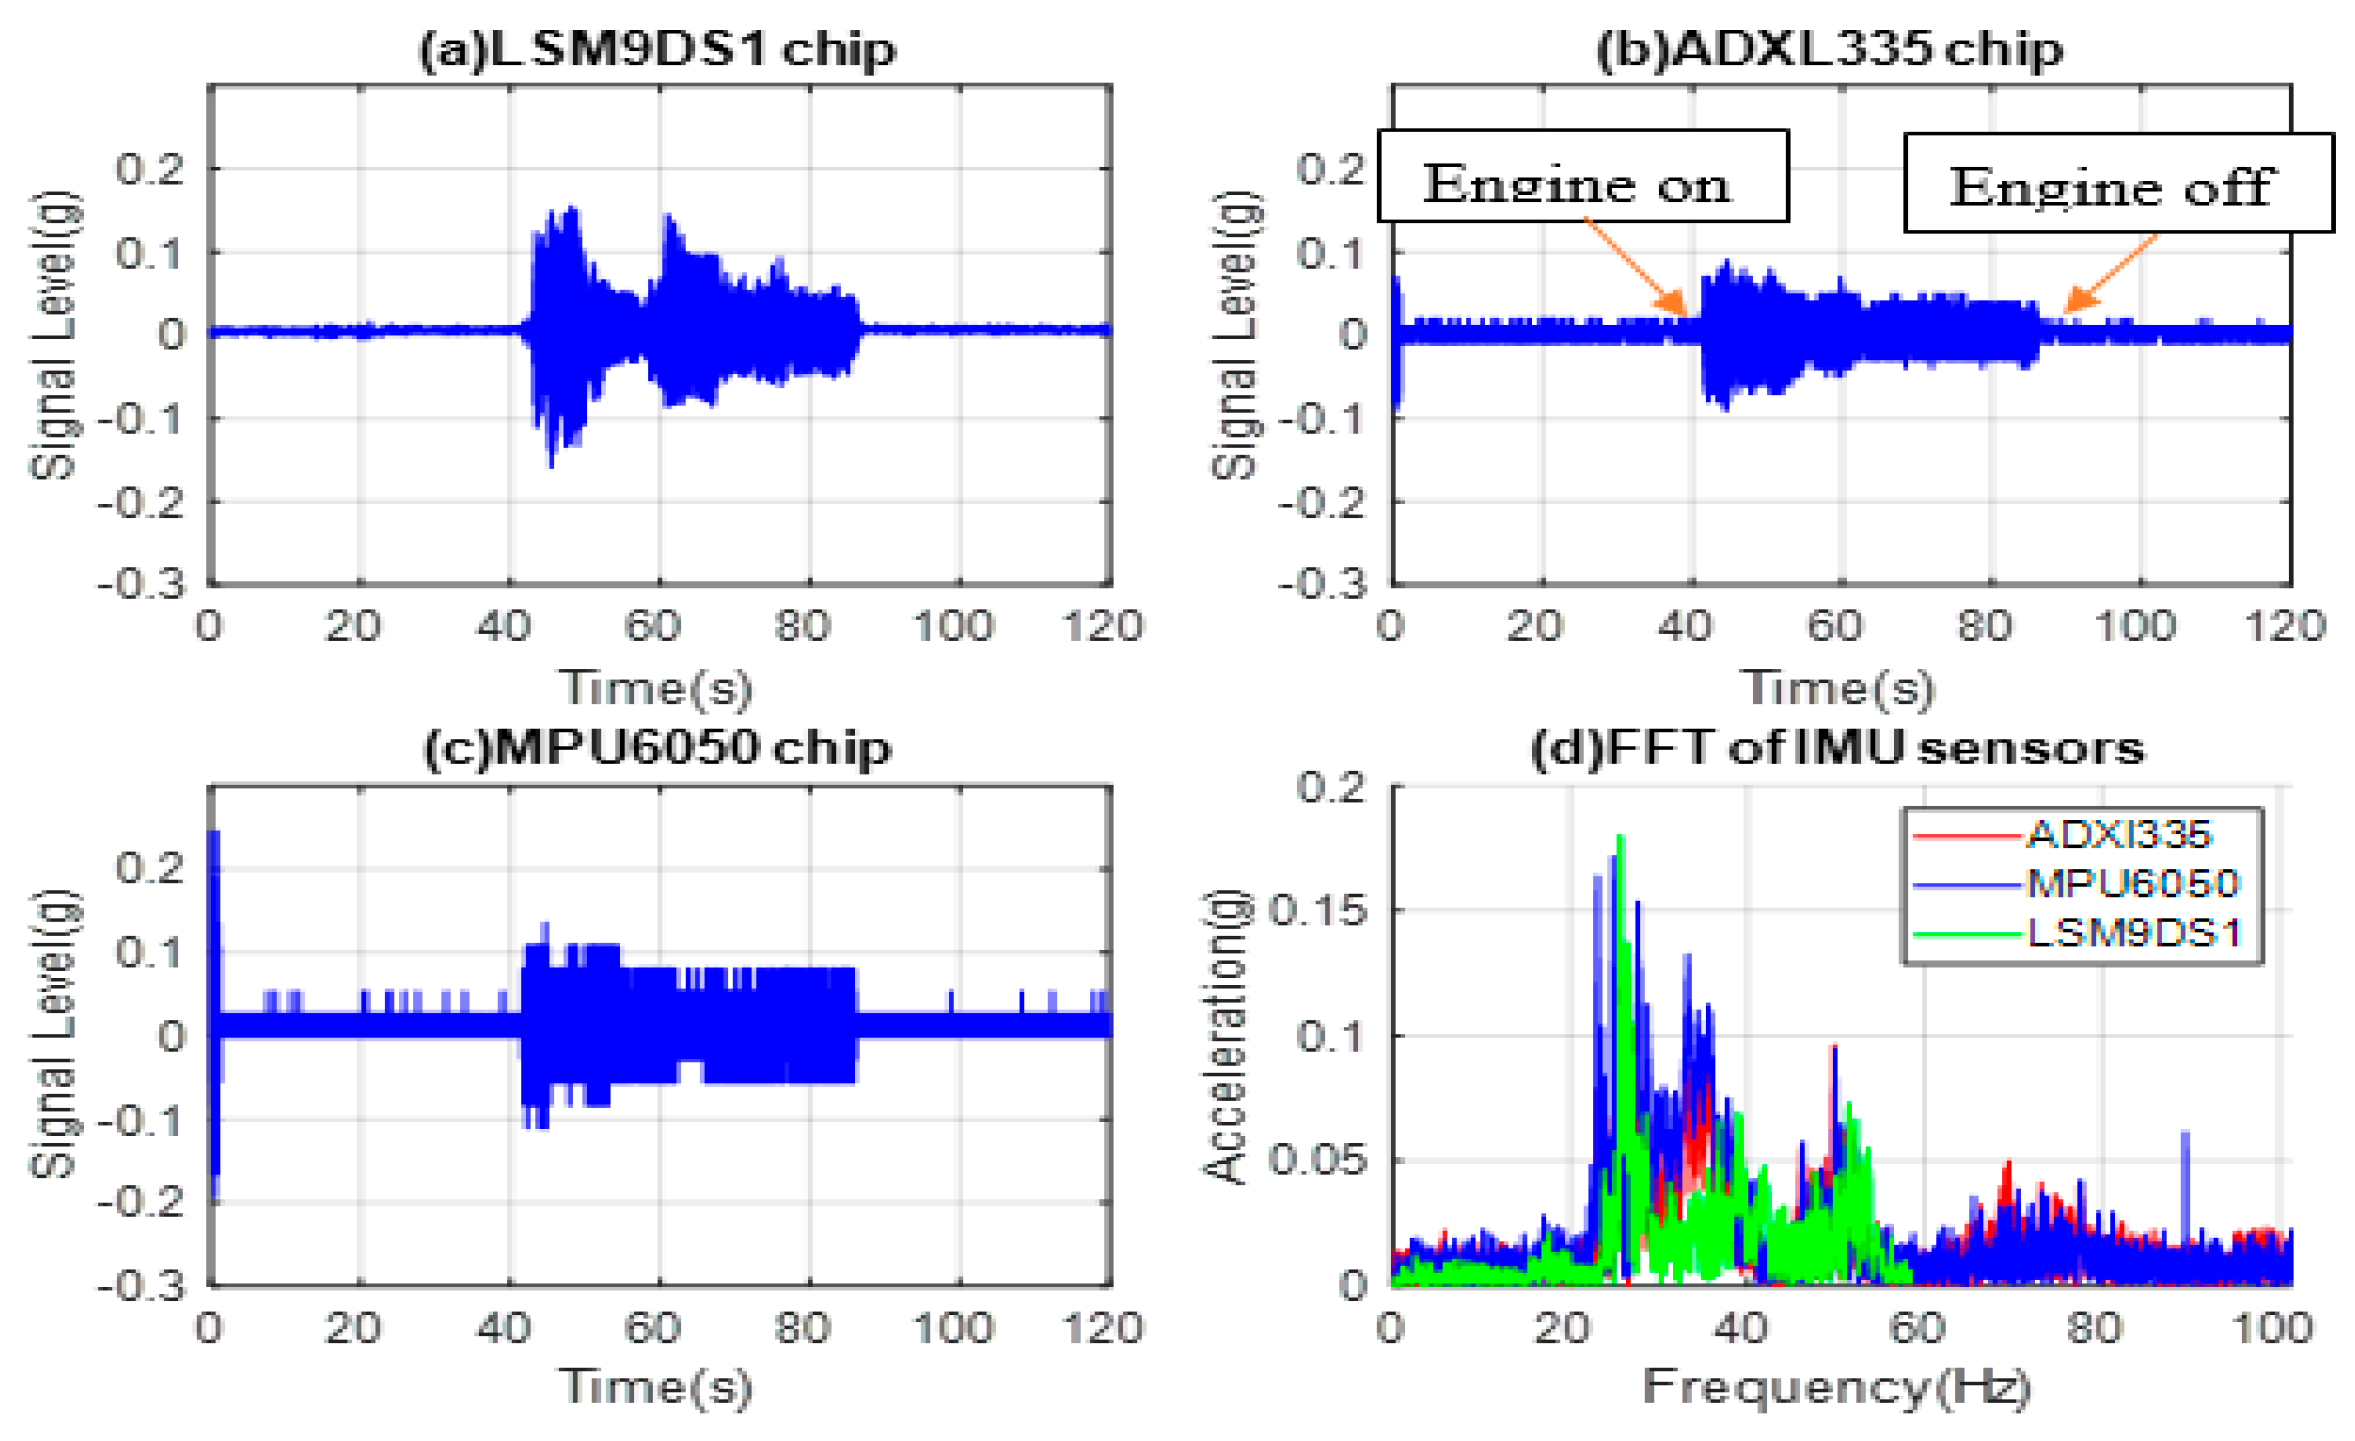
3.1.4. Accelerometers on the Dashboard in Idle Mode
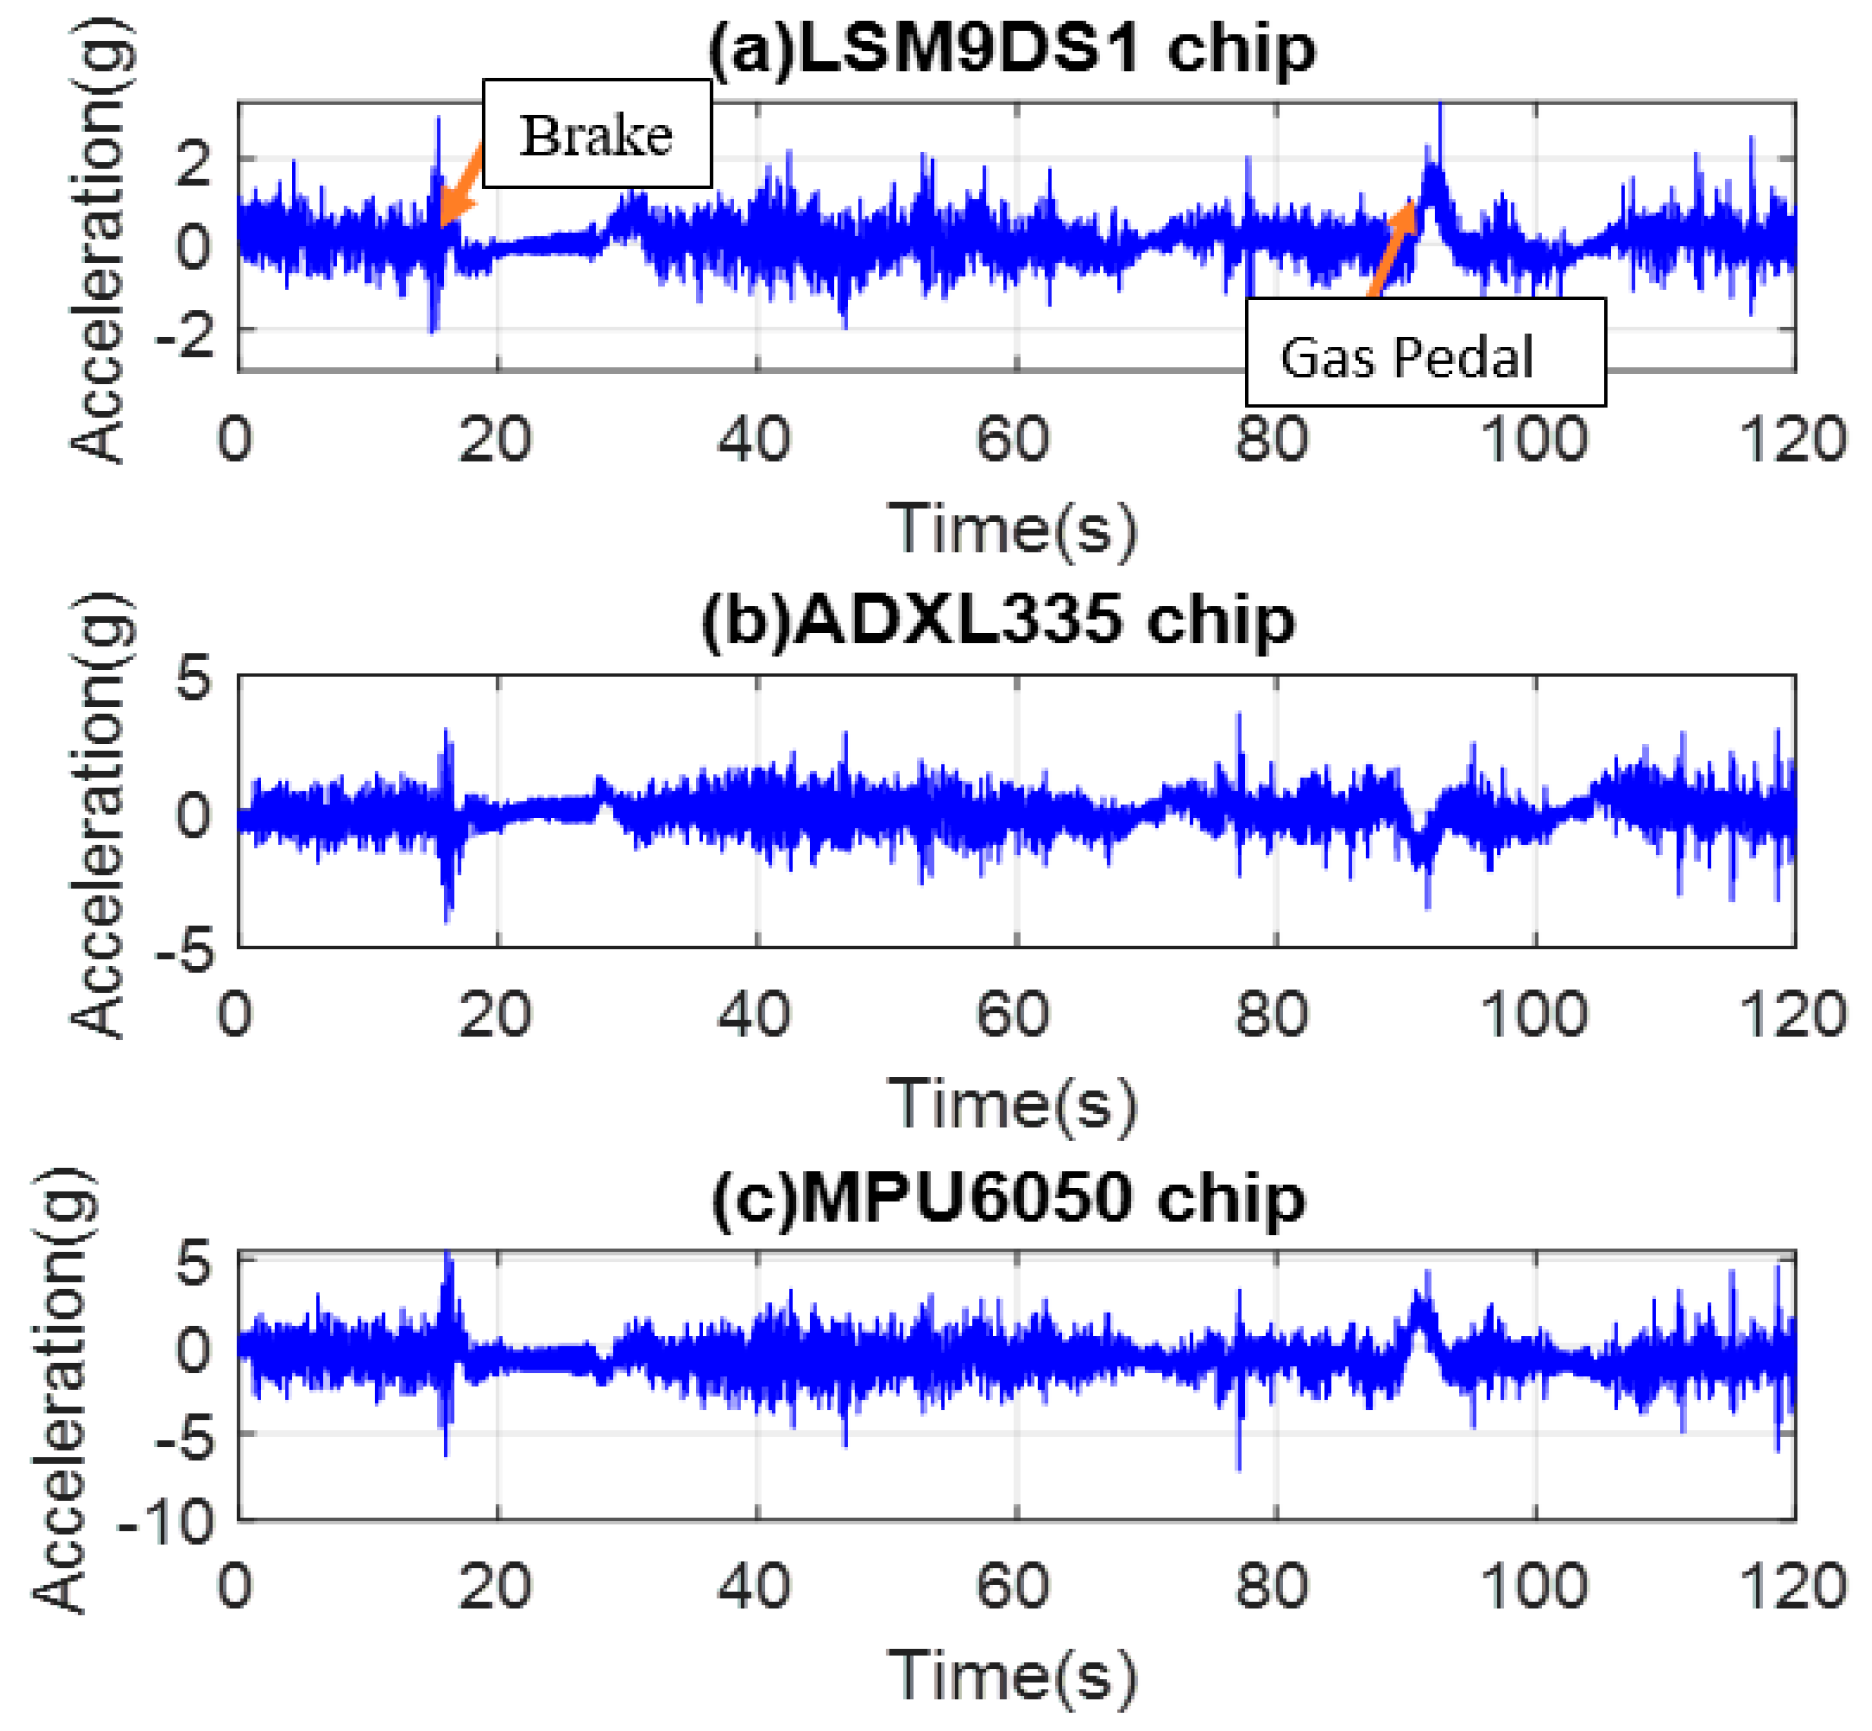
3.1.5. MEMS Accelerometer Data of All Positions
3.1.6. In-House MEMS Accelerometer on the Hood above the Engine
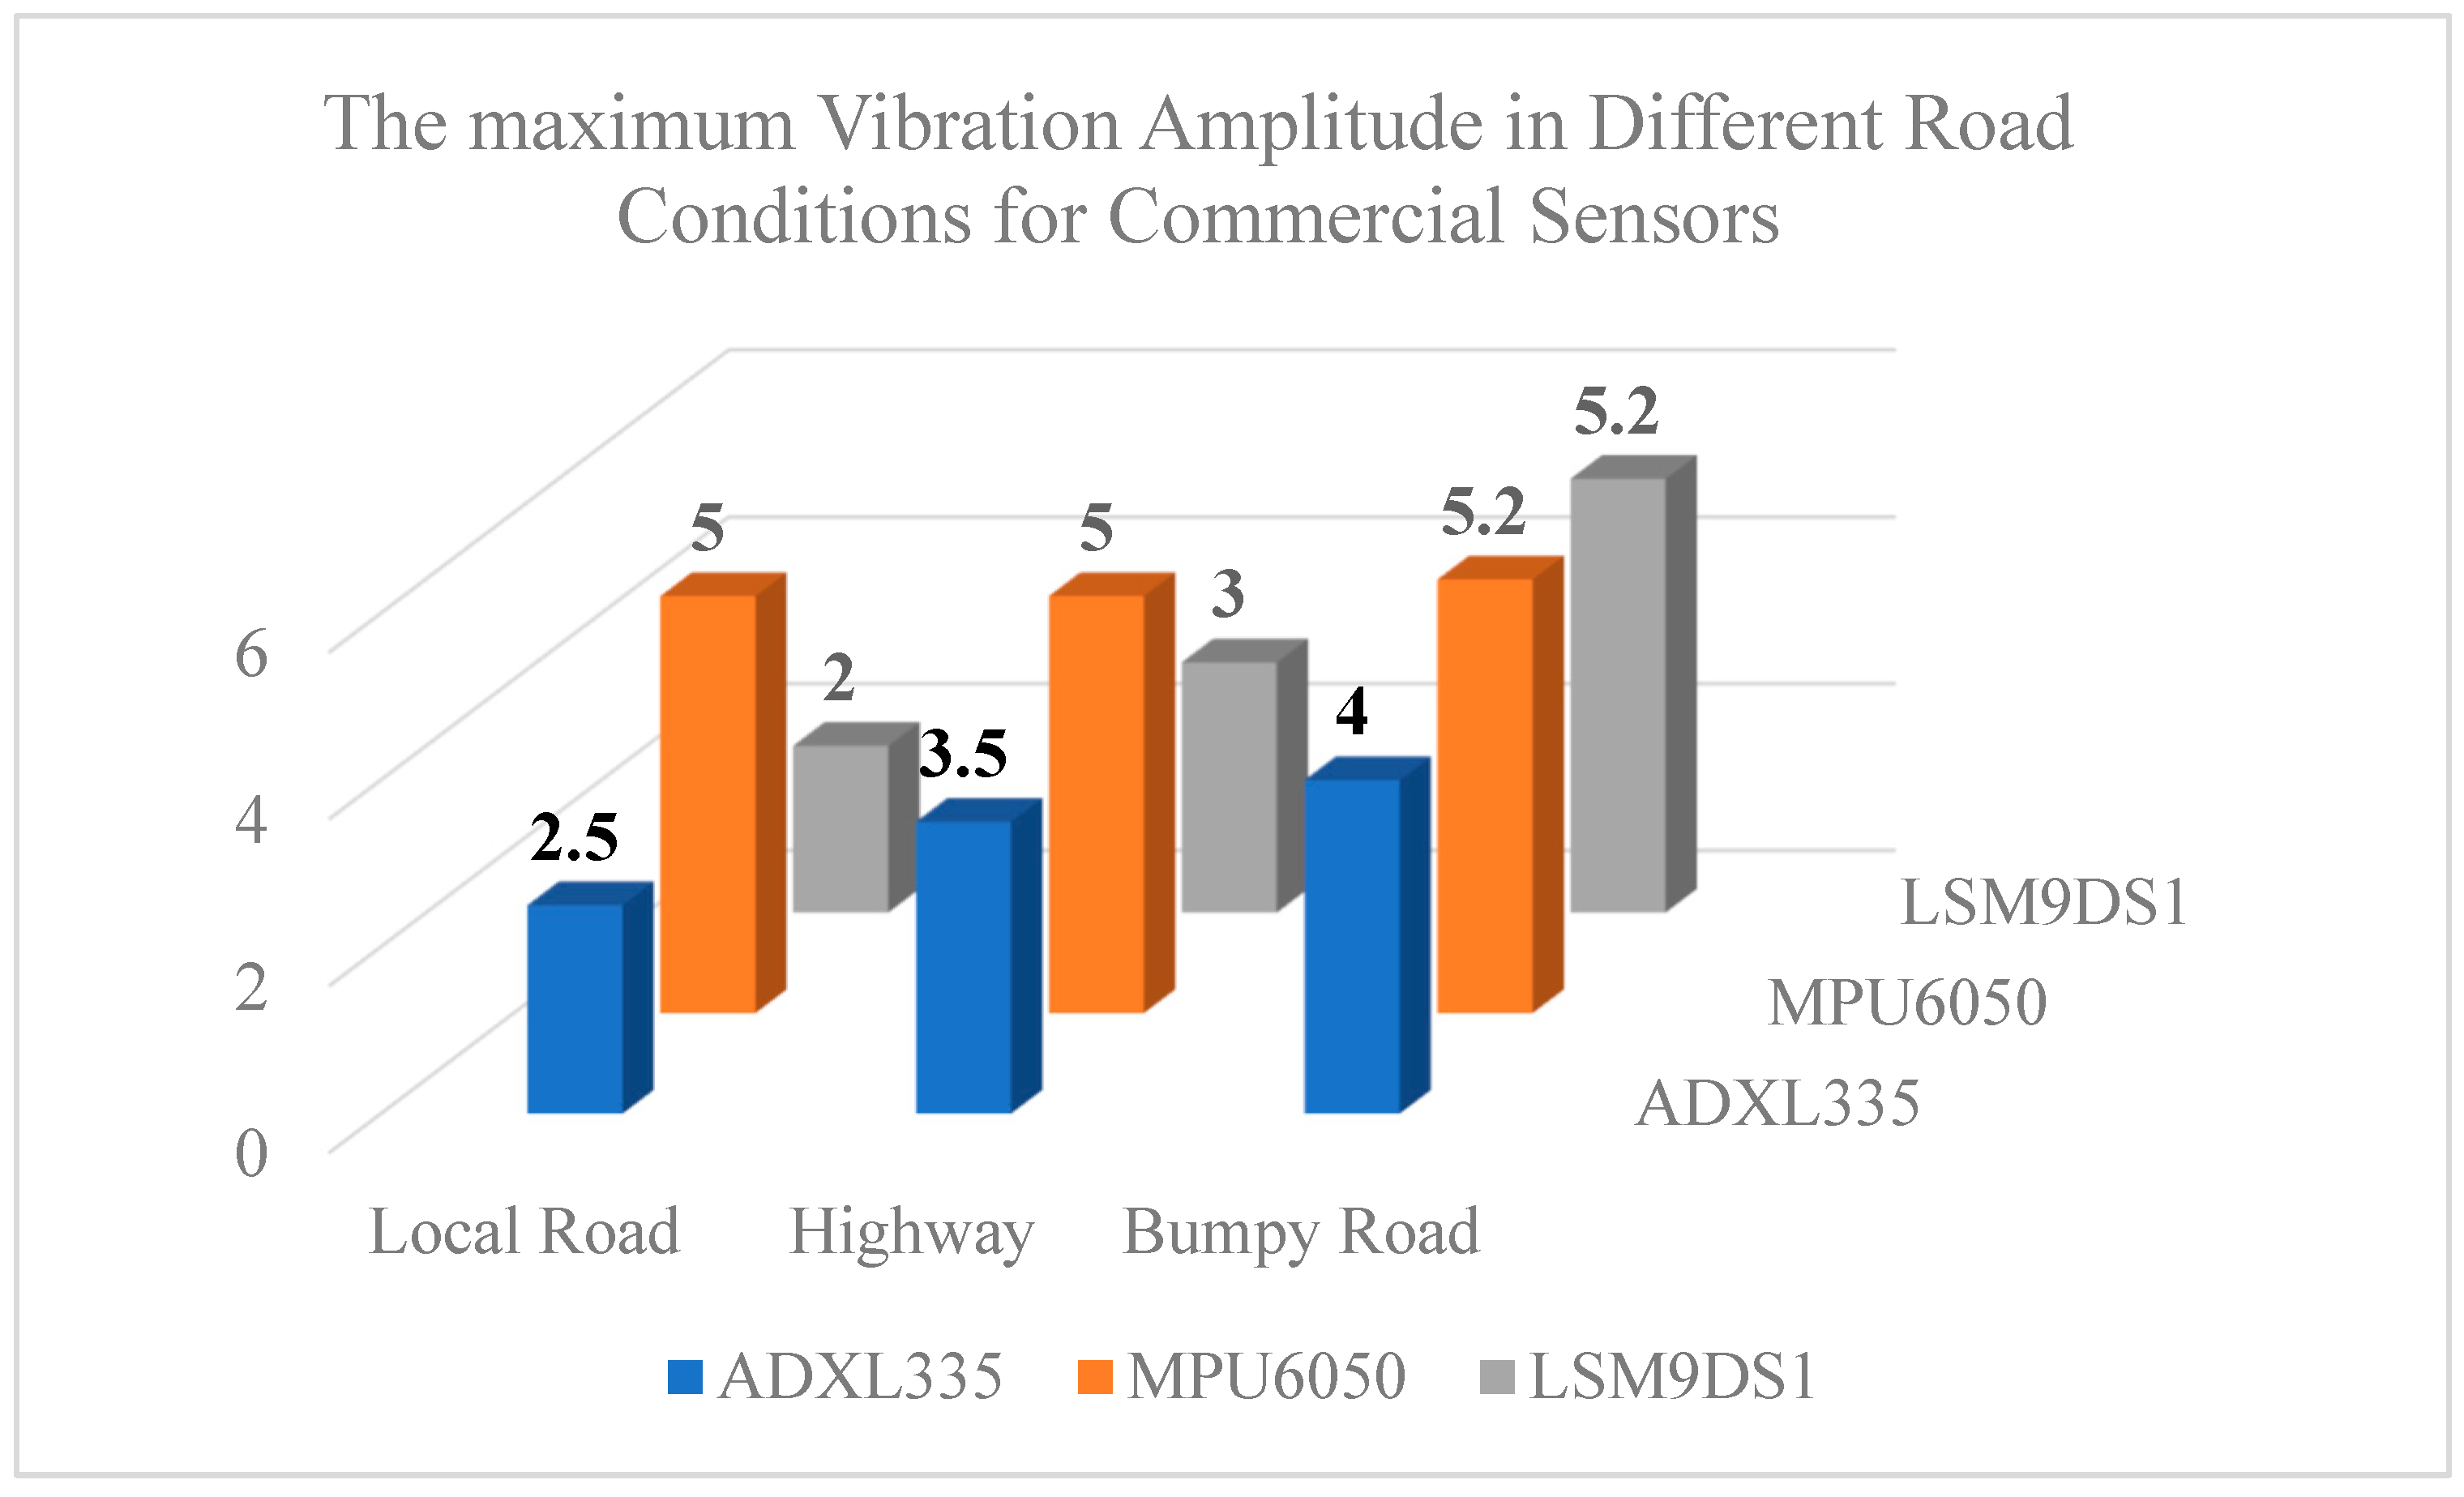
3.2. Dynamic Data from the Dashboard of the Vehicle in Driving Mode
3.2.1. Dynamic Data Measured on Local Roads
3.2.2. Dynamic Data from the Highway Test
3.2.3. Dynamic Data from Tests on Bumpy Roads
4. Significance of MEMS Accelerometers in Automotives
5. Conclusions
Author Contributions
Funding
Data Availability Statement
Acknowledgments
Conflicts of Interest
References
- Finkbeiner, S. MEMS for automotive and consumer electronics. In Proceedings of the 2013 Proceedings of the ESSCIRC (ESSCIRC), Bucharest, Romania, 16–20 September 2013; pp. 9–14. [Google Scholar]
- Tsai, J.-M.; Sun, I.-C.; Chen, K.-S. Realization and performance evaluation of a machine tool vibration monitoring module by multiple MEMS accelerometer integrations. Int. J. Adv. Manuf. Technol. 2021, 114, 465–479. [Google Scholar] [CrossRef]
- Varanis, M.; Silva, A.M.A.; Pederova, R. MEMS accelerometers for mechanical vibrations analysis: A comprehensive review with applications. J. Braz. Soc. Mech. Sci. Eng. 2018, 40, 526–544. [Google Scholar] [CrossRef]
- Albarbar, A.; Mekid, S.; Starr, A.; Pietruszkiewicz, R. Suitability of MEMS Accelerometers for Condition Monitoring: An experimental study. Sensors 2008, 8, 784–799. [Google Scholar] [CrossRef] [PubMed]
- Jiménez, S.; Cole, M.O.; Keogh, P.S. Vibration sensing in smart machine rotors using internal MEMS Accelerometers. J. Sound Vib. 2016, 377, 58–75. [Google Scholar] [CrossRef]
- Doseděl, M.; Havránek, Z. Design and performance evaluation of smart vibration sensor for industrial applications with built-in MEMS accelerometers. In Proceedings of the 18th International Conference on Mechatronics-Mechatronika (ME), Brno, Czech Republic, 5–7 December 2018; pp. 1–8. [Google Scholar]
- Sabato, A. Pedestrian bridge vibration monitoring using a wireless MEMS accelerometer board. In Proceedings of the 2015 IEEE 19th International Conference on Computer Supported Cooperative Work in Design (CSCWD), Calabria, Italy, 6–8 May 2015. [Google Scholar]
- Komarizadehasl, S.; Lozano, F.; Lozano-Galant, J.A.; Ramos, G.; Turmo, J. Low-Cost Wireless Structural Health Monitoring of Bridges. Sensors 2022, 22, 5725. [Google Scholar] [CrossRef]
- Ranji, A.; Damodaran, V.; Li, K.; Chen, Z.; Alirezaee, S.; Ahamed, M.J. Recent Advances in MEMS-Based 3D Hemispherical Resonator Gyroscope (HRG) A Sensor of Choice. Micromachines 2022, 13, 1676. [Google Scholar] [CrossRef]
- Khan, N.; Ahamed, M.J. Design and development of a MEMS butterfly resonator using synchronizing beam and out of plane actuation. Microsyst. Technol. 2020, 26, 1643–1652. [Google Scholar] [CrossRef]
- Sparks, D.R. Application of MEMS Technology in Automotive Sensors and Actuators. In Proceedings of the MHA’98. Proceedings of the 1998 International Symposium on Micromechatronics and Human Science, Nagoya, Japan, 25–28 November 1998; pp. 9–15. [Google Scholar]
- Stein, G.J.; Chmúrny, R.; Rosík, V. Compact Vibration Measuring System for in-vehicle Applications. Meas. Sci. Rev. 2011, 11, 154–159. [Google Scholar] [CrossRef]
- Hassine, H.; Chaeib, H.; Barkallah, M.; Louati, J.; Haddar, M. Experimental Study and Measurement of Vehicle Interior Vibration. In Advances in Materials, Mechanics and Manufacturing II; A3M 2021; Springer: Berlin, Germany, 2021; pp. 333–341. [Google Scholar]
- Siddula, S.; Maneesha, V.; Anjali, K.; Priya, S.S.; Teja, K. Design of Advanced Car Driving Controller System. In Proceedings of the 2022 2nd International Conference on Advance Computing and Innovative Technologies in Engineering (ICACITE), Greater Noida, India, 26 April 2022. [Google Scholar]
- Fanse, T.S. Micro-Electro-Mechanical System (MEMS) Application and Prospects in Automobile. IOSR J. Mech. Civ. Eng. IOSR-JMCE 2022, 19, 17–21. [Google Scholar]
- Vinay, P.; Vamsi, C.V.S.S.; Hemanth, M.; Saiteja, A.; Ali, M.A. Design and Simulation of Mems Based Accelerometer for Crash Detection and Air Bags Deployment in Automobiles. Int. J. Mech. Eng. Technol. 2017, 8, 424–434. [Google Scholar]
- Vasyukov, S.; Ma, A. Multifunctional Shock, Tilt and Motion Sensor Based on MEMS Accelerometer. In Proceedings of the International Conference on Industrial Engineering, Applications and Manufacturing (ICIEAM), Sochi, Russia, 16–20 May 2022; pp. 936–941. [Google Scholar]
- Venkatesh, K.A.; Mathivanan, N. Design of MEMS Accelerometer based Acceleration Measurement System for Automobiles. Meas. Sci. Rev. 2012, 12, 189–194. [Google Scholar] [CrossRef]
- Merepala, J.P. Tri-Axis MEMS Accelerometer for Vehicle Accident Monitoring. Int. Res. J. Eng. Technol. IRJET 2016, 3, 1068–1070. [Google Scholar]
- Arun, M.R.; Sheeba, M.; Rishma, F.F. Smart Miniature Mems Ic Associated with Gsm to Detect and Prevent Automobile Theft. In Proceedings of the 4th International Conference on Energy Efficient Technologies for Sustainability–ICEETS’18, Nagercoil, India, 7–8 April 2018. [Google Scholar]
- Tarun, M.K.; Radhika, P. Auto Theft Prevention of a Vehicle Using a Smart Key fob Unit and GPS & GSM Technologies. Int. J. Res. Inf. Technol. 2014, 2, 282–287. [Google Scholar]
- Chakole, S.S.; Ukani, N.A. Low power Smart Vehicle Tracking, Monitoring, Collision avoidance and Antitheft System. In Proceedings of the Second International Conference on Inventive Research in Computing Applications (ICIRCA-2020), Nagpur, India, 15–17 July 2020. [Google Scholar]
- Pozzato, G.; Strada, S.C.; Tanelli, M.; Savaresi, S.M.; Dambach, G. MEMS-Enabled Retrofitting of Automobile Wheel Balancer for Automatic Unbalance Detection. IEEE ASME Trans. Mechatron. 2021, 26, 830–840. [Google Scholar] [CrossRef]
- Du, Y.; Liu, C.; Wu, D.; Li, S. Application of Vehicle Mounted Accelerometers to Measure Pavement Roughness. Int. J. Distrib. Sens. Netw. 2016, 12, 8413146. [Google Scholar] [CrossRef]
- Barbosa, R.S. Vehicle Vibration Response Subjected to Longwave Measured Pavement Irregularity. J. Mech. Eng. Autom. 2012, 2, 17–24. [Google Scholar] [CrossRef]
- González, A.; Olazagoitia, J.L.; Vinolas, J. A Low-Cost Data Acquisition System for Automobile Dynamics Applications. Sensors 2018, 18, 366. [Google Scholar] [CrossRef]
- Cervantes-Villanueva, D.C.-Z.J.; Terroso-Saenz, F.; Valdes-Vela, M.; Skarmeta, A.F. Vehicle Maneuver Detection with Accelerometer-Based Classification. Sensors 2016, 16, 1618. [Google Scholar] [CrossRef]
- Andria, G.; Attivissimo, F.; Nisio, A.D.; Lanzolla, A.; Pellegrino, A. Development of an automotive data acquisition platform for analysis of driving behaviour. Measurement 2016, 93, 278–287. [Google Scholar] [CrossRef]
- Xu, X.; Su, C.; Dong, P.; Liu, Y.; Wang, S. Optimization design of powertrain mounting system considering vibration analysis of multi-excitation. Adv. Mech. Eng. 2018, 10, 1687814018788246. [Google Scholar] [CrossRef]
- Aziz, G.A. Stability Control Investigation of a Self-Balancing Platform on the Robot Smart Car Using Navigation Parameters. IOP Conf. Ser. Mater. Sci. Eng. 2020, 765, 012066. [Google Scholar] [CrossRef]
- Xin, G.; Dong, Y.; Zhen-hai, G. Study on errors compensation of a vehicular MEMS accelerometer. In Proceedings of the IEEE International Conference on Vehicular Electronics and Safety, Xi’an, China, 14–16 October 2005; pp. 205–210. [Google Scholar]
- Schiavi, A.; Iacomussi, P. On the trustworthiness of a digital 3D MEMS gyroscope responsiveness to dynamic accelerations for ADAS applications. In Proceedings of the 2021 IEEE International Workshop on Metrology for Automotive (MetroAutomotive), Bologna, Italy, 1–2 July 2021. [Google Scholar]
- Rajai, P.; Ahmed, H.; Straeten, M.; Xereas, G.; Ahamed, M.J. Analytical modeling of n-type doped silicon elastic constants and frequency-compensation of Lamé mode microresonators. Sens. Actuators A Phys. 2019, 297, 11150. [Google Scholar] [CrossRef]
- Ahmed, H.; Rajai, P.; Ahamed, M.J. Temperature frequency stability study of extensional mode N-doped silicon MEMS resonator. AIP Adv. 2022, 12, 015319. [Google Scholar] [CrossRef]
- Jin, L. Applications and Prospects of Mems Sensors in Automotive. J. Phys. Conf. Ser. 2021, 1884, 012010. [Google Scholar] [CrossRef]
- Spicer, D.; Crawford, J.; Twanow, C.; Wakefield, N. MicraGEM-Si, A Flexible Process Platform for Complex MEMS Devices; Micralyne Inc.: Edmonton, AB, Canada, 2018. [Google Scholar]
- Pickering, P.; Twanow, C.; Spicer, D. Using Wafer Level Packaging to Improve Sensor Manufacturability and Cost. In Mems Packaging; Springer: Berlin/Heidelberg, Germany, 2018; pp. 53–70. [Google Scholar]
- Khan, I.; Ting, D.S.K.; Ahamed, M.J. Design and development of a MEMS vibrating ring resonator with inner rose petal spring supports. Microsyst. Technol. 2021, 27, 985–995. [Google Scholar] [CrossRef]
- Elhattab, A.; Uddin, N.; OBrien, E. Extraction of Bridge Fundamental Frequencies Utilizing a Smartphone MEMS Accelerometer. Sensors 2019, 19, 3143. [Google Scholar] [CrossRef] [PubMed]
- Zhu, D.; Wang, L.; Henaut, J.; Beeby, S. Comparison of Energy Sources for Automous In-Car Wireless Tags for Asset Tracking and Parking Applications’. Procedia Eng. 2014, 87, 783–786. [Google Scholar] [CrossRef]


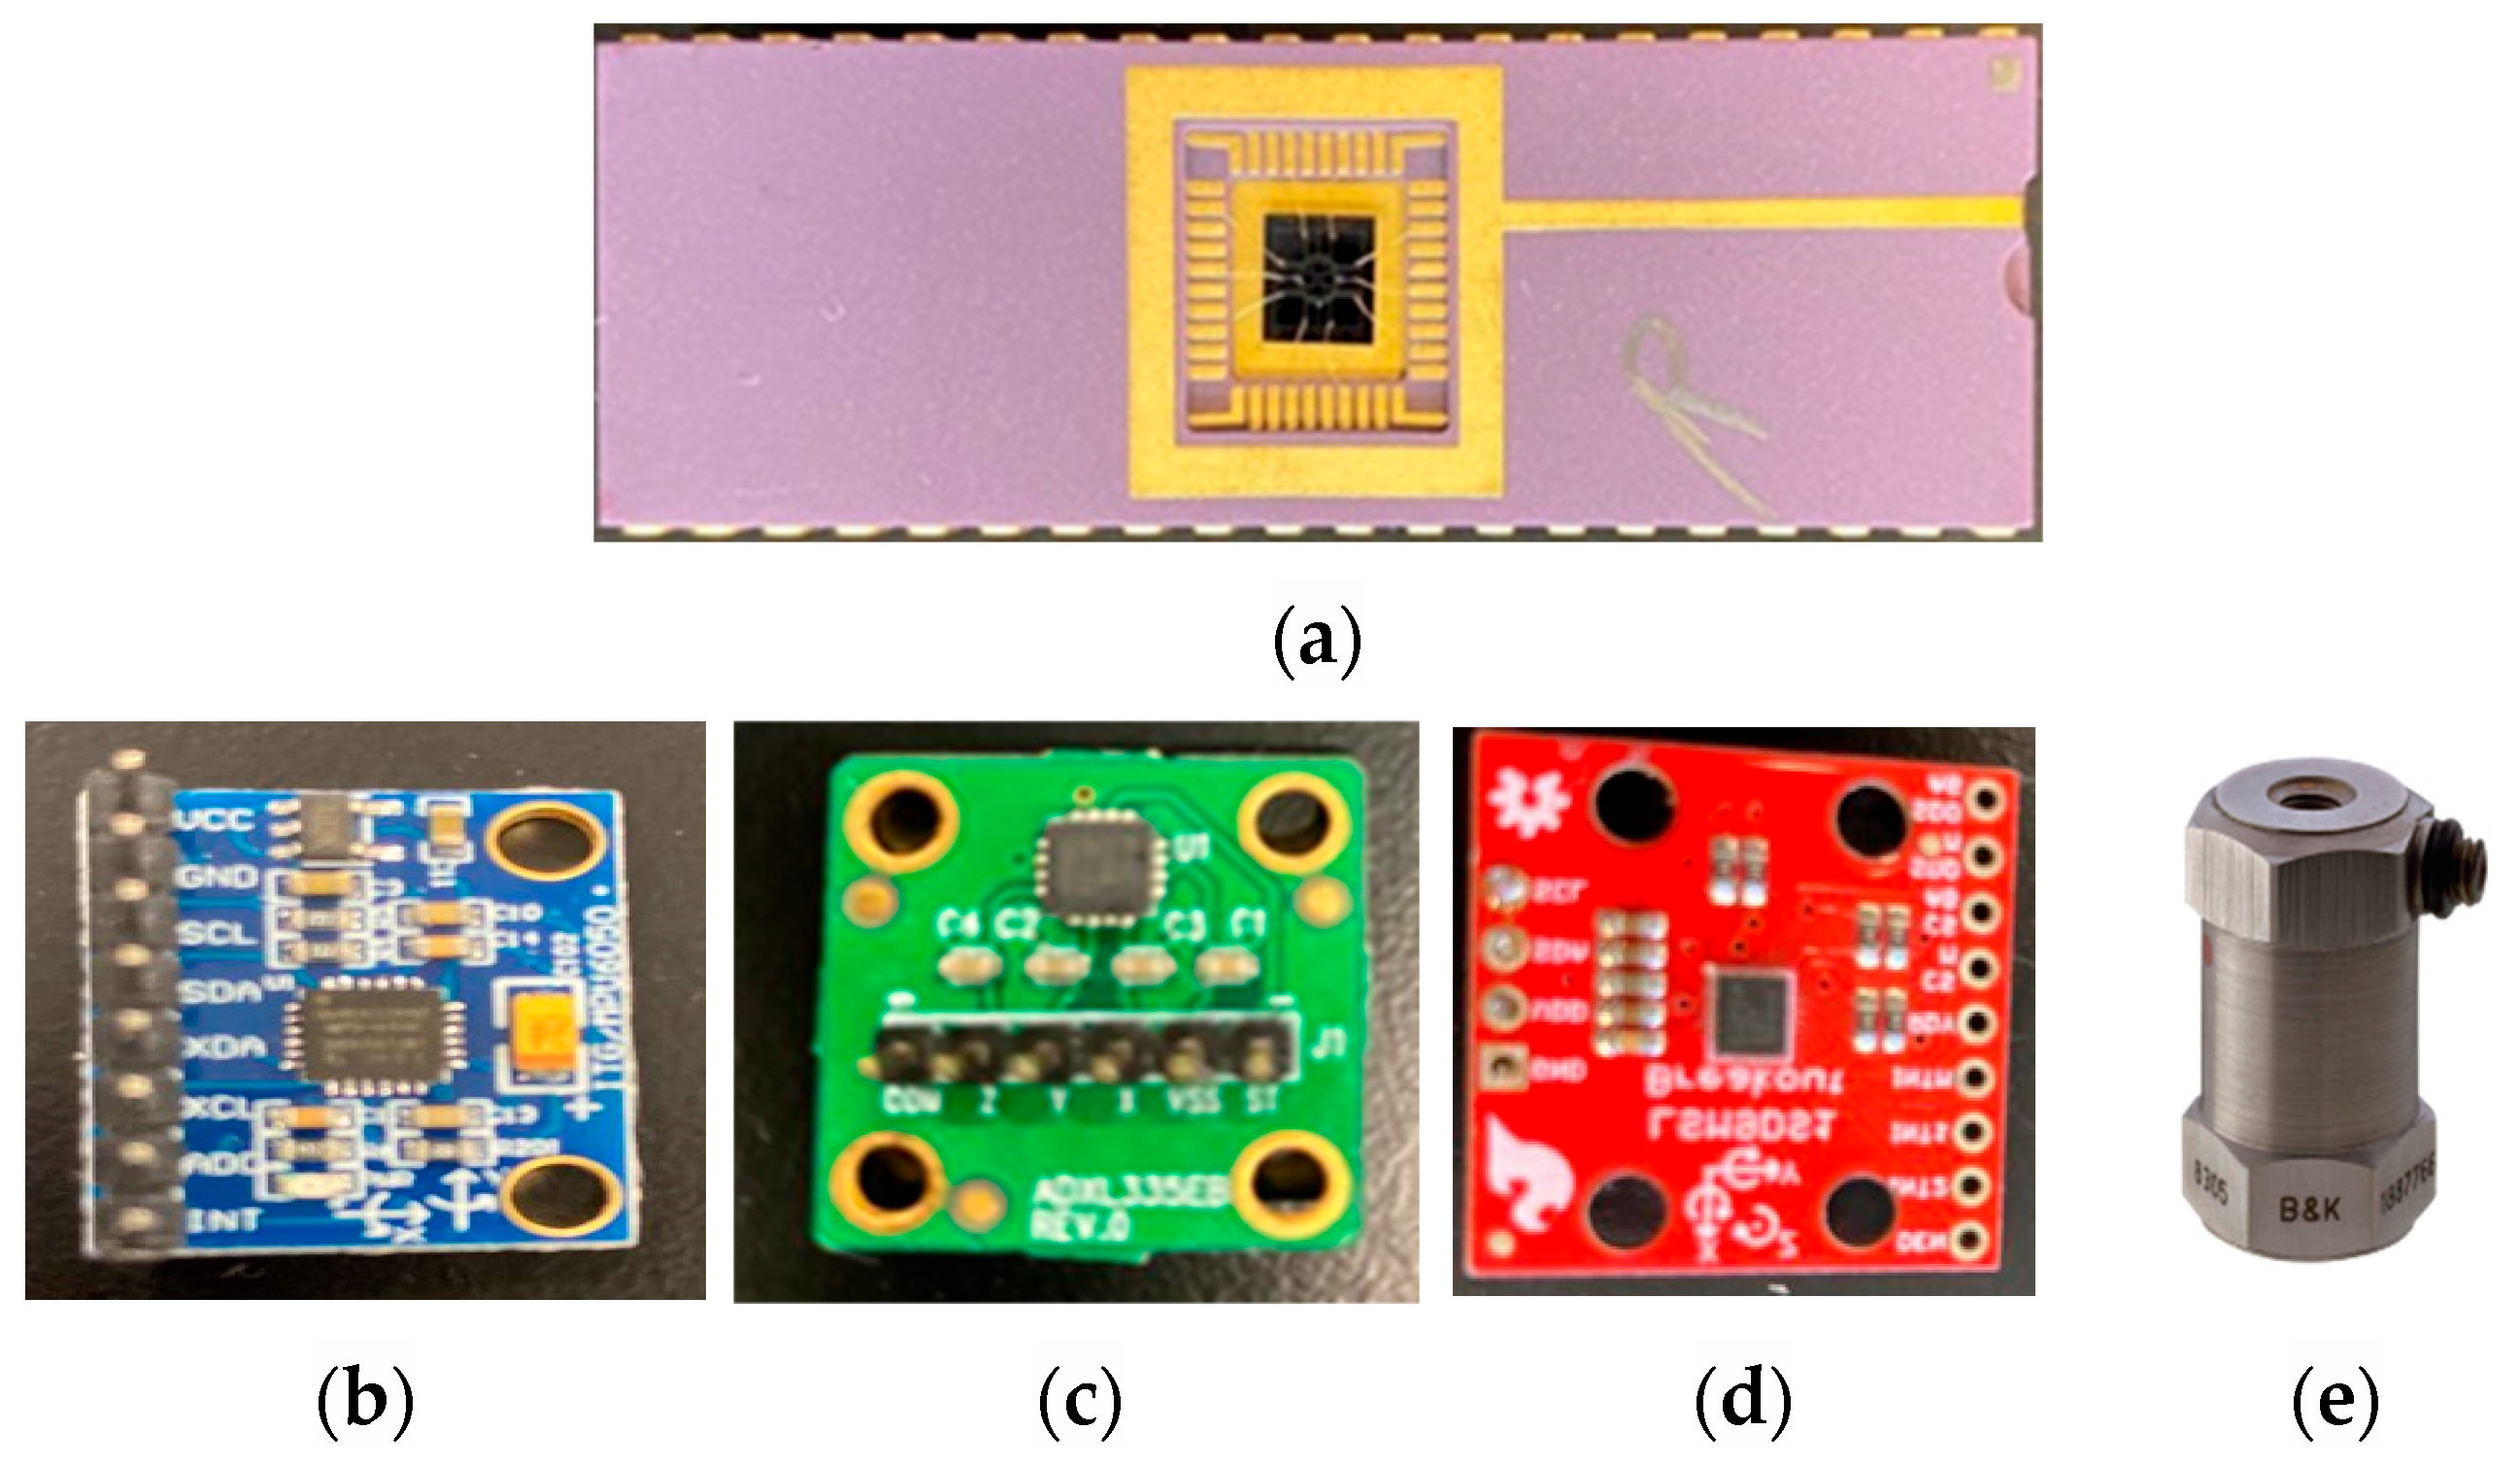
| Accelerometer Specifications | MEMS ADXL335EB Sensor | MEMS MPU6050 Sensor | MEMS LSM9DS1 Sensor | MEMS in House Sensor | Piezoelectric Reference Standard 8305 |
|---|---|---|---|---|---|
| Measurement Range | ±3 g | ±8 g | ±8 g | ±8 g | ±100 g |
| Power Consumption | 150 μA (typical) | 3.9 mA (max.) | 4.5 mA (typical) | 5 mA | NA |
| Specified Voltage | 3 V | +3 V to +5 V | 1.9 V to 3.6 V | 5 V | NA |
| Temperature Range | −40 to 85 °C | −40 to 85 °C | −40 to +85 °C | −40 to +85 °C | −74 to +200 °C |
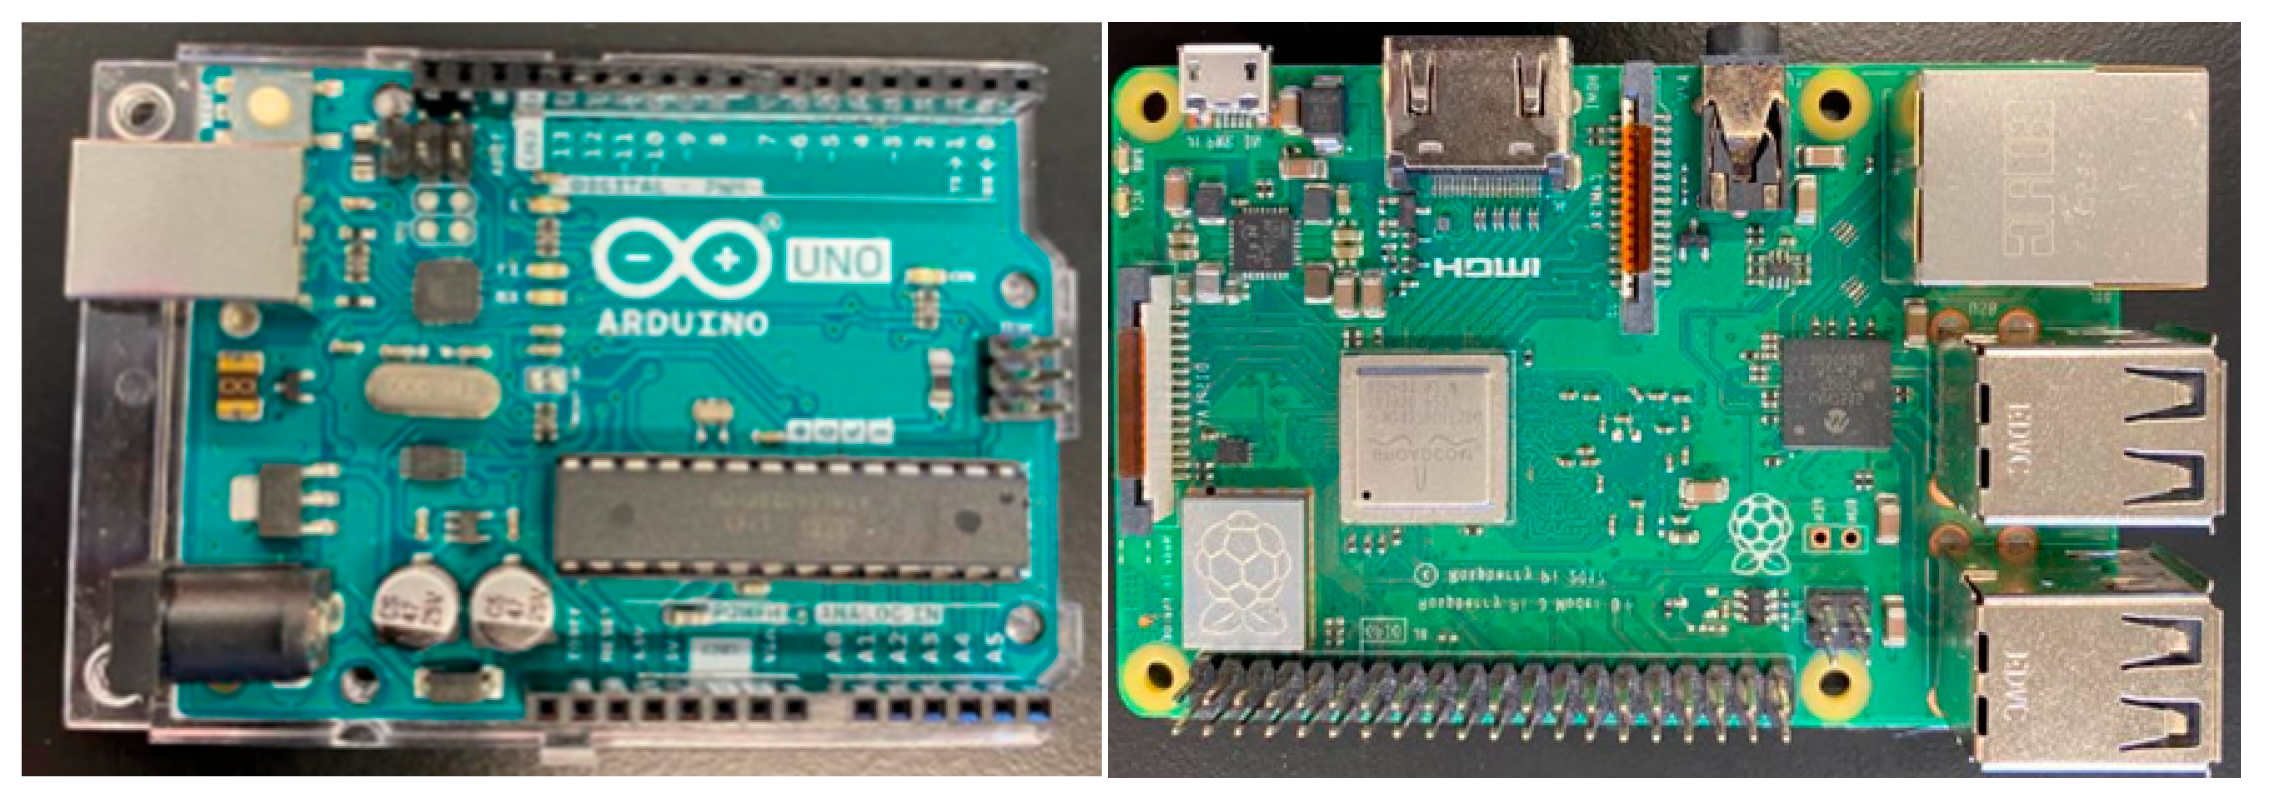
| Manufacturer | Arduino |
|---|---|
| Microcontroller | ATMega328p |
| Operating voltage | 5 V |
| Input voltage limit (recommended) | 6–20 V (7–12 V) |
| Digital I/O pins | 14 (of which 6 provide PWM output) |
| PWM digital I/O and Analog input pins | 6 |
| DC current per I/O pin | 20 mA |
| DC current for 3.3v pin | 50 mA |
| Flash memory | 32 KB (0.5 KB used by bootloader) |
| SRAM | 2 KB (ATmega328P) |
| EEPROM | 1 KB (ATmega328P) |
| Clock speed and LED Built-in | 16 MHz and 13 |
| Manufacturer | Raspberry Pi |
|---|---|
| Place of Business | CHICAGO, IL, 60693 US |
| Model and Part number | SC15184 |
| Memory Storage Capacity and RAM | 2 GB |
| Memory Slots Available | 4 |
| Memory Technology | SDRAM |
| Maximum Memory Supported | 2 GB |
| RAM Technology | LPDDR4, SDRAM |
| Memory Type | DDR3 SDRAM |
| Processor Type and Number of Processors | Cortex, 4 |
| OS and Hardware Interface | Linux, USB, USB Type C, Ethernet, HDMI, Video, USB 3.0, USB 2.0 |
| Test Number | The Application of Accelerometer Data | Laboratory Sensor and IMU Mounting Position | Driving Mode/Condition | Time (s) |
|---|---|---|---|---|
| 1 | To obtain the response from the engine | On the hood above the engine | Engine started, Idle mode | 120 |
| 2 | To obtain the response from the radiator fan | On the hood above the radiator fan | Engine started, Idle mode | 120 |
| 3 | To obtain the response from exhaust pipe | On trunk over the exhaust exit | Engine started, Idle mode | 120 |
| 4 | To obtain the response from dashboard | On the car dashboard | Engine started, Idle mode | 120 |
| 5 | To obtain the response from frequent braking | On the car dashboard | Driving mode on local roads | 120 |
| 6 | To measure acceleration in rapid speed changes | On the car dashboard | Driving mode on the highway | 120 |
| 7 | To observe the road condition | On the car dashboard | Driving mode on a bumpy country road | 120 |
| Location on the Car | Hood above the Engine | Hood above the Fan | Exhaust Pipe | Dashboard | |
|---|---|---|---|---|---|
| Sensor Type | |||||
| Lab-designed | 44.18 | 23 and 38 | 10 and 27 | 22.8 | |
| ADXL335 | 40 | 38 and 75 | 22 and 28 | 24 | |
| MPU6050 | 40 | 38 and 75 | 22 and 28 | 24 | |
| LSM9DS1 | 40 | 38 and 75 | 22.6 and 28.6 | 24 | |
| Location on the Car | Dashboard | |
|---|---|---|
| Sensor Type | ||
| Lab-designed | 0.07 | |
| ADXL335 | 0.07 | |
| MPU6050 | 0.1 | |
| LSM9DS1 | 0.15 | |
| Ref. [40] | 0.15 | |
| Road Cond. | Local | Highway | Bumpy | |
|---|---|---|---|---|
| Sensor Type | ||||
| ADXL335 | 5.03 | 5 and 66 | 4.88 and 18 | |
| MPU6050 | 5.03 | 5 and 64 | 4.88 and 17 | |
| LSM9DS1 | 5.03 | 5 and 60 | 4.88 and 17 | |
Disclaimer/Publisher’s Note: The statements, opinions and data contained in all publications are solely those of the individual author(s) and contributor(s) and not of MDPI and/or the editor(s). MDPI and/or the editor(s) disclaim responsibility for any injury to people or property resulting from any ideas, methods, instructions or products referred to in the content. |
© 2023 by the authors. Licensee MDPI, Basel, Switzerland. This article is an open access article distributed under the terms and conditions of the Creative Commons Attribution (CC BY) license (https://creativecommons.org/licenses/by/4.0/).
Share and Cite
Ahmed, H.E.; Sahandabadi, S.; Bhawya; Ahamed, M.J. Application of MEMS Accelerometers in Dynamic Vibration Monitoring of a Vehicle. Micromachines 2023, 14, 923. https://doi.org/10.3390/mi14050923
Ahmed HE, Sahandabadi S, Bhawya, Ahamed MJ. Application of MEMS Accelerometers in Dynamic Vibration Monitoring of a Vehicle. Micromachines. 2023; 14(5):923. https://doi.org/10.3390/mi14050923
Chicago/Turabian StyleAhmed, Hasnet Eftakher, Sahereh Sahandabadi, Bhawya, and Mohammed Jalal Ahamed. 2023. "Application of MEMS Accelerometers in Dynamic Vibration Monitoring of a Vehicle" Micromachines 14, no. 5: 923. https://doi.org/10.3390/mi14050923