
Simulation and Experimental Validation of a Pressurized Filling Method for Neutron Absorption Grating

Abstract
:1. Introduction
2. Experimental Methods and Simulation
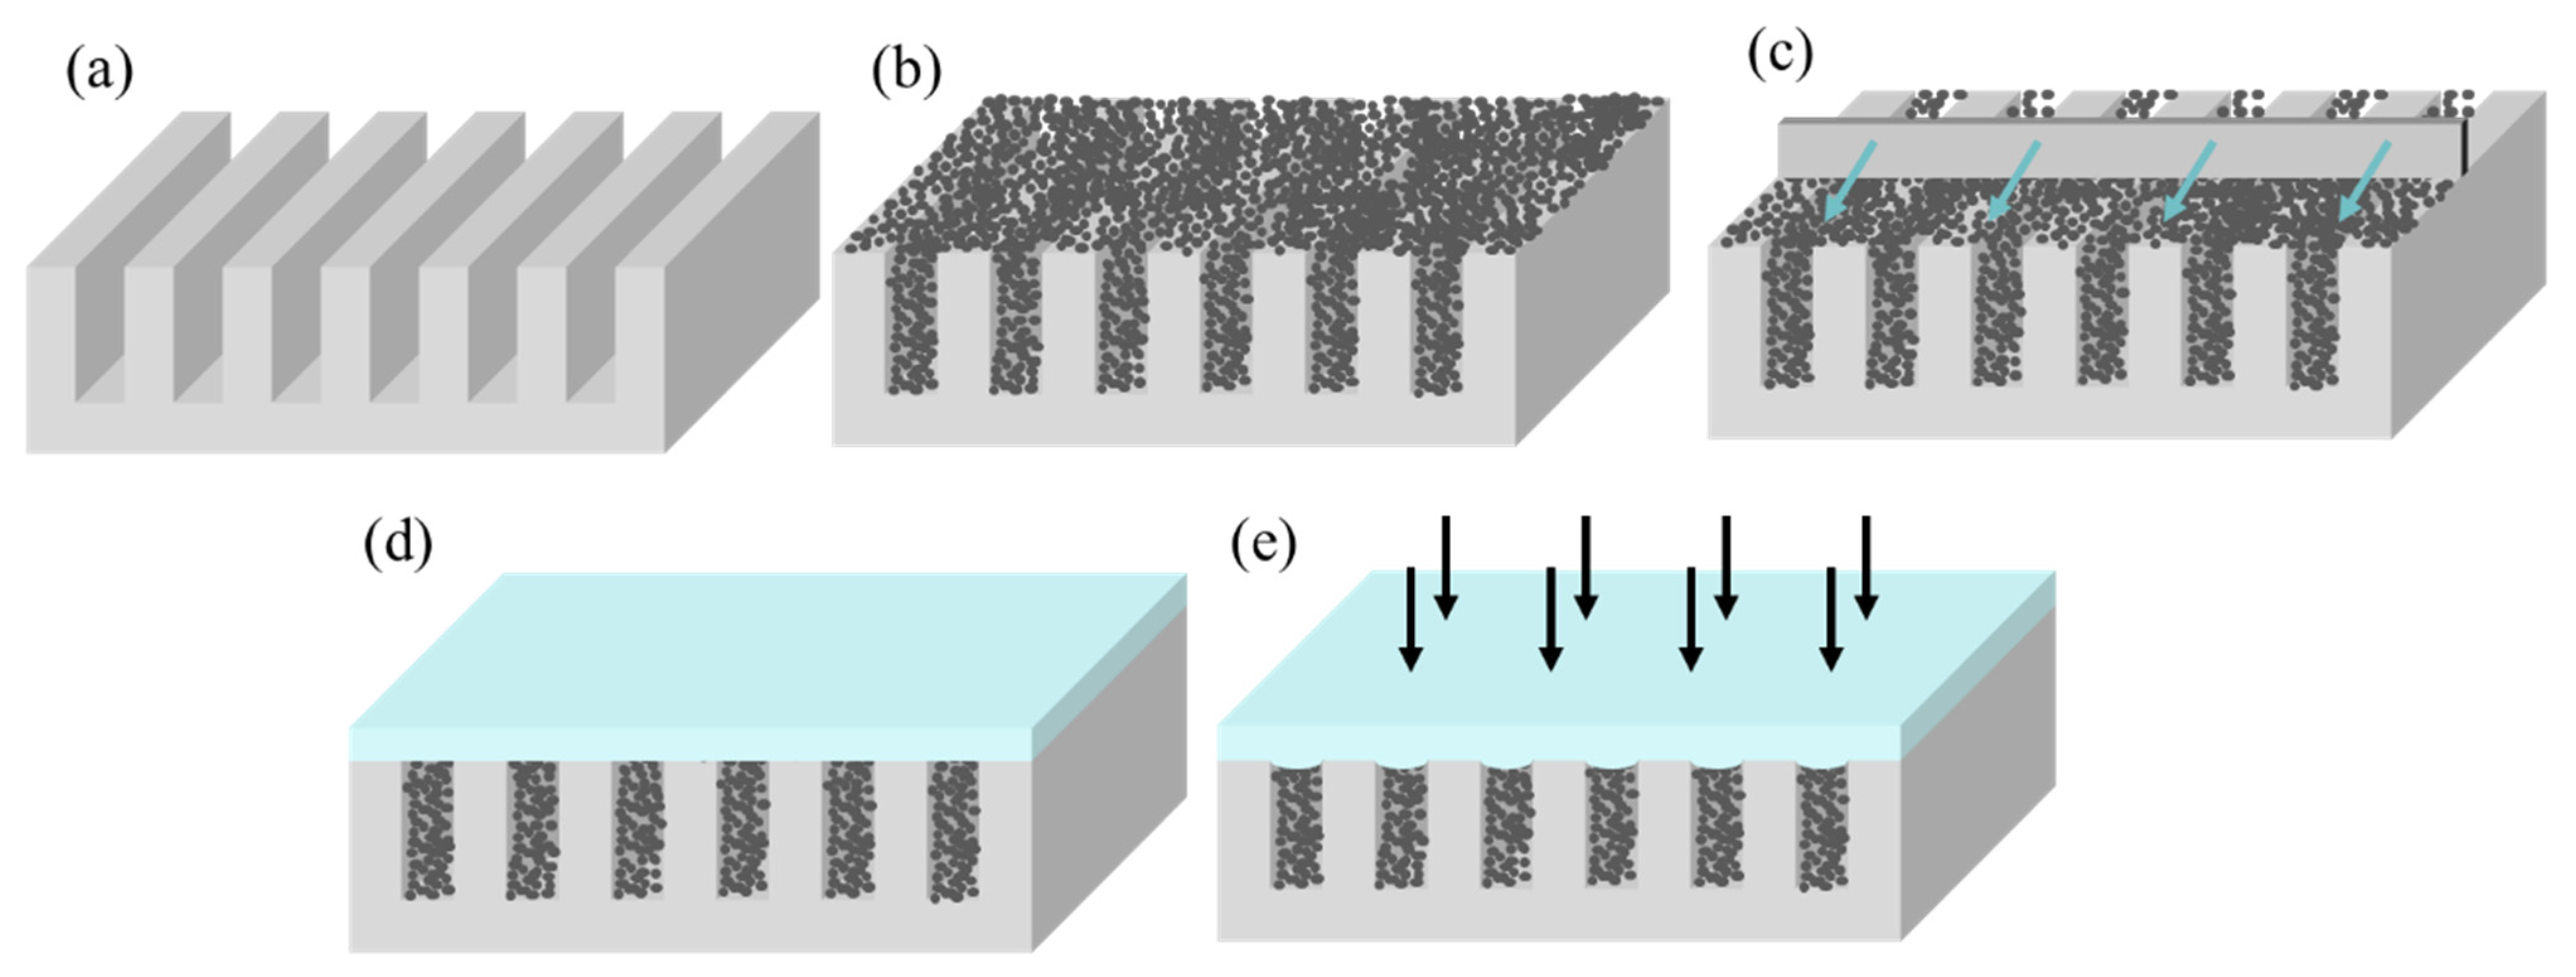
2.1. Methods
2.2. Experiment
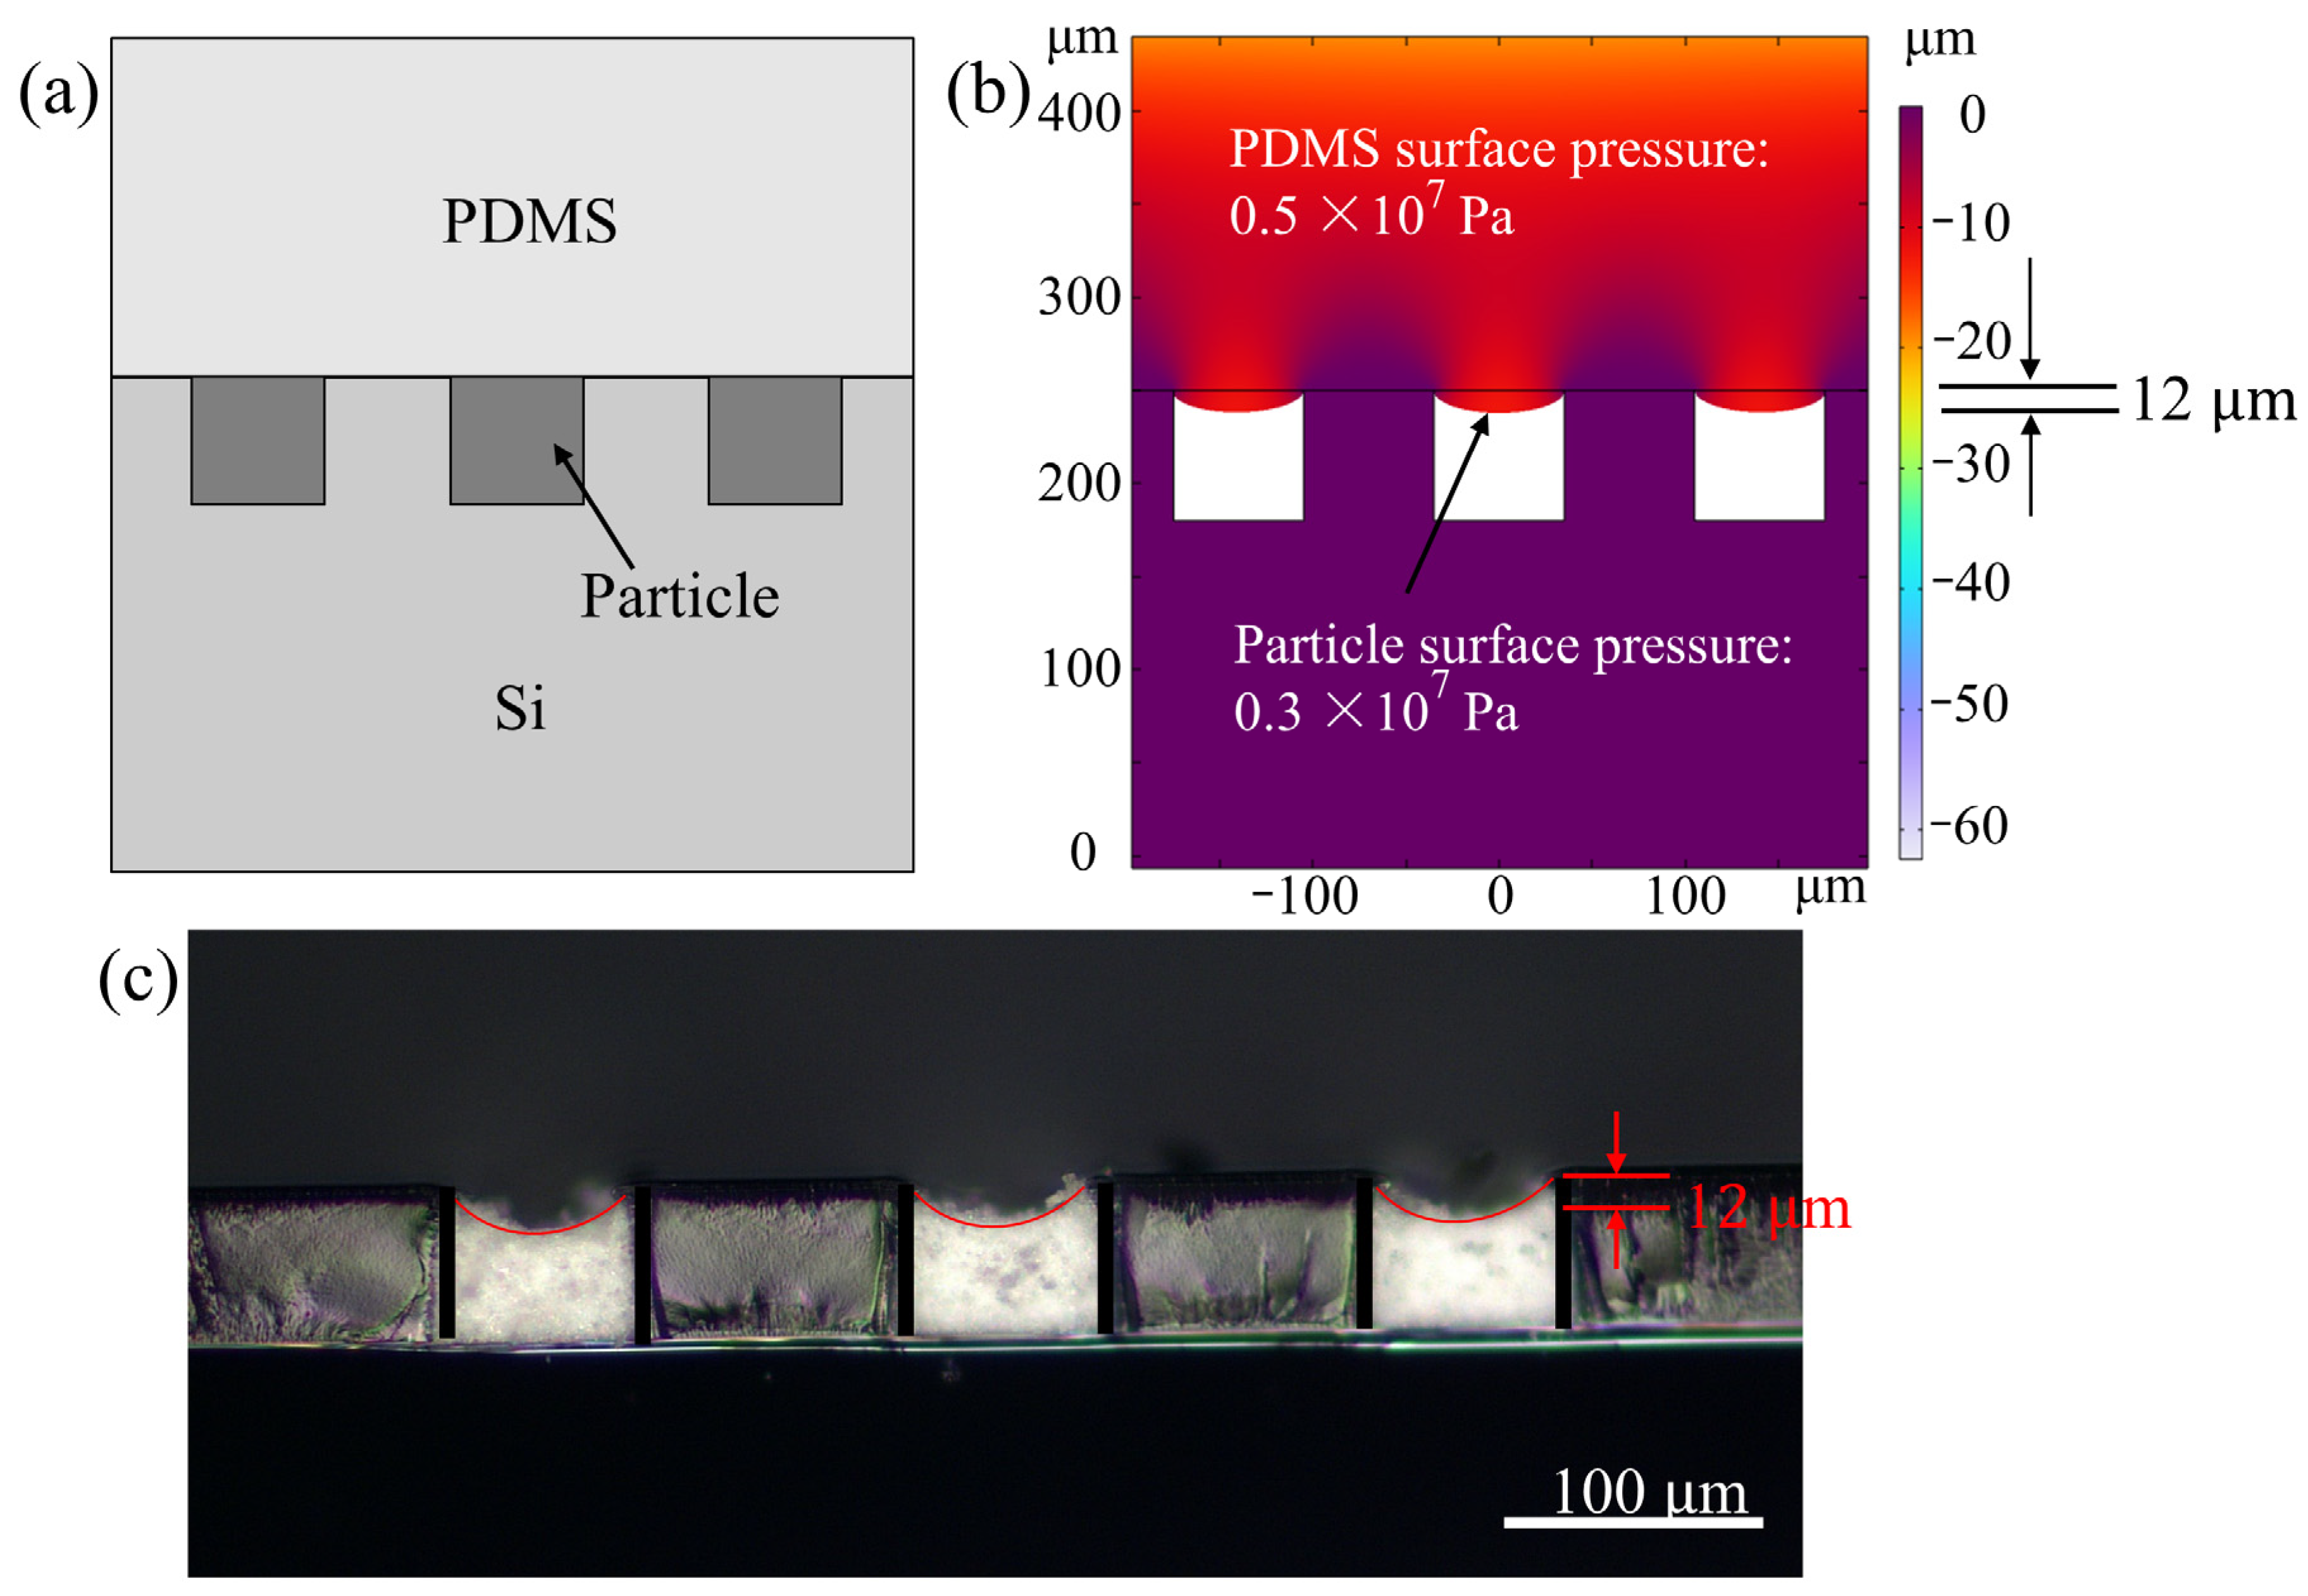
2.3. Simulation
3. Results and Discussion
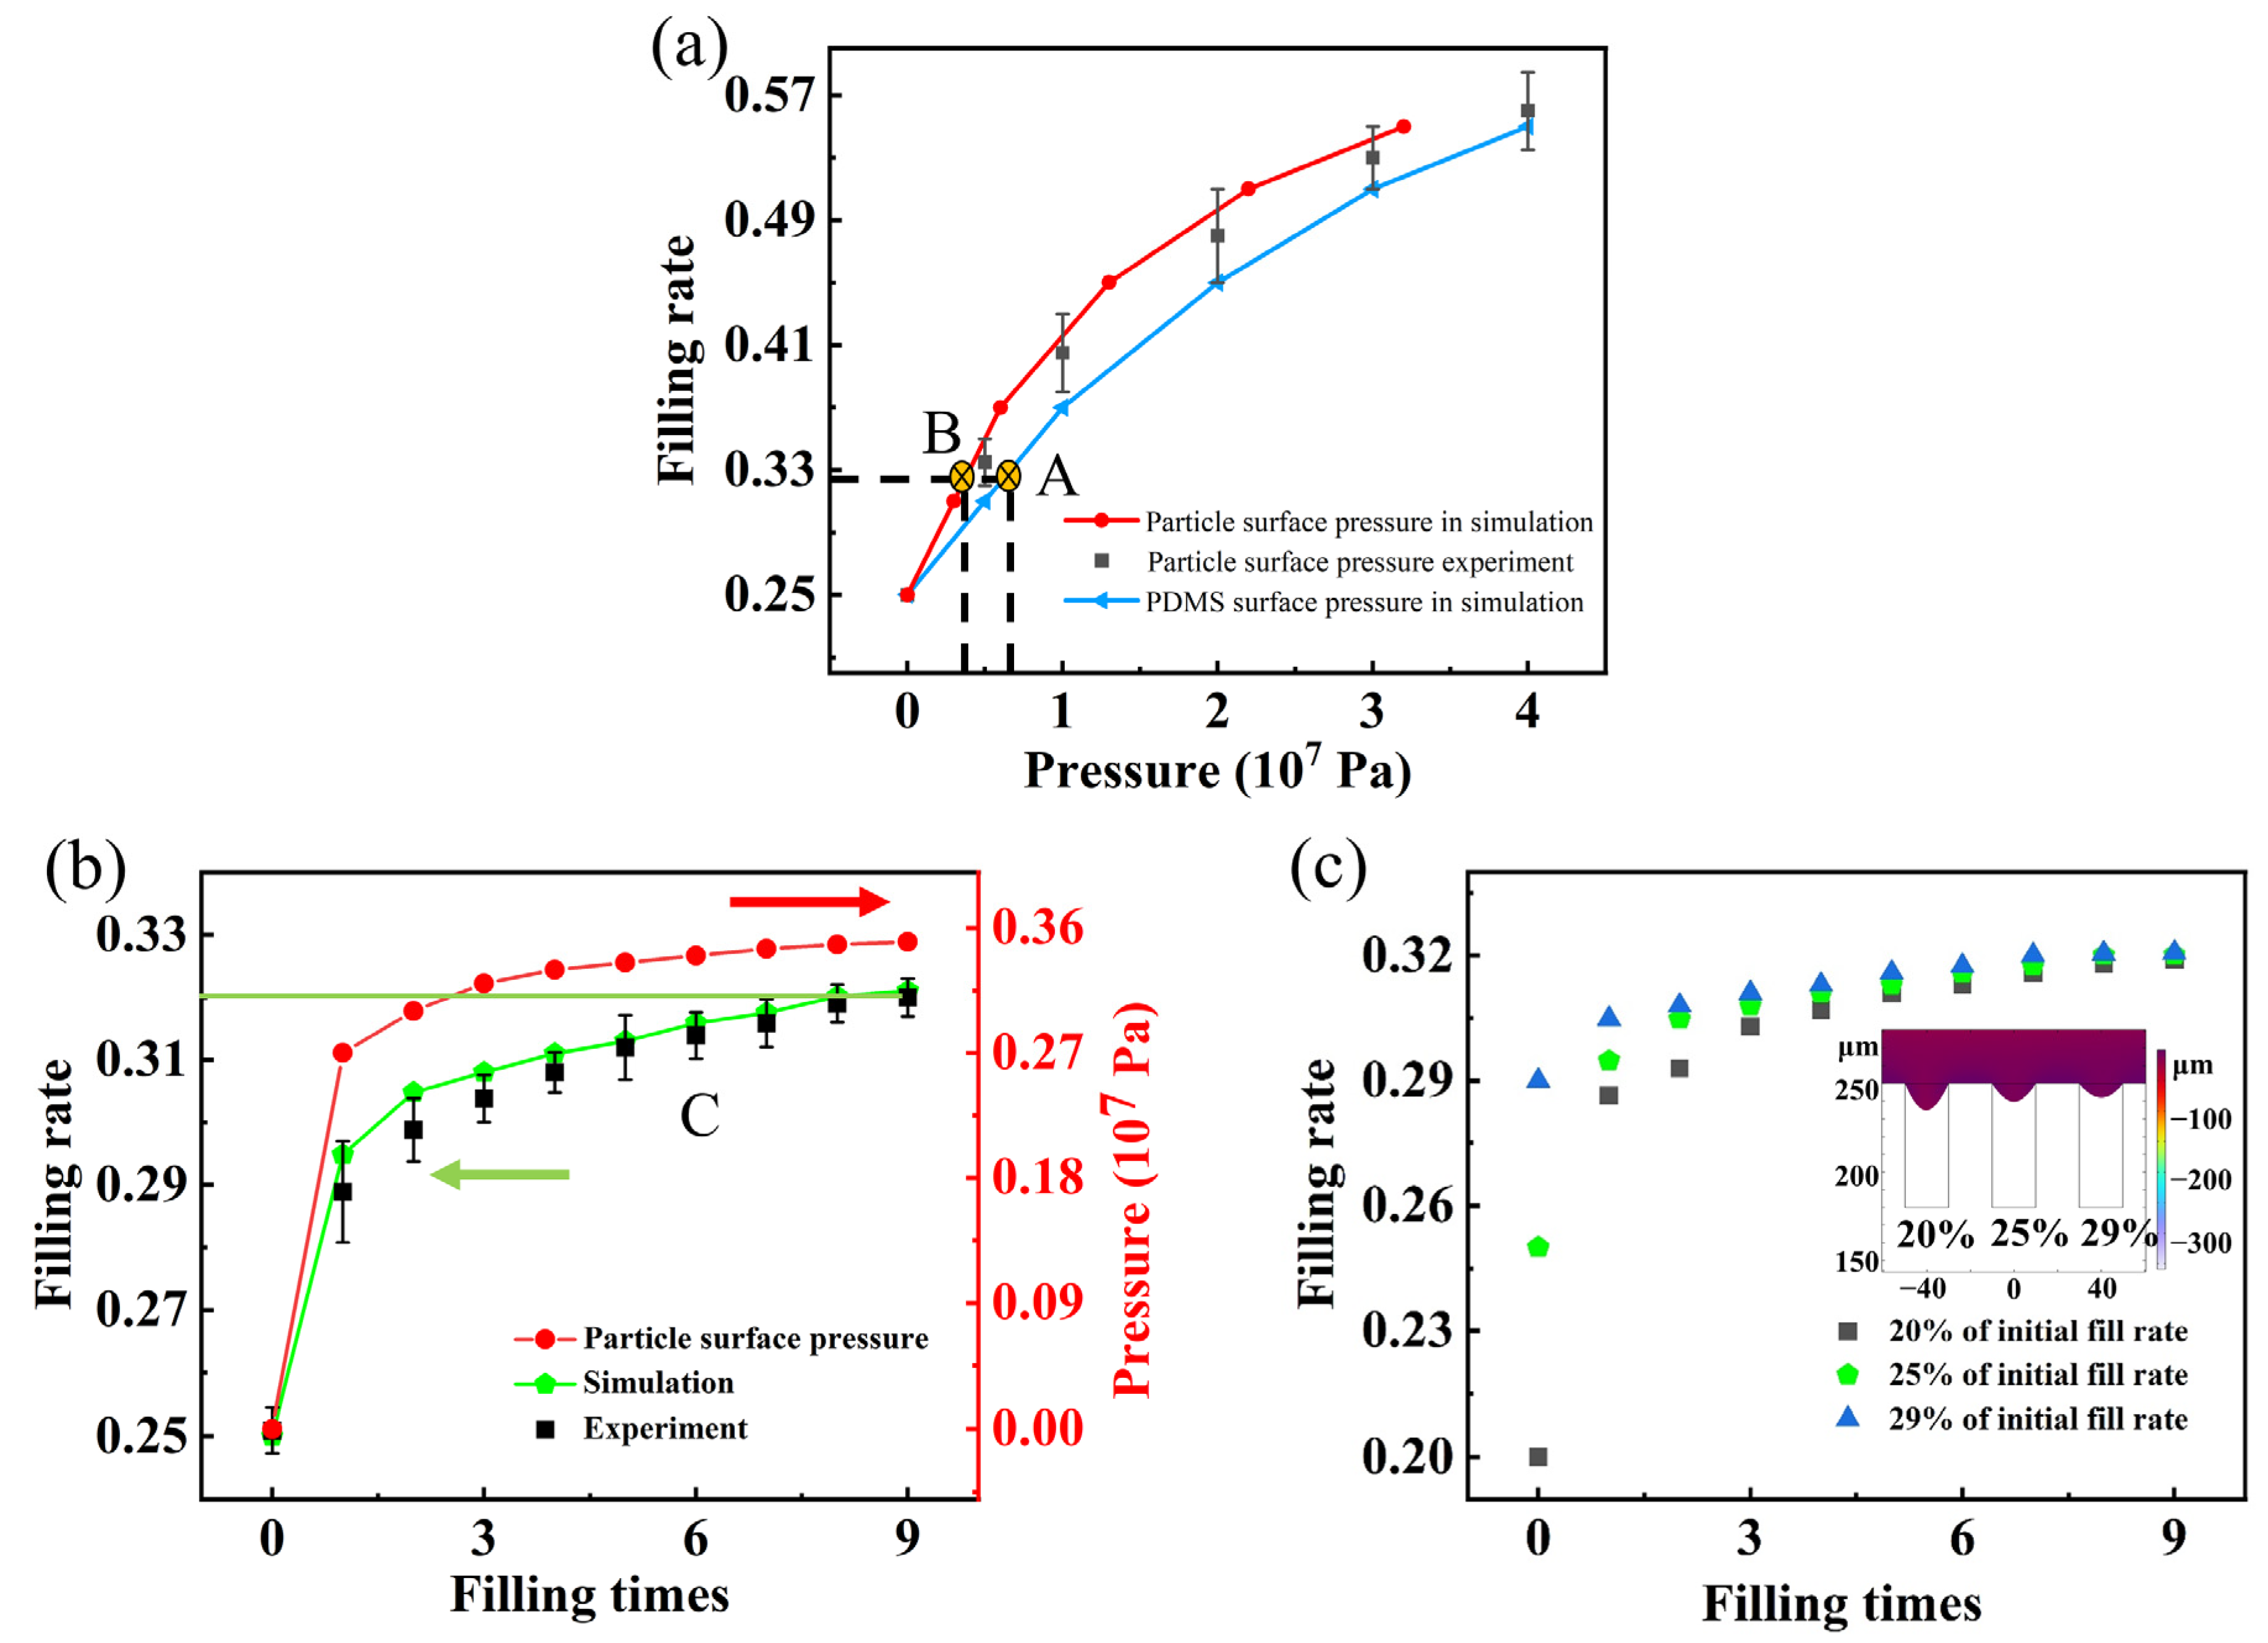
3.1. Effect of Pressure
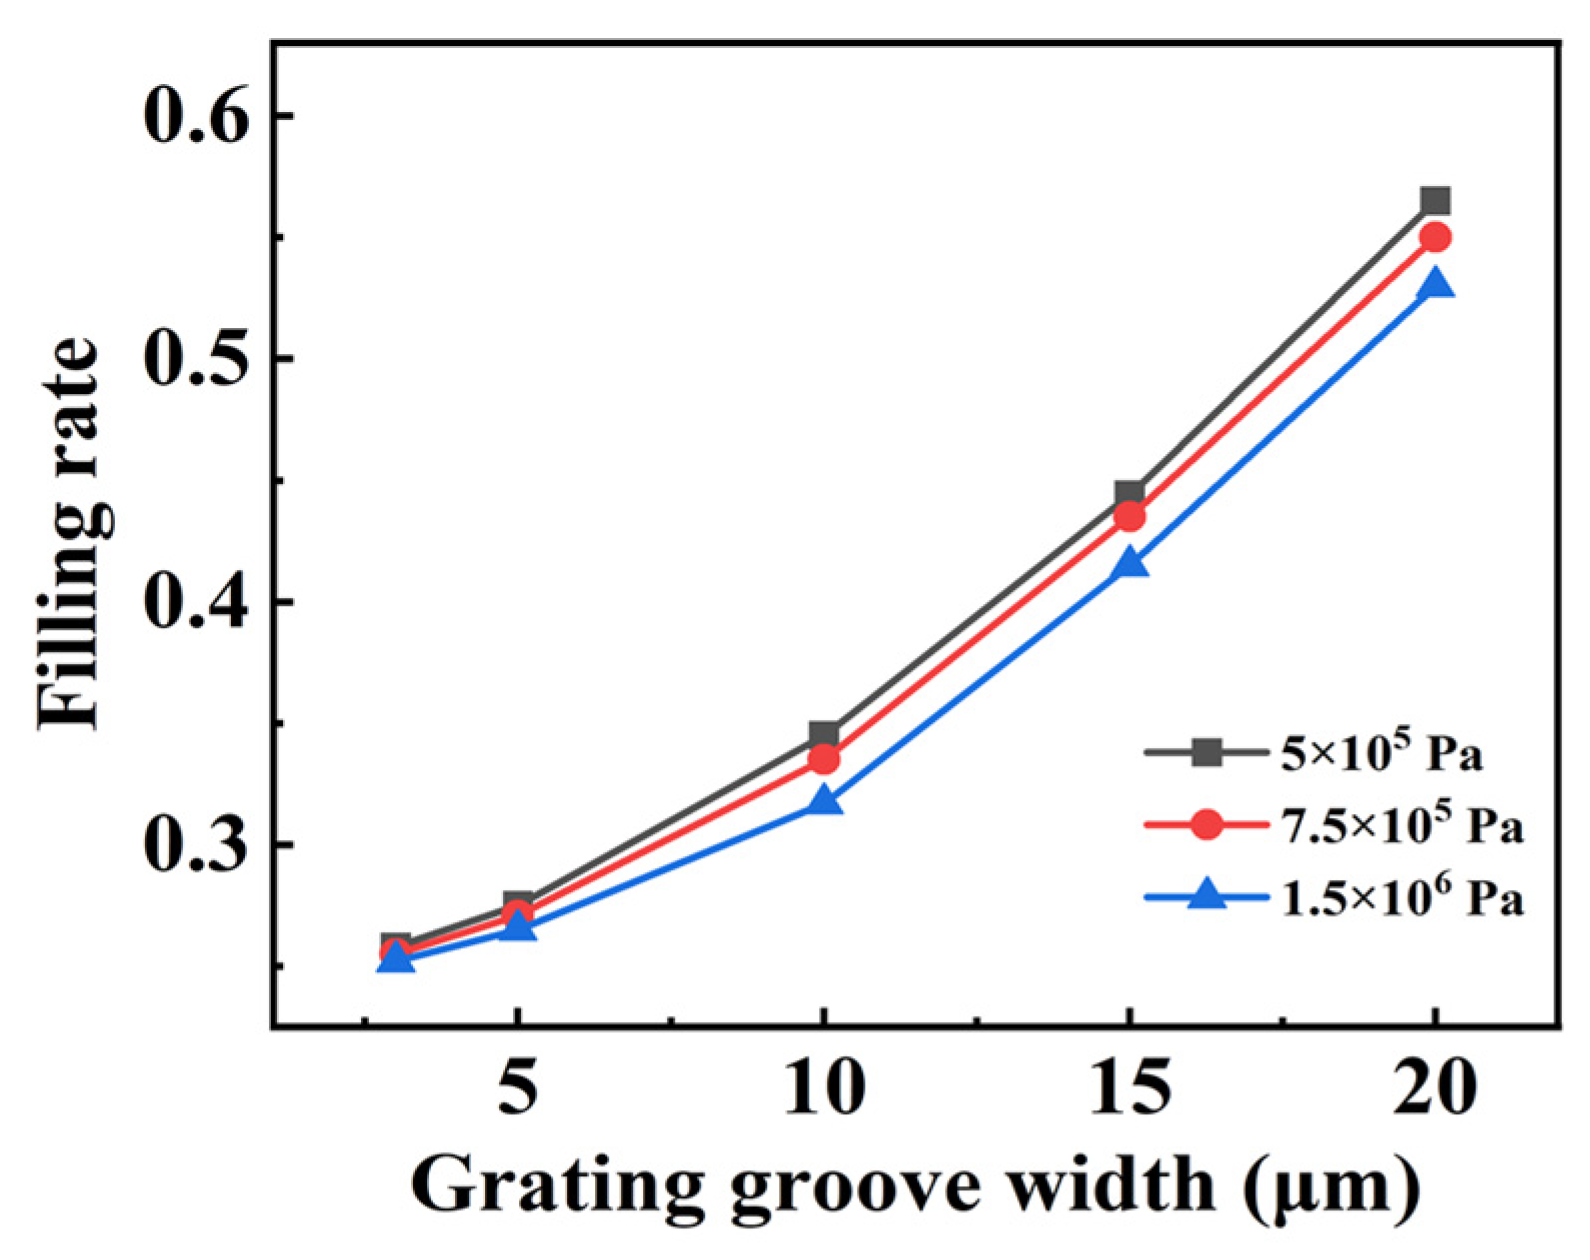
3.2. Effect of Structure and Material
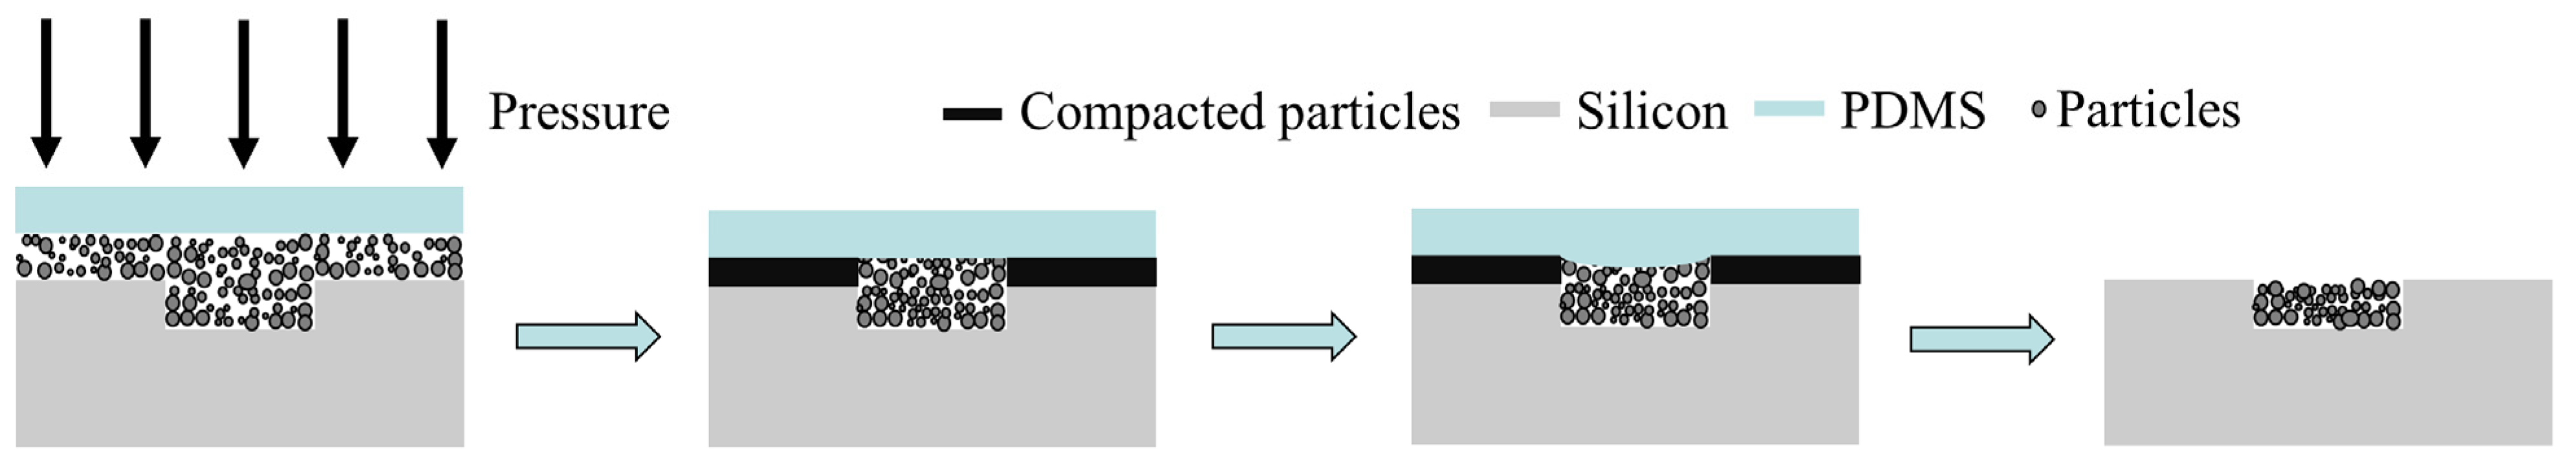
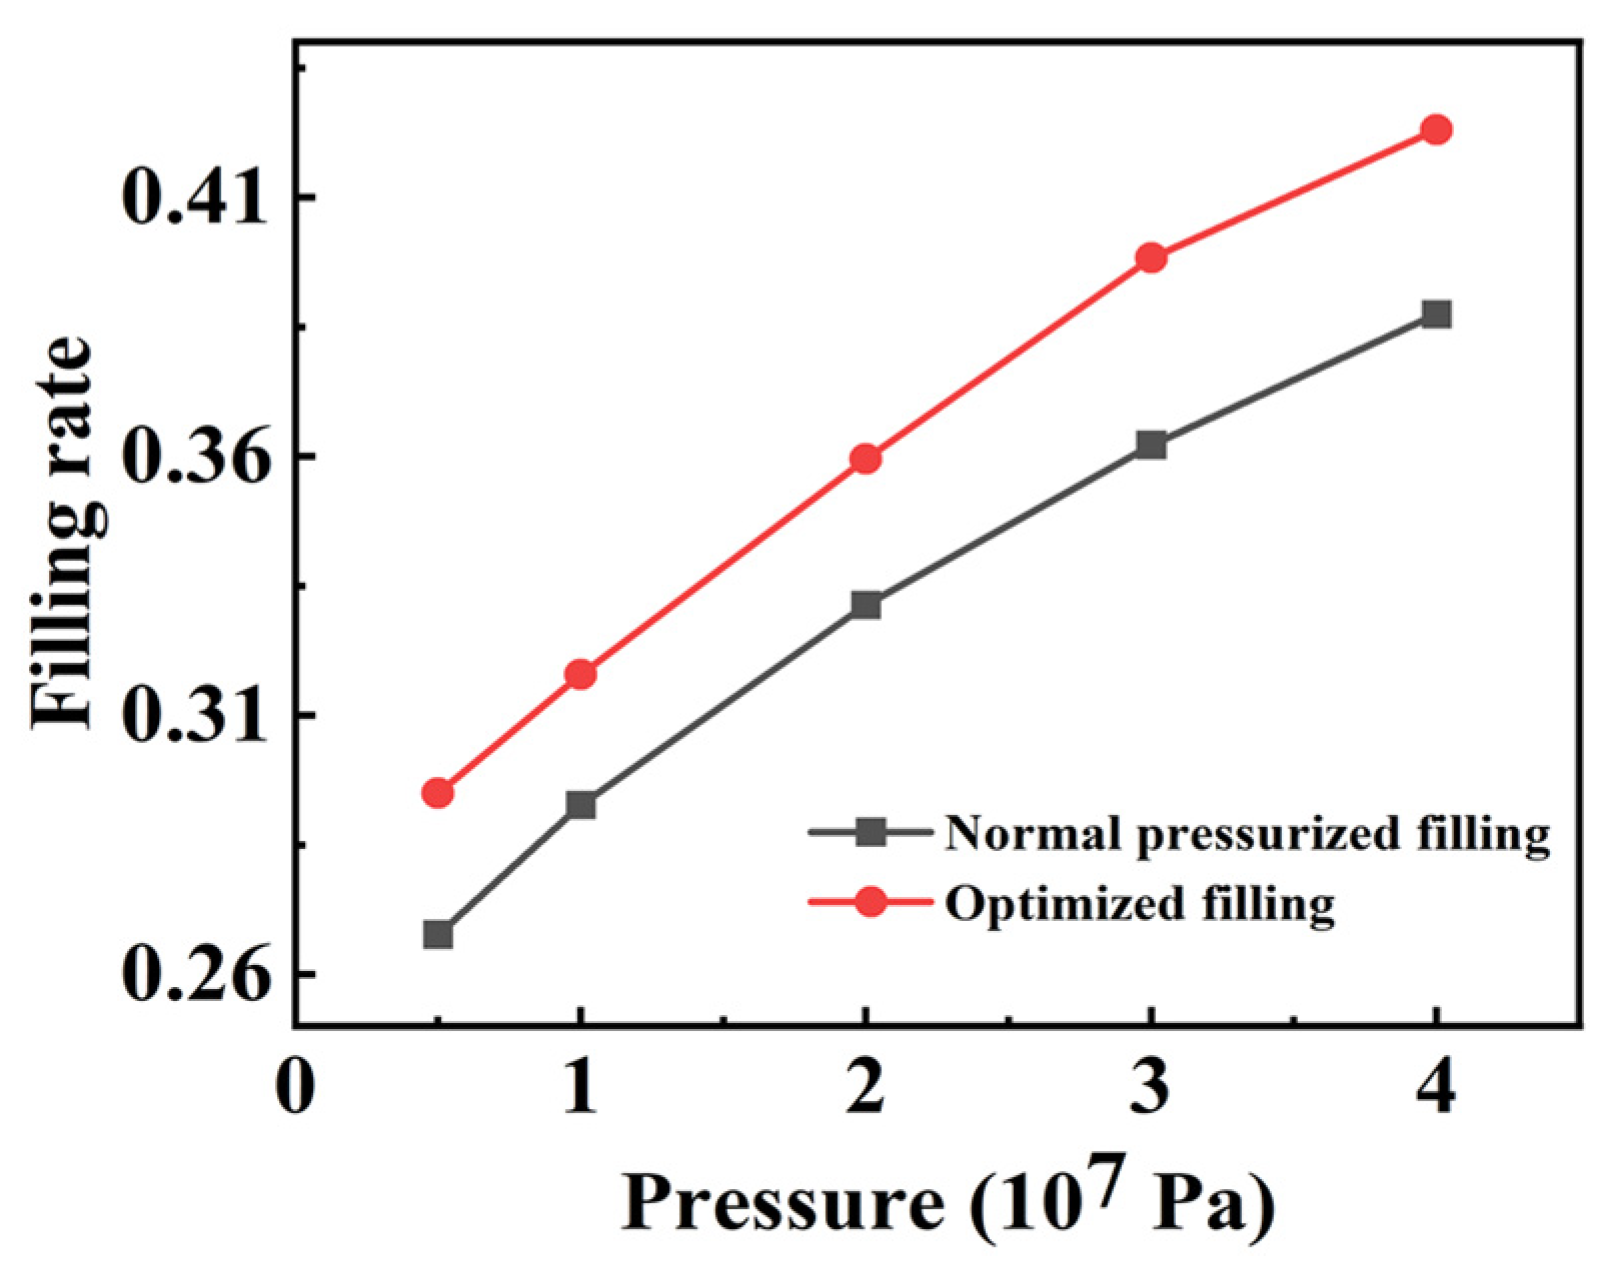
3.3. Process Optimization
4. Conclusions
Author Contributions
Funding
Data Availability Statement
Conflicts of Interest
References
- Artioli, G.; Hussey, D.S. Imaging with Neutrons. Elements 2021, 17, 189–194. [Google Scholar] [CrossRef]
- Kardjilov, N.; Manke, I.; Woracek, R.; Hilger, A.; Banhart, J. Advances in neutron imaging. Mater. Today 2018, 21, 652–672. [Google Scholar] [CrossRef]
- Strobl, M.; Manke, I.; Kardjilov, N.; Hilger, A.; Dawson, M.; Banhart, J. Advances in neutron radiography and tomography. J. Phys. D-Appl. Phys. 2009, 42, 21. [Google Scholar] [CrossRef]
- Momose, A.; Takano, H.; Wu, Y.L.; Hashimoto, K.; Samoto, T.; Hoshino, M.; Seki, Y.; Shinohara, T. Recent progress in X-ray and neutron phase imaging with gratings. Quantum Beam Sci. 2020, 4, 9. [Google Scholar] [CrossRef]
- Schillinger, B.; Calzada, E.; Lorenz, K. Modern neutron imaging: Radiography, tomography, dynamic and phase contrast imaging with neutrons. In Materials in Transition, Proceedings; Solid State Phenomena; Dobrzynski, L., Perzynska, K., Eds.; Trans Tech Publications Ltd.: Durnten, Switzerland, 2006; Volume 112, pp. 61–71. [Google Scholar]
- Kim, J.; Lee, S.W.; Cho, G. Visibility evaluation of a neutron grating interferometer operated with a polychromatic thermal neutron beam. Nucl. Instrum. Methods Phys. Res. Sect. A-Accel. Spectrometers Detect. Assoc. Equip. 2014, 746, 26–32. [Google Scholar] [CrossRef]
- Kim, Y.; Kim, J.; Kim, D.; Hussey, D.S.; Lee, S.W. Characterization of the phase sensitivity, visibility, and resolution in a symmetric neutron grating interferometer. Rev. Sci. Instrum. 2019, 90, 8. [Google Scholar] [CrossRef] [PubMed]
- Reimann, T.; Muhlbauer, S.; Horisberger, M.; Betz, B.; Boni, P.; Schulz, M. The new neutron grating interferometer at the ANTARES beamline: Design, principles and applications. J. Appl. Crystallogr. 2016, 49, 1488–1500. [Google Scholar] [CrossRef]
- Kim, J.; Lee, K.H.; Lim, C.H.; Kim, T.; Ahn, C.W.; Cho, G.; Lee, S.W. Fabrication and characterization of the source grating for visibility improvement of neutron phase imaging with gratings. Rev. Sci. Instrum. 2013, 84, 5. [Google Scholar] [CrossRef]
- Samoto, T.; Takano, H.; Momose, A. Gadolinium oblique evaporation approach to make large scale neutron absorption gratings for phase imaging. Jpn. J. Appl. Phys. 2019, 58, 6. [Google Scholar] [CrossRef]
- Samoto, T.; Takano, H.; Momose, A. Evaluation of obliquely evaporated gadolinium gratings for neutron interferometry by X-ray microtomography. Mater. Sci. Semicond. Process. 2019, 92, 91–95. [Google Scholar] [CrossRef]
- Grunzweig, C.; Pfeiffer, F.; Bunk, O.; Donath, T.; Kuhne, G.; Frei, G.; Dierolf, M.; David, C. Design, fabrication, and characterization of diffraction gratings for neutron phase contrast imaging. Rev. Sci. Instrum. 2008, 79, 6. [Google Scholar] [CrossRef] [PubMed]
- Gustschin, A.; Neuwirth, T.; Backs, A.; Schulz, M.; Pfeiffer, F. Fabrication of gadolinium particle-based absorption gratings for neutron grating interferometry. Rev. Sci. Instrum. 2018, 89, 7. [Google Scholar] [CrossRef] [PubMed]
- Seki, Y.; Shinohara, T.; Ueno, W.; Parker, J.D.; Samoto, T.; Yashiro, W.; Momose, A. Experimental evaluation of neutron absorption grating fabricated by oblique evaporation of gadolinium for phase imaging. In Proceedings of the 8th International Topical Meeting on Neutron Radiography (ITMNR), Beijing, China, 4–8 September 2016; pp. 217–223. [Google Scholar] [CrossRef]
- Harti, R.P.; Kottler, C.; Valsecchi, J.; Jefimovs, K.; Kagias, M.; Strobl, M.; Grunzweig, C. Visibility simulation of realistic grating interferometers including grating geometries and energy spectra. Opt. Express 2017, 25, 1019–1029. [Google Scholar] [CrossRef] [PubMed]
- Chen, Y.C.; Tsai, T.R.; Chu, J.P.; Sung, H.; Jang, J.S.C.; Kato, H. Imprinting of metallic glasses: A simple approach to making durable terahertz high-pass filters. Appl. Phys. Express 2012, 5, 3. [Google Scholar] [CrossRef]
- Sadeghilaridjani, M.; Kato, K.; Shinohara, T.; Yashiro, W.; Momose, A.; Kato, H. High aspect ratio grating by isochronal imprinting of less viscous workable Gd-based metallic glass for neutron phase imaging. Intermetallics 2016, 78, 55–63. [Google Scholar] [CrossRef]
- Yashiro, W.; Noda, D.; Hattori, T.; Hayashi, K.; Momose, A.; Kato, H. A metallic glass grating for X-ray grating interferometers fabricated by imprinting. Appl. Phys. Express 2014, 7, 3. [Google Scholar] [CrossRef]
- Kim, Y.; Kim, D.; Lee, S.; Kim, J.; Hussey, D.S.; Lee, S.W. Neutron grating interferometer with an analyzer grating based on a light blocker. Opt. Express 2020, 28, 23284–23293. [Google Scholar] [CrossRef]
- Shi, Z.T.; Jefimovs, K.; Romano, L.; Stampanoni, M. Towards the Fabrication of High-Aspect-Ratio Silicon Gratings by Deep Reactive Ion Etching. Micromachines 2020, 11, 864. [Google Scholar] [CrossRef]
- Lei, Y.H.; Li, Q.F.; Wali, A.; Liu, X.; Xu, G.W.; Li, J.; Huang, J.H. Tungsten nanoparticles-based x-ray absorption gratings for cascaded Talbot-Lau interferometers. J. Micromech. Microeng. 2019, 29, 6. [Google Scholar] [CrossRef]
- Hojo, D.; Kamezawa, C.; Hyodo, K.; Yashiro, W. Fabrication of X-ray absorption grating using an ultracentrifuge machine. Jpn. J. Appl. Phys. 2019, 58, 3. [Google Scholar] [CrossRef]
- Pinzek, S.; Gustschin, A.; Gustschin, N.; Viermetz, M.; Pfeiffer, F. Fabrication of X-ray absorption gratings by centrifugal deposition of bimodal tungsten particles in high aspect ratio silicon templates. Sci. Rep. 2022, 12, 5405. [Google Scholar] [CrossRef] [PubMed]


| Period (μm) | Duty Cycle | Groove Depth (μm) | Grating Area (mm2) | Pressure (107 Pa) | |
|---|---|---|---|---|---|
| Grating (a) | 140 | 0.5 | 70 | 60 × 60 | 0.5 |
| Grating (b) | 40 | 0.5 | 70 | 60 × 60 | 0.7 |
Disclaimer/Publisher’s Note: The statements, opinions and data contained in all publications are solely those of the individual author(s) and contributor(s) and not of MDPI and/or the editor(s). MDPI and/or the editor(s) disclaim responsibility for any injury to people or property resulting from any ideas, methods, instructions or products referred to in the content. |
© 2023 by the authors. Licensee MDPI, Basel, Switzerland. This article is an open access article distributed under the terms and conditions of the Creative Commons Attribution (CC BY) license (https://creativecommons.org/licenses/by/4.0/).
Share and Cite
Han, E.; Zhang, K.; Chen, L.; Guo, C.; Xiong, Y.; Guan, Y.; Tian, Y.; Liu, G. Simulation and Experimental Validation of a Pressurized Filling Method for Neutron Absorption Grating. Micromachines 2023, 14, 1016. https://doi.org/10.3390/mi14051016
Han E, Zhang K, Chen L, Guo C, Xiong Y, Guan Y, Tian Y, Liu G. Simulation and Experimental Validation of a Pressurized Filling Method for Neutron Absorption Grating. Micromachines. 2023; 14(5):1016. https://doi.org/10.3390/mi14051016
Chicago/Turabian StyleHan, Eryong, Kuanqiang Zhang, Lijuan Chen, Chenfei Guo, Ying Xiong, Yong Guan, Yangchao Tian, and Gang Liu. 2023. "Simulation and Experimental Validation of a Pressurized Filling Method for Neutron Absorption Grating" Micromachines 14, no. 5: 1016. https://doi.org/10.3390/mi14051016