Article

Magnetic Bistability for a Wider Bandwidth in Vibro-Impact Triboelectric Energy Harvesters

by
Qais Qaseem
and
Alwathiqbellah Ibrahim
*
Department of Mechanical Engineering, The University of Texas at Tyler, 3900 University Blvd., Tyler, TX 75799, USA
*
Author to whom correspondence should be addressed.
Micromachines 2023, 14(5), 1008; https://doi.org/10.3390/mi14051008
Submission received: 23 March 2023 / Revised: 26 April 2023 / Accepted: 5 May 2023 / Published: 7 May 2023

Abstract

:
Mechanical energy from vibrations is widespread in the ambient environment. It may be harvested efficiently using triboelectric generators. Nevertheless, a harvester’s effectiveness is restricted because of the limited bandwidth. To this end, this paper presents a comprehensive theoretical and experimental investigation of a variable frequency energy harvester, which integrates a vibro-impact triboelectric-based harvester and magnetic nonlinearity to increase the operation bandwidth and improve the efficiency of conventional triboelectric harvesters. A cantilever beam with a tip magnet was aligned with another fixed magnet at the same polarity to induce a nonlinear magnetic repulsive force. A triboelectric harvester was integrated into the system by utilizing the lower surface of the tip magnet to serve as the top electrode of the harvester, while the bottom electrode with an attached polydimethylsiloxane insulator was placed underneath. Numerical simulations were performed to examine the impact of the potential wells formed by the magnets. The structure’s static and dynamic behaviors at varying excitation levels, separation distance, and surface charge density are all discussed. In order to develop a variable frequency system with a wide bandwidth, the system’s natural frequency varies by changing the distance between the two magnets to reduce or magnify the magnetic force to achieve monostable or bistable oscillations. When the system is excited by vibrations, the beams vibrate, which causes an impact between the triboelectric layers. An alternating electrical signal is generated from a periodic contact-separation motion between the harvester’s electrodes. Our theoretical findings were experimentally validated. The findings of this study have the potential to pave the way for the development of an effective energy harvester that is capable of scavenging energy from ambient vibrations across a broad range of excitation frequencies. The frequency bandwidth was found to increase by 120% at threshold distance compared to the conventional energy harvester. Nonlinear impact-driven triboelectric energy harvesters can effectively broaden the operational frequency bandwidth and enhance the harvested energy.

1. Introduction

Mechanical vibrations, such as those created by human motions, cars, and equipment, are significant sources of lost mechanical power in our daily environment [1]. Therefore, this is one of the most abundant forms of wasted energy. It could be converted into environmentally renewable energy and used to power widely used microelectronics in environment control, emergency response, the monitoring and control of industrial processes, health monitoring, implantable medical devices, ships, automobiles, drilling rigs, and many other applications [2,3,4,5,6,7]. The frequency bandwidth of environmental vibration energy is vast, with low-frequency components dominating [8]. Consequently, the thought of harnessing this ambient energy is enticing [9].
Recently, energy harvesting has been presented as a novel solution for converting wasted energy into usable electrical energy because of the advantages of being environmentally friendly with minimal maintenance costs compared to batteries as a power source. However, the currently proposed vibration energy harvesting systems still have a narrow operational bandwidth [10,11]. Multiple transduction systems have been employed to transform wasted mechanical energy into usable electricity, such as electromagnetic [12,13,14], piezoelectric [15,16,17,18], electrostatic [19,20,21], and triboelectric [22,23,24,25,26] energy. With low-cost materials, a high power density, environmental friendliness, an extended service life, and simple fabrication, triboelectric energy harvesting is considered an efficient method for converting small-scale kinetic energy into electricity [27]. In addition, the triboelectric energy harvesting technique has widespread applications utilizing many vibration sources, such as human activities [28,29,30], wind flow [31,32,33], and mechanical vibrations [23,34,35]. The working principle of triboelectricity is based on electrification and electrostatic induction, which happens when two materials with opposite polarities come into contact and then separate [36,37,38].
Even though external environmental excitations have a broad range, linear vibration energy harvesters have a narrow frequency bandwidth, which minimizes the amount of energy that can be harvested. Therefore, these harvesters must only be activated at resonance frequency to achieve a satisfactory energy conversion rate. Small deviations in the external excitation frequency from the resonance frequency of a linear vibration energy harvester substantially impact its performance, which makes them inefficient. In reality, by expanding the frequency bandwidth of a harvester, the system can be more effective across a broader spectrum of external frequencies [39,40]. Adding nonlinearity to the system is one of the most appropriate strategies for enhancing the frequency bandwidth of a harvester [41,42]. Several techniques for exploiting nonlinearity have been studied, including duffing [43,44,45,46], impact [47,48,49,50,51,52], and bistable oscillator designs [53,54,55,56,57,58]. Recently, vibro-impact has been applied to vibration energy harvesters to boost harvesting efficiency. Numerous technical applications use vibro-impact, including cutting and grinding equipment, pile-driving machines, turbomachinery, frequent rubbing of rotor blades and stators, and hand-held percussion devices [59]. Several studies investigated triboelectric and electrostatic effects utilizing vibro-impact structures and achieved higher bandwidth compared to the nonimpact harvesters [60]. The vibro-impact of multidegrees-of-freedom systems increased the operational bandwidth [51,61,62,63,64,65,66]. However, such systems need to be bulky and fabricated in large sizes. Other techniques were used to increase the output power and operating frequency bandwidth of piezoelectric and triboelectric energy harvester devices, such as mechanical impact [51,52,67] and mechanical stoppers [62,68,69,70]. However, all these previous studies have a specific range for operating frequencies, and changing the operating range requires modifying the structural parameters. Nonlinearities are another approach to extending the operating bandwidth of energy harvesters via bistability [35,55,58,71,72], compared to linear harvesters. However, the enhancement in the operating bandwidth utilizing only nonlinearity is still insignificant.
Nonlinearity plays a significant role in expanding the bandwidth of linear harvesters. Structural and magnetic nonlinearities are some of the most common techniques used to increase the frequency bandwidth and harvesting efficiency [73]. Scientists have devised numerous designs to produce bistable conditions, which broadens the response bandwidth and boosts the harvesting efficiency [74,75]. For example, a cantilever beam structure with two magnets generates monostable and bistable potential energy depending on the magnetic spacing fluctuation [55,58,76]. Nonlinear hysteresis (softening and hardening) induced large amplitude oscillations that significantly expanded the frequency bandwidth for both monostable [77] and bistable harvesters [78]. In addition, the inter-well motions due to the high kinetic energy in bistable energy harvester systems broadened the frequency bandwidth and enhanced the average power density [79]. Such bistable systems have been extensively explored and widely implemented in piezoelectric [80] and magnetoelectric energy harvesting [12], and electromagnetic energy harvesters [81]. A bistable actuator coupled with a flexible triboelectric nanogenerator sensor was designed to detect bladder fullness and help to empty it [82]. The work used permanent magnets and springs as a bistable structure in a TEH for broadband energy harvesting at low frequencies [83,84]. However, these studies in triboelectric did not shed light on the dynamic behavior of the harvesters, and in general, there is a lack of investigations into the static and dynamic behaviors of the mono, transition, and bistable regions in triboelectric energy harvesting systems.
We created a nonlinear variable frequency vibro-impact vibration energy harvester with triboelectric transducers to achieve a high energy density and large bandwidth under harmonic excitations. This study focused on combining magnetic nonlinearity with the inherent phenomenon of vibro-impact in triboelectric energy harvesters to broaden the harvesting bandwidth of triboelectric energy harvesters. The combination of magnetic nonlinearity and vibro-impact is a novel strategy for triboelectric energy harvester applications. Moreover, the addition of magnetic nonlinearity makes the harvester a variable frequency energy harvester, where the operating frequency can be controlled by controlling the distance between the two magnets to target multiple applications within the ambient range. In this study, we presented a variable frequency nonlinear vibro-impact energy harvester based on triboelectric with induced magnetic nonlinearity under harmonic excitations to increase the bandwidth. We contributed by combining magnetic nonlinearity with vibro-impact to enhance the operating bandwidth of linear vibro-impact harvesters. We developed a theoretical lumped piecewise model to comprehend the harvester’s static and dynamic behaviors. We experimentally validated our model to prove the viability of adding magnetic nonlinearity to the triboelectric transduction mechanism. This article is structured as follows: The design and configurations of triboelectric energy harvesters are covered in the Device Configuration Section and Principle of Operation. We constructed the theoretical model utilizing a lumped parameter model technique as outlined in the Theoretical Model Section, and the Results and Discussion Section provides the associated results, which were experimentally validated. In the Conclusion Section, we wrap up by drawing some conclusions.

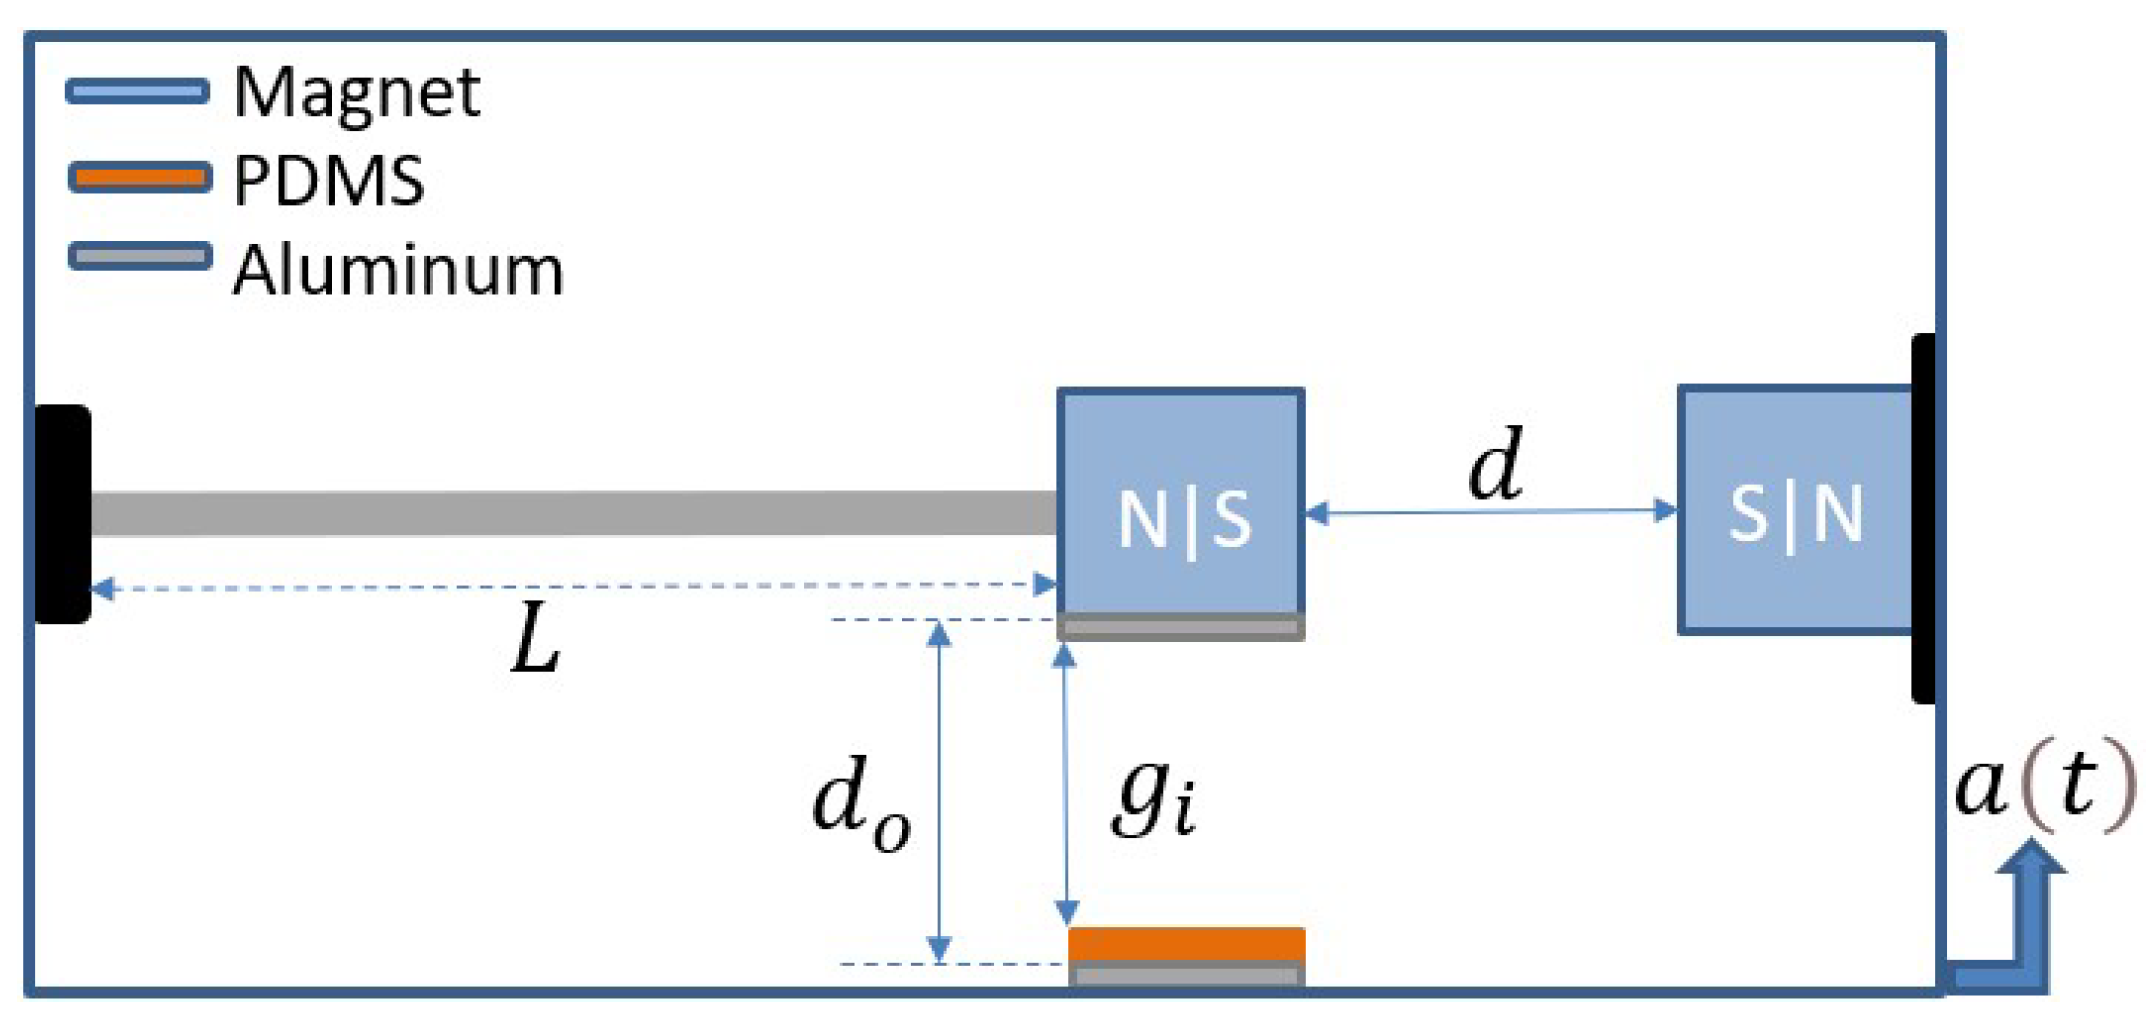
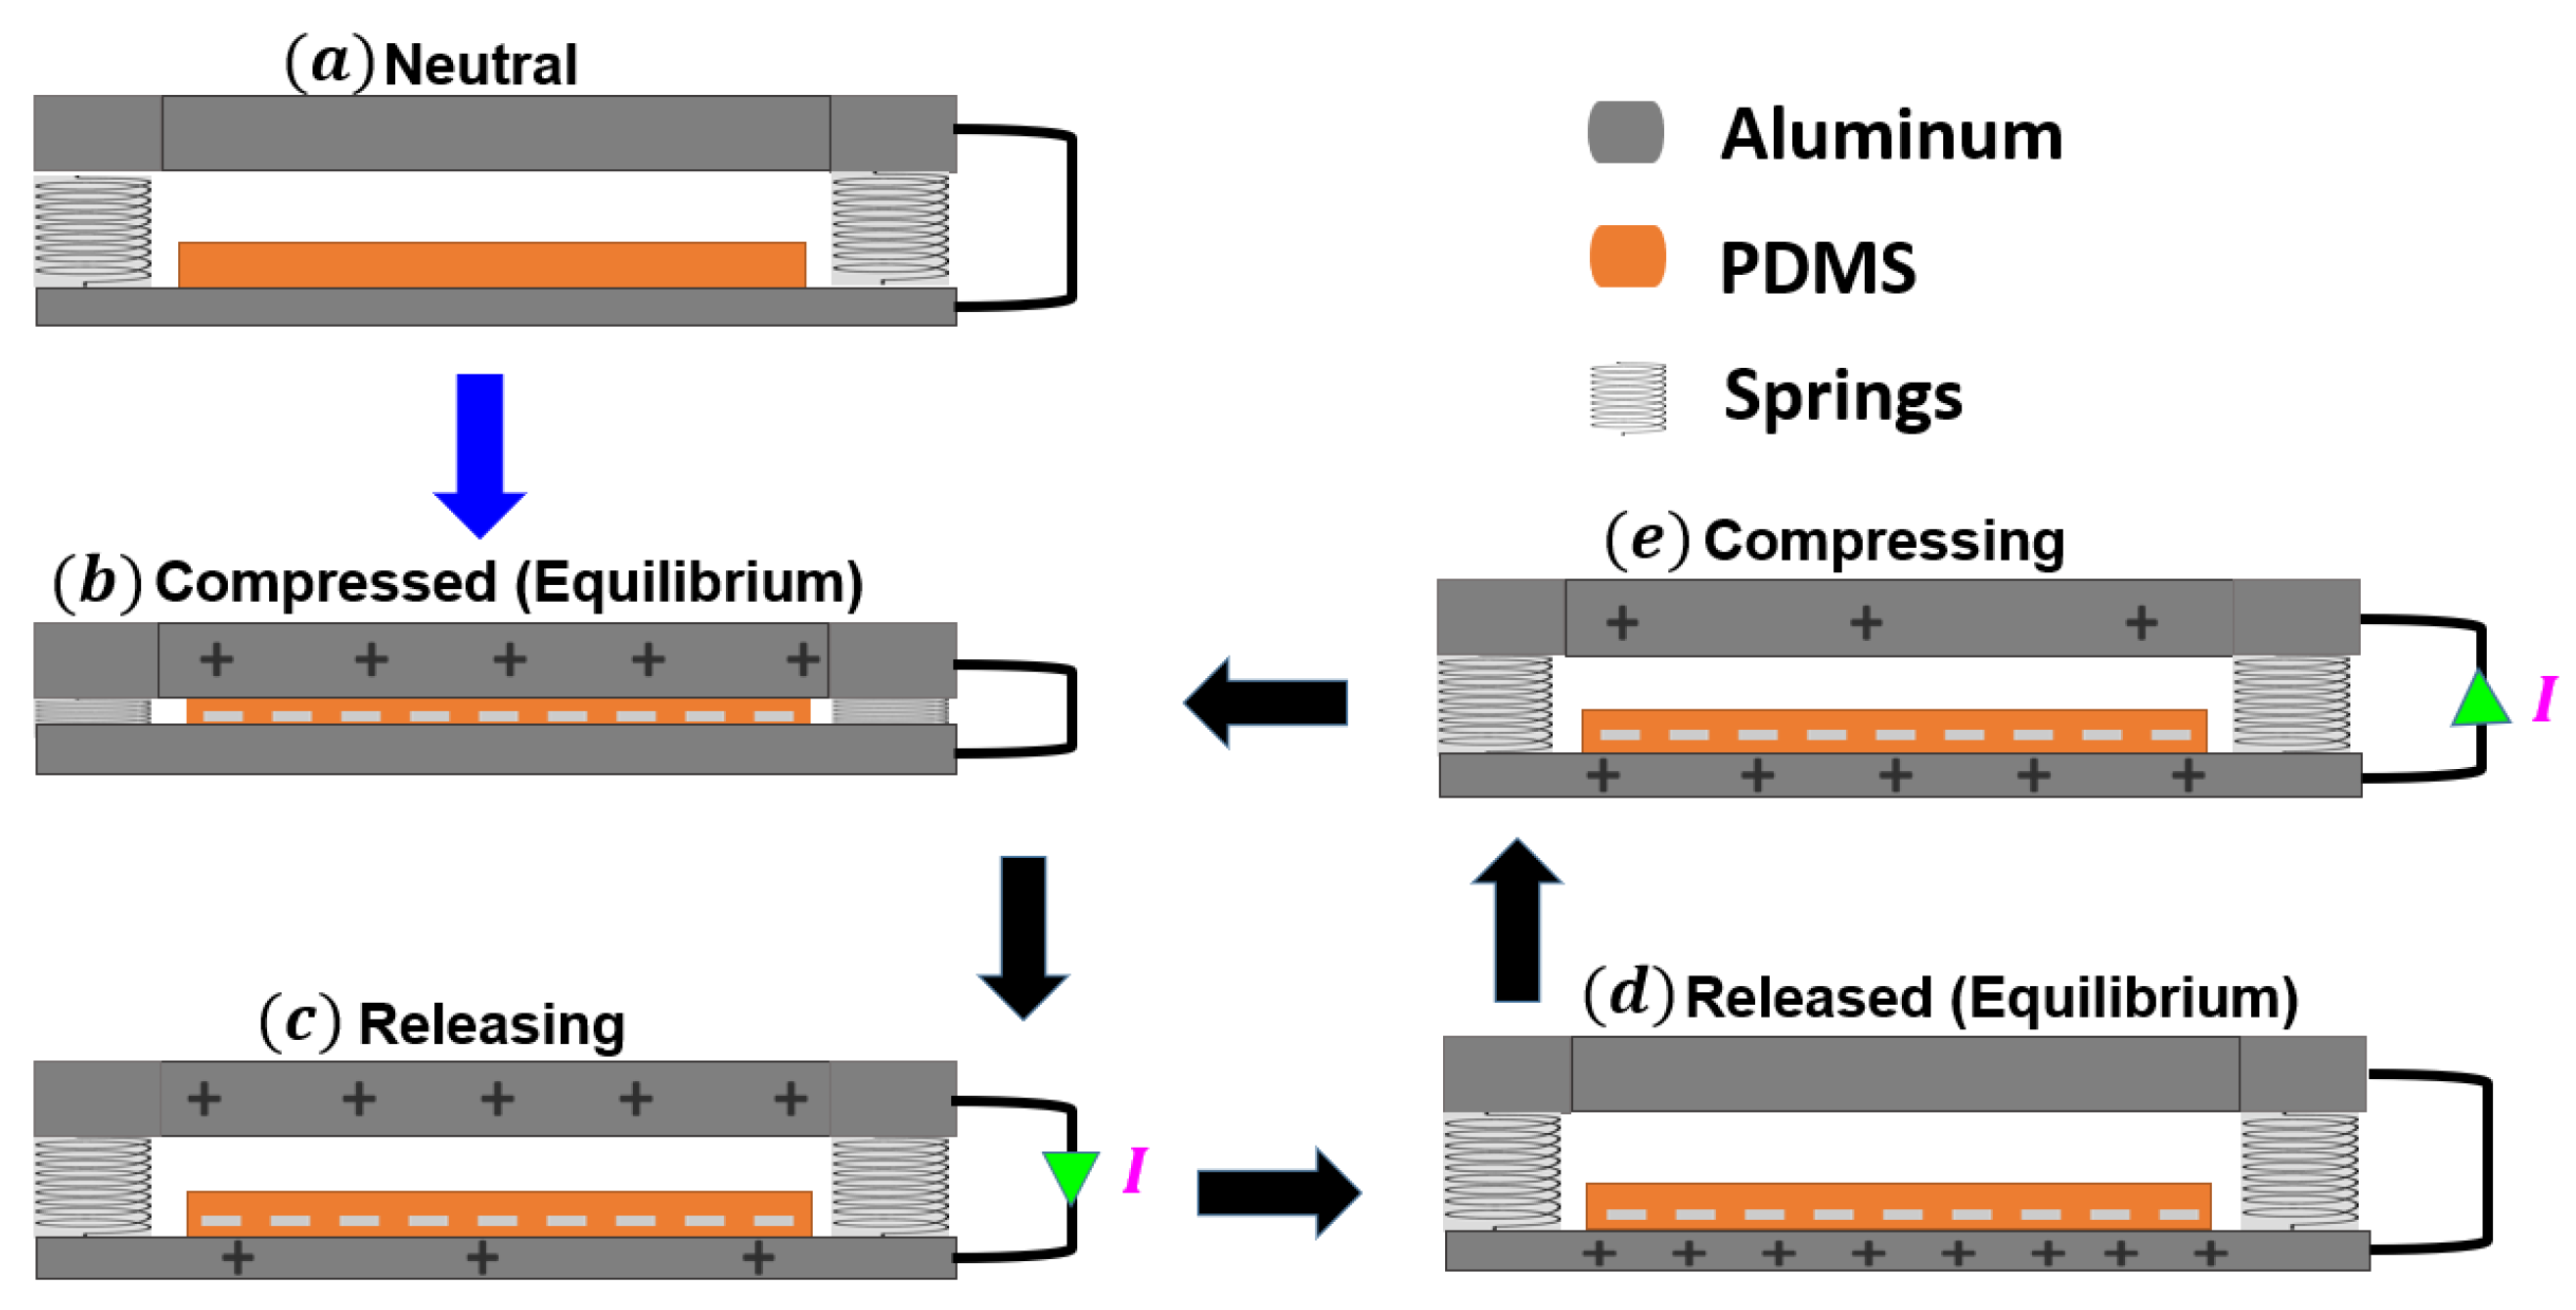
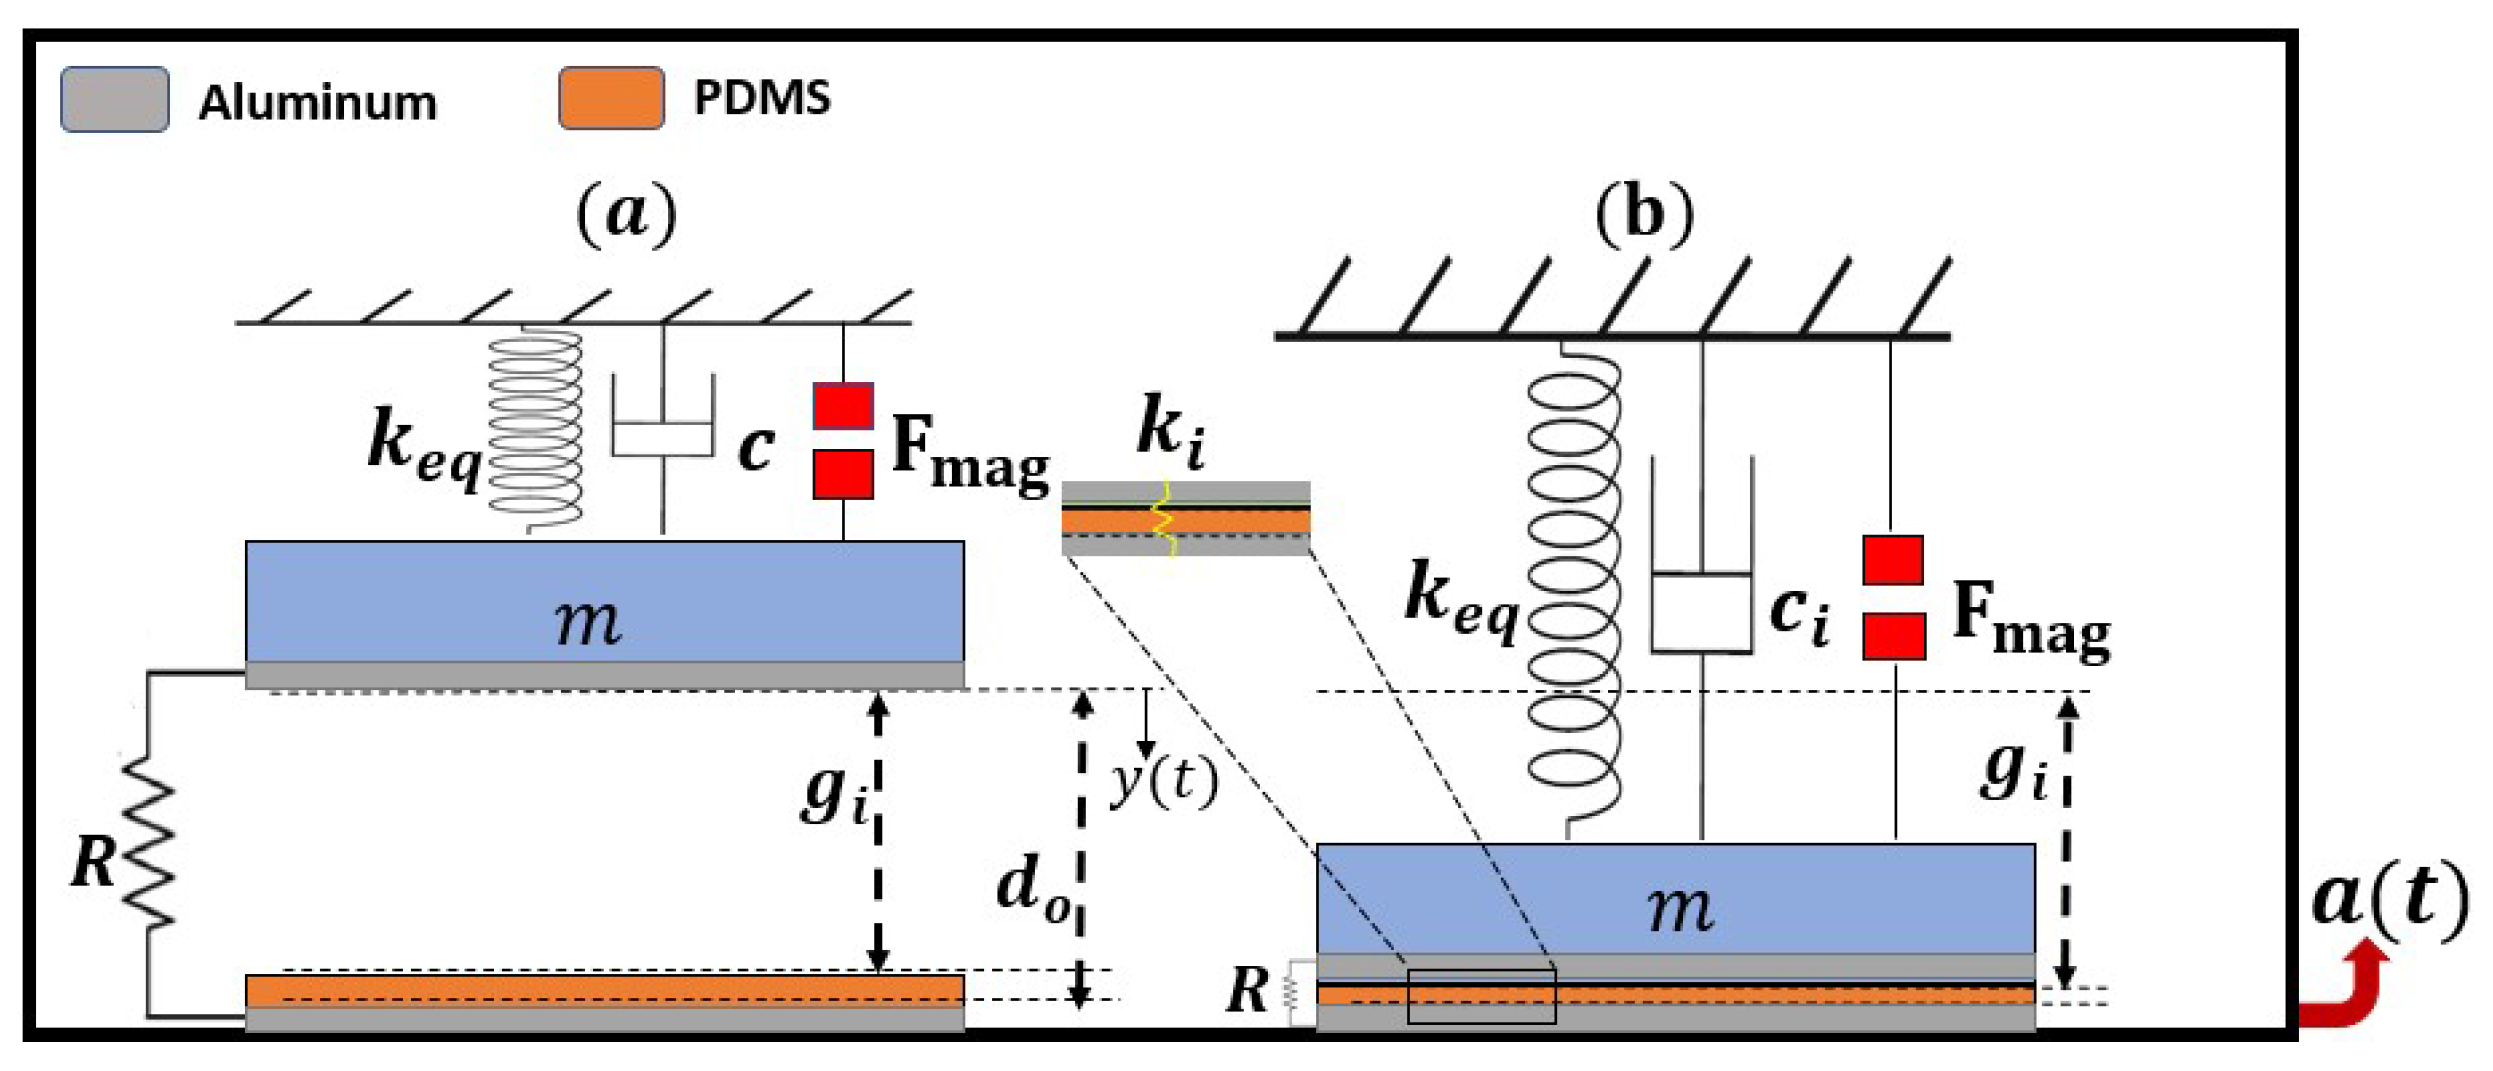
2. Device Configuration and Principle of Operation

A permanent magnet is attached to the tip of a cantilever beam. Another fixed magnet is positioned facing the tip magnet at the same polarity to induce magnetic nonlinearity to the structure. An aluminum layer is attached to the bottom surface of the tip magnet, which serves as an upper electrode of the triboelectric energy harvester. Another aluminum layer coated with polydimethylsiloxane (PDMS) is fixed below the upper electrode and acts as the lower electrode of the triboelectric generator. A schematic of the whole structure is shown in Figure 1. When the structure is subjected to base excitation, the cantilever beam vibrates, and the two electrodes contact each other periodically, generating an electrical signal. The two magnets are separated by a distance d, which determines the nature of the oscillations. At a large d, the magnetic force is weak, and the system oscillates around a single well, known as monostable oscillation. In contrast, at a low d, the magnetic force is magnified and the system oscillates in a double well, known as bistable oscillations. The separation distance that differentiates between the monostable from the bistable oscillation is known as the threshold distance ( d t h ).
The principle of operation for the nonlinear harvester is shown in Figure 2. The stability of the harvester is a function of the distance between the two magnets, as shown in Figure 2a. The repulsive magnetic force becomes weak when the two magnets are set far from each other (large d), and the beam oscillates at a single stable equilibrium point around its horizontal axis (see case 1 in Figure 2a), which is called the monostable range. The corresponding potential energy function is shown in Figure 2b at a separation distance of d > d t h , where a single-potential well profile is shown and reflects the oscillation around case 1 in Figure 2a. In contrast, when the two magnets are set close to each other (small d), the repulsive magnetic force becomes strong and forces the beam to oscillate at double stable equilibrium points around its horizontal axis (cases 2 and 3 in Figure 2a), which is called the bistable range. The corresponding potential energy function is shown in Figure 2b at a separation distance of d < d t h , where double-potential well profiles are shown and reflect the oscillation around cases 2 and 3 in Figure 2a. From Figure 2b, we can see that the oscillations of the system are transferred from a single-potential well to a double-potential well by lowering the distance between the two magnets. Furthermore, the barrier between the double-potential wells becomes higher compared to the system’s energy, and then there are two degenerate states corresponding to the energy being localized in one well or the other.
The triboelectric generator consists of two layers with opposing electron loss and gain tendencies and generates electricity through periodic contact and separation between the harvester’s electrodes. The triboelectric working mechanism generates electricity based on contact electrification and electrostatic induction. Therefore, the electrodes and the insulator are selected based on the triboelectric series, where the two materials should have an opposite tendency to lose and gain electrons. Our selection reflects this point since the aluminum tends to be positively charged, while the PDMS layer has the affinity to be negatively charged. The detailed working mechanism of the triboelectric generator is depicted in Figure 3. Initially, the harvester’s electrodes are neutral and free of charge; see Figure 3a. When the base excitation is strong enough to overcome the restoring force from the elastic beam, the harvester’s electrodes come into contact, the upper Al layer becomes positively charged, and the PDMS layer becomes negatively charged; see Figure 3b. Then, when the base excitation is weak, the restoring force from the elastic beam dominates, forcing the harvester’s electrodes to separate from each other, and the current flows from the upper Al layer to the lower one due to the potential difference between them; see Figure 3c. Once the electrostatic and triboelectric charges are liberated, they equalize and reach equilibrium; see Figure 3d. However, when the mechanical load is applied again, it breaks the equilibrium, capacitance is charged, and current flows in the opposite direction resulting in an alternating current being generated; see Figure 3e.

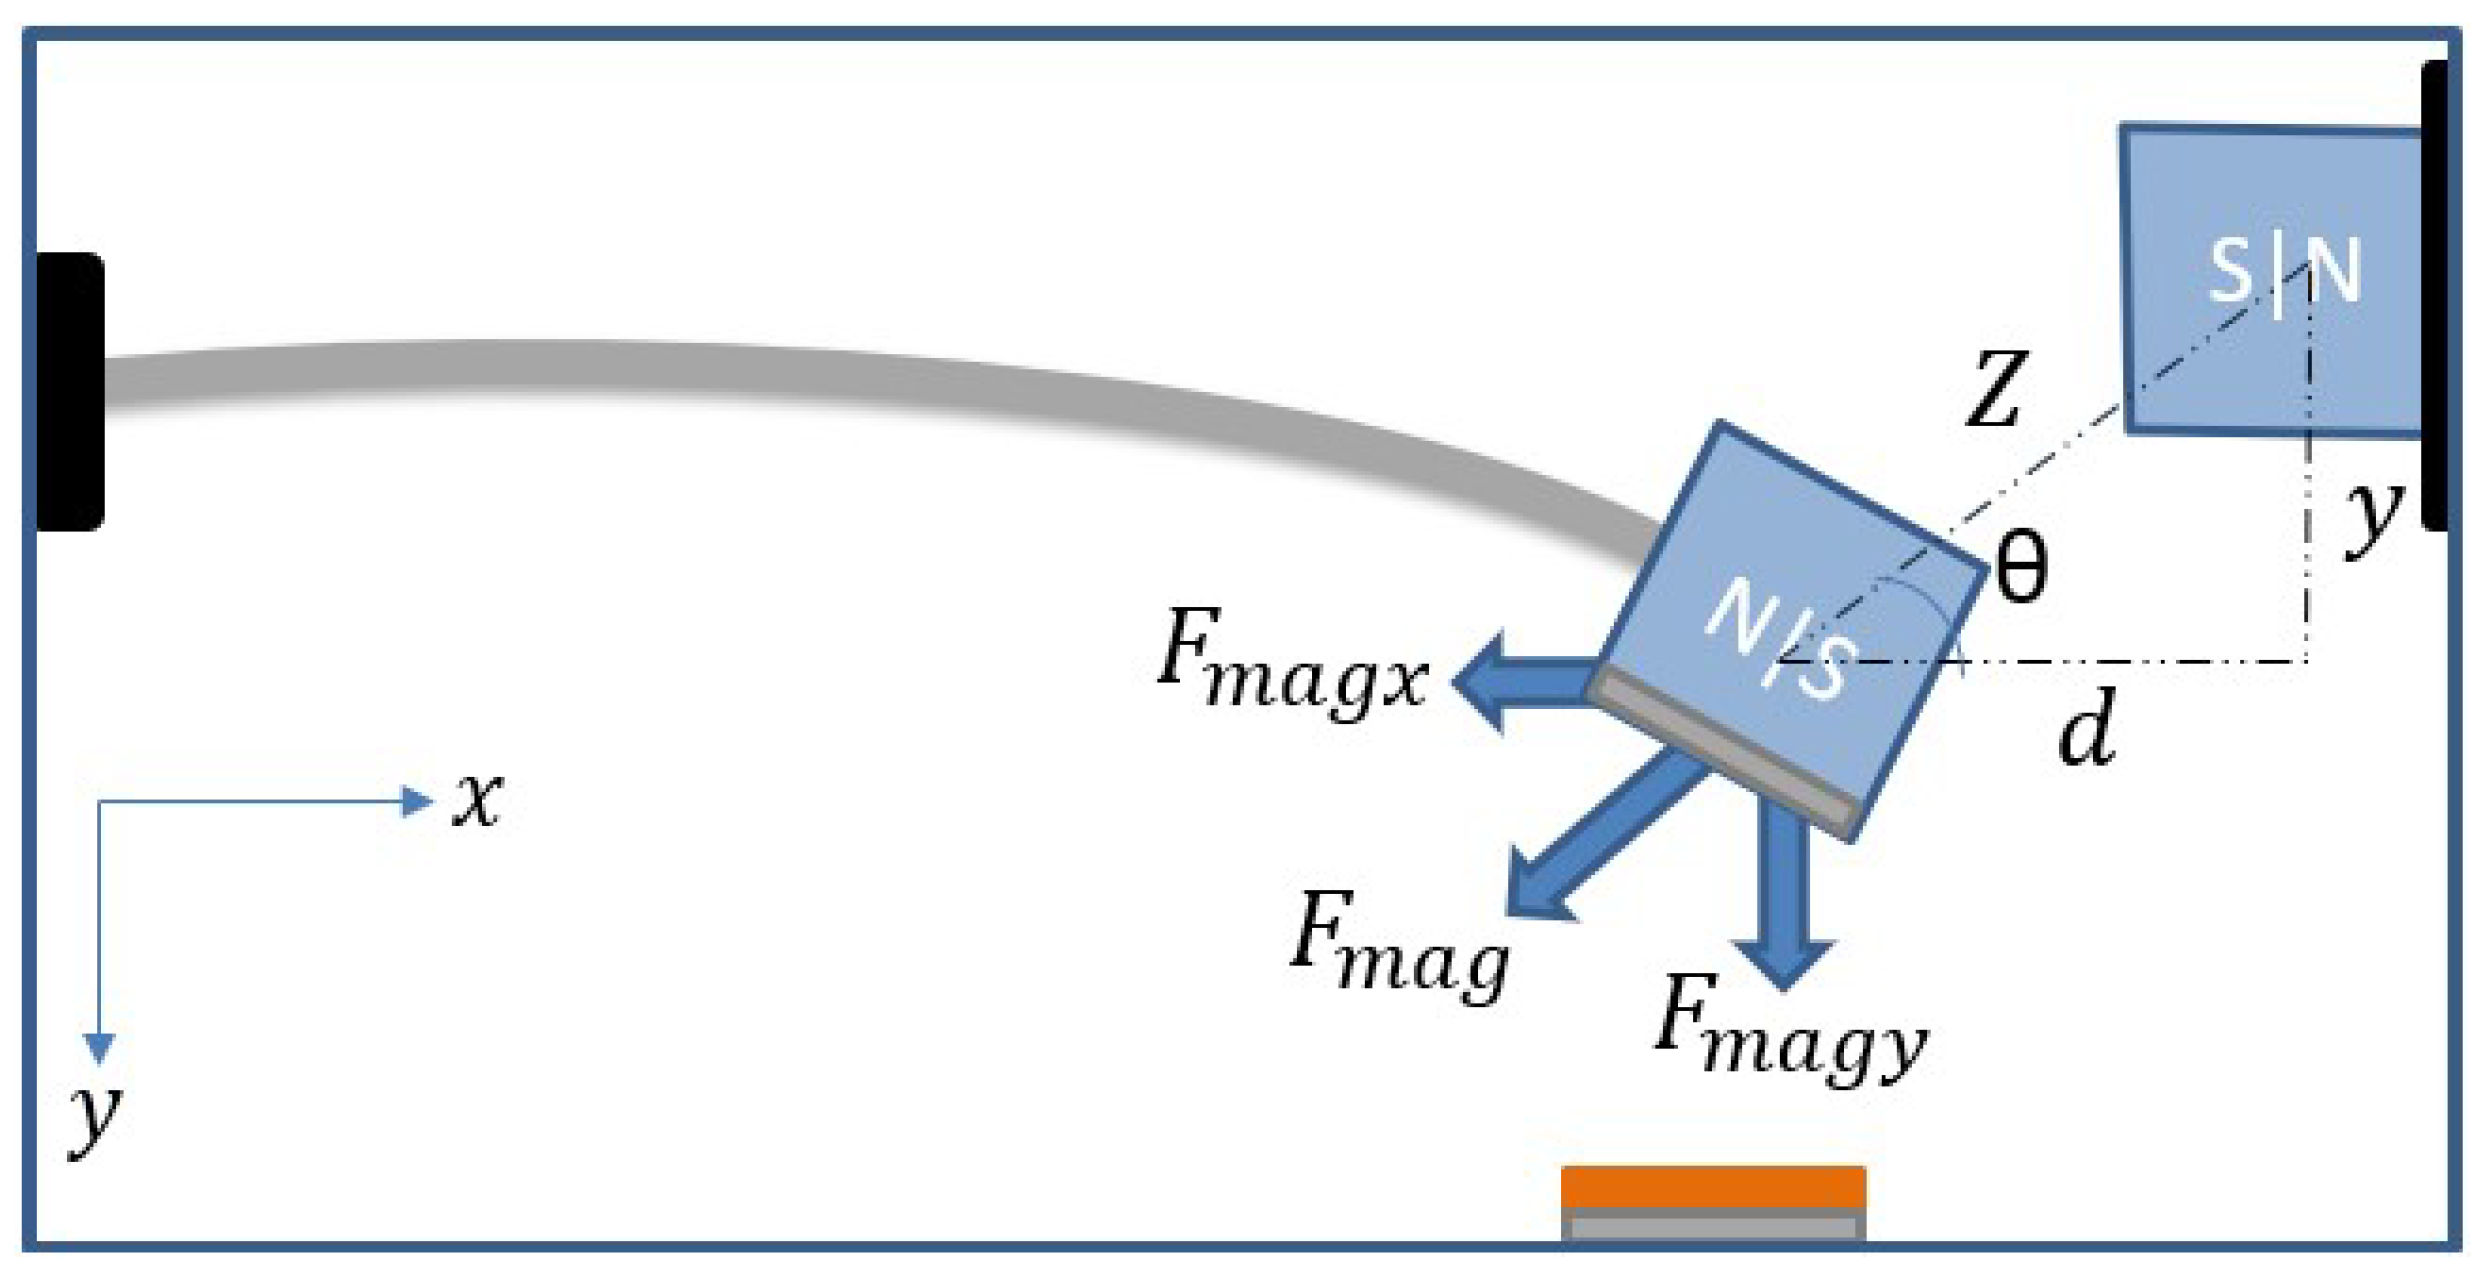
3. Theoretical Model

A lumped parameter model of an SDOF system was used to simulate the static and dynamic behavior and the generated electrical system. When the tip magnet faces another fixed magnet at the same polarity in the vibro-impact energy harvester, a repulsive magnetic force is induced between the two magnets. The total repulsive magnetic force ( F m a g ) is a function of the deflection of the beam, y, and the horizontal distance between the two magnets, d, and can be decomposed into horizontal and vertical components; see Figure 4. For simplicity, the horizontal component ( F m a g x ) is neglected with the assumption that it is equivalent to the longitudinal stiffness of the cantilever beam. However, the vertical component ( F m a g y ) is dominant and affects the transverse deflection of the cantilever beam.
The total magnetic force acting on both magnets is given by Equation (1), where Z is the distance between the two magnets’ centers and is given by ( Z = d 2 + y 2 ). Further, F R is the size of the magnetic dipole moments and given by ( F R = 3 ϵ q 1 q 2 2 π ), where q 1 and q 2 are the magnetic dipole moments for the two magnets. Using the angle θ , the vertical component ( F m a g y ) is given by Equation (2), where μ is the permeability of the space and it equals 4 π × 10 7 m kg/s 2 A 2 .
F m a g = F R Z 4
F m a g y = F R y ( d 2 + y 2 ) 5 / 2
To analyze the static and dynamic characteristics of the nonlinear harvester, we employed a single-degree-of-freedom (SDOF) lumped parameter model, as depicted in Figure 5. The upper electrode of the triboelectric harvester is affixed to the bottom of the lumped mass and separated from the lower fixed electrode, which is attached to the PDMS layer, by an initial gap g i . When subjected to base excitations, the system exhibits two motion scenarios: nonimpact and impact modes. The nonimpact mode takes place when the deflection of the upper electrode is smaller than the initial gap, as shown in Figure 5a. In contrast, if the deflection is equal to or greater than the initial gap, the upper Al electrode comes into contact with the PDMS layer and begins to penetrate it, indicating the impact mode, as demonstrated in Figure 5b. Subsequently, the system becomes stiffer and more damped, which is incorporated by introducing additional impact stiffness k i and impact damping c i to the system.
The theoretical governing equation can be extracted from the free body diagrams for the SDOF shown in Figure 5 with all forces acting on the lower electrode for the nonimpact and impact scenarios. Following the procedure presented in [52], the piecewise governing equations for the nonimpact and impact scenarios were extracted and are shown in Equation (8). The two electrodes of the triboelectric energy harvester serve as a parallel plate capacitor, and the third equation in Equation (8) represents the electrical domain equation responsible for electrical signal generation. The term m is the equivalent mass of the beam, and k e q is the equivalent stiffness of the cantilever beam with the mass of the tip, and is given by k e q = 3 E I L 3 [85]. The electrostatic force of the capacitor is given by F e = q 2 ( t ) 2 ϵ 0 ϵ r S , where q ( t ) is the number of charges carried between two electrodes and can be expressed as [52], S is the entire surface area of contact, ϵ r is the dielectric constant of the PDMS, and ϵ 0 is the vacuum permittivity. The term a ( t ) represents the harmonic base excitation and is equal to a ( t ) = A c o s ( Ω t ) , where A is the amplitude, and Ω is the excitation frequency. Moreover, c i and k i indicate the coefficients of impact damping and stiffening, respectively. In addition, g i is the distance between the upper electrode and the PDMS surface, wherein d 0 represents the distance between the two Al electrodes. The terms σ , T, and R represent the surface charge density, PDMS thickness, and external resistance, respectively. The rest of the parameters used in this study are listed in Table 1. Next, the governing equations can be solved numerically to examine the dynamic behavior of the system and the generated electrical signal.
m y ¨ + c y ˙ + k e q y F m a g y + F e = m a , y ( t ) < g i m y ¨ + c i y ˙ + k e q y + k i ( y ( t ) g i ) F m a g y = m a , y ( t ) g i q ˙ = q ( t ) ϵ 0 R S ( T ϵ r + d 0 y ( t ) ) + σ ϵ 0 R S ( d 0 y ( t ) )

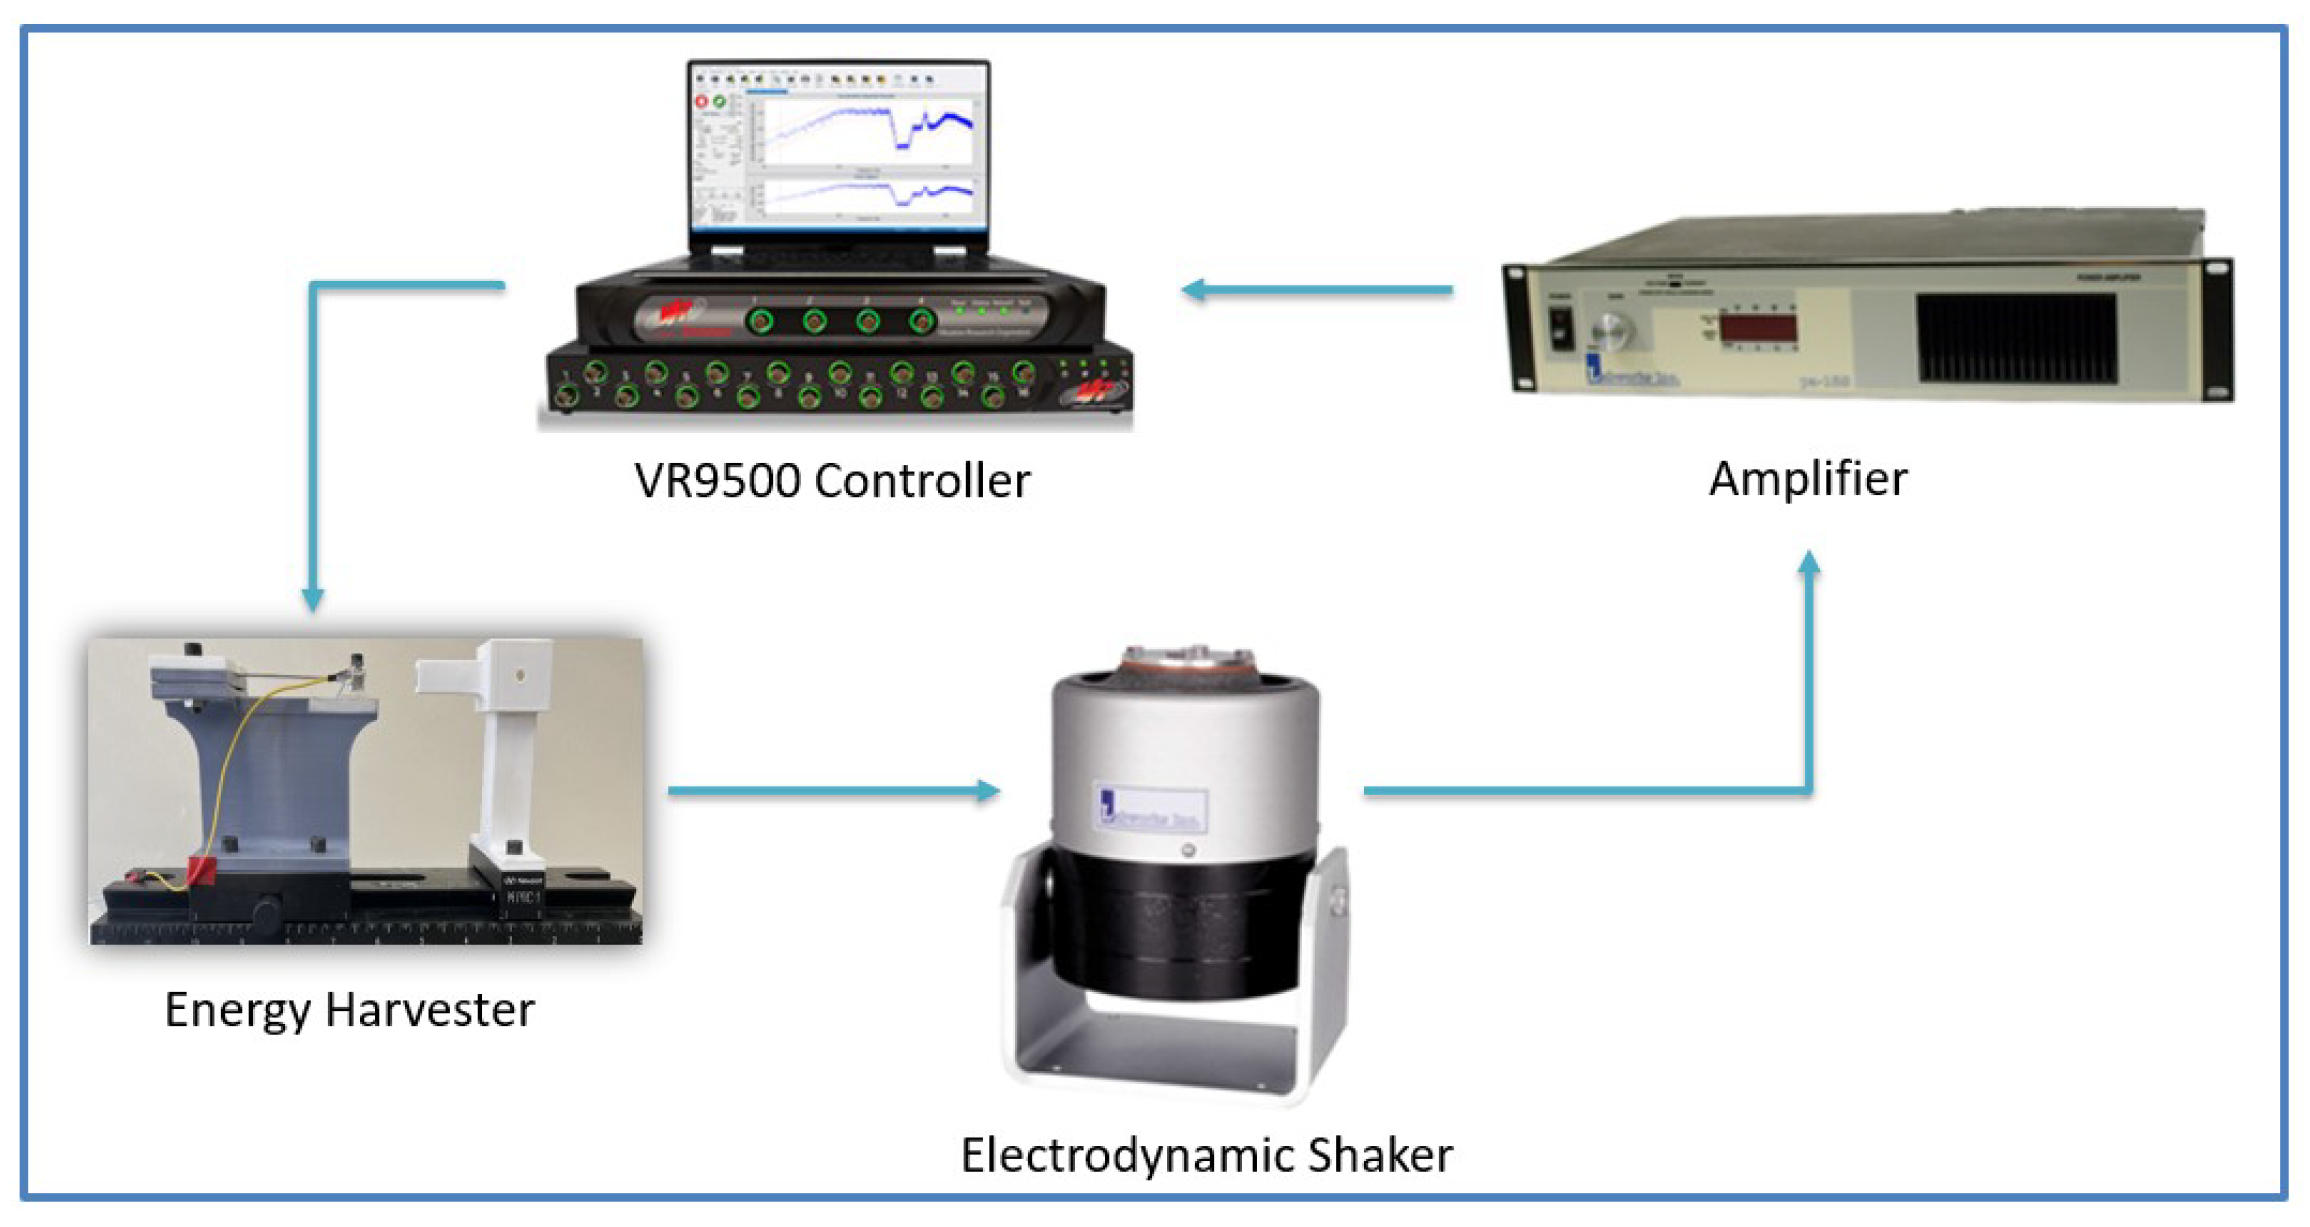
4. Experimental Setup

To validate our theoretical model, the experimental setup shown in Figure 6 was used to test the static and dynamic behaviors of the nonlinear harvester. The arrangement consisted of a V R 9500 controller, an amplifier, and an electrodynamic shaker with a mounted nonlinear energy harvester structure. The control unit regulated the base excitation applied by the shaker to control the amplitude and frequency. The control unit sent the signal to the amplifier for amplification at the required level to be sent to the shaker, which transferred the base excitations to the harvester. An accelerometer was attached to the cantilever beam’s tip mass to record deflections in response to sweeping excitation frequencies. In addition, the voltage generated by the triboelectric generator was measured by the controller.

5. Results and Discussion

In this section, the system is numerically solved and experimentally validated to facilitate further analysis, to identify the crucial elements that lead to a more effective energy harvester, and to examine the potential for energy scavenging in the proposed harvester.

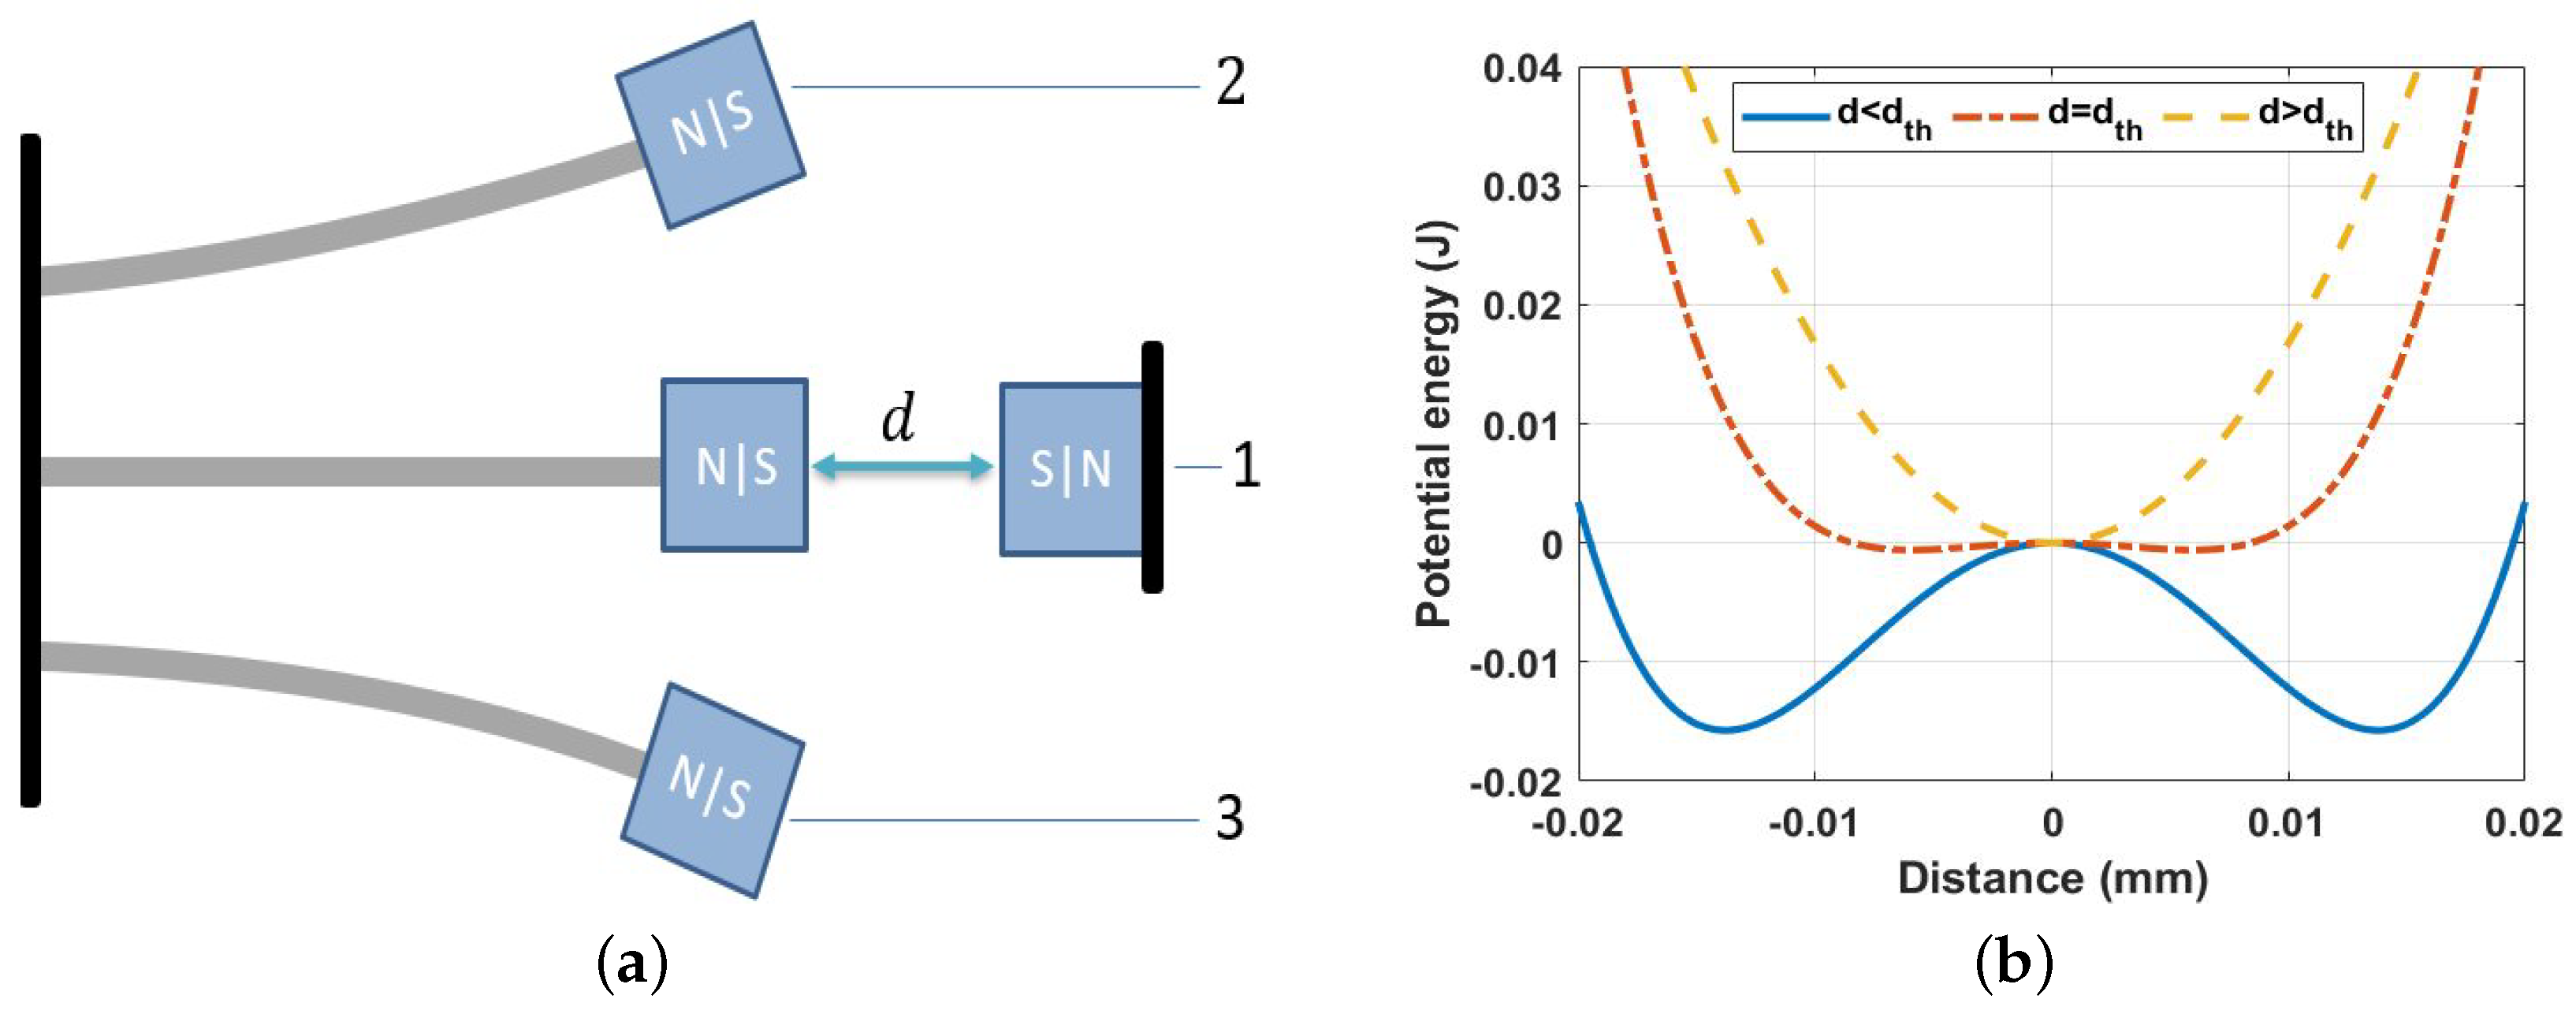
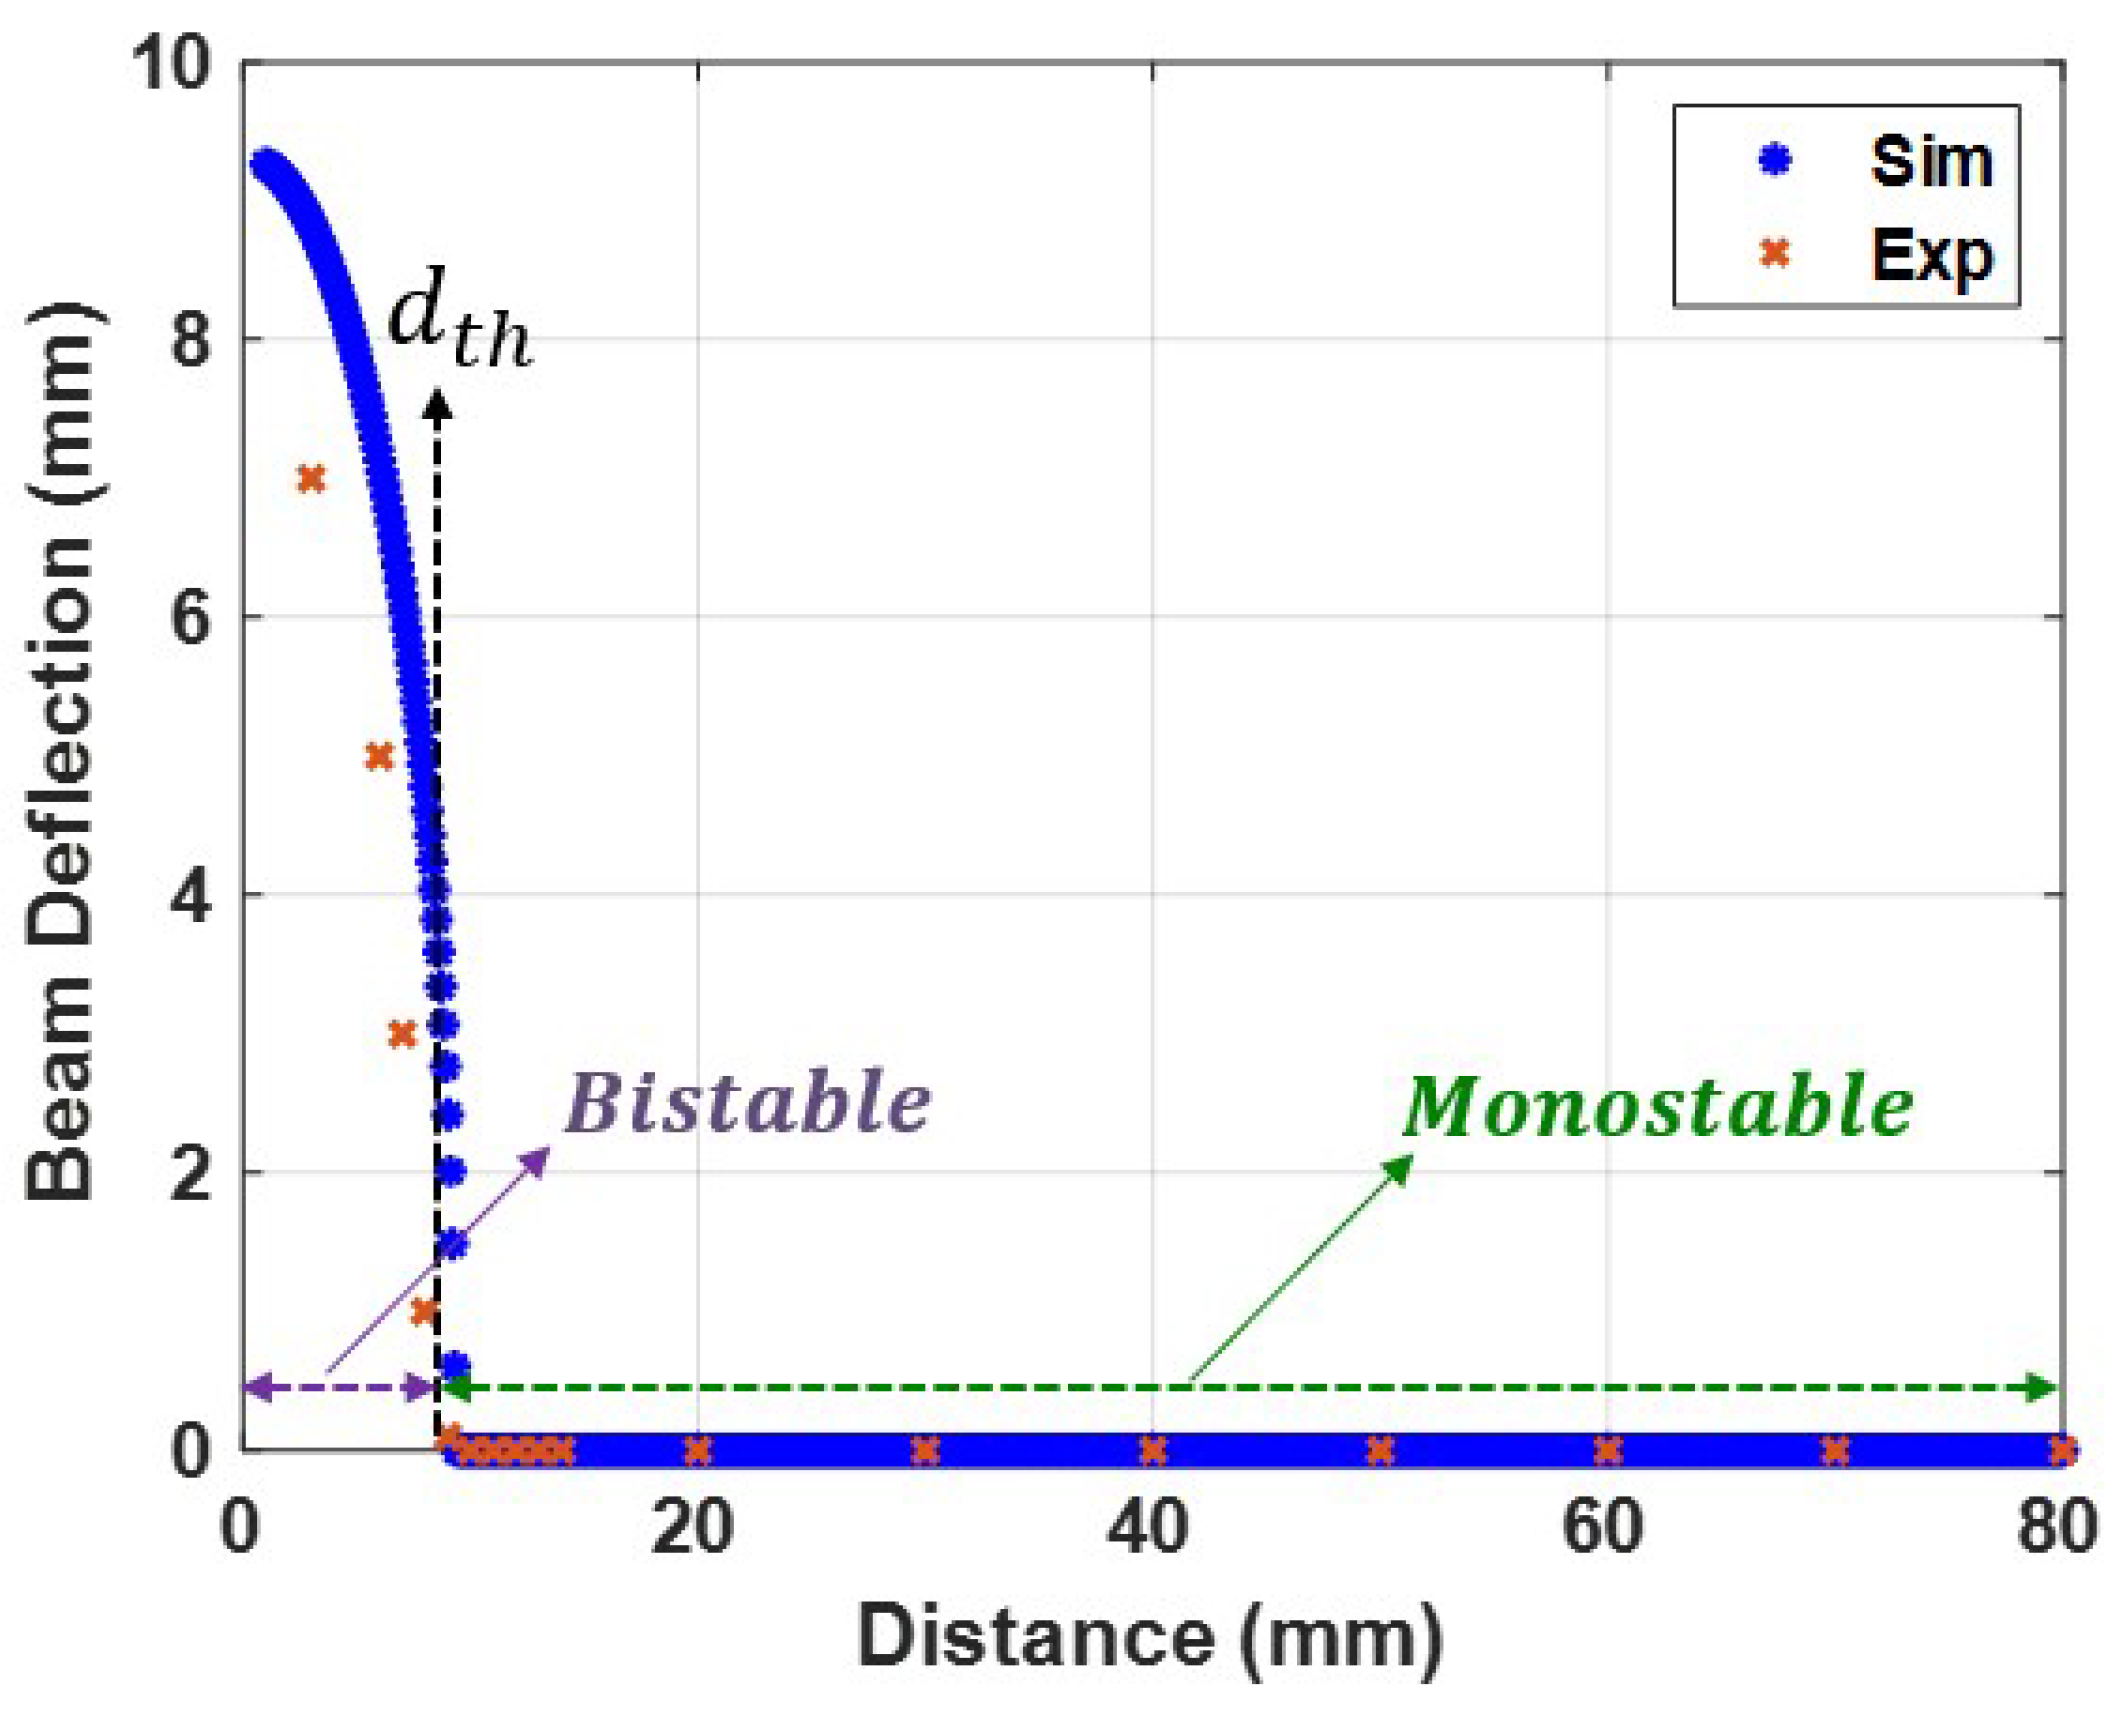
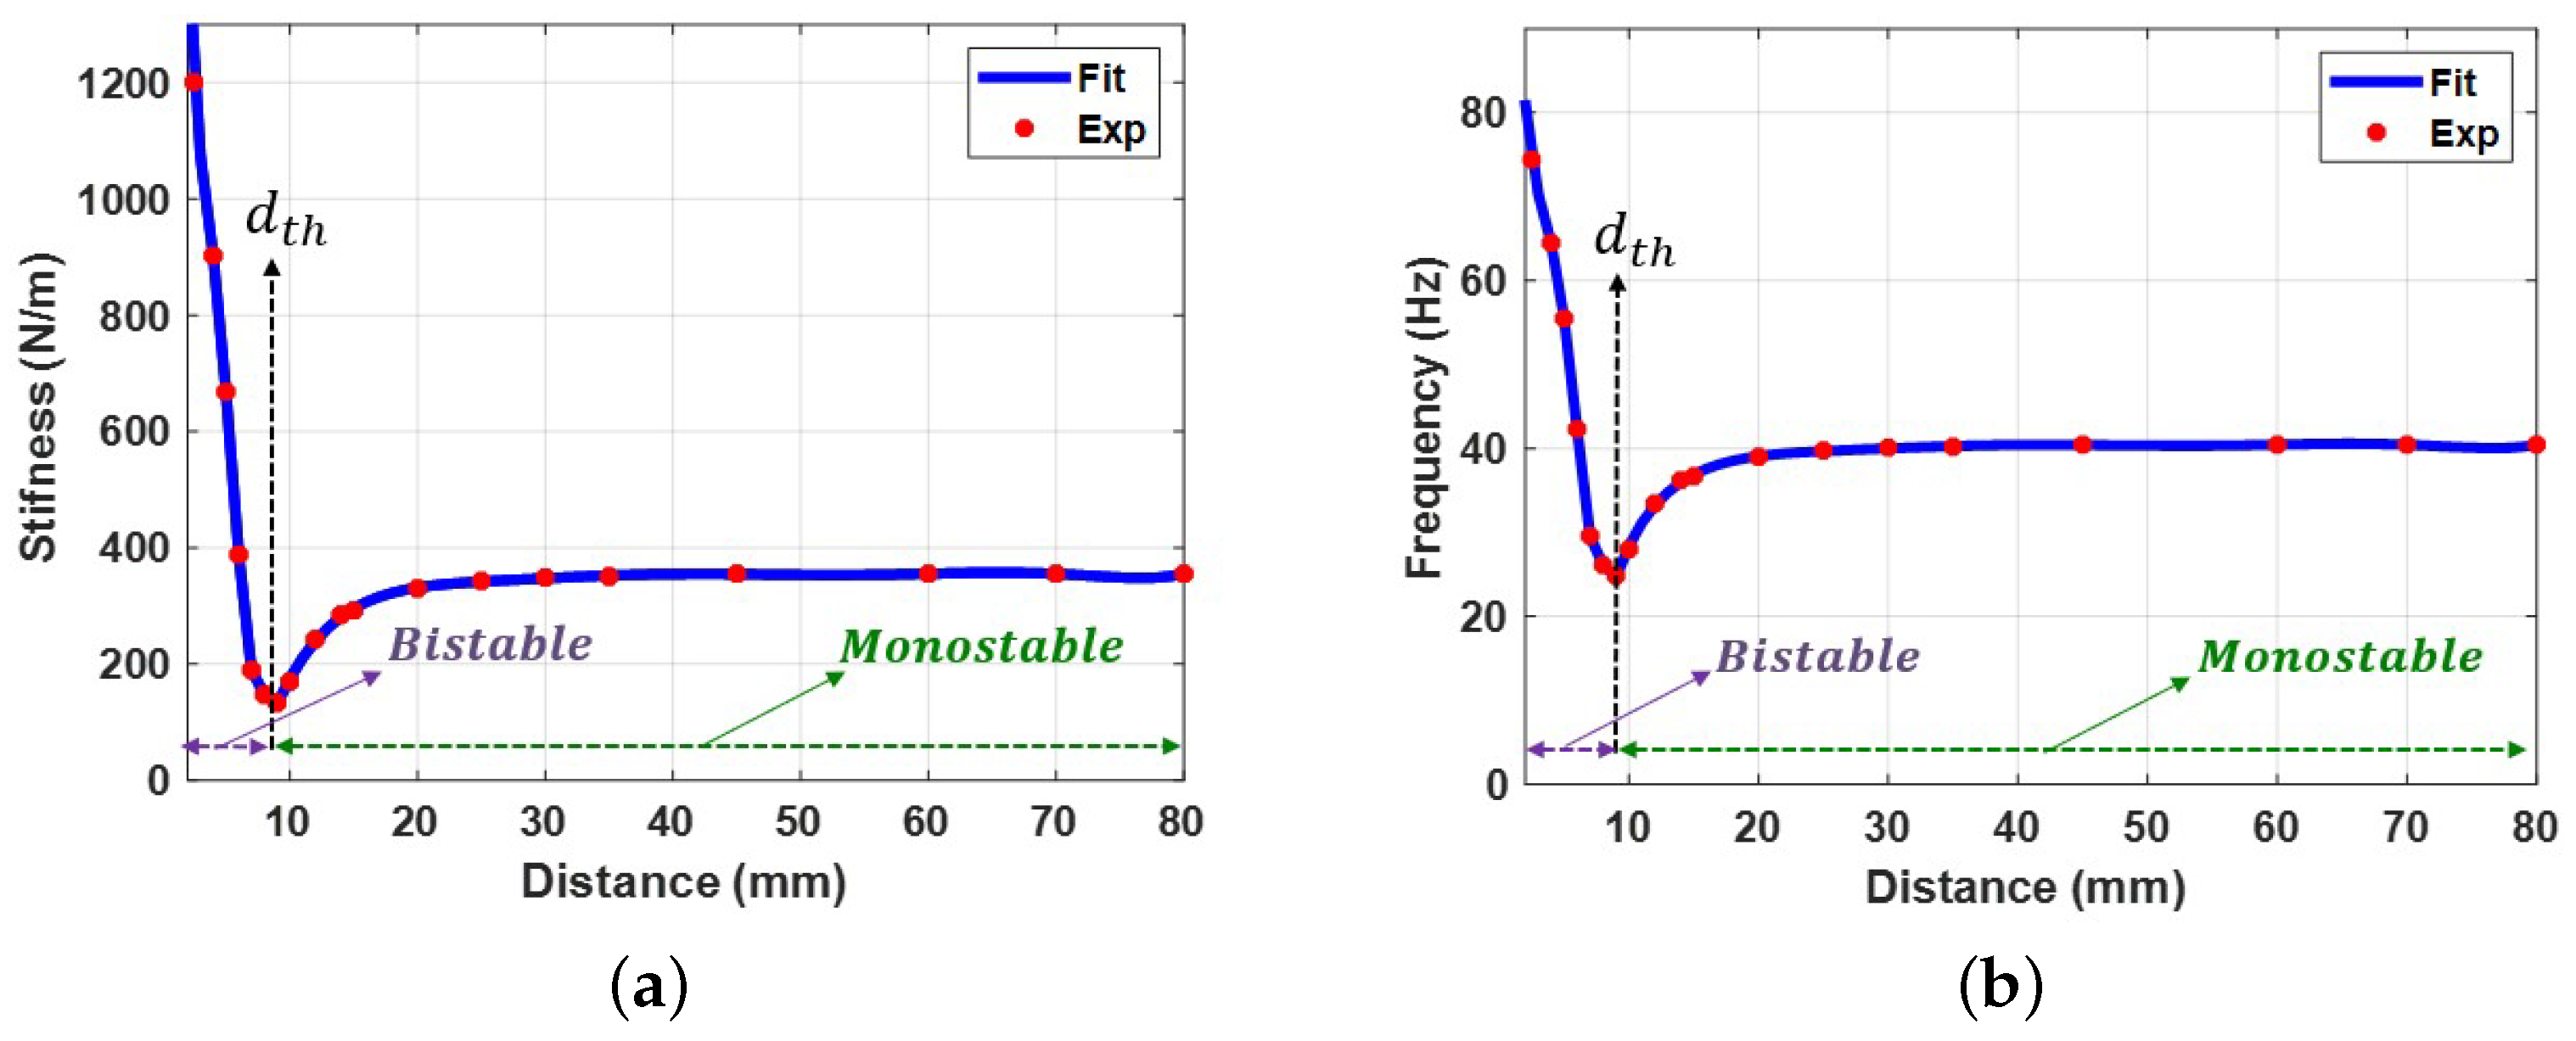
5.1. Static Analysis

The static deflection of the beam is a function of the distance between the two magnets due to the repulsive magnetic force. By setting all the time derivatives to zero in Equation (8), the static governing equation can be given by:
k y s F m a g y s = 0
where
F m a g y s = F R y s ( d 2 + y s 2 ) 5 / 2
where y s represents the static deflection of the cantilever beam, and F m a g y s is the static magnetic force extracted from Equation (2). The static solution for Equation (4) is calculated based on the geometric parameters given in Table 1. The static deflection of the cantilever beam varies with the separation of two magnets, as seen in Figure 7. It is demonstrated conclusively that the static response had a critical threshold separation distance d t h of 9 mm, dividing the static profile into monostable ( d > d t h ) and bistable ( d d t h ) regions. The monostable regime had a single stable branch for the static response, whereas the bistable regime had two stable branches (upper and lower). Due to the symmetry and the restriction from the lower electrode, only one branch of the horizontal beam’s stable solution is presented in Figure 7, where the maximum static deflection of the cantilever beam found to be at the bistable regime was 9.3 mm. Furthermore, the static deflections as a function of the separation distance between the two magnets were measured experimentally, and the results in Figure 7 show a good agreement with the theoretical results.

5.2. Dynamic Analysis

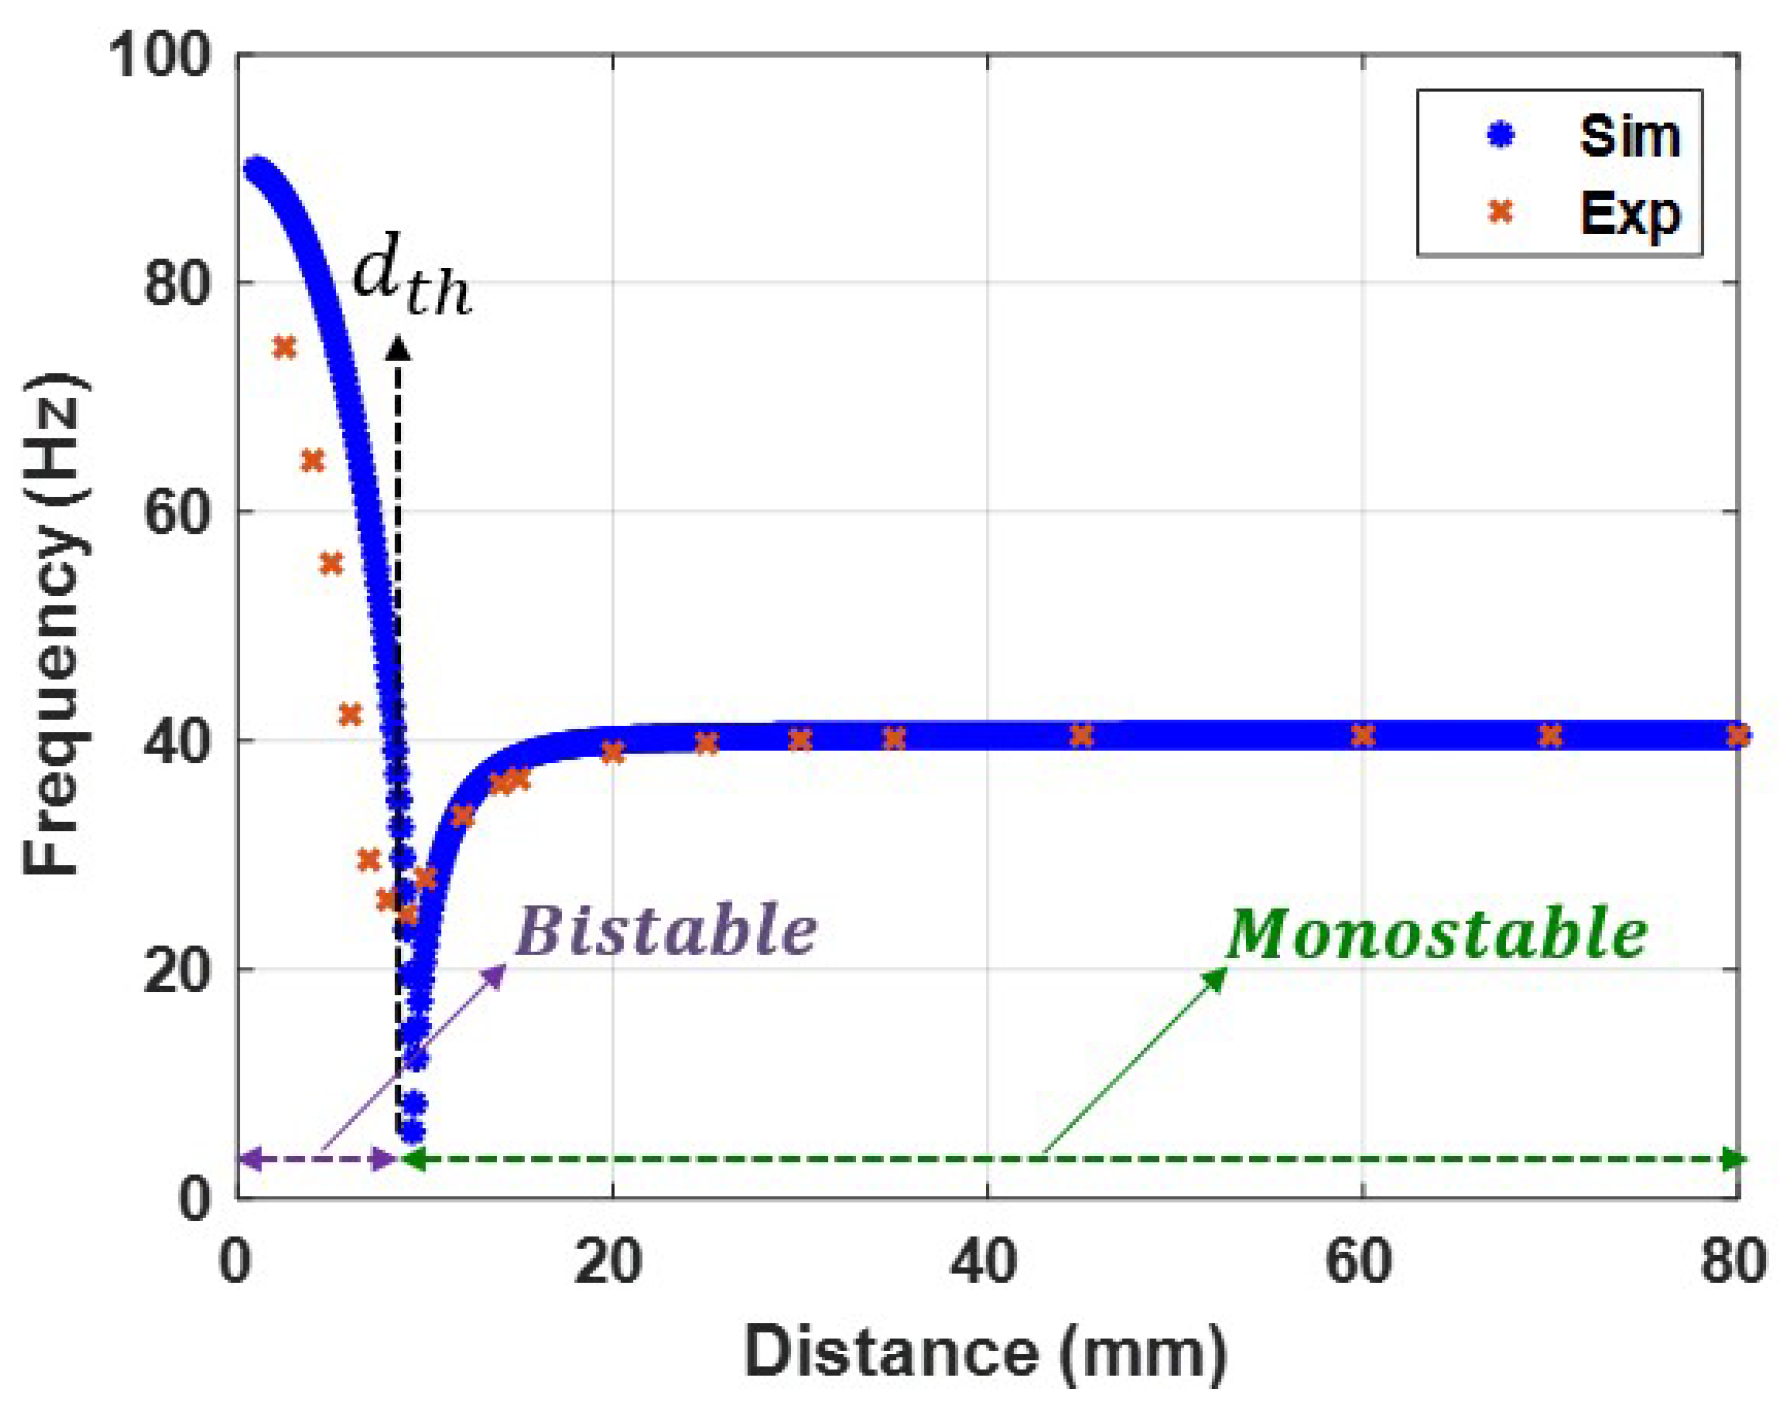
5.2.1. Natural Frequencies

Next, we examine the effect of the magnetic force on the harvester’s natural frequency. Herein, the total deflection of the beam is taken to be a function of the static and dynamic deflections as ( y = y s + y u ), where y u is the dynamic deflection of the beam. By substituting this in Equation (3), we arrive at the following system of equations:
m y u ¨ + c y u ˙ + k e q y u + k e q y s F m a g y u s + F e = m a , y u ( t ) < g i m y u ¨ + c i y u ˙ + k e q y u + k e q y s + k i ( y u ( t ) + y s g i ) F m a g y u s = m a , y u ( t ) g i q ˙ = q ( t ) ϵ 0 R S ( T ϵ r + d 0 y u ( t ) y s ) + σ ϵ 0 R S ( d 0 y u ( t ) y s )
where F m a g y u s is given by:
F m a g y u s = F R ( y u + y s ) ( d 2 + ( y u + y s ) 2 ) 5 / 2
m y ¨ + c y ˙ + k e q y F m a g y + F e = m a ( t ) , y ( t ) < g i m y ¨ + c i y ˙ + k e q y + k i ( y ( t ) g i ) F m a g y = m a ( t ) , y ( t ) g i q ˙ = q ( t ) ϵ 0 R S T ϵ r + d 0 y ( t ) + σ ϵ 0 R S d 0 y ( t )
To eliminate the static effect and avoid the system’s complexity while obtaining the numerical solution, the magnetic force, F m a g y u s , is expanded with Taylor’s series around zero dynamic deflection y u = 0 as follows:
F m a g y u s = F R y s ( d 2 + y s 2 ) 5 / 2 + α 1 y u + α 2 y u 2 + α 3 y u 3 + = F m a g y s + α 1 y u + F m a g y u
where F m a g y u is the dynamic portion of the expanded magnetic force omitting the linear term, and α i represents the coefficient components of the magnetic force after Taylor series expansion. The first nine terms are listed in Appendix A (Equation A1). The final form of the dynamic governing equation is obtained by substituting Equation (9) into Equation (6) and then canceling the static terms using Equation (4). This results in the following:
m y ¨ u + c y ˙ u + ( k e q α 1 ) y u F m a g y u + F e = m a , y u ( t ) < g i m y ¨ u + c i y ˙ u + ( k e q α 1 ) y u + k i ( y u ( t ) + y s g i ) F m a g y u = m a , y u ( t ) g i q ˙ = q ( t ) ϵ 0 R S ( T ϵ r + d 0 y u ( t ) y s ) + σ ϵ 0 R S ( d 0 y u ( t ) y s )
According to Equation (10), the natural frequency of the nonlinear resonator under the effect of the magnetic force is calculated as:
f n = 1 2 π k e q α 1 m
where α 1 is the linear coefficient of the dynamic magnetic force after the Taylor series expansion of Equation (7) around y = 0 , and given by:
α 1 = F R ( d 2 4 y s 2 ) ( d 2 + y s 2 ) 7 / 2
It is possible to determine the relationship between the natural frequency and the magnetic force by varying the distance between the two magnets and calculating the natural frequency value using Equation (11). The natural frequency variation with the separation distance between the two magnets is shown in Figure 8. The results show that the bistable and monostable zones were separated by a threshold distance of 9 mm, which is consistent with the static results presented in Figure 7. The system was in the bistable region at low separation distances, where the magnetic force exerted the most substantial effect. In this zone, the natural frequency reached a higher frequency than the linear natural frequency and reached a maximum value of 90 Hz. The natural frequency was gradually decreased by increasing the distance between the two magnets until it reached its minimum value at the threshold distance. Moreover, the system was tested experimentally at a 0.1 g excitation level, and the experimental variance of the natural frequencies with separation distance was obtained and is presented in Figure 8. The experimental and simulated findings are in good agreement in the monostable range but not in perfect agreement in the transition and bistable ranges. The reason behind this difference could be the low accuracy of the SDOF model at high nonlinearities. Another reason could be the experimental measurement errors. This slight difference between the experimental and simulated values of the natural frequencies would cause significant mismatch problems later when investigating the dynamic behavior of the harvester when we tried to validate our theoretical results. Therefore, this difference needed to be eliminated. To this end, the experimental results for the variation of the natural frequencies were used to extract the experimental stiffness values shown in Figure 9a. Then, a piecewise curve fit function for the stiffness as a function of the separation distance between the two magnets was extracted and is shown in Equation (13). The piecewise stiffness function was then used to calculate the natural frequencies, which greatly agree with experimental results, as shown in Figure 9b. Furthermore, the piecewise stiffness function is used in the further analysis of the dynamic behavior of the harvester.
k = 5956.75 4954.35 d + 2004.2 d 2 398 d 3 + 37.16 d 4 1.31 d 5 if d < d t h 937.71 + 224.567 d 16.7 d 2 + 0.67 d 3 0.01565 d 4 + 0.000212 d 5 1.5343 × 10 6 d 6 + 4.61 × 10 9 d 7 if d d t h

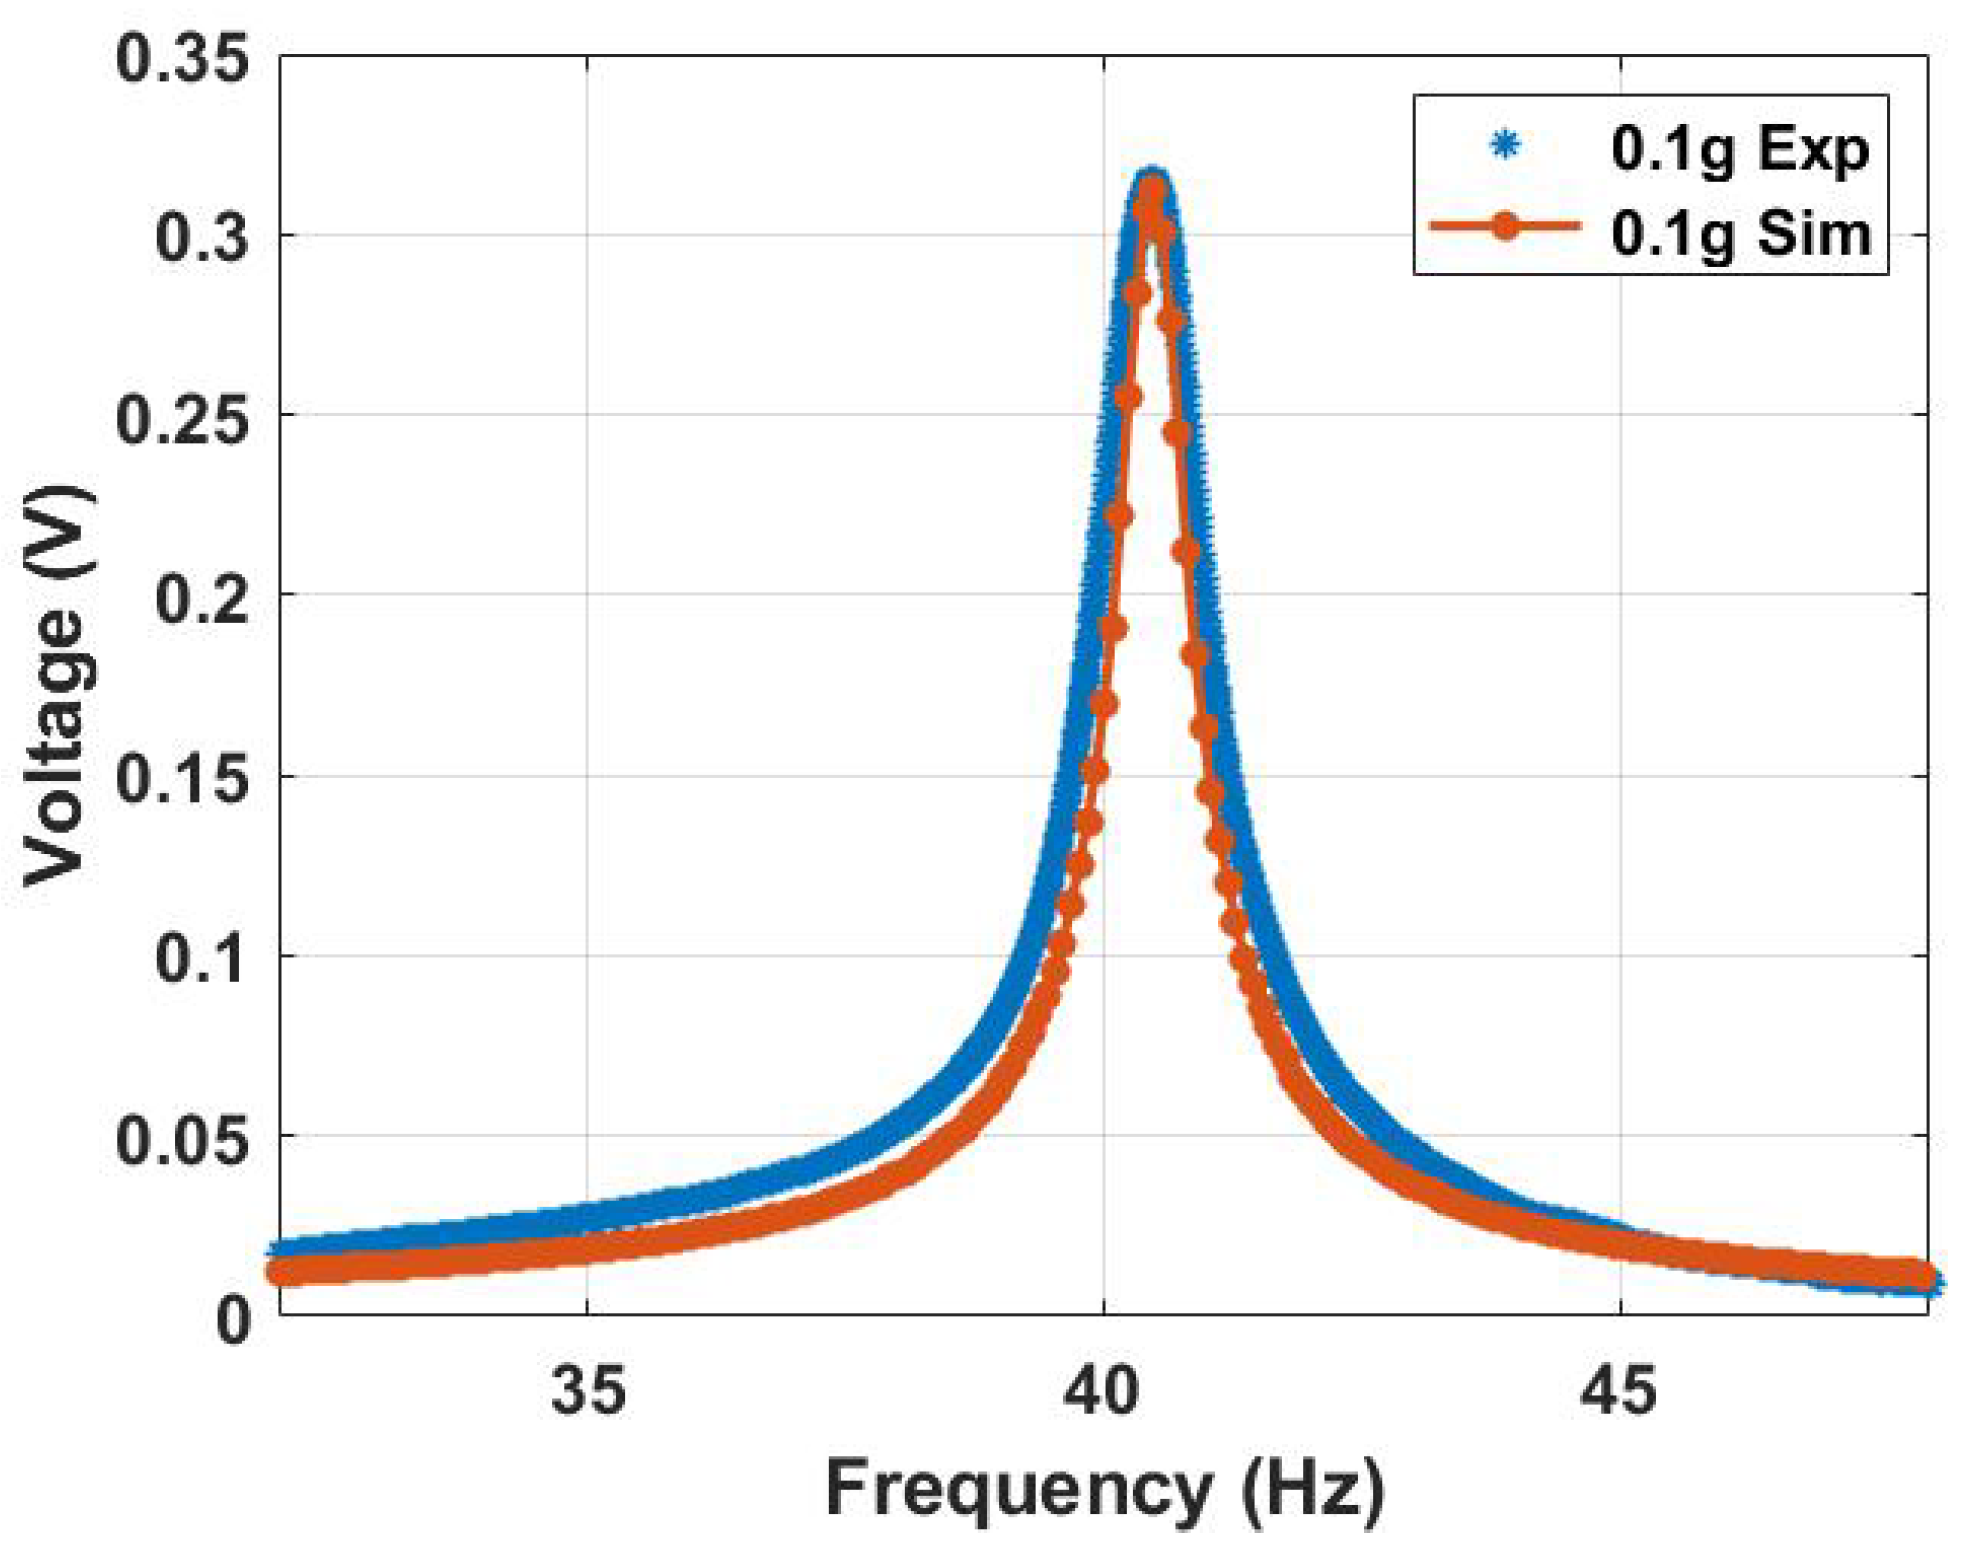
5.2.2. Linear and Conventional Harvester Analysis

Eliminating the influence of magnetic nonlinearity by setting F m a g y u equal to zero allowed for the investigation of the linear harvester behavior and the conventional vibro-impact harvester. First, the linear harvester was investigated by exciting the system at a low excitation level of 0.1 g, which was insufficient to introduce impact between the harvester’s electrodes. The linear frequency voltage curve is shown in Figure 10. The theoretical and experimental results are in good agreement. They show that the natural frequency of the harvester had a natural frequency of approximately 40.4 Hz.
Second, the system was excited with higher excitation levels to investigate the behavior of the conventional vibro-impact harvester. The experimental voltage frequency curves at different excitation levels are shown in Figure 11a. The results show an increment in the output voltage with increasing the excitation level, reaching a maximum value of 2.2 V at an excitation level of 0.9 g. Furthermore, the results in Figure 11a depict a significant increase in the bandwidth due to the impact between the harvester’s electrodes starting at the 0.5 g excitation level and increasing significantly at higher excitation levels. In addition, the results in Figure 11a show a softening behavior at low excitation levels (≤0.3 g), where the system’s natural frequency was shifting to lower values to the left, while at higher excitation levels (≥0.3 g), the frequency tended to be shifted to a higher value to the right, indicating hardening behavior. The combination of both behaviors is known as combined behavior [55]. The experimental results and how they match with the simulated results for each excitation level separately are shown in Figure 11b,c, where the theoretical and experimental findings are in good agreement for all cases.

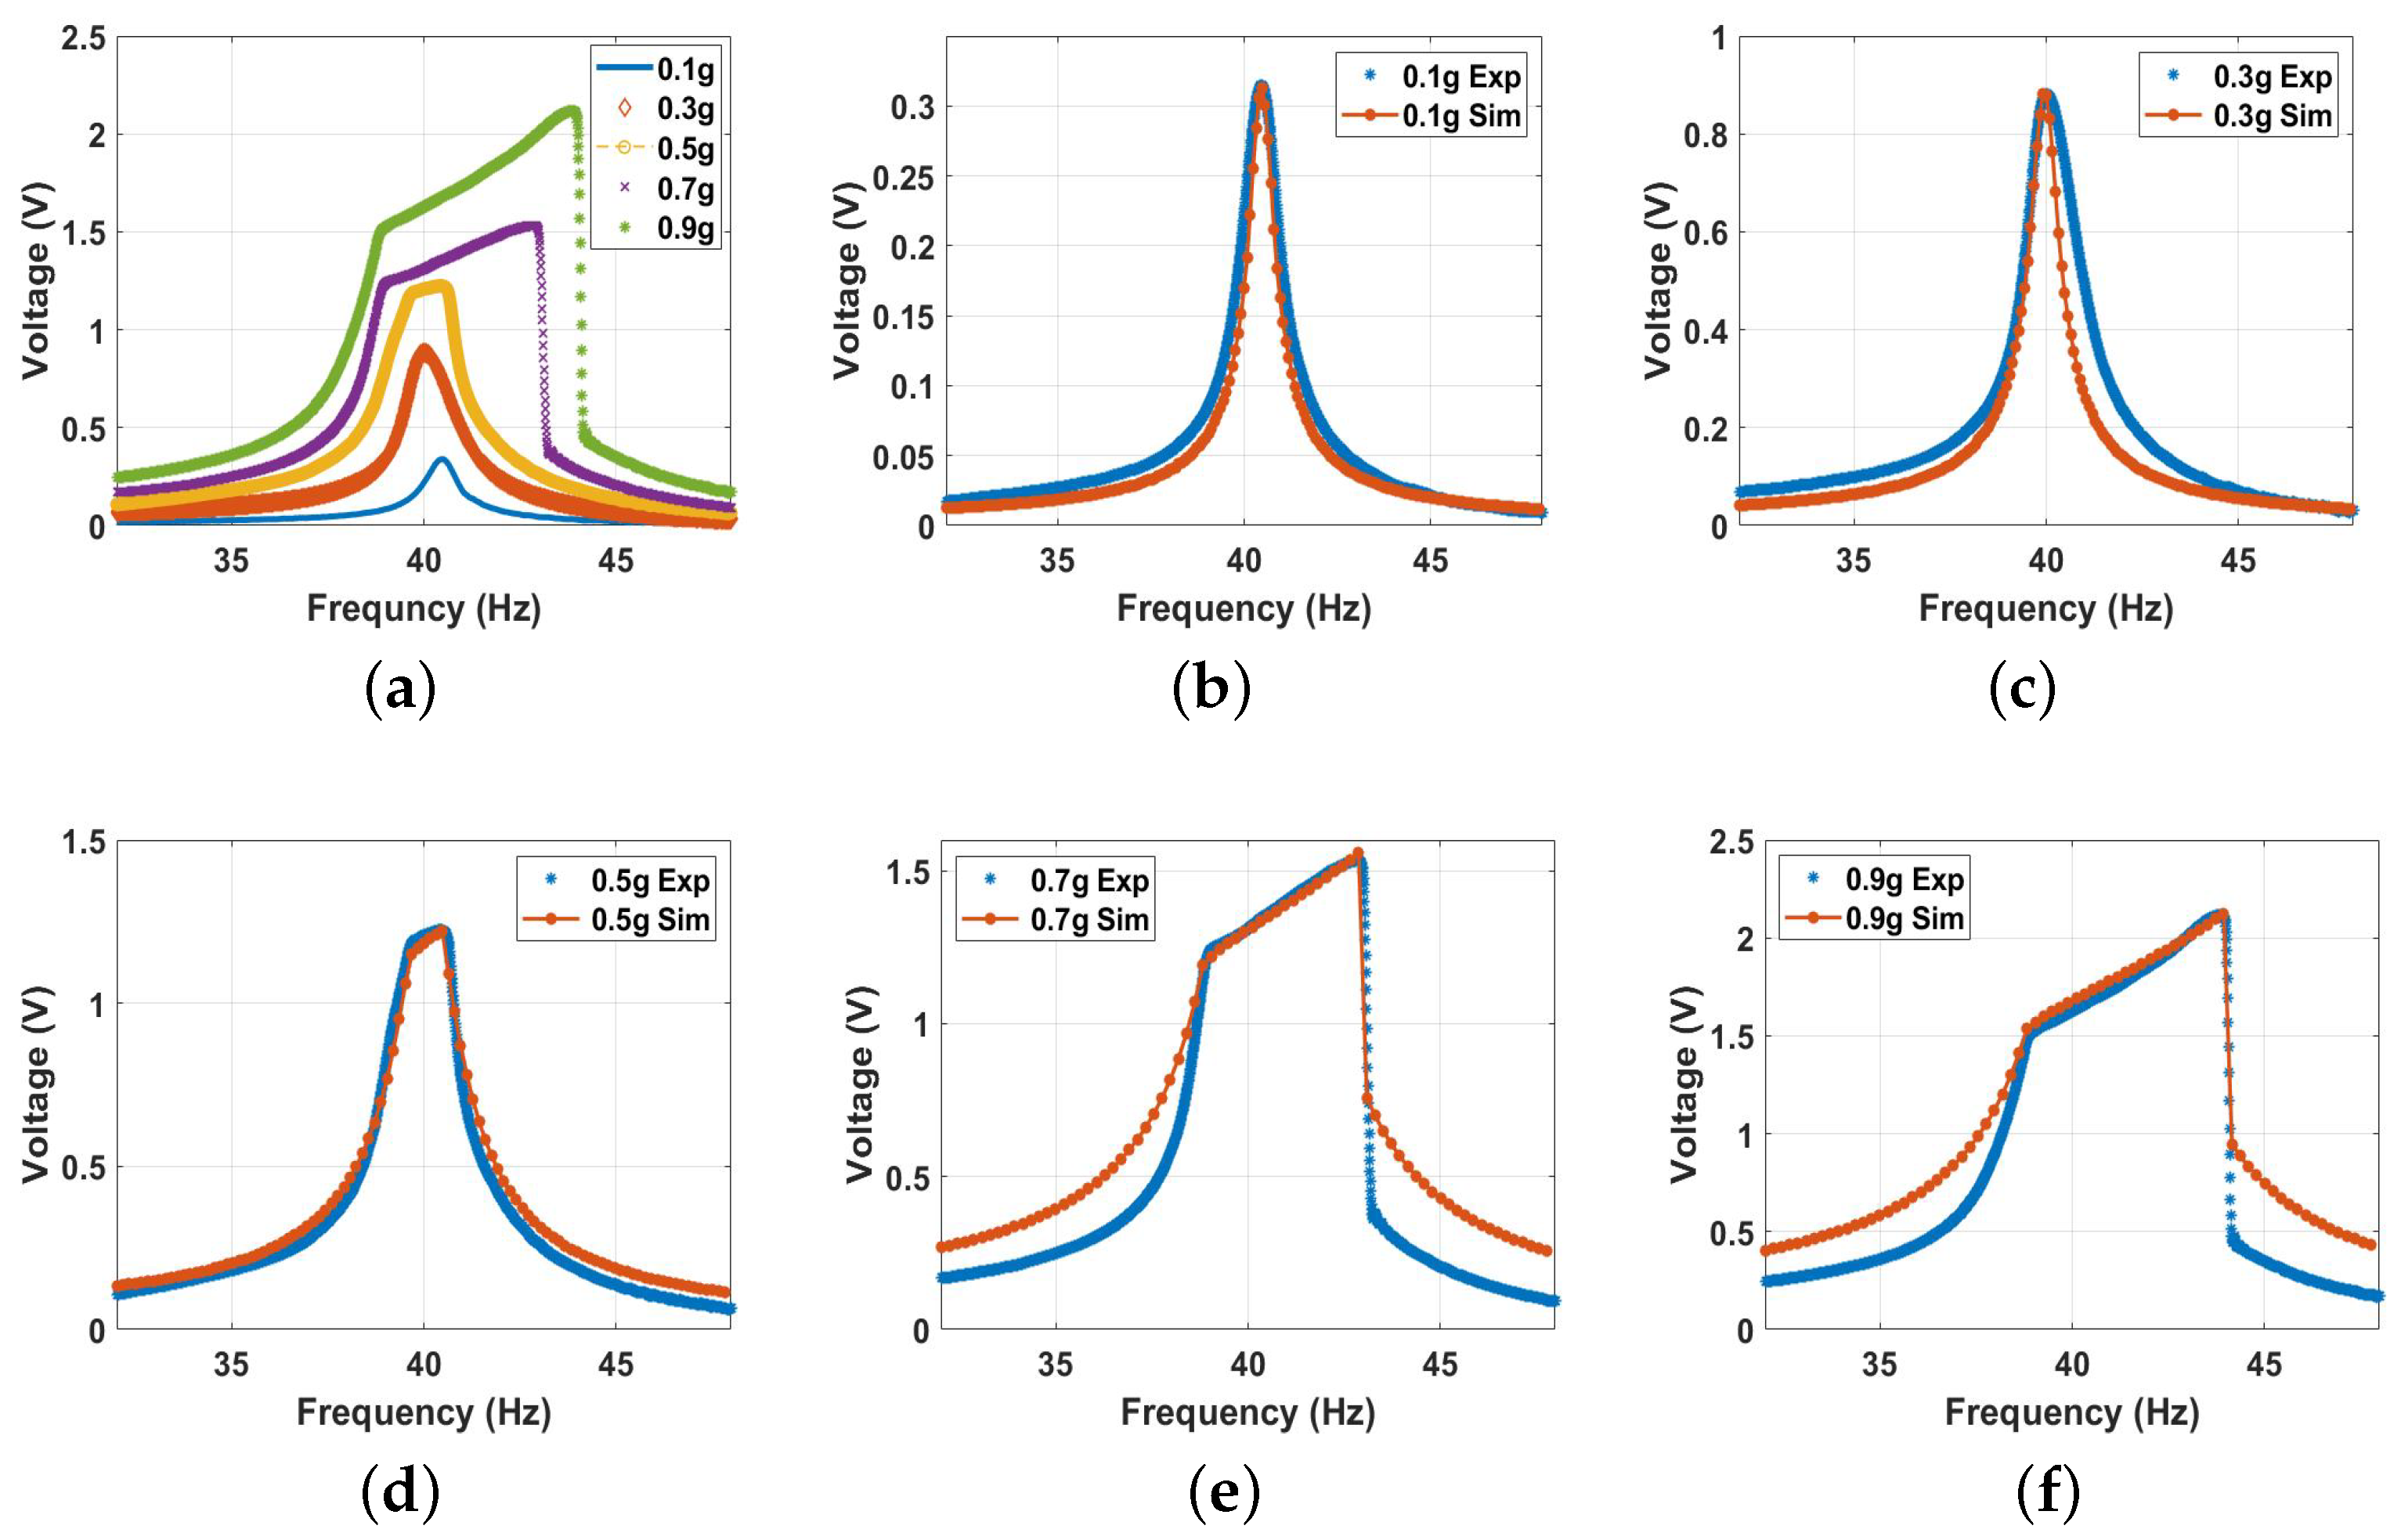
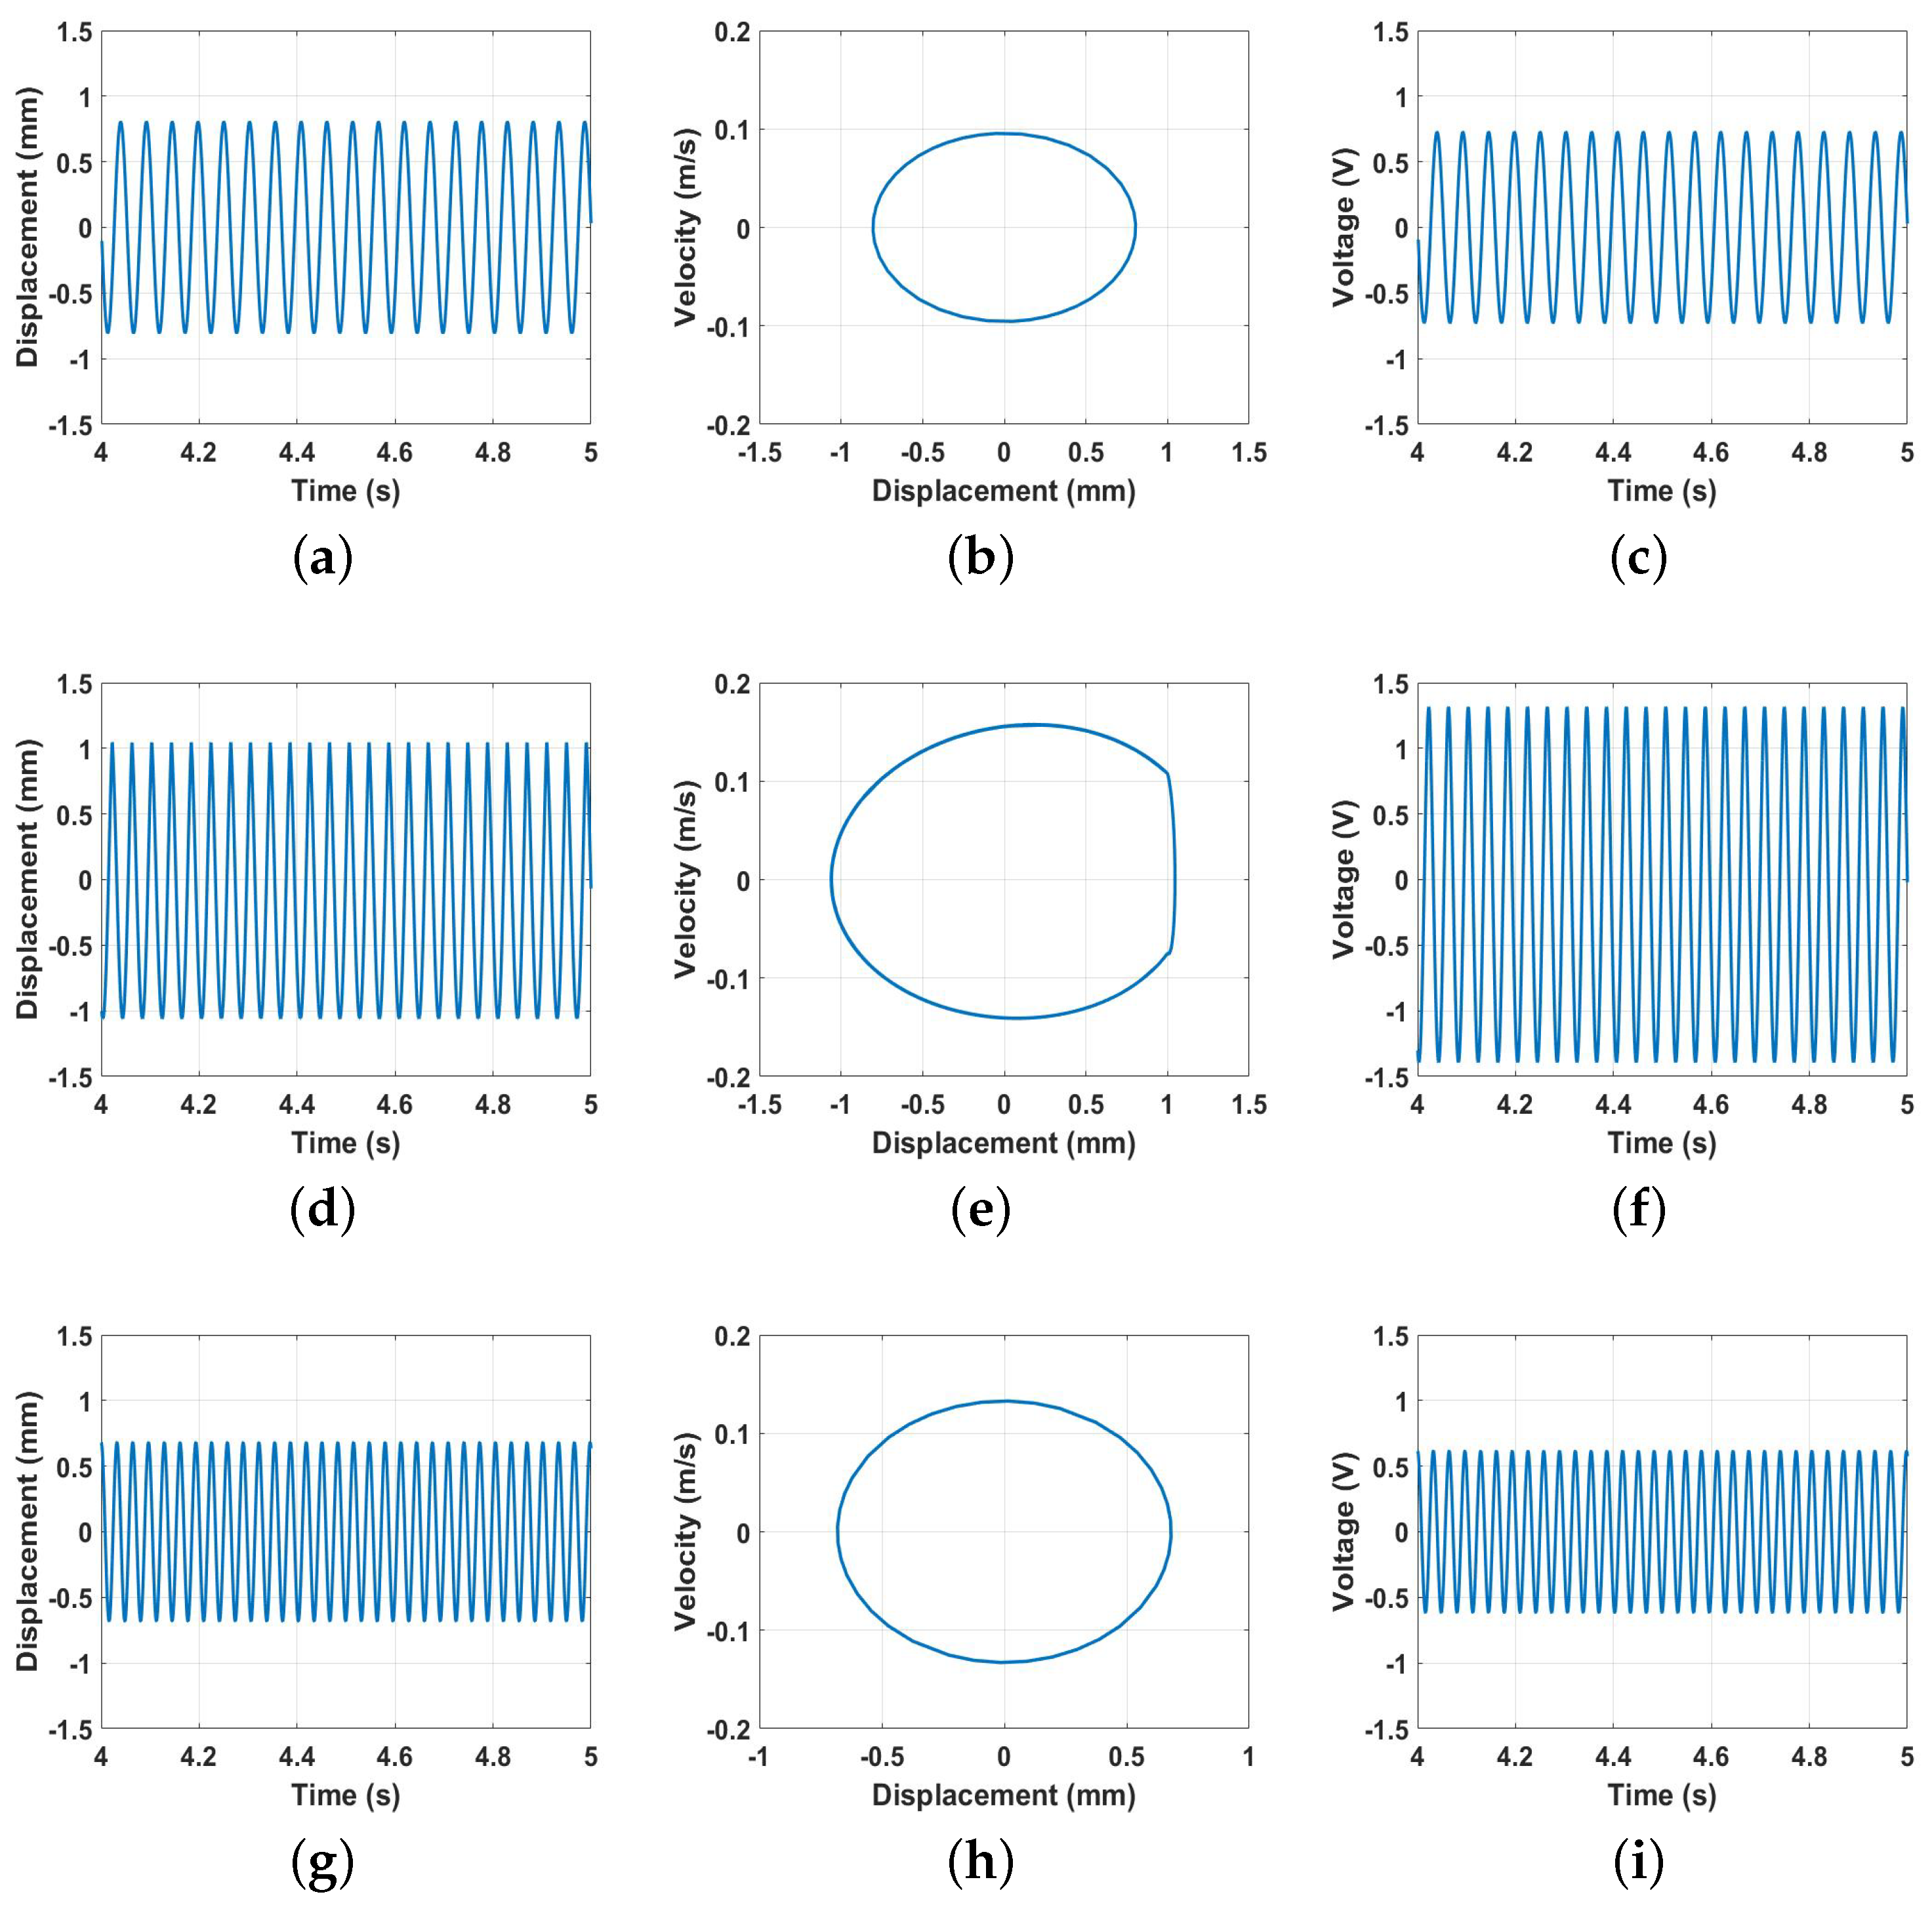
5.2.3. Nonlinear Analysis

In this section, we investigate the dynamics of the energy harvester under the influence of the magnetic force in the monostable, bistable, and transition zones. The distance between the two magnets was selected to achieve the required range, while the voltage responses was analyzed at various excitation levels. The experimental results at different magnetic spacing are shown in Figure 12. First, we investigated the dynamics of the energy harvester in the monostable zone starting with a separation distance of 30 mm. The experimental voltage frequency curves with the corresponding simulated results for different excitation levels are shown in Figure 13 and show good agreement. Comparing the results at 30 mm (Figure 13) with the previous results under no magnetic effect (Figure 11), we notice that the results are quite close to each other. This is because the two magnets were far from each other at this distance, and the magnetic force was feeble, so its effect was almost neglected. It should also be noted that greater excitation levels resulted in a higher output voltage and bandwidth. Moreover, the combined behavior is shown in the results with softening behavior being dominant at low excitation levels. In contrast, the hardening behavior was dominant at higher excitation levels.
Next, we set the distance between the two magnets to 20 mm to investigate the dynamic behavior in the monostable range, but at a stronger magnetic force influence. The results in Figure 14 show the frequency voltage curves extracted experimentally and matched with the simulations from the theoretical model. They are in good agreement. According to the results shown in Figure 14, several things can be observed. First, the natural frequency was shifted to the left to reach a lower value of 38.7 Hz compared to the conventional and 30 mm frequencies. This shift was due to the effect of the higher magnetic nonlinearity at this distance compared to the previous cases. This led to the beam having a lower natural frequency according to the results presented in Figure 9b. Second, larger bandwidth was achieved by increasing the excitation level, where the impact between the harvester became more significant, with a wider range of frequencies compared to the low excitation levels. In addition, in the 20 mm case, the bandwidth was slightly larger than the conventional and 30 mm bandwidth. This slight difference was because, even though the magnetic force was stronger than those in the previous cases, it was still considered feeble. Third, the output voltage increased with the excitation level, which can also be related to the higher impact between the harvester electrodes at higher excitations. However, the output voltage at this distance was less than the conventional and 30 mm output voltage.
By lowering the separation distance between the two magnets more, particularly to 12 mm, the system entered the transition range from the monostable side. The frequency voltage curves for a 12 mm distance at different excitations from both the experimental and simulations are shown in Figure 15 with a good agreement. The results show a shift in the natural frequency to a lower value of 33.5 Hz, indicating softening behavior. Moreover, a higher bandwidth was achieved even at lower excitations, where the impact between the harvester’s layers started at 0.3 g compared to 0.5 g in all the previous cases and increased significantly at higher excitation levels. A maximum bandwidth of 7.5 Hz was achieved at 0.9 g compared to 5.0 Hz in the previous cases at the same excitation level, which was equivalent to a 50% increment. This increment in the bandwidth at a low excitation was due to the effect of the magnetic force, which started to be stronger and more significant at a lower distance. In addition, the output voltage increased significantly by 44.3% with the increasing excitation level to reach a maximum value of 3.2 V compared to a maximum output voltage of 2.2 V from the conventional harvester at the same excitation level. Furthermore, hardening behavior started to appear by increasing the excitation level, which indicates the dominance of the positive cubic nonlinearity from the magnetic force, shifting the whole behavior to the right.
Lowering the separation distance to 10.0 mm resulted in lowering the natural frequency to a lower value, and the softening behavior became more significant. In addition, a wider bandwidth was achieved compared to the previous cases, as shown in Figure 16. However, the voltage amplitude exhibited a reduction compared to the 12 mm case, which could be due to the effect of the static magnetic force reducing the gap between the two electrodes, resulting in a broader bandwidth, and, at the same time, restricting the beam from oscillating freely.
By further decreasing the distance to reach the threshold at d t h , the bandwidth increased even more than all the previous cases at the same excitation levels, as shown in Figure 17. However, this increment in the bandwidth was at the cost of the voltage output since it dropped to a maximum value of 2.4 V at 0.9 g. The drop in the voltage out was expected because the natural frequency reached the lowest value of 24.8 Hz, which matches the results in Figure 9b. This drop in the natural frequency to a lower value indicates softening behavior compared to the linear harvester. It was due to the predominance of quadratic nonlinearity at the threshold distance.
In order to further investigate the dynamic behavior of the harvesting system at the threshold distance, the harvester’s time response, phase portrait, and time–voltage/velocity were extracted at specific frequencies to reflect the response in the before-impact, during-impact, and after-impact zones, as shown in Figure 18. Before the impact, at 19 Hz, the maximum harvester oscillation was around 0.8 mm, which is less than the gap between the harvester’s electrodes (1.0 mm), as shown in Figure 18a. The corresponding phase portrait and voltage output are shown in Figure 18b,c, respectively. The phase portrait shows a stable oscillation without any sudden change in the velocity, which is an indication of no impact at this frequency. The voltage output in Figure 18c is small since it was only due to the effect of the capacitance. By increasing the excitation frequency to 24.8 Hz, the oscillations reached the gap distance (Figure 18d) and the during-impact zone occurred between the harvester electrodes, as shown by the sudden change in the velocity and the restriction of the displacement in the phase portrait; see Figure 18e. This impact activates the contact electrification process, and higher voltage output can be generated, as shown in Figure 18f. When the excitation frequency exceeded 31.06 Hz, the system entered the after-impact zone, which is similar in behavior to the before-impact zone, as shown in Figure 18g−i.
At a distance below the threshold value, the magnetic nonlinearity became very strong. Experimentally and under the base excitations, it deflected the beam to the degree where the repulsive magnetic force between the two magnets became significantly large and caused the tip magnet to stick to the fixed one, leading to a failure in the system. Therefore, since we validated our theoretical model experimentally, the dynamic behavior of the energy harvester in the bistable range was explored through the theoretical model only. Specifically, the distance between the two magnets was lowered to 8 mm, 5 mm, and 4 mm, as shown in Figure 19. At 8 mm (Figure 19a), the system still showed an impact behavior close to the range of frequencies at the threshold. In addition, the generated voltage dropped significantly to 2.24 V. Furthermore, a hardening behavior is shown by increasing the excitation level. Lowering the separation distance to the lower values of 5 mm and 4 mm increased the natural frequencies to reach higher values of 55.3 Hz and 64.25 Hz, respectively, indicating a hardening behavior. This significant increment in the natural frequency in the system was due to the strong magnetic nonlinearity induced at lower separation distances. However, increasing the excitation level forced the system to exhibit softening behaviors, where the quadratic nonlinearity became dominant, as shown in Figure 19b,c. Furthermore, the impact bandwidth became smaller at 5 mm and 4 mm, while the output voltage reached the lowest values compared to all the previous cases. Even though the system reached higher frequencies at lower distances, the output voltage was minimized, possibly due to the high magnetic force, which forced the beam’s tip magnet to become stuck to one of the potential wells and restrict its oscillations. Therefore, it was hypothesized that the deflections would be smaller than the distance between the triboelectric harvester’s electrodes.
Next, to have an indication of the optimal range for the proposed harvester, we calculated the impact bandwidth and voltage output of the harvester at a selected excitation level of 0.9 g for all the previous cases of the separation distance between the two magnets, and the results are summarized in Figure 20. The bandwidth was maximized in a range before and after the threshold distance (9.0 mm): this range is known as the transition regime. It was found that, at an excitation level of 0.9 g, an increment of around 120% in the bandwidth was achieved at the transition region of the nonlinear harvester compared to the conventional harvester presented in Figure 11f. Furthermore, the output voltage was maximized at the transition region, as shown in Figure 20b. Therefore, the transition region is considered the optimal region for the harvester to operate since the bandwidth and voltage output are maximized, allowing more energy to be harvested from the ambient excitations.

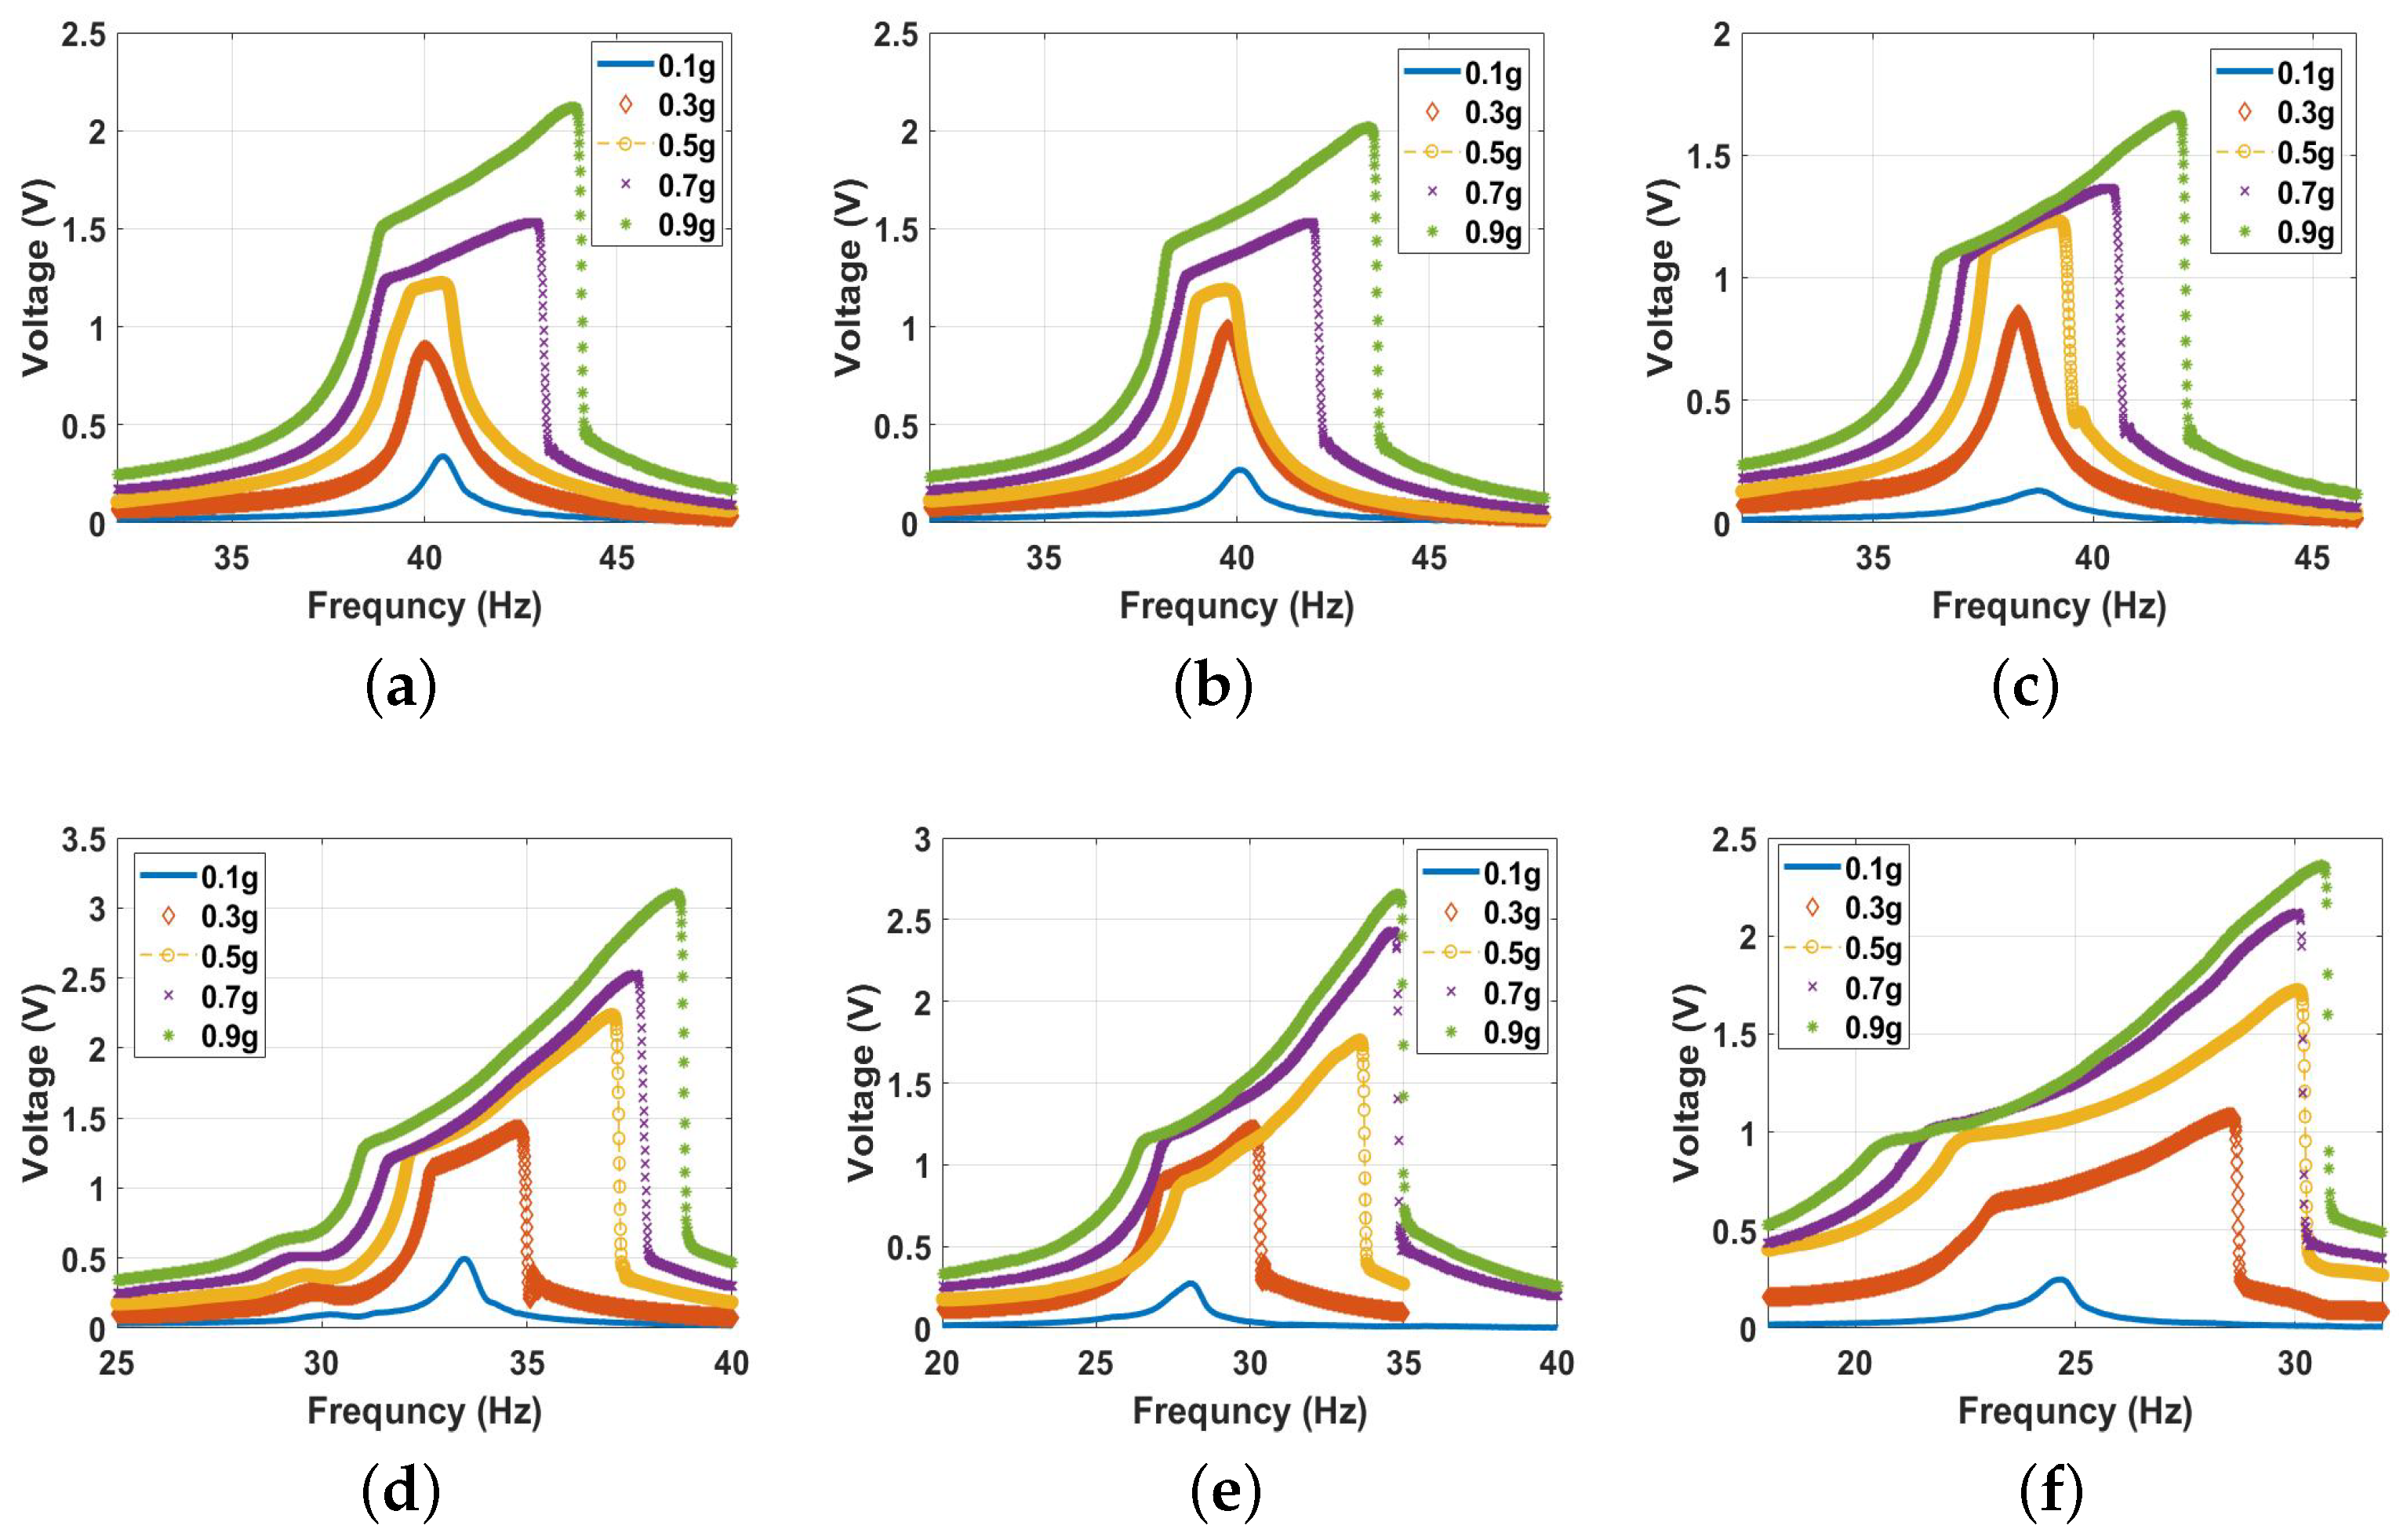
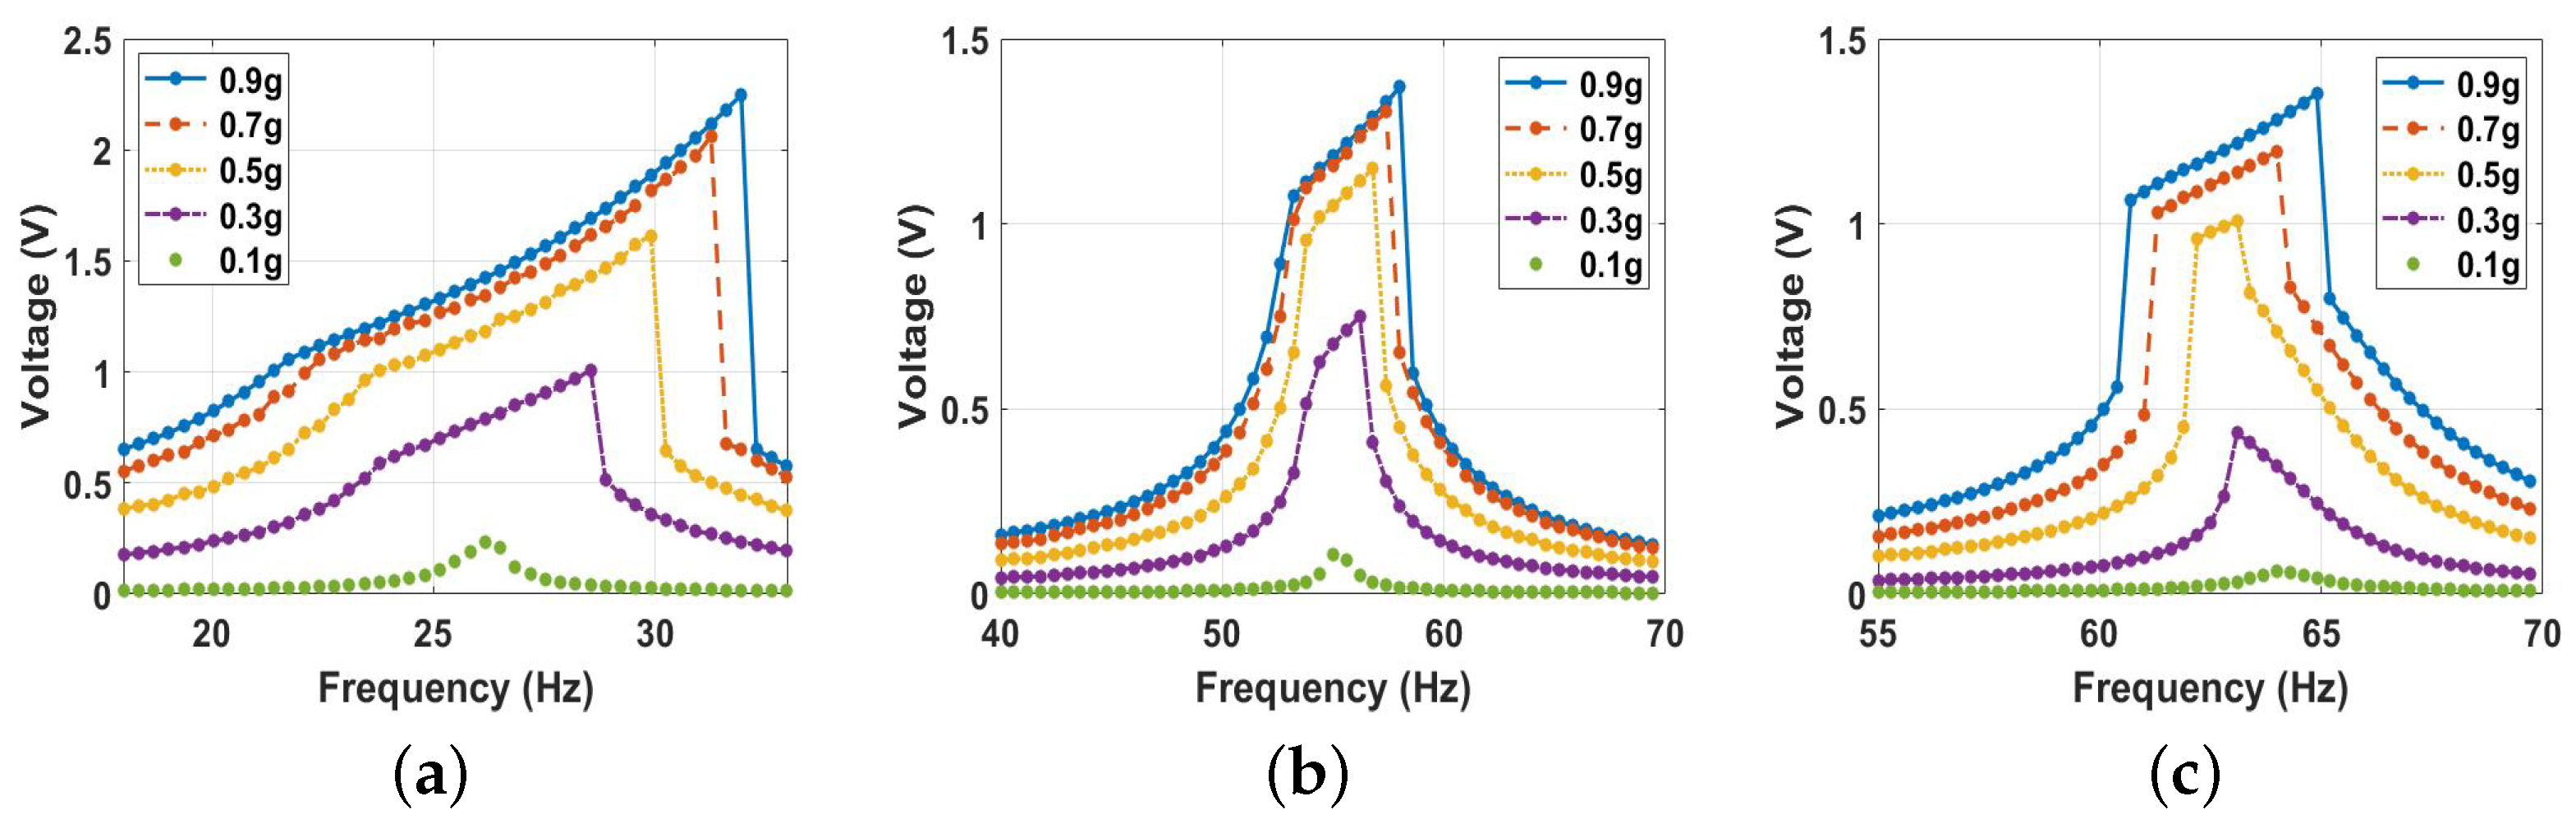
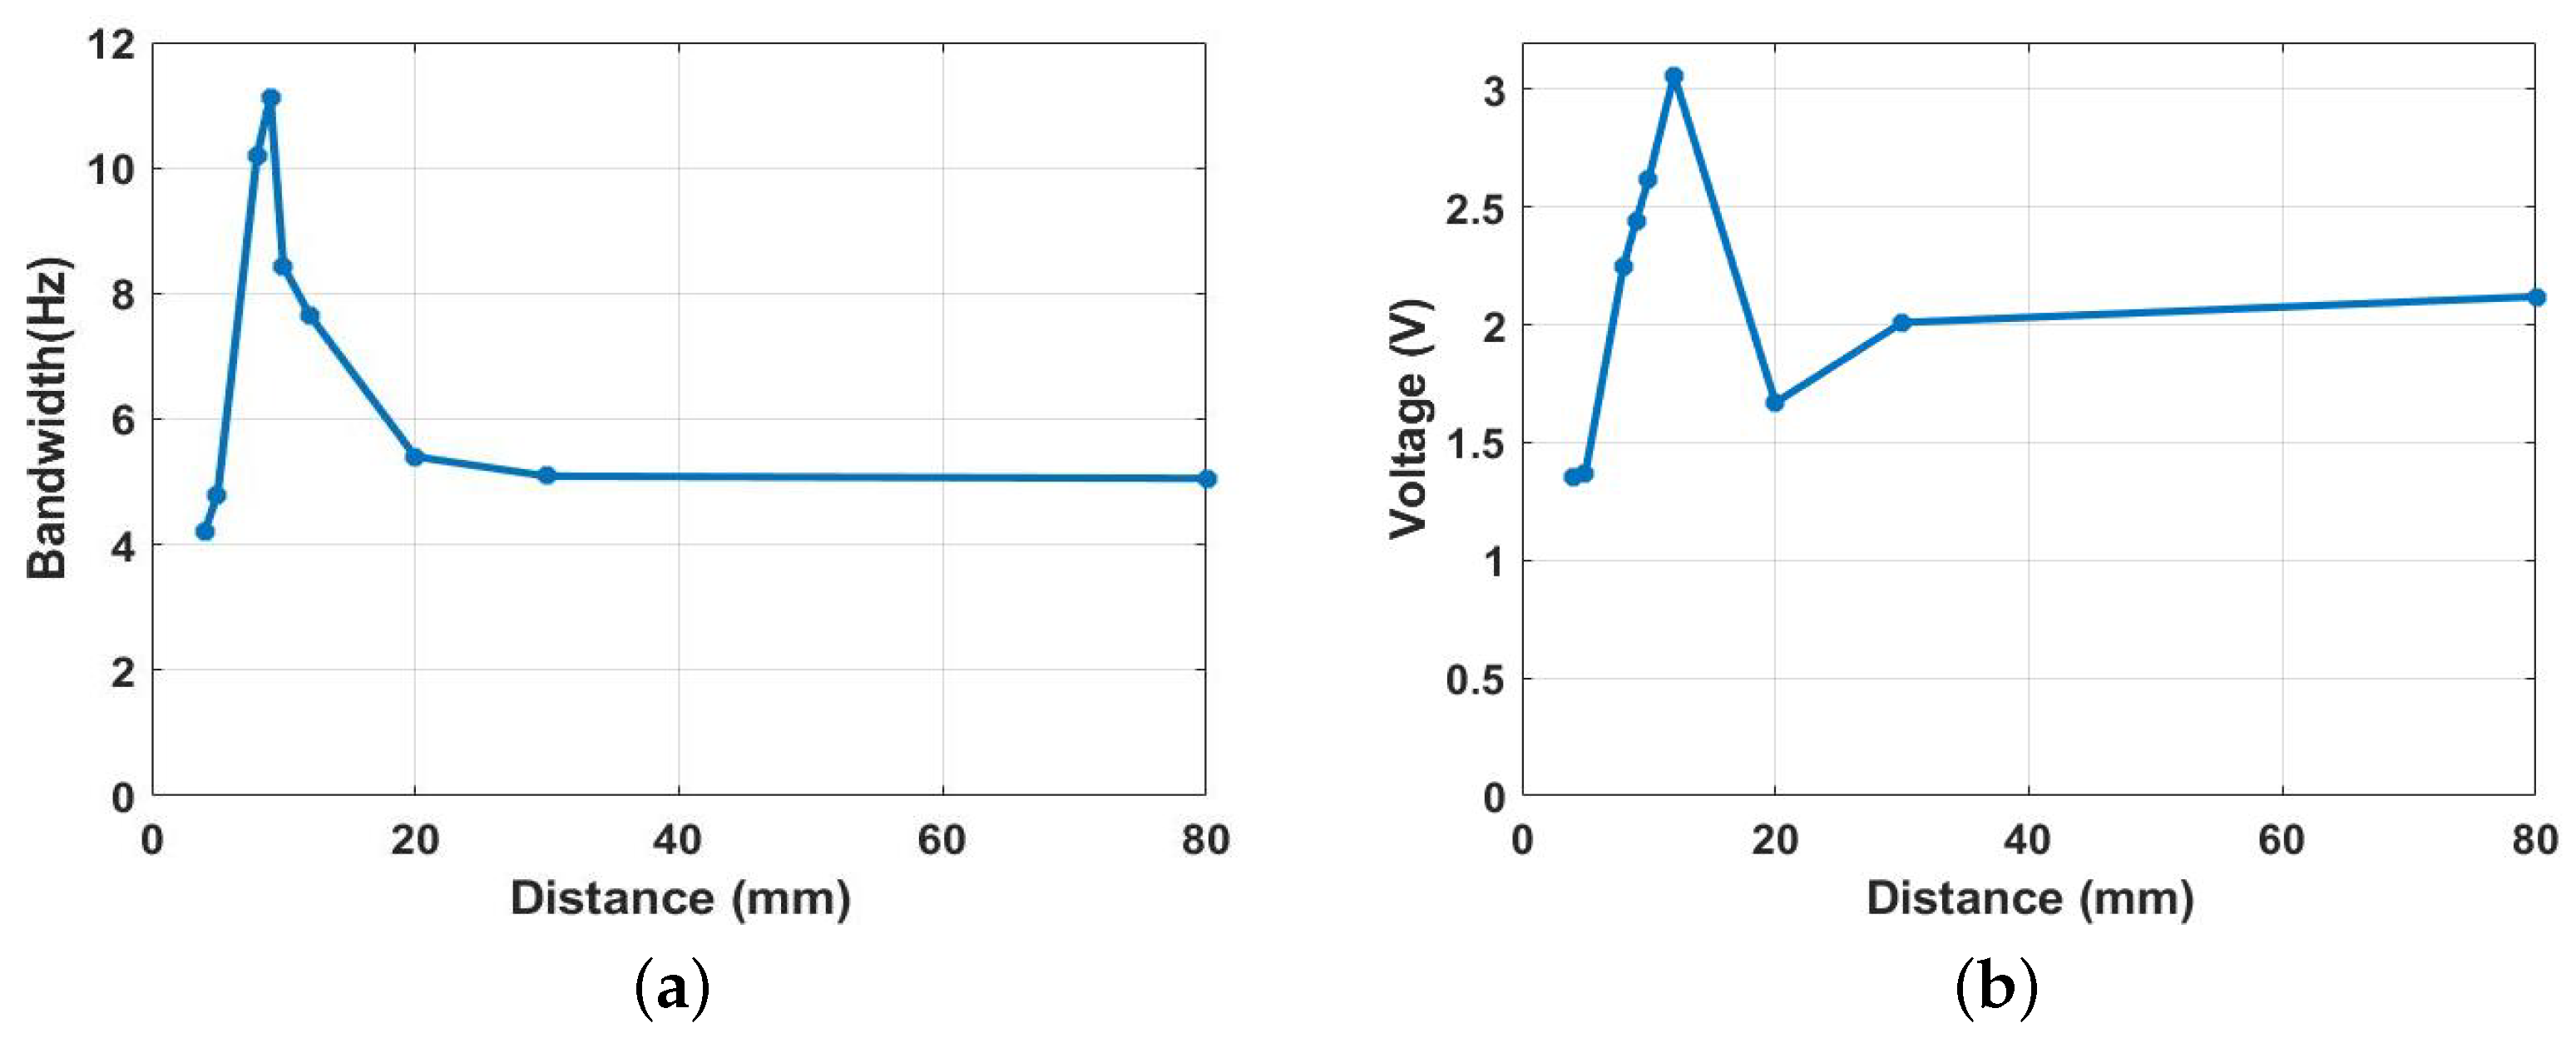
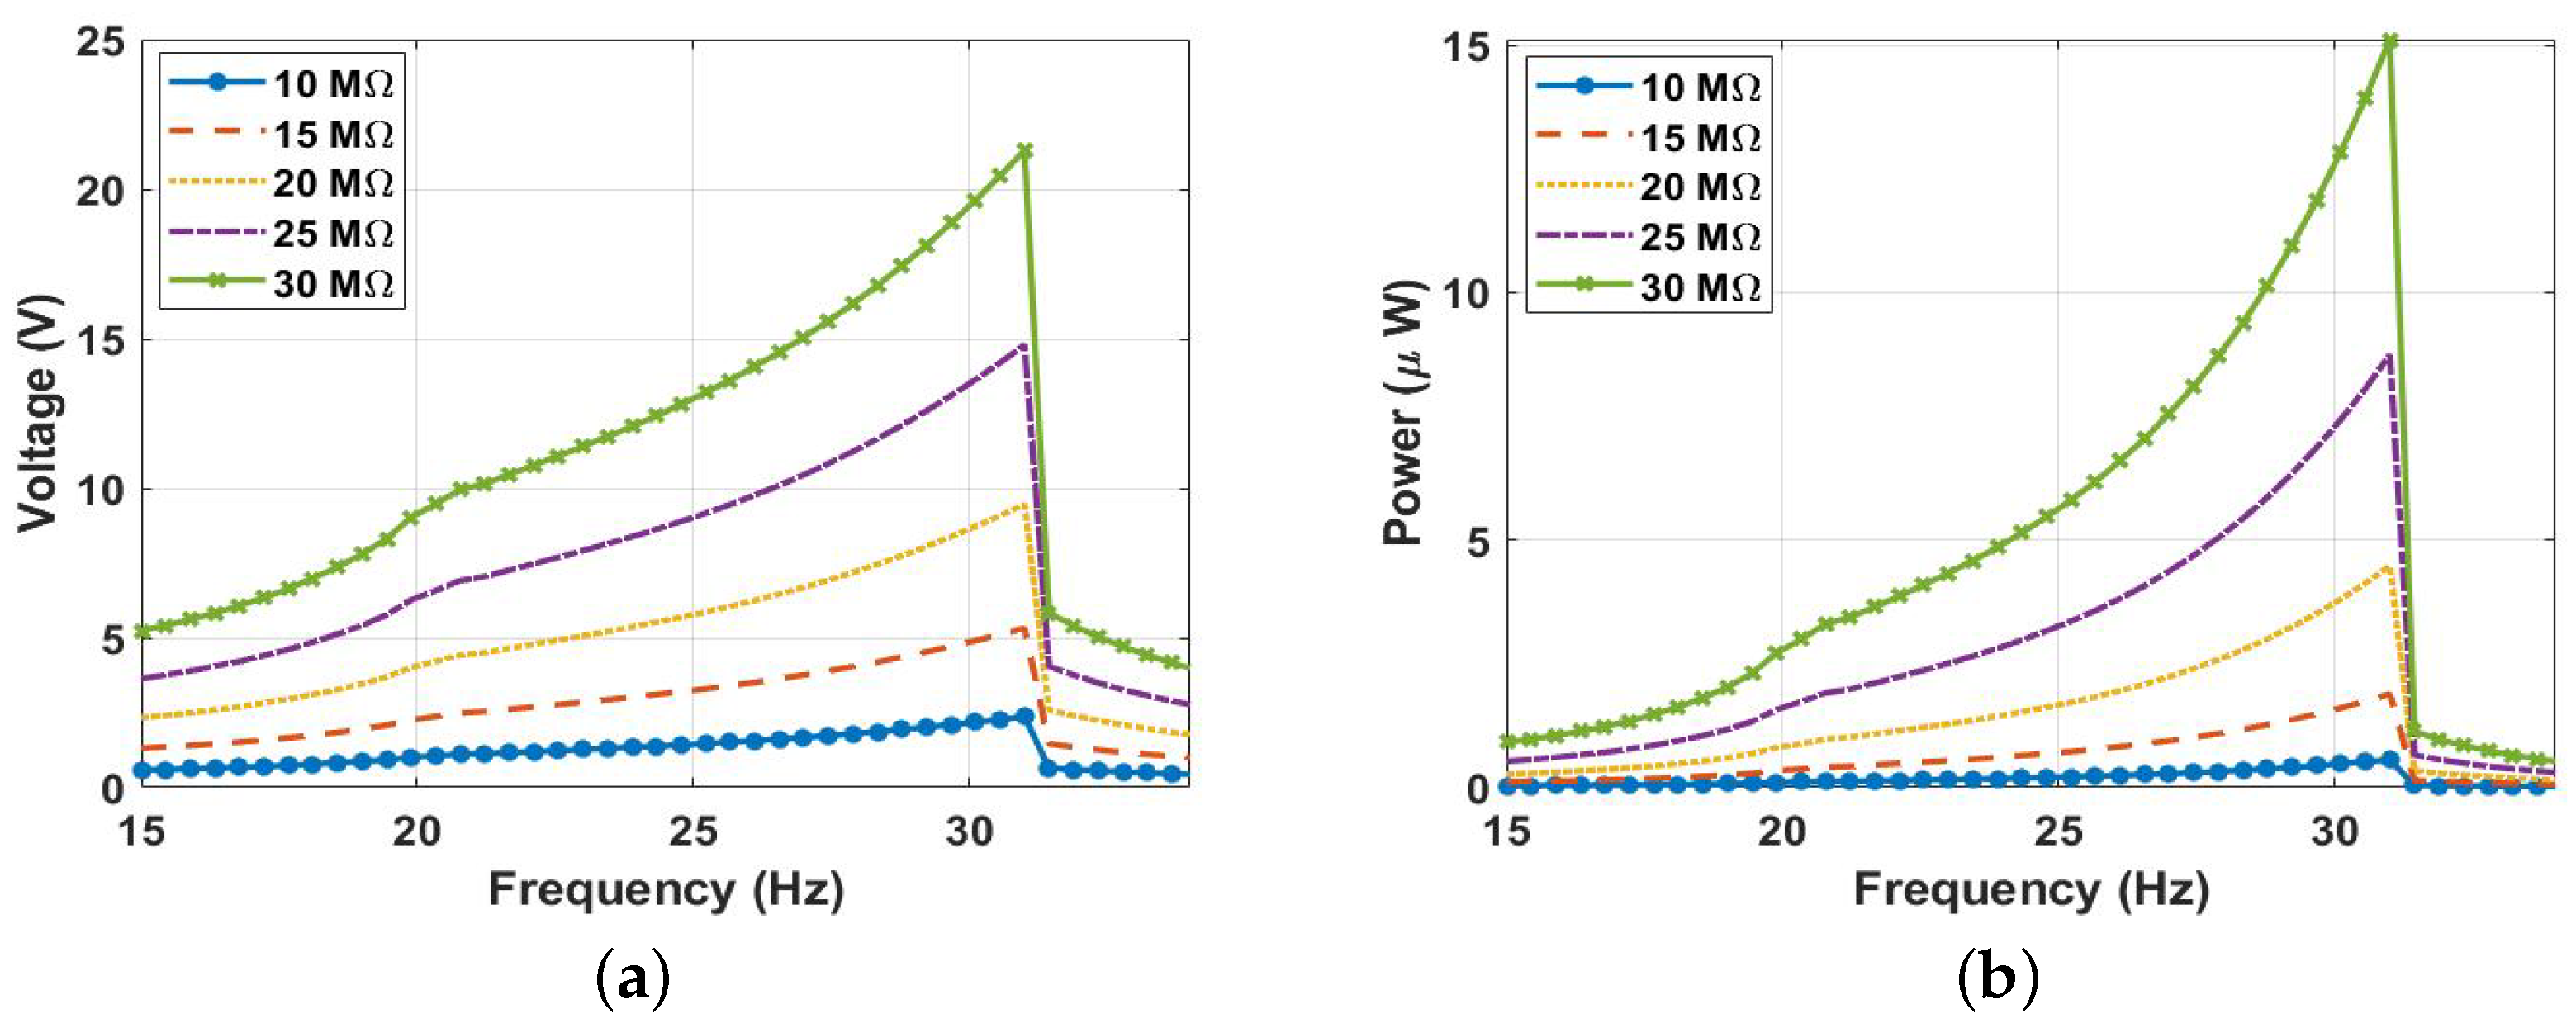
5.2.4. Parametric Analysis

From a design point of view, the harvester should be designed to achieve higher amplitudes and maintain a wider bandwidth; thus, finding a compromise to accommodate both needs to be taken into consideration. However, since the goal is to expand the bandwidth and achieve the highest outputs, in this section, we parametrically investigate the influence of some critical parameters that could be used to enhance the design to achieve higher amplitudes at a wider operating bandwidth.
It is essential to explore the effect that external resistance has on harvester performance since it directly influences the amount of power produced. To do this, we fixed the distance between the two magnets at d = 9 mm and varied the resistance from 10 M Ω to 30 M Ω at a 0.9 g excitation level, as seen in Figure 21a. As a result, a higher voltage signal was generated at a higher external resistance, with a maximum of 21.5 V at a resistance of 30 M Ω . Moreover, the output power was calculated at different resistance values, as shown in Figure 21b. As a result, it was demonstrated that the power increased by increasing the resistance until it reached its maximum value of 15 μ W at a resistance of 30 M Ω . However, a further increment in the external resistance continued to increase the output power until it reached the maximum possible power, where the external resistance matched the internal resistance of the harvester. Beyond this value, the output power started to drop. Therefore, it is worth mentioning that the internal resistance needs to be extracted for practical applications to enhance the triboelectric energy harvester’s performance and maximize the power output.
To further investigate the effect of the parameters on harvester performance, we investigated the impact of the gap distance between the harvester’s electrodes. To do this, the system was excited at a 0.9 g excitation level for various values of the gap distance, as shown in Figure 22a. This shows that a wider bandwidth was possible at lower gaps, while greater amplitudes could be achieved at higher gaps but at the expense of bandwidths. At lower gaps, more contact occurred at a wider range of frequencies, resulting in a wider bandwidth. Conversely, higher gaps led to less contact at a narrower frequency range resulting in a limited bandwidth. Moreover, the surface charge density was an additional important component that substantially impacted the magnitude of the voltage generated. The voltage amplitude fluctuation under various surface charge density values is depicted in Figure 22b at an excitation level of 0.9 g, and magnets spacing of 9 mm, while all other parameters were held constant. The results indicate that, as the charge density increased, the voltage amplitudes grew significantly. It is important to note that the surface charge density is a function of the surface area of contact between the triboelectric layers. Designing such layers with microsurface patterns is one of the primary characteristics that could increase this charge density and result in a higher generated voltage.

6. Conclusions

This study describes a method for dramatically improving the performance of bistable triboelectric energy harvesters by combining magnetic nonlinearity and vibro-impact. The system comprises a cantilever beam with a tip magnet facing another fixed magnet at the same polarity to create a repulsive magnetic force. In addition, a triboelectric energy harvester was embedded in the system to create a vibro-impact triboelectric energy harvester that utilizes a magnetic effect. The static and dynamic behavior of the system was examined using a piecewise function lumped parameter model of a single-degree-of-freedom system with magnetic nonlinearity. The static and frequency variations with separation distance were divided into bistable and monostable regimes by a threshold distance of 9 mm. A nonlinear softening behavior was observed in the monostable and transition region. In contrast, a nonlinear hardening effect dominated in the bistable region. Furthermore, increasing the excitation level induced softening, hardening, and combined behaviors. Combining magnetic nonlinearity with vibro-impact produced a greater bandwidth than utilizing them independently, where a 120% increment was achieved compared to the conventional Vipro-impact energy harvester. Furthermore, a parametric study was explored to optimize the harvester’s performance. In addition, for future work, we are targeting the investigation of the dynamic behavior of the triboelectric energy harvester under random excitations, and testing the harvester under different applications within the ambient range. Magnetic nonlinearity can extend the bandwidth of vibro-impact triboelectric energy harvesters, allowing a more comprehensive range of applications.

Author Contributions

Methodology, Q.Q.; Software, Q.Q.; Validation, Q.Q.; Writing—original draft, Q.Q.; Writing—review & editing, A.I.; Supervision, A.I.; Project administration, A.I. All authors have read and agreed to the published version of the manuscript.

Funding

This research received no external funding.

Data Availability Statement

Data available on request from the authors.

Conflicts of Interest

The authors declare no conflict of interest.

Appendix A. The Coefficients of the Expanded Magnetic Force

α 1 = F R ( d 2 4 Y s 2 ) ( d 2 + Y s 2 ) 7 / 2 α 2 = 5 F R Y s ( 3 d 2 + 4 Y s 2 ) 2 ( d 2 + Y s 2 ) 9 / 2 α 3 = 5 F R ( d 4 12 d 2 Y s 2 + 8 Y s 4 ) 2 ( d 2 + Y s 2 ) 11 / 2 α 4 = 35 F R Y s ( 5 d 4 20 d 2 Y s 2 + 8 Y s 4 ) 8 ( d 2 + Y s 2 ) 13 / 2 α 5 = 7 F R ( 5 d 6 120 d 4 Y s 2 + 240 d 2 Y s 4 64 Y s 6 ) 8 ( d 2 + Y s 2 ) 15 / 2 α 6 = 21 F R Y S ( 35 d 6 + 280 d 4 Y s 2 336 d 2 Y s 4 + 64 Y s 6 ) 16 ( d 2 + Y s 2 ) 17 / 2 α 7 = 15 F R ( 7 d 8 280 d 6 Y s 2 + 1120 d 4 Y s 4 896 d 2 Y s 6 + 128 Y s 8 ) 16 ( d 2 + Y s 2 ) 19 / 2 α 8 = 165 F R Y s ( 63 d 8 840 d 6 Y s 2 + 2016 d 4 Y s 4 1152 d 2 Y s 6 + 128 Y s 8 ) 128 ( d 2 + Y s 2 ) 21 / 2 α 9 = 55 F R ( 21 d 10 + 1260 d 8 Y s 2 8400 d 6 Y s 4 + 13440 d 4 Y s 6 5760 d 2 Y s 8 + 512 Y s 10 ) 128 ( d 2 + Y s 2 ) 23 / 2

References

  1. Paci, D.; Schipani, M.; Bottarel, V.; Miatton, D. Optimization of a piezoelectric energy harvester for environmental broadband vibrations. In Proceedings of the 2008 15th IEEE International Conference On Electronics, Circuits And Systems, Saint Julian’s, Malta, 31 August–3 September 2008; pp. 177–181. [Google Scholar]
  2. Vijayan, K. Vibration and Shock Amplification of Drilling Tools. Ph.D. Dissertation, University of Cambridge, Cambridge, UK, 2012. [Google Scholar]
  3. Du, T.; Zuo, X.; Dong, F.; Li, S.; Mtui, A.; Zou, Y.; Zhang, P.; Zhao, J.; Zhang, Y.; Sun, P.; et al. A self-powered and highly accurate vibration sensor based on bouncing-ball triboelectric nanogenerator for intelligent ship machinery monitoring. Micromachines 2021, 12, 218. [Google Scholar] [CrossRef] [PubMed]
  4. Fu, Y.; Wang, H.; Zi, Y.; Liang, X. A multifunctional robotic system toward moveable sensing and energy harvesting. Nano Energy 2021, 89, 106368. [Google Scholar] [CrossRef]
  5. Davis, J.; Atmeh, M.; Barakat, N.; Ibrahim, A. Design and performance simulation of a triboelectric energy harvester for total hip replacement implants. In Proceedings of the Health Monitoring Of Structural And Biological Systems XV, Online, 22–27 March 2021; Volume 11593, pp. 232–244. [Google Scholar]
  6. Atmeh, M.; Athey, C.; Ramini, A.; Barakat, N.; Ibrahim, A. Performance analysis of triboelectric energy harvester designs for knee implants. In Proceedings of the Health Monitoring Of Structural And Biological Systems XV, Online, 22–27 March 2021; Volume 11593, pp. 221–231. [Google Scholar]
  7. Hossain, N.; Yamomo, G.; Willing, R.; Towfighian, S. Characterization of a packaged triboelectric harvester under simulated gait loading for total knee replacement. IEEE/ASME Trans. Mechatron. 2021, 26, 2967–2976. [Google Scholar] [CrossRef] [PubMed]
  8. Cottone, F.; Vocca, H.; Gammaitoni, L. Nonlinear energy harvesting. Phys. Rev. Lett. 2009, 102, 080601. [Google Scholar] [CrossRef]
  9. Reilly, E.; Miller, L.; Fain, R.; Wright, P. A study of ambient vibrations for piezoelectric energy conversion. Proc. PowerMEMS 2009, 2009, 312–315. [Google Scholar]
  10. Zhu, D.; Tudor, M.; Beeby, S. Strategies for increasing the operating frequency range of vibration energy harvesters: A review. Meas. Sci. Technol. 2009, 21, 022001. [Google Scholar] [CrossRef]
  11. Aldraihem, O.; Baz, A. Energy harvester with a dynamic magnifier. J. Intell. Mater. Syst. Struct. 2011, 22, 521–530. [Google Scholar] [CrossRef]
  12. Yu, N.; Ma, H.; Wu, C.; Yu, G.; Yan, B. Modeling and experimental investigation of a novel bistable two-degree-of-freedom electromagnetic energy harvester. Mech. Syst. Signal Process. 2021, 156, 107608. [Google Scholar] [CrossRef]
  13. Miao, G.; Fang, S.; Wang, S.; Zhou, S. A low-frequency rotational electromagnetic energy harvester using a magnetic plucking mechanism. Appl. Energy 2022, 305, 117838. [Google Scholar] [CrossRef]
  14. Zhao, L.; Zou, H.; Gao, Q.; Yan, G.; Liu, F.; Tan, T.; Wei, K.; Zhang, W. Magnetically modulated orbit for human motion energy harvesting. Appl. Phys. Lett. 2019, 115, 263902. [Google Scholar] [CrossRef]
  15. Zhou, S.; Cao, J.; Erturk, A.; Lin, J. Enhanced broadband piezoelectric energy harvesting using rotatable magnets. Appl. Phys. Lett. 2013, 102, 173901. [Google Scholar] [CrossRef]
  16. Panda, S.; Hajra, S.; Mistewicz, K.; In-na, P.; Sahu, M.; Rajaitha, P.; Kim, H. Piezoelectric energy harvesting systems for biomedical applications. Nano Energy 2022, 100, 107514. [Google Scholar] [CrossRef]
  17. Zhang, Q.; Liu, Z.; Jiang, X.; Peng, Y.; Zhu, C.; Li, Z. Experimental investigation on performance improvement of cantilever piezoelectric energy harvesters via escapement mechanism from extremely Low-Frequency excitations. Sustain. Energy Technol. Assess. 2022, 53, 102591. [Google Scholar] [CrossRef]
  18. Su, Y.; Liu, Y.; Li, W.; Xiao, X.; Chen, C.; Lu, H.; Yuan, Z.; Tai, H.; Jiang, Y.; Zou, J. Others Sensing—Transducing coupled piezoelectric textiles for self-powered humidity detection and wearable biomonitoring. Mater. Horiz. 2023, 10, 842–851. [Google Scholar] [CrossRef]
  19. Yurchenko, D.; Val, D.; Lai, Z.; Gu, G.; Thomson, G. Energy harvesting from a DE-based dynamic vibro-impact system. Smart Mater. Struct. 2017, 26, 105001. [Google Scholar] [CrossRef]
  20. Liu, M.; Qian, F.; Mi, J.; Zuo, L. Biomechanical energy harvesting for wearable and mobile devices: State-of-the-art and future directions. Appl. Energy 2022, 321, 119379. [Google Scholar] [CrossRef]
  21. Thomson, G.; Lai, Z.; Val, D.; Yurchenko, D. Advantages of nonlinear energy harvesting with dielectric elastomers. J. Sound Vib. 2019, 442, 167–182. [Google Scholar] [CrossRef]
  22. Hassan, M.; Baker, K.; Ibrahim, A. Modeling of triboelectric vibration energy harvester under rotational magnetic excitation. In Smart Materials, Adaptive Structures and Intelligent Systems; American Society of Mechanical Engineers: New York, NY, USA, 2021; Volume 85499, p. V001T04A012. [Google Scholar]
  23. Haroun, A.; Tarek, M.; Mosleh, M.; Ismail, F. Recent Progress on Triboelectric Nanogenerators for Vibration Energy Harvesting and Vibration Sensing. Nanomaterials 2022, 12, 2960. [Google Scholar] [CrossRef]
  24. Lin, L.; Wang, S.; Niu, S.; Liu, C.; Xie, Y.; Wang, Z. Noncontact free-rotating disk triboelectric nanogenerator as a sustainable energy harvester and self-powered mechanical sensor. ACS Appl. Mater. Interfaces 2014, 6, 3031–3038. [Google Scholar] [CrossRef]
  25. Khandelwal, G.; Dahiya, R. Self-Powered Active Sensing Based on Triboelectric Generators. Adv. Mater. 2022, 34, 2200724. [Google Scholar] [CrossRef]
  26. Li, X.; Cao, Y.; Yu, X.; Xu, Y.; Yang, Y.; Liu, S.; Cheng, T.; Wang, Z. Breeze-driven triboelectric nanogenerator for wind energy harvesting and application in smart agriculture. Appl. Energy 2022, 306, 117977. [Google Scholar] [CrossRef]
  27. Jin, C.; Kia, D.; Jones, M.; Towfighian, S. On the contact behavior of micro-/nano-structured interface used in vertical-contact-mode triboelectric nanogenerators. Nano Energy 2016, 27, 68–77. [Google Scholar] [CrossRef]
  28. Rahman, M.; Rana, S.; Salauddin, M.; Maharjan, P.; Bhatta, T.; Park, J. Biomechanical energy-driven hybridized generator as a universal portable power source for smart/wearable electronics. Adv. Energy Mater. 2020, 10, 1903663. [Google Scholar] [CrossRef]
  29. Wang, L.; Fei, Z.; Qi, Y.; Zhang, C.; Zhao, L.; Jiang, Z.; Maeda, R. Overview of Human Kinetic Energy Harvesting and Application. Acs Appl. Energy Mater. 2022, 5, 7091–7114. [Google Scholar] [CrossRef]
  30. Yi, J.; Dong, K.; Shen, S.; Jiang, Y.; Peng, X.; Ye, C.; Wang, Z. Fully fabric-based triboelectric nanogenerators as self-powered human–machine interactive keyboards. Nano-Micro Lett. 2021, 13, 103. [Google Scholar] [CrossRef]
  31. Zhang, L.; Meng, B.; Xia, Y.; Deng, Z.; Dai, H.; Hagedorn, P.; Peng, Z.; Wang, L. Galloping triboelectric nanogenerator for energy harvesting under low wind speed. Nano Energy 2020, 70, 104477. [Google Scholar] [CrossRef]
  32. Ren, Z.; Wu, L.; Pang, Y.; Zhang, W.; Yang, R. Strategies for effectively harvesting wind energy based on triboelectric nanogenerators. Nano Energy 2022, 100, 107522. [Google Scholar] [CrossRef]
  33. Xia, Y.; Tian, Y.; Zhang, L.; Ma, Z.; Dai, H.; Meng, B.; Peng, Z. An optimized flutter-driven triboelectric nanogenerator with a low cut-in wind speed. Micromachines 2021, 12, 366. [Google Scholar] [CrossRef]
  34. Wu, C.; Huang, H.; Li, R.; Fan, C. Research on the potential of spherical triboelectric nanogenerator for collecting vibration energy and measuring vibration. Sensors 2020, 20, 1063. [Google Scholar] [CrossRef]
  35. Zhao, H.; Ouyang, H. Theoretical investigation and experiment of a disc-shaped triboelectric energy harvester with a magnetic bistable mechanism. Smart Mater. Struct. 2021, 30, 095026. [Google Scholar] [CrossRef]
  36. Zi, Y.; Wang, J.; Wang, S.; Li, S.; Wen, Z.; Guo, H.; Wang, Z. Effective energy storage from a triboelectric nanogenerator. Nat. Commun. 2016, 7, 10987. [Google Scholar] [CrossRef] [PubMed]
  37. Yi, F.; Lin, L.; Niu, S.; Yang, P.; Wang, Z.; Chen, J.; Zhou, Y.; Zi, Y.; Wang, J.; Liao, Q. Others Stretchable-rubber-based triboelectric nanogenerator and its application as self-powered body motion sensors. Adv. Funct. Mater. 2015, 25, 3688–3696. [Google Scholar] [CrossRef]
  38. Zhang, X.; Han, M.; Wang, R.; Meng, B.; Zhu, F.; Sun, X.; Hu, W.; Wang, W.; Li, Z.; Zhang, H. High-performance triboelectric nanogenerator with enhanced energy density based on single-step fluorocarbon plasma treatment. Nano Energy 2014, 4, 123–131. [Google Scholar] [CrossRef]
  39. Aouali, K.; Kacem, N.; Bouhaddi, N.; Mrabet, E.; Haddar, M. Efficient broadband vibration energy harvesting based on tuned non-linearity and energy localization. Smart Mater. Struct. 2020, 29, 10LT01. [Google Scholar] [CrossRef]
  40. Gibus, D.; Gasnier, P.; Morel, A.; Formosa, F.; Charleux, L.; Boisseau, S.; Pillonnet, G.; Berlitz, C.; Quelen, A.; Badel, A. Strongly coupled piezoelectric cantilevers for broadband vibration energy harvesting. Appl. Energy 2020, 277, 115518. [Google Scholar] [CrossRef]
  41. Yan, B.; Yu, N.; Ma, H.; Wu, C. A theory for bistable vibration isolators. Mech. Syst. Signal Process. 2022, 167, 108507. [Google Scholar] [CrossRef]
  42. Fang, S.; Chen, K.; Xing, J.; Zhou, S.; Liao, W. Tuned bistable nonlinear energy sink for simultaneously improved vibration suppression and energy harvesting. Int. J. Mech. Sci. 2021, 212, 106838. [Google Scholar] [CrossRef]
  43. Daqaq, M. Response of uni-modal duffing-type harvesters to random forced excitations. J. Sound Vib. 2010, 329, 3621–3631. [Google Scholar] [CrossRef]
  44. Rysak, A.; Sedlmayr, M. Damping efficiency of the Duffing system with additional fractional terms. Appl. Math. Model. 2022, 111, 521–533. [Google Scholar] [CrossRef]
  45. Sebald, G.; Kuwano, H.; Guyomar, D.; Ducharne, B. Experimental Duffing oscillator for broadband piezoelectric energy harvesting. Smart Mater. Struct. 2011, 20, 102001. [Google Scholar] [CrossRef]
  46. Song, J.; Han, X.; Zou, Y.; Jiang, Y.; Bi, Q. Relaxation oscillation patterns induced by amplitude-modulated excitation in the Duffing system. Chaos Solitons Fractals 2022, 164, 112555. [Google Scholar] [CrossRef]
  47. Dulin, S.; Lin, K.; Serdukova, L.; Kuske, R.; Yurchenko, D. Improving the performance of a two-sided vibro-impact energy harvester with asymmetric restitution coefficients. Int. J. Mech. Sci. 2022, 217, 106983. [Google Scholar] [CrossRef]
  48. Jacquelin, E.; Adhikari, S.; Friswell, M. A piezoelectric device for impact energy harvesting. Smart Mater. Struct. 2011, 20, 105008. [Google Scholar] [CrossRef]
  49. Afsharfard, A.; Shin, H.; Hosseini, S.; Kim, E.; Lee, I.; Kim, K. Design of vibro-impact electromagnetic ocean-wave energy harvesting system; an experimental study. Ocean. Eng. 2022, 263, 112168. [Google Scholar] [CrossRef]
  50. Zhang, L.; Tang, X.; Qin, Z.; Chu, F. Vibro-impact energy harvester for low frequency vibration enhanced by acoustic black hole. Appl. Phys. Lett. 2022, 121, 013902. [Google Scholar] [CrossRef]
  51. Ibrahim, A.; Ramini, A.; Towfighian, S. Triboelectric energy harvester with large bandwidth under harmonic and random excitations. Energy Rep. 2020, 6, 2490–2502. [Google Scholar] [CrossRef]
  52. Ibrahim, A.; Ramini, A.; Towfighian, S. Experimental and theoretical investigation of an impact vibration harvester with triboelectric transduction. J. Sound Vib. 2018, 416, 111–124. [Google Scholar] [CrossRef]
  53. Rezaei, M.; Talebitooti, R.; Liao, W. Investigations on magnetic bistable PZT-based absorber for concurrent energy harvesting and vibration mitigation: Numerical and analytical approaches. Energy 2022, 239, 122376. [Google Scholar] [CrossRef]
  54. Ibrahim, A.; Towfighian, S.; Younis, M.; Su, Q. Magnetoelastic beam with extended polymer for low frequency vibration energy harvesting. In Proceedings of the Smart Materials And Nondestructive Evaluation For Energy Systems 2016, Las Vegas, NV, USA, 20–24 March 2016; Volume 9806, pp. 71–85. [Google Scholar]
  55. Ibrahim, A.; Towfighian, S.; Younis, M. Dynamics of transition regime in bistable vibration energy harvesters. J. Vib. Acoust. 2017, 139, 051008. [Google Scholar] [CrossRef]
  56. Wang, Z.; Li, T.; Du, Y.; Yan, Z.; Tan, T. Nonlinear broadband piezoelectric vibration energy harvesting enhanced by inter-well modulation. Energy Convers. Manag. 2021, 246, 114661. [Google Scholar] [CrossRef]
  57. Su, X.; Leng, Y.; Sun, S.; Chen, X.; Xu, J. Theoretical and experimental investigation of a quad-stable piezoelectric energy harvester using a locally demagnetized multi-pole magnet. Energy Convers. Manag. 2022, 271, 116291. [Google Scholar] [CrossRef]
  58. Fu, Y.; Ouyang, H.; Benjamin Davis, R. Nonlinear structural dynamics of a new sliding-mode triboelectric energy harvester with multistability. Nonlinear Dyn. 2020, 100, 1941–1962. [Google Scholar] [CrossRef]
  59. Ibrahim, R. Recent advances in vibro-impact dynamics and collision of ocean vessels. J. Sound Vib. 2014, 333, 5900–5916. [Google Scholar] [CrossRef]
  60. Cao, D.; Xia, W.; Guo, X.; Lai, S. Modeling and experiment of vibro-impact vibration energy harvester based on a partial interlayer-separated piezoelectric beam. J. Intell. Mater. Syst. Struct. 2021, 32, 817–831. [Google Scholar] [CrossRef]
  61. Ibrahim, A.; Hassan, M. Extended bandwidth of 2DOF double impact triboelectric energy harvesting: Theoretical and experimental verification. Appl. Energy 2023, 333, 120593. [Google Scholar] [CrossRef]
  62. Zhao, C.; Hu, G.; Yang, Y. A cantilever-type vibro-impact triboelectric energy harvester for wind energy harvesting. Mech. Syst. Signal Process. 2022, 177, 109185. [Google Scholar] [CrossRef]
  63. Fu, Y.; Ouyang, H.; Davis, R. Triboelectric energy harvesting from the vibro-impact of three cantilevered beams. Mech. Syst. Signal Process. 2019, 121, 509–531. [Google Scholar] [CrossRef]
  64. Tan, D.; Zhou, J.; Wang, K.; Cai, C.; Xu, D. Modeling and analysis of the friction in a non-linear sliding-mode triboelectric energy harvester. Acta Mech. Sin. 2022, 38, 521330. [Google Scholar] [CrossRef]
  65. Zhang, J.; Qin, L. A tunable frequency up-conversion wideband piezoelectric vibration energy harvester for low-frequency variable environment using a novel impact-and rope-driven hybrid mechanism. Appl. Energy 2019, 240, 26–34. [Google Scholar] [CrossRef]
  66. Cao, D.; Ding, X.; Guo, X.; Yao, M. Design, simulation and experiment for a vortex-induced vibration energy harvester for low-velocity water flow. Int. J. Precis. Eng.-Manuf.-Green Technol. 2021, 8, 1239–1252. [Google Scholar] [CrossRef]
  67. Halim, M.; Park, J. Piezoceramic based wideband energy harvester using impact-enhanced dynamic magnifier for low frequency vibration. Ceram. Int. 2015, 41, S702–S707. [Google Scholar] [CrossRef]
  68. Zhao, L.; Yang, Y. An impact-based broadband aeroelastic energy harvester for concurrent wind and base vibration energy harvesting. Appl. Energy 2018, 212, 233–243. [Google Scholar] [CrossRef]
  69. Lai, Z.; Wang, J.; Zhang, C.; Zhang, G.; Yurchenko, D. Harvest wind energy from a vibro-impact DEG embedded into a bluff body. Energy Convers. Manag. 2019, 199, 111993. [Google Scholar] [CrossRef]
  70. Qi, N.; Dai, K.; Wang, X.; You, Z. Optimization for piezoelectric energy harvesters with self-coupled structure: A double kill in bandwidth and power. Nano Energy 2022, 102, 107602. [Google Scholar] [CrossRef]
  71. Atmeh, M.; Ibrahim, A.; Ramini, A. Static and Dynamic Analysis of a Bistable Frequency Up-Converter Piezoelectric Energy Harvester. Micromachines 2023, 14, 261. [Google Scholar] [CrossRef] [PubMed]
  72. Yao, M.; Liu, P.; Ma, L.; Wang, H.; Zhang, W. Experimental study on broadband bistable energy harvester with L-shaped piezoelectric cantilever beam. Acta Mech. Sin. 2020, 36, 557–577. [Google Scholar] [CrossRef]
  73. Li, H.; Li, A. Potential of a vibro-impact nonlinear energy sink for energy harvesting. Mech. Syst. Signal Process. 2021, 159, 107827. [Google Scholar] [CrossRef]
  74. Zhou, J.; Zhao, X.; Wang, K.; Chang, Y.; Xu, D.; Wen, G. Bio-inspired bistable piezoelectric vibration energy harvester: Design and experimental investigation. Energy 2021, 228, 120595. [Google Scholar] [CrossRef]
  75. Zhang, W.; Liu, Y.; Wu, M. Theory and experiment of nonlinear vibrations and dynamic snap-through phenomena for bi-stable asymmetric laminated composite square panels under foundation excitation. Compos. Struct. 2019, 225, 111140. [Google Scholar] [CrossRef]
  76. Atmeh, M.; Ibrahim, A. Modeling of Piezoelectric Vibration Energy Harvesting From Low-Frequency Using Frequency Up-Conversion. In Smart Materials, Adaptive Structures And Intelligent Systems; American Society of Mechanical Engineers: New York, NY, USA, 2021; Volume 85499, p. V001T04A011. [Google Scholar]
  77. Naseer, R.; Dai, H.; Abdelkefi, A.; Wang, L. Piezomagnetoelastic energy harvesting from vortex-induced vibrations using monostable characteristics. Appl. Energy 2017, 203, 142–153. [Google Scholar] [CrossRef]
  78. Harne, R.; Wang, K. A review of the recent research on vibration energy harvesting via bistable systems. Smart Mater. Struct. 2013, 22, 023001. [Google Scholar] [CrossRef]
  79. Drezet, C.; Kacem, N.; Bouhaddi, N. Design of a nonlinear energy harvester based on high static low dynamic stiffness for low frequency random vibrations. Sens. Actuators A Phys. 2018, 283, 54–64. [Google Scholar] [CrossRef]
  80. Costa, L.; Monteiro, L.; Pacheco, P.; Savi, M. A parametric analysis of the nonlinear dynamics of bistable vibration-based piezoelectric energy harvesters. J. Intell. Mater. Syst. Struct. 2021, 32, 699–723. [Google Scholar] [CrossRef]
  81. Zhu, D.; Beeby, S. A broadband electromagnetic energy harvester with a coupled bistable structure. J. Phys. Conf. Ser. 2013, 476, 012070. [Google Scholar] [CrossRef]
  82. Arab Hassani, F.; Mogan, R.; Gammad, G.; Wang, H.; Yen, S.; Thakor, N.; Lee, C. Toward self-control systems for neurogenic underactive bladder: A triboelectric nanogenerator sensor integrated with a bistable micro-actuator. ACS Nano 2018, 12, 3487–3501. [Google Scholar] [CrossRef] [PubMed]
  83. Deng, H.; Ye, J.; Du, Y.; Zhang, J.; Ma, M.; Zhong, X. Bistable broadband hybrid generator for ultralow-frequency rectilinear motion. Nano Energy 2019, 65, 103973. [Google Scholar] [CrossRef]
  84. Zhao, H.; Ouyang, H. Structural and electrical dynamics of a grating-patterned triboelectric energy harvester with stick–slip oscillation and magnetic bistability. Nonlinear Dyn. 2022, 109, 479–506. [Google Scholar] [CrossRef]
  85. Younis, M. MEMS Linear and Nonlinear Statics and Dynamics; Springer Science & Business Media: Berlin/Heidelberg, Germany, 2011. [Google Scholar]
Figure 1. Schematic of the nonlinear energy harvester under base excitation.
Micromachines 14 01008 g001
Figure 2. The principle of operation of the nonlinear harvester as a function of the distances between two magnets: (a) stability; (b) potential energy.
Micromachines 14 01008 g002
Figure 3. Triboelectric energy harvester cycle of work.
Micromachines 14 01008 g003
Figure 4. Schematic for the total magnetic force acting on tip magnets.
Micromachines 14 01008 g004
Figure 5. Single-degree-of-freedom vibration system (a) before impact and (b) at the start of the impact.
Micromachines 14 01008 g005
Figure 6. The experimental setup for testing the triboelectric energy harvester.
Micromachines 14 01008 g006
Figure 7. Experimental and theoretical static response of the beam as a function of the separation between the two magnets (d). The threshold distance ( d t h ) was found to be 9 mm.
Micromachines 14 01008 g007
Figure 8. Variation in natural frequency with distance d between two magnets at 0.1 g.
Micromachines 14 01008 g008
Figure 9. (a) Variation in stiffness with distance d between two magnets. (b) Variation in natural frequency with distance d between two magnets.
Micromachines 14 01008 g009
Figure 10. The linear experimental and theoretical frequency voltage curve without the influence of the magnetic force at a low excitation level of 0.1 g, c = 0.03 , and σ = 1.3 μ C/m 2 .
Micromachines 14 01008 g010
Figure 11. The frequency voltage curve of the beam at different excitation levels without magnetic force effect: (a) experimental results; (b) 0.1 g, c = 0.03 , and σ = 1.35 μ C/m 2 ; (c) 0.3 g, c = 0.0335 , and σ = 1.4 μ C/m 2 ; (d) 0.5 g, c = 0.05 , and σ = 2.8 μ C/m 2 ; (e) 0.7 g, c = 0.03 , and σ = 4.2 μ C/m 2 ; (f) 0.9 g, c = 0.03 , and σ = 5.2 μ C/m 2 .
Micromachines 14 01008 g011
Figure 12. The frequency voltage curve of the beam at different excitation levels and for selected magnet spacings of: (a) No magnet; (b) d = 30 mm; (c) d = 20 mm; (d) d = 12 mm; (e) d = 10 mm; (f) d = 9 mm.
Micromachines 14 01008 g012
Figure 13. The voltage frequency response curve of the monostable range at d = 30 mm at different excitation levels: (a) experimental results; (b) 0.1 g , c = 0.02 , and σ = 1.06 μ C/m 2 ; (c) 0.3 g , c = 0.04 , and σ = 2.7 μ C/m 2 ; (d) 0.5 g , c = 0.05 , and σ = 3.9 μ C/m 2 ; (e) 0.7 g, c = 0.009 , and σ = 2.96 μ C/m 2 ; (f) 0.9 g, c = 0.001 , and σ = 2.9 μ C/m 2 .
Micromachines 14 01008 g013
Figure 14. The voltage frequency response curve of the monostable range at d = 20 mm at different excitation levels: (a) experimental results; (b) 0.1 g, c = 0.035 , and σ = 0.91 μ C/m 2 ; (c) 0.3 g, c = 0.04 , and σ = 2.2 μ C/m 2 ; (d) 0.5 g, c = 0.035 , and σ = 2.68 μ C/m 2 ; (e) 0.7 g, c = 0.02 , and σ = 2.93 μ C/m 2 ; (f) 0.9 g, c = 0.01 , and σ = 3.5 μ C/m 2 .
Micromachines 14 01008 g014
Figure 15. The voltage frequency response curve of the monostable range at d = 12 mm at different excitation levels: (a) experimental results; (b) 0.1 g, c = 0.03 , and σ = 2.5 μ C/m 2 ; (c) 0.3 g, c = 0.001 , and σ = 2.6 μ C/m 2 ; (d) 0.5 g, c = 0.003 , and σ = 4.7 μ C/m 2 ; (e) 0.7 g c = 0.02 , and σ = 6.4 μ C/m 2 ; (f) 0.9 g, c = 0.04 , and σ = 7.4 μ C/m 2 .
Micromachines 14 01008 g015
Figure 16. The voltage frequency response curve of the monostable range at d = 10 mm at different excitation levels: (a) experimental results; (b) 0.1 g, c = 0.03 , and σ = 1.19 μ C/m 2 ; (c) 0.3 g, c = 0.001 , and σ = 2.45 μ C/m 2 ; (d) 0.5 g, c = 0.0035 , and σ = 4.1 μ C/m 2 ; (e) 0.7 g, c = 0.006 , and σ = 5.2 μ C/m 2 ; (f) 0.9 g, c = 0.03 , and σ = 5.65 μ C/m 2 .
Micromachines 14 01008 g016
Figure 17. The voltage frequency response curve of the threshold at d = 9 mm at different excitation levels: (a) experimental results; (b) 0.1 g, c = 0.03 , and σ = 1.01 μ C/m 2 ; (c) 0.3 g, c = 0.001 , and σ = 2.4 μ C/m 2 ; (d) 0.5 g, c = 0.0065 , and σ = 4 μ C/m 2 ; (e) 0.7 g, c = 0.008 , and σ = 4.4 μ C/m 2 ; (f) 0.9 g, c = 0.025 , and σ = 4.6 μ C/m 2 .
Micromachines 14 01008 g017
Figure 18. Response and the output voltage at a variety of frequencies when the distance d was set at 9 mm. (a) Time-response at 19 Hz, (b) Phase portrait at 19 Hz, (c) Time-voltage at 19 Hz, (d) Time-response at 24.8 Hz, (e) Phase portrait at 24.8 Hz, (f) Time-voltage at 24.8 Hz, (g) Time-response at 31.06 Hz, (h) Phase portrait at 31.06 Hz, (i) Time-voltage at 31.06 Hz.
Micromachines 14 01008 g018
Figure 19. The voltage frequency response curve of the bistable at: (a) d = 8 mm; (b) d = 5 mm; (c) d = 4 mm.
Micromachines 14 01008 g019
Figure 20. (a) Expanded bandwidth vs. magnet separation distance at 0.9 g. (b) Voltage output vs. magnet separation distance at 0.9 g.
Micromachines 14 01008 g020
Figure 21. (a) The frequency-voltage, and (b) the frequency-power curves at 0.9 g excitation level and 9 mm separation distance at various resistances (R).
Micromachines 14 01008 g021
Figure 22. The frequency voltage curve at 9 mm of separation distance: (a) redvarious gap distances g i ; (b) various surface charge densities ( σ ).
Micromachines 14 01008 g022
Table 1. Physical and geometrical parameters to be used in the model.
ParametersSymbolValue
Beam (length × width × thickness) L × b × h ( 75 × 10 × 1 ) mm
Beam Young’s modulusE69 Gpa
Beam density ρ 2700 kg/m 3
Impact damping coefficient c i 3.2 c N.s/m
Impact stiffness coefficient k i 3.2 k e q N/M
PDMS layer thicknessT 1 × 10 3 m
ResistanceR10 M Ω
Magnets side length L m 8.0  mm
Magnetic moment q 1 = q 2 0.5  A 2 /m
PDMS (length × width × thickness) L p × b p × h p ( 20 × 20 × 1 ) mm
PDMS vacuum permittivity ϵ 0 8.854 × 10 12
Disclaimer/Publisher’s Note: The statements, opinions and data contained in all publications are solely those of the individual author(s) and contributor(s) and not of MDPI and/or the editor(s). MDPI and/or the editor(s) disclaim responsibility for any injury to people or property resulting from any ideas, methods, instructions or products referred to in the content.

