
Acid-Base and Photocatalytic Properties of the CeO2-Ag Nanocomposites
 ,
,  , , , and
Abstract
:1. Introduction
2. Materials and Methods
2.1. Synthesis of CeO2 Nanoparticles
2.2. Synthesis of Ag Nanoparticles
2.3. Synthesis of CeO2-Ag Nanocomposite
2.4. Research Methods
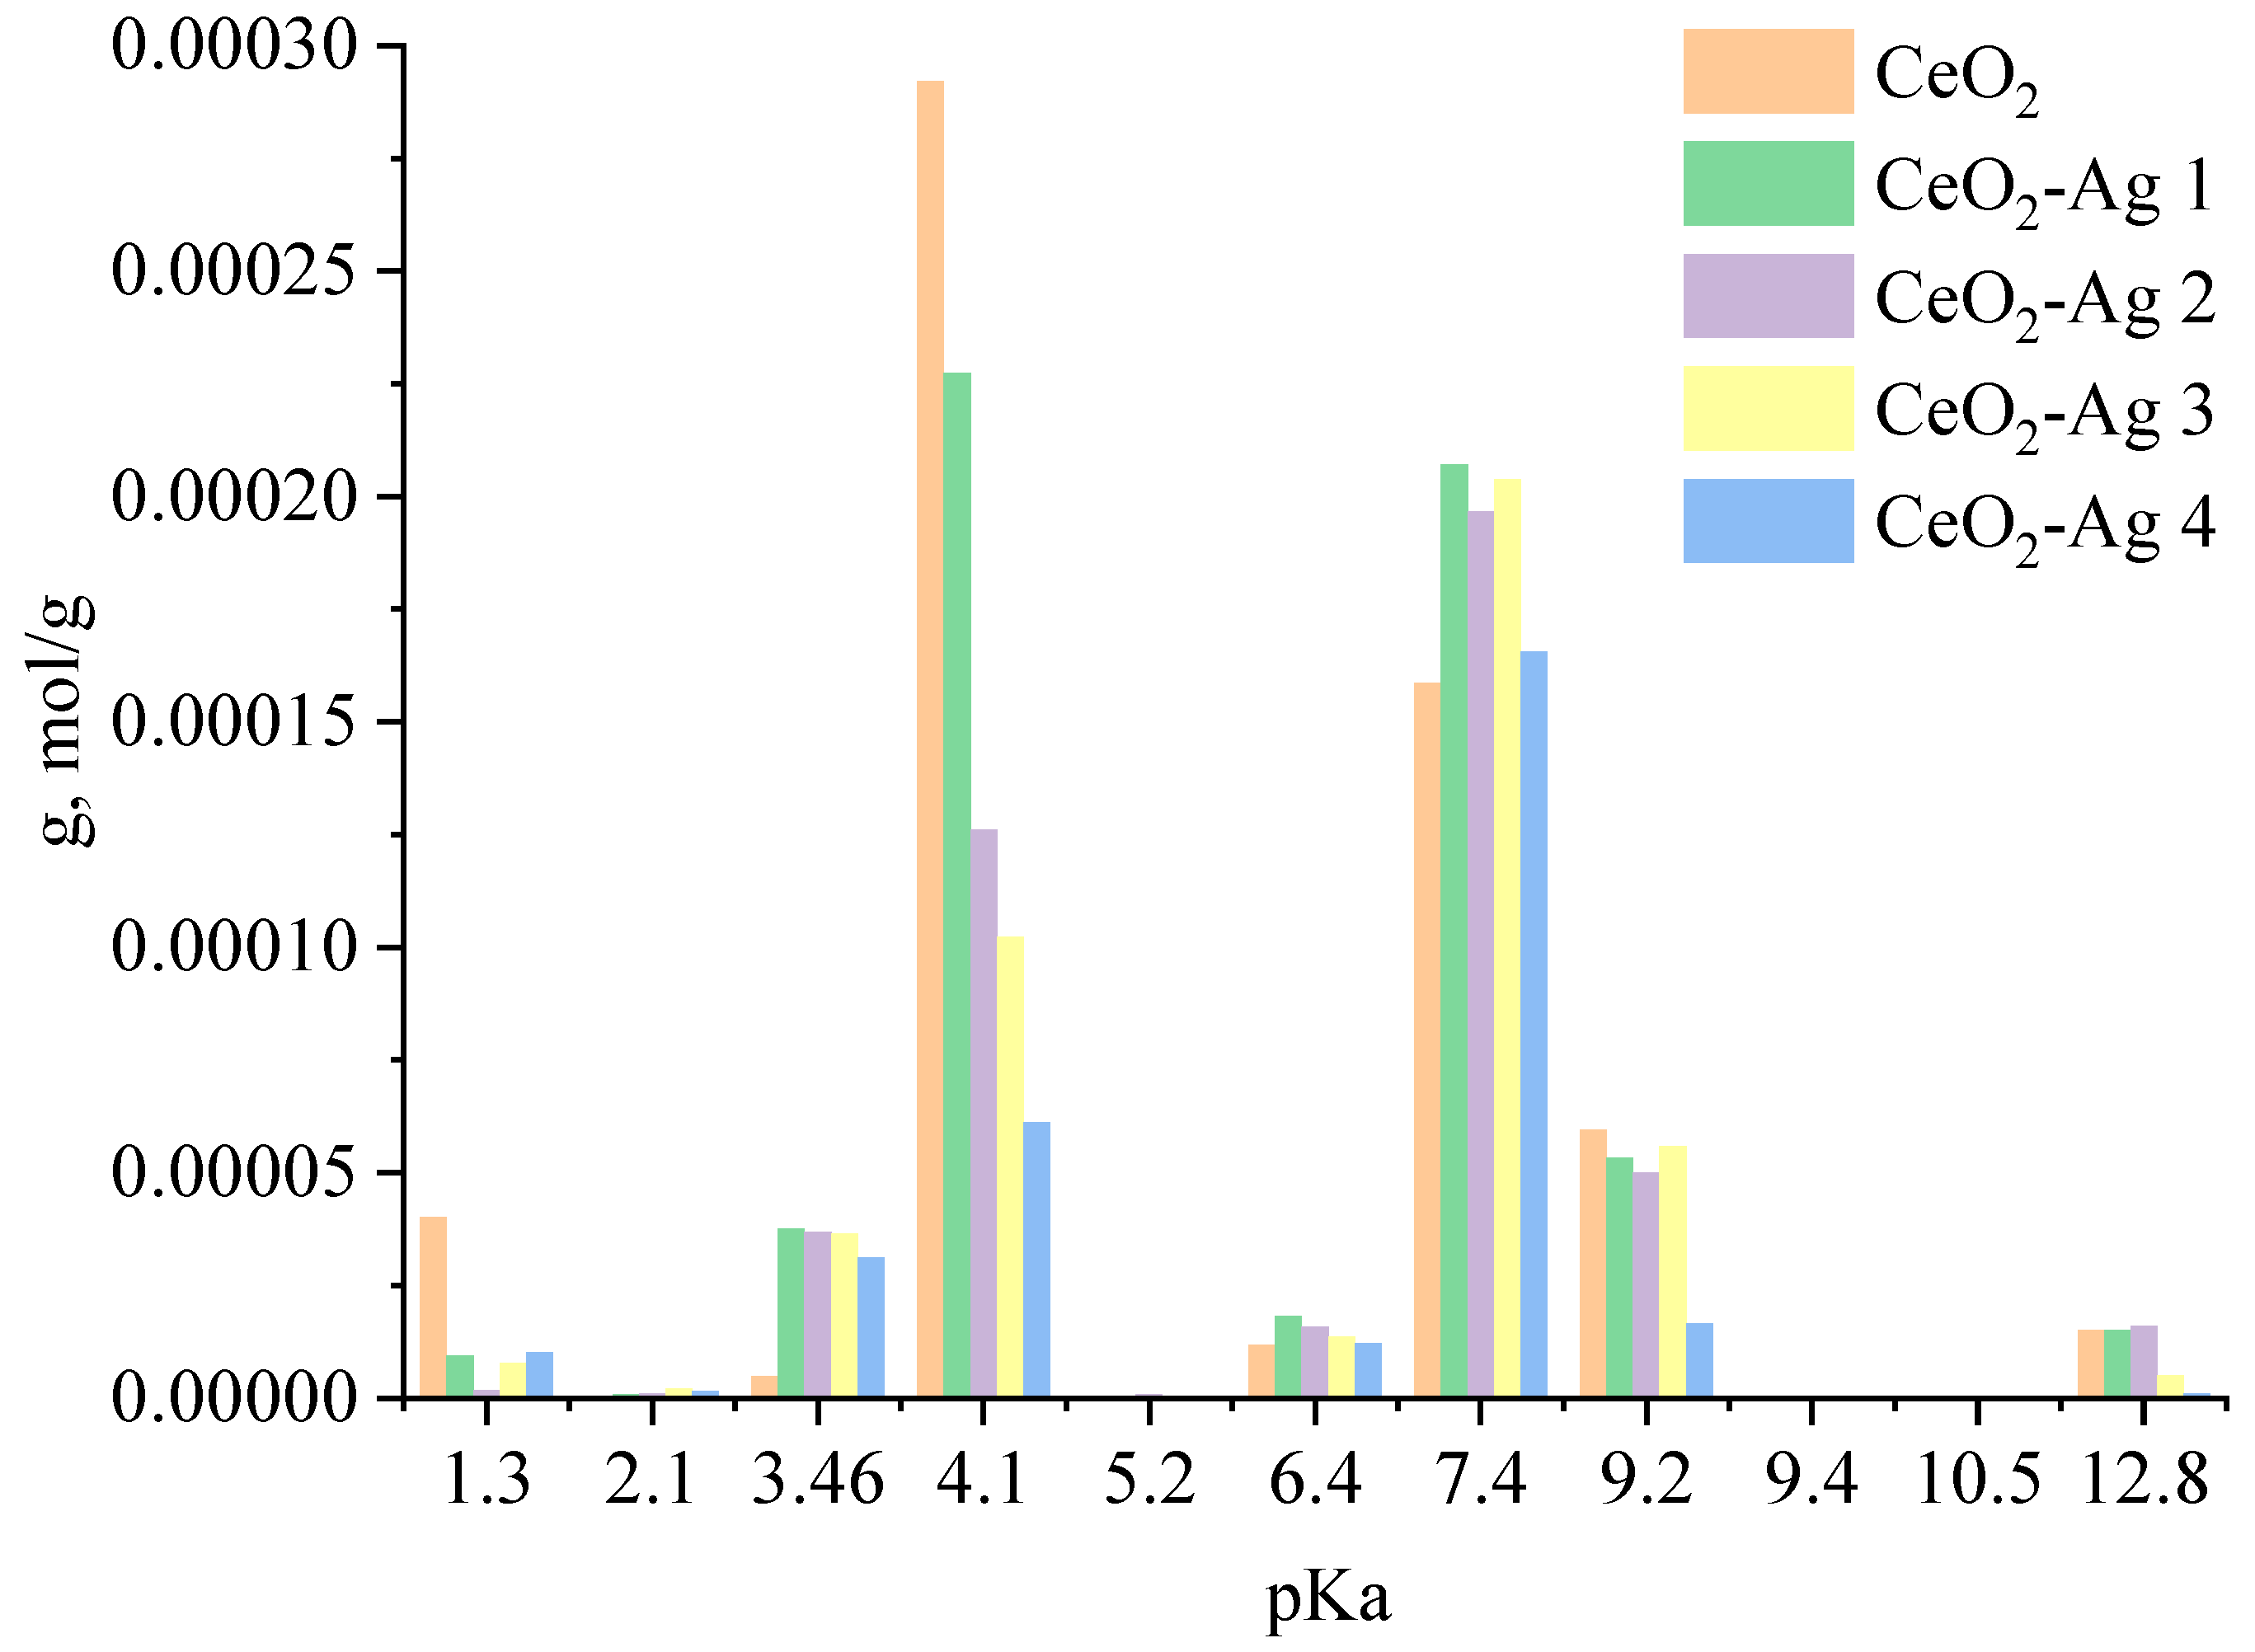
2.5. Indicator Method for Determining the Concentration of Acid-Base Centers
- Three parallel samples (0.1 g of the analyzed oxide powder + 3 mL of the indicator).
- Reference sample (0.1 g of the analyzed oxide powder + 2 mL of distilled water).
- A 3 mL solution of an indicator without the sample.
2.6. Determination of Photocatalytic Activity
3. Results and Discussion
4. Conclusions
Author Contributions
Funding
Data Availability Statement
Acknowledgments
Conflicts of Interest
References
- Nemiwal, M.; Sillanpää, M.; Banat, F.; Kumar, D. CeO2-Encapsulated Metal Nanoparticles: Synthesis, Properties and Catalytic Applications. Inorg. Chem. Commun. 2022, 143, 109739. [Google Scholar] [CrossRef]
- Das, H.T.; Dutta, S.; Das, N.; Das, P.; Mondal, A.; Imran, M. Recent Trend of CeO2-Based Nanocomposites Electrode in Supercapacitor: A Review on Energy Storage Applications. J. Energy Storage 2022, 50, 104643. [Google Scholar] [CrossRef]
- Zhang, L.; Ma, C.; Zhang, J.; Huang, Y.; Xu, H.; Lu, H.; Xu, K.; Ma, F. Enhanced NO2-Sensing Performances of CeO2 Nanoparticles on MoS2 at Room Temperature. Appl. Surf. Sci. 2022, 600, 154157. [Google Scholar] [CrossRef]
- Bakry, A.M.; Alamier, W.M.; Salama, R.S.; Samy El-Shall, M.; Awad, F.S. Remediation of Water Containing Phosphate Using Ceria Nanoparticles Decorated Partially Reduced Graphene Oxide (CeO2-PRGO) Composite. Surfaces Interfaces 2022, 31, 102006. [Google Scholar] [CrossRef]
- Zhao, Z.; Wu, S.; Liu, Q.; Yang, C.; Zou, Y.; Wan, P. Feasibility Assessment of CeO2 Nanoparticles as Aging-Resistant Agent of Asphalt. Constr. Build. Mater. 2022, 330, 127245. [Google Scholar] [CrossRef]
- Kravtsov, A.A.; Chikulina, I.S.; Vakalov, D.S.; Chapura, O.M.; Krandievsky, S.O.; Devitsky, O.V.; Lapin, V.A. Luminescence of YAG:Ce doped with silver nanoparticles. Phys. Chem. Asp. Study Cust. Nanostruct. Nanomat. 2021, 13, 220–227. [Google Scholar]
- Kravtsov, A.A.; Chikulina, I.S.; Kichuk, S.N.; Tarala, V.A.; Nikova, M.S.; Devitsky, O.V. Using Silver Nanoparticles for the Increase of YAG:Ce Luminescence. J. Phys. Conf. Ser. 2021, 2094, 22021. [Google Scholar] [CrossRef]
- Yusuf, A.A.; Dandakouta, H.; Yahuza, I.; Yusuf, D.A.; Mujtaba, M.A.; El-Shafay, A.S.; Soudagar, M.E.M. Effect of Low CeO2 Nanoparticles Dosage in Biodiesel-Blends on Combustion Parameters and Toxic Pollutants from Common-Rail Diesel Engine. Atmos. Pollut. Res. 2022, 13, 101305. [Google Scholar] [CrossRef]
- Adel, M.S.S.; Ameri, E.; Beni, A.A. Production of Modified Fuels Based on Isfahan Diesel by Adding CeO2 Nanoparticles, Surfactant and 2-Ethylhexyl Nitrate. Chem. Eng. Res. Des. 2022, 187, 196–205. [Google Scholar] [CrossRef]
- Du, C.B.; Law, Z.X.; Huang, R.Y.; Tsai, D.H. Aerosol-Phase Synthesis of Bimetallic NiCu Oxide-Decorated CeO2 Nanoparticle Cluster for Catalytic Methane Combustion. Adv. Powder Technol. 2022, 33, 103649. [Google Scholar] [CrossRef]
- Kanakaraju, D.; Kutiang, F.D.A.; Lim, Y.C.; Goh, P.S. Recent progress of Ag/TiO2 photocatalyst for wastewater treatment: Doping, co-doping, and green materials functionalization. Appl. Mater. Today 2022, 27, 101500. [Google Scholar] [CrossRef]
- Zhang, Q.; Li, J.; Xu, M. Ag-decorated ZnO-based nanocomposites for visible light-driven photocatalytic degradation: Basic understanding and outlook. J. Phys. D Appl. Phys. 2022, 55, 483001. [Google Scholar] [CrossRef]
- Xin, Y.; Zhang, N.; Lv, Y.; Wang, J.; Li, Q.; Zhang, Z. From Nanoparticles to Single Atoms for Pt/CeO2: Synthetic Strategies, Characterizations and Applications. J. Rare Earths 2020, 38, 850–862. [Google Scholar] [CrossRef]
- Cui, X.; Zhang, X.; Yang, Z.; Xiao, M.; Ren, J.; Xiao, X.; Yude, W. The Rod-like CeO2 Supported by the Low-Loading Au Nanoparticles for the Efficient Catalytic Oxidation of CO at Room Temperature. Int. J. Hydrogen Energy 2022, 47, 11813–11826. [Google Scholar] [CrossRef]
- Fandi, Z.; Ameur, N.; Brahimi, F.T.; Bedrane, S.; Bachir, R. Photocatalytic and Corrosion Inhibitor Performances of CeO2 nanoparticles Decorated by Noble Metals: Au, Ag, Pt. J. Environ. Chem. Eng. 2020, 8, 2–11. [Google Scholar] [CrossRef]
- Lunin, L.S.; Lunina, M.L.; Kravtsov, A.A.; Sysoev, I.A.; Blinov, A.V.; Pashchenko, A.S. Effect of the Ag Nanoparticle Concentration in TiO2–Ag Functional Coatings on the Characteristics of GaInP/GaAs/Ge Photoconverters. Semiconductors 2018, 52, 993–996. [Google Scholar] [CrossRef]
- Gvozdenko, A.A.; Siddiqui, S.A.; Blinov, A.V.; Golik, A.B.; Nagdalian, A.A.; Maglakelidze, D.G.; Statsenko, E.N.; Pirogov, M.A.; Blinova, A.A.; Sizonenko, M.N.; et al. Synthesis of CuO Nanoparticles Stabilized with Gelatin for Potential Use in Food Packaging Applications. Sci. Rep. 2022, 12, 12843. [Google Scholar] [CrossRef]
- Kütt, A.; Selberg, S.; Kaljurand, I.; Tshepelevitsh, S.; Heering, A.; Darnell, A.; Kaupmees, K.; Piirsalu, M.; Leito, I. PKa Values in Organic Chemistry—Making Maximum Use of the Available Data. Tetrahedron Lett. 2018, 59, 3738–3748. [Google Scholar] [CrossRef]
- Wang, S.; Zhou, S. Photodegradation of Methyl Orange by Photocatalyst of CNTs/P-TiO2 under UV and Visible-Light Irradiation. J. Hazard. Mater. 2011, 185, 77–85. [Google Scholar] [CrossRef]
- RGB-Converter. Available online: https://www.easyrgb.com/en/convert.php (accessed on 15 January 2023).
- CIE-1931 Chromaticity Diagram Tools. Available online: https://sciapps.sci-sim.com/CIE1931.html (accessed on 15 January 2023).
- Binet, C.; Badri, A.; Lavalley, J.C. A Spectroscopic Characterization of the Reduction of Ceria from Electronic Transitions of Intrinsic Point Defects. J. Phys. Chem. 1994, 98, 6392–6398. [Google Scholar] [CrossRef]
- Lopez, H.F.; Mendoza, H. Temperature Effects on the Crystallization and Coarsening of Nano-CeO2 Powders. Int. Sch. Res. Not. 2013, 2013, 208614. [Google Scholar] [CrossRef] [Green Version]
- Zhou, X.; Yang, Y.; Wang, J.; Ren, W.; Liu, S.; Zheng, C.; Gao, X. Enhancing Nitrobenzene Reduction to Azoxybenzene by Regulating the O-Vacancy Defects over Rationally Tailored CeO2 Nanocrystals. Appl. Surf. Sci. 2022, 572, 151343. [Google Scholar] [CrossRef]
- Iqbal, N.; Anastasiou, A.; Aslam, Z.; Raif, E.M.; Do, T.; Giannoudis, P.V.; Jha, A. Interrelationships between the structural, spectroscopic, and antibacterial properties of nanoscale (<50 nm) cerium oxides. Sci. Rep. 2021, 11, 20875. [Google Scholar] [CrossRef] [PubMed]


| No. | Indicators | pKa | λmax, nm |
|---|---|---|---|
| 1 | Brilliant green | 1.3 | 610 |
| 2 | Basic fuchsin | 2.1 | 540 |
| 3 | Methyl orange | 3.46 | 464 |
| 4 | Bromophenol blue | 4.1 | 590 |
| 5 | Methyl red | 5.2 | 530 |
| 6 | Bromocresol purple | 6.4 | 540 |
| 7 | Bromothymol blue | 7.4 | 540 |
| 8 | Neutral red | 9.2 | 430 |
| 9 | Phenolphthalein | 9.4 | 440 |
| 10 | Alizarin red | 10.5 | 425 |
| 11 | Indigo carmine | 12.8 | 610 |
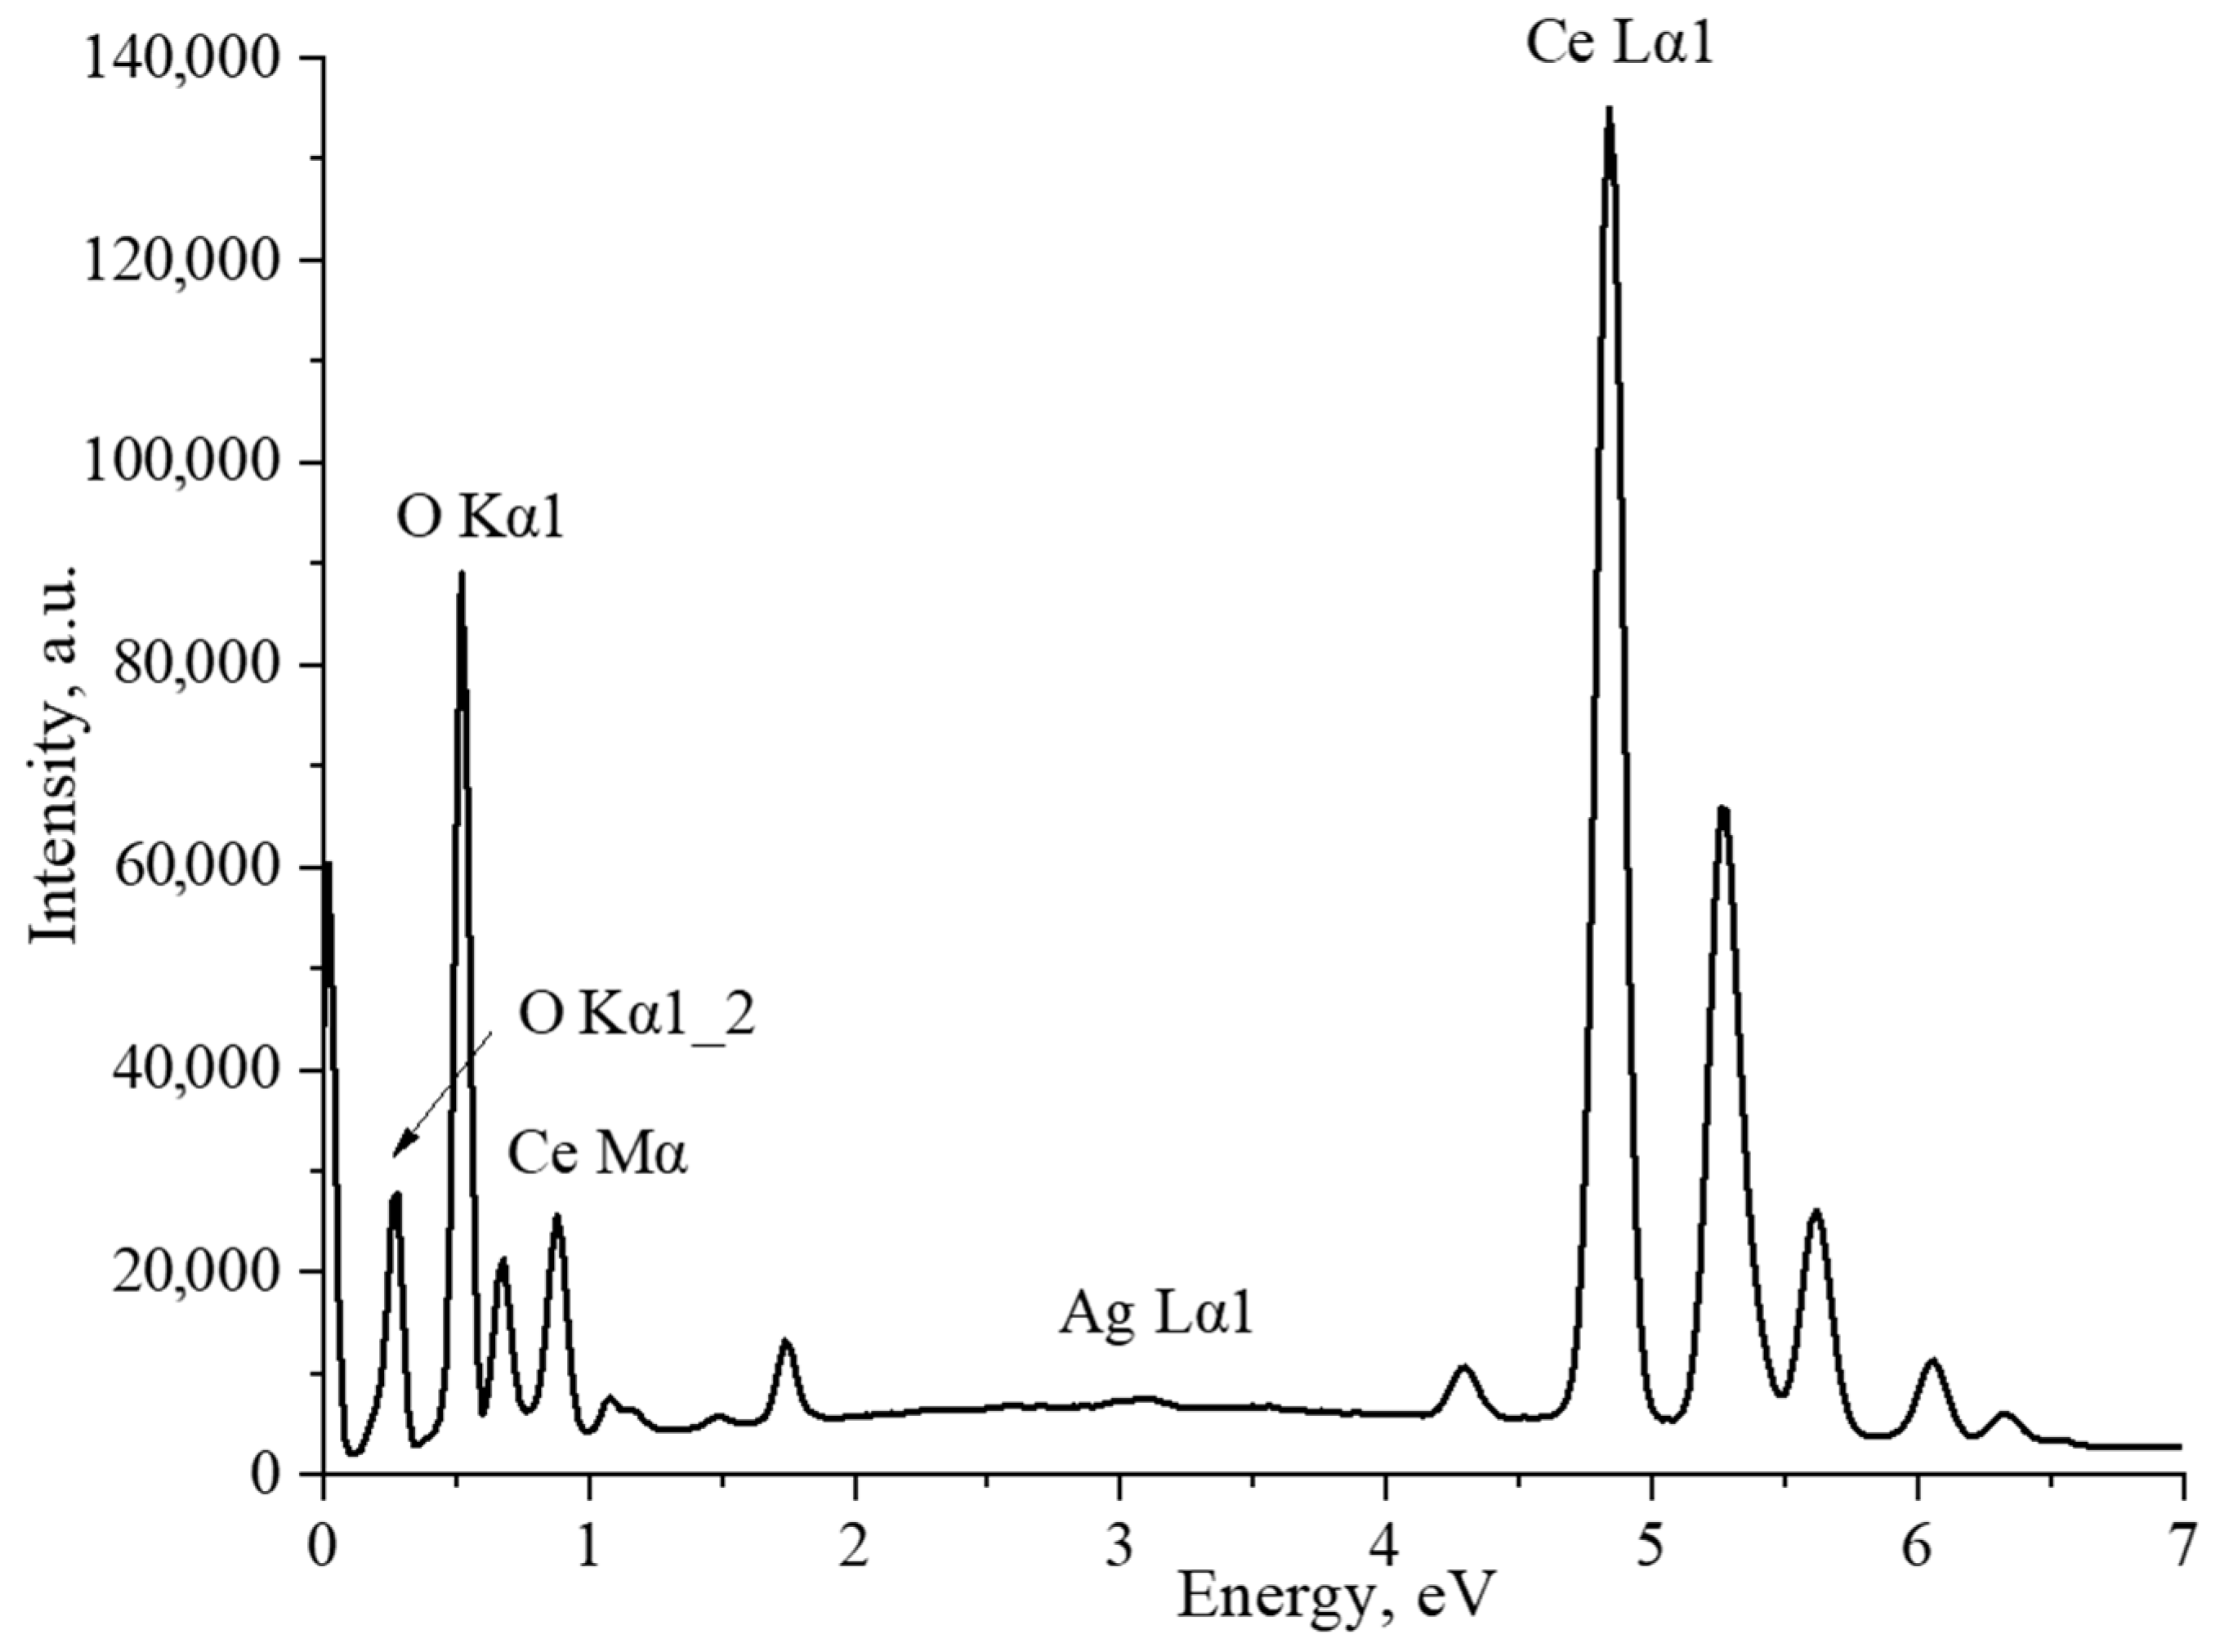
| Element | Type of Line | wt% | σ wt% | At.% |
|---|---|---|---|---|
| O | K-series | 15.43 | 0.05 | 61.49 |
| Ag | L-series | 0.20 | 0.04 | 0.12 |
| Ce | L-series | 84.37 | 0.06 | 38.40 |
| Summ. | 100 | 100 |
| Time, h | CeO2 | CeO2-Ag1 | CeO2-Ag2 | CeO2-Ag3 | CeO2-Ag4 |
|---|---|---|---|---|---|
| 0 |  |  |  |  |  |
| 1 |  |  |  |  |  |
| 2 |  |  |  |  |  |
| 4 |  |  |  |  |  |
| 6 |  |  |  |  |  |
| 10 |  |  |  |  |  |
Disclaimer/Publisher’s Note: The statements, opinions and data contained in all publications are solely those of the individual author(s) and contributor(s) and not of MDPI and/or the editor(s). MDPI and/or the editor(s) disclaim responsibility for any injury to people or property resulting from any ideas, methods, instructions or products referred to in the content. |
© 2023 by the authors. Licensee MDPI, Basel, Switzerland. This article is an open access article distributed under the terms and conditions of the Creative Commons Attribution (CC BY) license (https://creativecommons.org/licenses/by/4.0/).
Share and Cite
Kravtsov, A.A.; Blinov, A.V.; Nagdalian, A.A.; Gvozdenko, A.A.; Golik, A.B.; Pirogov, M.A.; Kolodkin, M.A.; Alharbi, N.S.; Kadaikunnan, S.; Thiruvengadam, M.; et al. Acid-Base and Photocatalytic Properties of the CeO2-Ag Nanocomposites. Micromachines 2023, 14, 694. https://doi.org/10.3390/mi14030694
Kravtsov AA, Blinov AV, Nagdalian AA, Gvozdenko AA, Golik AB, Pirogov MA, Kolodkin MA, Alharbi NS, Kadaikunnan S, Thiruvengadam M, et al. Acid-Base and Photocatalytic Properties of the CeO2-Ag Nanocomposites. Micromachines. 2023; 14(3):694. https://doi.org/10.3390/mi14030694
Chicago/Turabian StyleKravtsov, Alexander A., Andrey V. Blinov, Andrey A. Nagdalian, Alexey A. Gvozdenko, Alexey B. Golik, Maxim A. Pirogov, Maxim A. Kolodkin, Naiyf S. Alharbi, Shine Kadaikunnan, Muthu Thiruvengadam, and et al. 2023. "Acid-Base and Photocatalytic Properties of the CeO2-Ag Nanocomposites" Micromachines 14, no. 3: 694. https://doi.org/10.3390/mi14030694