Review

Review on Bubble Dynamics in Proton Exchange Membrane Water Electrolysis: Towards Optimal Green Hydrogen Yield

Department of Biomedical Engineering, Soonchunhyang University, 22 Soonchunhyang-ro, Asan 31538, Chungnam, Republic of Korea
*
Author to whom correspondence should be addressed.
Micromachines 2023, 14(12), 2234; https://doi.org/10.3390/mi14122234
Submission received: 13 November 2023 / Revised: 7 December 2023 / Accepted: 7 December 2023 / Published: 12 December 2023
(This article belongs to the Special Issue Micro Thermal Devices and Their Applications)

Abstract

:
Water electrolysis using a proton exchange membrane (PEM) holds substantial promise to produce green hydrogen with zero carbon discharge. Although various techniques are available to produce hydrogen gas, the water electrolysis process tends to be more cost-effective with greater advantages for energy storage devices. However, one of the challenges associated with PEM water electrolysis is the accumulation of gas bubbles, which can impair cell performance and result in lower hydrogen output. Achieving an in-depth knowledge of bubble dynamics during electrolysis is essential for optimal cell performance. This review paper discusses bubble behaviors, measuring techniques, and other aspects of bubble dynamics in PEM water electrolysis. It also examines bubble behavior under different operating conditions, as well as the system geometry. The current review paper will further improve the understanding of bubble dynamics in PEM water electrolysis, facilitating more competent, inexpensive, and feasible green hydrogen production.

1. Introduction

Over the years, global energy consumption has risen sharply, primarily because of population growth and increased living standards. The need for substituting fossil fuels with clean energy is urgent due to global warming and growing environmental issues. It has been predicted that the amount of energy generated from renewable sources will rise by 2.3% by 2040, accounting for 31% of all electricity produced globally [1]. The Paris Agreement Act mandates that the increase in world temperature needs to drop below 2 degrees by 2050 by adopting the green hydrogen revolution for sustainable energy for the decarbonization process to combat global warming [2]. Although different methods are available to produce hydrogen, the one that is derived from renewable resources is gaining momentum as a cleaner energy source that could substitute for conventional fossil fuels [3]. Compared to other clean energy sources, hydrogen tends to be greener, and it creates negative carbon as a byproduct [4]. Water electrolysis has been proven to be more dependable than traditional methods of hydrogen production, offering a high level of safety, more sustainability, and a purity of up to 99.99% [5]. Hydrogen is widely used in conventional industries such as petroleum, petroleum derivatives, and chemical fertilizers [6]. As a result of recent progress in research and development on electric vehicles powered by fuel cells that discharge zero carbon emissions, the demand for hydrogen has substantially increased [7]. With continued scale production, the price of green hydrogen produced using water electrolysis has been forecasted by CSIRO to become competitive with thermochemical processes by 2025 [8]. The supply of sustainable hydrogen has been limited by the high cost of infrastructure setting [9]. However, with the aid of cutting-edge technology, it can be much enhanced in design, which will undoubtedly make a beneficial impact on the water electrolysis process to harvest more renewable energy [10].
Water can be electrolyzed using different approaches, including alkaline water electrolysis (AWE) [11], anion exchange membrane water electrolysis (AEM) [12], proton exchange membrane water electrolysis (PEM) [13,14], and solid oxide electrolysis (SOE) [15]. PEM water electrolysis has been shown to be more cost-effective than the other techniques. It can also work at higher current densities, whereas others are more prone to rapid changes in the current load. Furthermore, PEM can operate substantially faster than AWE and SOE, which take longer time for operations [16]. In the PEM water electrolysis, water is separated as oxygen and hydrogen through electrochemical processes. Water is supplied from the anode side and then it moves between the catalyst layer and the liquid/gas diffusion layer, thus reacting with the catalyst, resulting in the breaking of water into oxygen, proton, and electron [17]. Protons then leave the membrane and fuse with the electrons from the applied current density to create hydrogen on the cathode side, while gas bubbles simultaneously enter the flow field on the anode side [18]. On the anode side, the solvated proton migrates to the cathode side, and it is accompanied by a water molecule that flows from the anode to the cathode side region. As a result, even in the absence of water from the anode during the PEM electrolyzer operation, the PEM remains hydrated [19]. The various flow patterns in the PEMWE channel are shown in Figure 1a,b [20].
For flexible use, it is critical to address these challenges by increasing current densities and system efficiency to reduce investment costs and broaden the range of uses for this innovation [21]. The formation of gas bubbles at the catalyst layer in the anode region is one of the key issues. It can interrupt effective contact between the catalyst and water, decreasing the electrochemical reaction on the anode side [22]. Thus, it is extremely important to select a highly efficient catalyst for faster removal of gas bubbles from the system [23]. When gas produced by the catalyst exceeds the capacity of flow channels, a bubble blockage may occur. This can be estimated based on the cross-sectional area and water flow rate of channels [24]. Studying bubbles is crucial in proton exchange membrane water electrolysis (PEMWE) because when bubbles develop at the catalyst layer, they can obstruct tiny pores and restrict water flow, which can increase equipment costs and affect performance efficiency [25,26]. Furthermore, when the bubble separates from the electrode surface, the empty area formed by the prior bubbles gets filled, resulting in a swirling motion [27]. The growth of bubbles inside tiny pores can induce a pressure drop, which can cause considerable mechanical stress on the catalyst surface (CS), resulting in the gradual deterioration of a catalyst structure [28]. Gas bubbles generated from the CS will pass through the liquid/gas diffusion layer (LGDL) and eventually enter the flow channel, thus creating two-phase flows such as bubbly, slug, and annular flows [29]. When the applied current density is lower, bubble coalescence occurs at a low frequency, resulting in smaller bubbles within the channel, and this flow is considered as bubbly flow [30]. As the current density increases, bubbles combine more frequently, forming a slug. As gas density increases, the slug develops into an annular flow regime. The gas phase then occupies almost the entire channel length, forcing water toward the channel wall [17]. The various flow patterns in the PEMWE channel are shown in Figure 1a, b. These flow regimes depend on different factors such as mass flux and superficial velocity of liquid and gas phases [31]. The flow pattern has a significant impact on water management and distribution because it controls how the reactant and product travel throughout the electrolysis operation. In PEM water electrolysis, the channel wall must be kept wet to prevent the degradation of the membrane in the cell. The transaction from annular to mist flow can result in insufficient liquid wet on the channel walls and it can cause a high risk of damage to the membrane [29]. Chien and Ibele [32] calculated this value as 1.199 × 10⁶ to predict the transaction from annular to annular–mist flow in two-phase flow systems. This criterion value was developed for the vertical flow in larger pipe diameters, but this can also be used for predicting when the flow regime shifts from annular to mist flow in PEM water electrolysis [29]. The efficiency of the electrolysis system depends on how fast the gas bubbles are controlled and removed from the membrane surface and the flow channels. Figure 2 shows how bubbles are formed in the catalyst layer based on hydrophilic and hydrophobic surfaces. The formation of bubbles on the hydrophilic surface remains spherical [33]. Jiang et al. [34] have studied how different combinations of contact angles at the PTL and catalyst layer can impact cell performance at a constant voltage of 2 V. For the dividing line between hydrophilic and hydrophobic surfaces, they used a contact angle of 90°. They found that the catalyst layer with a hydrophilic surface was 12.6 times higher than that with a hydrophobic surface. The main reason for this finding is that in a hydrophilic condition, the volume of gas concentration within the catalyst layer is low, which can reduce the bubble effect and hence mass transfer losses. This has assisted in understanding that the electrochemical reaction occurs not only on the catalyst layer (CL) but also at the CL–LGDL contact [35]. Understanding the behavior of bubbles at CL–LGDL will provide further details about how bubbles develop, grow, and detach from a cell. With the aid of this knowledge, the distribution of a catalyst and the design of a cell may be enhanced, which can increase the efficiency of the electrochemical process inside the cell.
During the process of electrolysis, bubbles can generate motion in the surrounding liquid, which can improve mixing and mass transfer rates [27,36]. Identifying how bubbles behave will help a cell function better, allowing for the detection of any detrimental effects on the system and the development of new, innovative electrochemical technologies that will lead to more sustainable and effective energy [37]. The different operating conditions such as current density, temperature, and water flow rate can also impact the stability of the PEMWE system. Based on PEMWE modeling, it has been established that the performance of a cell is dependent on the amount of water input and that both temperature and liquid flow rate can affect current density [38,39]. As the liquid flow rate increases, larger bubbles will disperse into smaller sizes, resulting in a reduction in slug flow. However, as current density and temperature increase, larger bubbles and longer slugs will form inside the cell. With an increase in current density, a substantial number of bubbles will amalgamate, resulting in the production and wide distribution of gas bubbles. This causes bubbles to migrate toward their larger neighbors, resulting in rapid growth [40]. When flow velocity increases, bubbles begin to move faster, causing large slug gas to split up and move along the flow velocity. Li et al. [41] and Ojong et al. [42] have shown that a higher liquid velocity on the anode side can facilitate bubble separation, thus reducing mass transport loss. Therefore, understanding bubble behavior is critical for improving the mobility of this process. This understanding will aid in the development of more effective and efficient electrochemical systems for the PEM electrolysis process.
In this review paper, the core principles of PEM water electrolysis are outlined along with a comparison with PEM fuel cells. It also highlights various materials utilized for constructing PEM water electrolysis, especially the selection of appropriate materials, such as current distributor plates, porous transport layers, and catalyst-coated membranes. The most significant focus of this article is based on the role of the dynamics of gas bubbles in PEM water electrolysis, concentrating on how bubbles nucleate, grow, and detach during the process. This study also examines various losses caused by the instability of bubbles on the electrode surface, such as activation, ohmic, and diffusion. An in-depth study of bubble dynamics in flow channels, catalyst layers, and PTLs is conducted. Different techniques available to capture bubble images are also presented. The outcomes of this research will aid in improving bubble management in PEMWE and the effectiveness and scalability of green hydrogen production by water electrolysis.

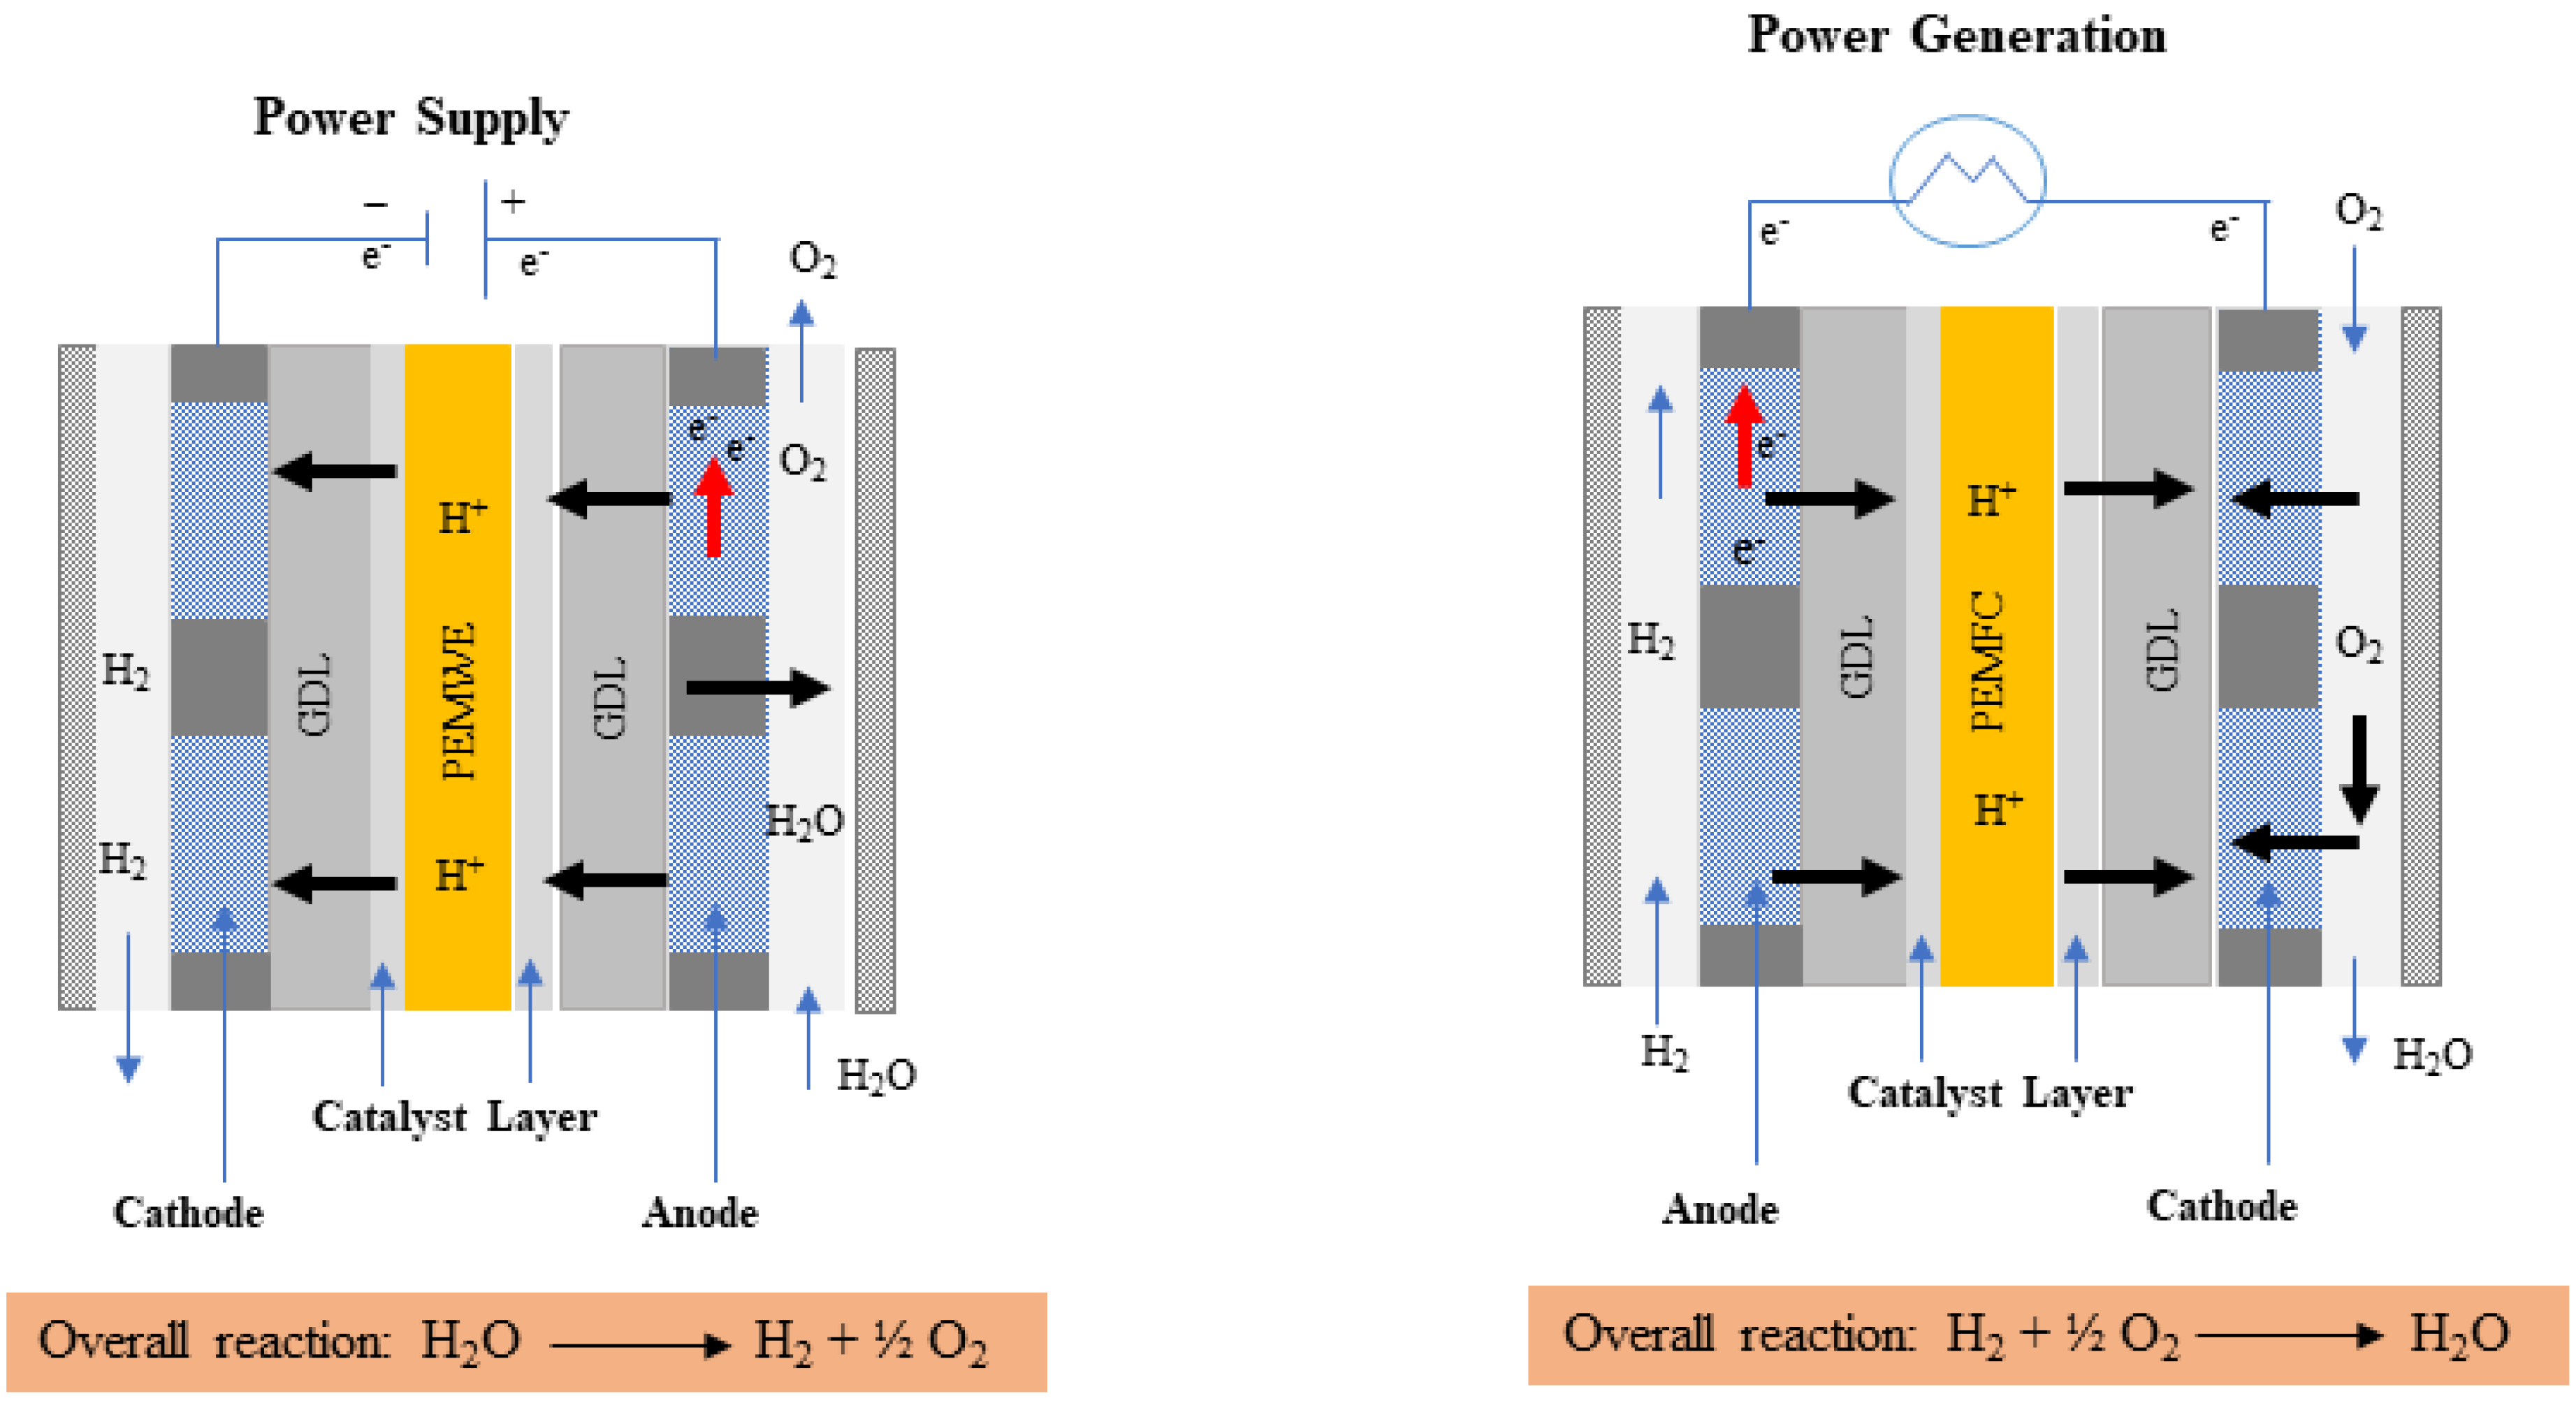
2. Basic Principle of PEM Water Electrolysis and PEM Fuel Cells

The working mechanism of PEM water electrolysis is the same as that of PEM fuel cells as both use solid membranes to exchange protons between anode and cathode sides. However, their purposes and directions of electrochemical processes differ. In PEM water electrolysis, electric energy is used to split water into oxygen and hydrogen to produce hydrogen gas toward the cathode. However, in a PEM fuel cell, electricity is generated by introducing hydrogen and oxygen from both channels with water being the only byproduct [43]. When hydrogen gas enters the anode catalyst layer, it splits into two parts. One part generates a proton (H+), which travels to the cathode via the proton exchange membrane. The other element is converted into an electron (e), which travels via an external circuit and offers an electric current [44]. In a PEM water electrolysis, the method involves supplying electrical current within, which includes the end plate, bipolar plate, GDL, MEA, and catalyst layer. Table 1 presents the advantages and disadvantages of PEM water electrolysis and PEM fuel cells. When water is introduced into the anode region, it undergoes oxidation and forms oxygen, hydrogen ions, and electrons, which is shown in Equation (1). After splitting water molecules (H2O) into individual parts, ions with a positive charge (H+) will react with water molecules to generate hydrated hydrogen ions (H+. xH2O) [45]. These hydrated hydrogen ions subsequently move through the proton exchange membrane and enter the cathode (Equation (2)) to produce hydrogen. The overall reaction is presented in Equation (3) [46].
Anode   side :   2 H 2 O     O 2 + 4 H + + 4 e
Cathode   side :   4 H + + 4 e 2 H 2
Overall :   H 2 O H 2 + 1 2 O 2
Contrary to the conventional approach, which requires an electrolyte solution, PEM water electrolysis uses a simple proton exchange membrane. Figure 3 presents a schematic illustration of the PEM of the water electrolysis and fuel cell. The thin membrane would allow the positively charged particle to move freely, minimizing the restriction on mass transfer. Additionally, the electrolyzer process uses clean water rather than the substantial electrolyte solutions necessary for optimal electronic conductivity.

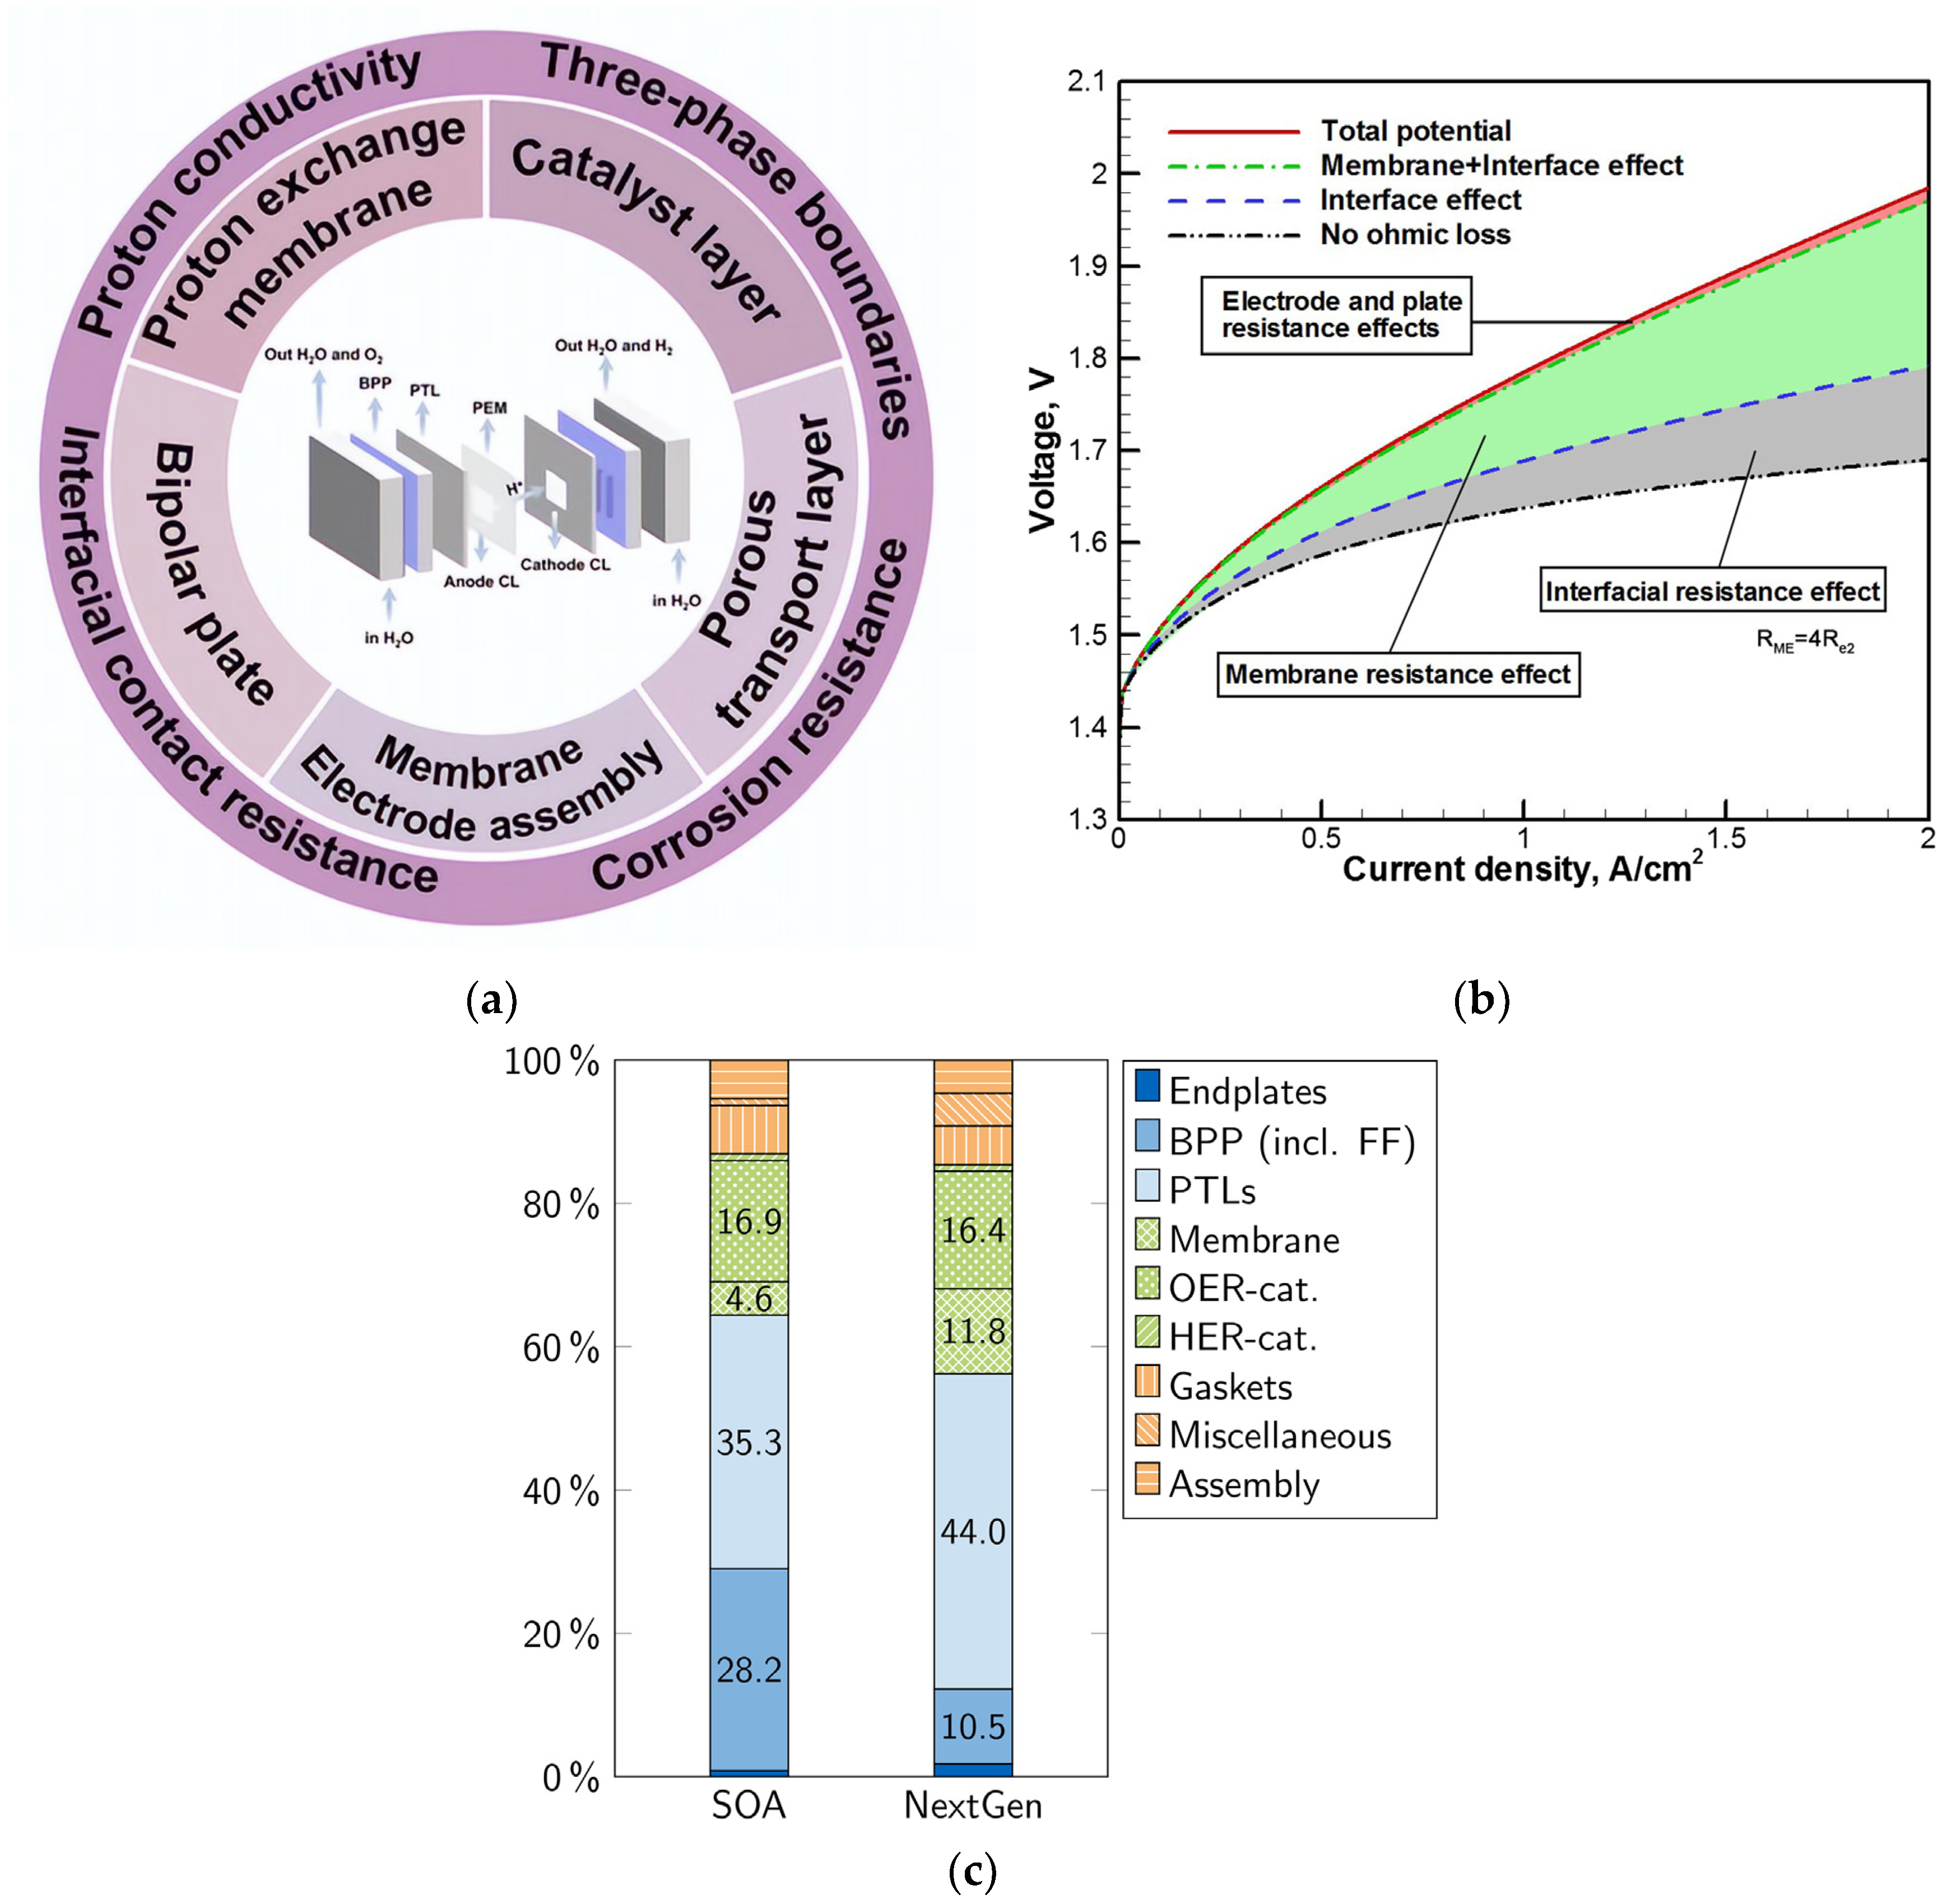
Materials of Construction

In PEMWE systems, the proton exchange membrane (PEM) works as a unique polymer conductor that allows protons to pass while blocking gases from a crossover. The polymer material used exhibits a high ionic conductivity. With advances in the PEM water electrolysis technology, some studies have been carried out at high current densities of 10 A cm−2 at 80 °C [50]. However, the biggest impediment to the commercialization of PEM water electrolysis is the high cost of the construction materials used. Therefore, it becomes critical to investigate innovative materials suitable for PEMWE. A schematic diagram of the overall components of the PEM water electrolysis is presented in Figure 4a. PEM materials include the current distributor plates, porous transport layer, catalyst-coated membrane, and bipolar plates [51]. Typically, Ti material is used for making current collector/flow field patterns as it offers strong resistance against corrosion. It is also well-suited for high voltage above 2 V, especially towards the anode side where oxidation occurs [52]. The Ti plates used are generally coated with precious metals like gold and platinum [53,54]. The following shows percentages of the costs of the stack components: MEA, 36%; PTLs, 32%; BPPs, assembly process, 8%; and stack miscellaneous, 13% [55]. The effects of different components such as electrode and plate resistance, membrane resistance, and interfacial resistance that contribute to the overall energy losses are shown in Figure 4b [56]. Cost analysis of the current generation of PEM water electrolysis reveals that PTLs and BPPs account for a significant percentage of the cell costs. Figure 4c illustrates that cost reductions can be anticipated for some components, especially BBP and catalyst loading costs, of the next-generation stack system. However, some other components such as PTLs and end plates are predicted to remain unchanged despite these reductions, which may raise their cost share in future cells.
IrO2 catalyst is doped with 5% Ti-SnO2, which shows a larger area available for catalyst reaction [57]. As shown in Figure 5a,b, IrO2 doped with Ti-SnO2 and Pt/C (20% wt. of Pt) outperformed commercial IrO2. It also exhibited better durability and prolonged lifespan in the water electrolysis process compared to normal IrO2 catalysts. Once water enters the anode side, oxygen and protons are generated at the OER. The proton is eventually moved, where it interacts with an electron to form hydrogen at the cathode side [58]. OER refers to the process that produces oxygen on the anode, while HER refers to the process of generating hydrogen on the cathode. The HER process is the primary essential reaction required to produce hydrogen gas from electrolysis. Platinum metal groups (PGM) such as Pt, Ru, Pd, and Ir are common catalysts used in HER due to their electrochemical resilience in acidic conditions [58,59]. However, PGM have a low supply and high price, so there is significant interest in researching alternate catalyst materials [60]. Apart from the PGM, there are other alternative catalyst materials such as hybrid catalysts (i.e., Cl-MoSe2 and Cl-metal oxide hydr(oxy)oxide) [61], Ru dopped on Ti3C2Tx and Co-N-C [62,63], transition metals (Fe, Co, Zn, Cd) [64], high-entropy alloys (such as CoCrFeNiAl) [65], atomically dispersed catalysts (Ni, Co, Fe, Mo) [66,67,68], and metal-free catalysts (e.g., single-walled carbon nanotube, graphene, red phosphorous) [69,70,71,72]. Some studies have also reported that IrP2-rGO and single-wall carbon nanotubes/exfoliated MoSe2 doped with CdCl2 exhibit good performance in HER as shown in Figure 5c,d [61,73]. Bipolar plates with flow channels play a significant role in PEM water electrolysis. They are utilized for eliminating gases, conveying heat and electric current, and maintaining the general stability of the system [58]. Three different materials (Ti, stainless steel, and Au coated with Ti) are used as BPPs for testing corrosion resistance as shown in Figure 6a. The results of testing the corrosion resistance showed that the uncoated material stainless steel was more prone to corrosion, while the coated Au-Ti significantly lowered the interfacial resistance [74]. Thus, Au-Ti exhibits a strong corrosion resistance which in turn can enhance the electrical conductivity between the plates and other components in the cell. Another study has incorporated TiN-C and compared it with a conventional Ti BP through a test conducted at 80 °C for 300 h [75]. It showed that the corrosion resistance and long-term stability of bipolar plates in PEMWE systems could be enhanced by coating with TiN-C 400, which exhibited more positive conductivity and durability than the normal Ti BP, as shown in Figure 6b. Rojas et al. [76] have used different coated materials for BPs, such as CrN-TiN, bare stainless steel, TiN-Stainless steel 316L/Stainless steel 904L, Ti/TiN-Stainless steel 316L/Stainless steel 904L, TiN-Stainless steel 321, Ti/TiN and Ti monolayers on Stainless steel 321, and TiN monolayers. The use of a parallel plate attached to the BBP results in quicker bubble elimination [77]. Another study has used an all-in-one bipolar electrode where different components are combined to make a single bipolar electrode with an ultra-catalyst loading of 0.2 mg Pt/cm2, significantly lower than the 3.0 mg Pt/cm2 of normal CCM [78]. They used a pin-type flow channel for the effective transport of bubbles inside the channel. A BP without flow channels may significantly lower cell costs. However, it may introduce other issues such as increased pressure drop, which could inhibit the removal of bubbles within the mass transport area [42]. Another study has used the cathode side with a bipolar plate made of Ti metal using 10 parallel flow channels to improve the pathway for effective electron movement and heat management during the evolution of the hydrogen bubble. This BP can perform heat dissipation during electrochemical reactions, preventing an excessive rise in temperatures. The IrRuOx catalyst of 3.0 mg/cm2 was coated on the anode side and 3.0 mg/cm2 of Pt black on the cathode side of the MEA [5]. Table 2 presents the different materials used for PEM water electrolysis owing to their tensile strength, substantial expansion, adequate flexibility, and low cost. While titanium alloys have strong corrosion resistance and aluminum has equivalent qualities, stainless steel achieves a satisfactory equilibrium in mechanical performance with easy manufacturing and low product cost. It has the potential for potent bipolar plate fabrication. However, when exposed to H2 gas, particularly at temperatures above 80°, Ti BPP forms hydride (TiH2), causing H2 embrittlement [79,80]. This may generate some fissures in the material, which can influence the nucleation and growth of bubbles on electrode surfaces. Depending on how unstable the gas evolution is, the bubbles that form on the electrode surfaces may react significantly. Effective measurement of the pH value can be achieved by measuring both the anode and cathode electrodes [79].
Figure 4. (a) Overall components of a PEM water electrolysis. Copyright 2023, with permission from Wiley [51]. (b) Influence of different component resistance in PEM water electrolysis. Copyright 2015, with permission from Elsevier [56]. (c) Cost analysis of PEM water electrolysis stack components of present and next-generation systems. Copyright 2023, with permission from Elsevier [81].
Micromachines 14 02234 g004

3. Effects of Bubbles on Polarization Losses in PEM Water Electrolysis

The operating voltage at a certain current density can be used to investigate the efficiency of PEM water electrolysis. The efficiency loss in the cell can be identified by measuring the difference between the actual voltage and the equilibrium voltage for a specific current density [92]. This loss can be obtained from activation overpotential, ohmic overpotential, and mass transport losses. A polarization curve, which depicts the relationship between them, is shown in Figure 7. As depicted in the figure, the mass transport loss in PEM water electrolysis is found to be small while the activation overpotential is greater because a large amount of energy is used during the electrochemical reaction. The overpotential of a single PEM electrolyzer cell is influenced by different factors such as the activation overpotential, ohmic loss overpotential, and diffusion overpotential, which is expressed as follows [56]:
V = V o c v + V a c t + V o h m + V m a s s
where Vocv is the open circuit voltage, Vact is the activation overpotential which is the additional voltage desirable for activating an electrochemical reaction, Vohm is the ohmic overpotential caused by the resistance offered due to the movement of charged particles, and Vmass is the diffusion overpotential due to mass transfer. Bubbles occur at the electrodes during the water-splitting process, which has a significant impact on the overall system losses [37].
It has been found that when the bubbles remain on the electrode surface, the reaction kinetics are hampered and the current flow in water is decreased, resulting in activation losses. Furthermore, if the catalyst coating on both the anode and cathode sides is exceeded in ionomer material, it might impede proton ion transit, resulting in voltage losses [93]. To comprehend these implications, HER in an acid medium can be considered where the H+ ion traveled from the anode to the cathode area. Charged particles (H+) can then change into H2 gas at the cathode catalyst surface and migrate away from the electrode surface, allowing the new gas bubble to form [94,95].

3.1. Impact of Bubbles on Activation Potential

The activation potential (Vact) measures the degree of kinetic loss during electrochemical reactions [16]. Activation loss takes place on the electrode surface. It is also influenced by other factors including the number of surface-coverage bubbles [96]. With an increase in the number of bubbles on the electrode, the activation overpotential also increases to overcome the resistance offered by the bubbles. Based on the numerical study for the effect of bubble evaluation performed, low temperatures (30 °C and 60 °C) require higher activation overpotential, whereas high temperatures (90 °C) require less additional voltage energy when there is sufficient bubble coverage [97]. In many industrial processes, an excessive number of bubbles on the electrode surface might impede the proper reaction of the reactants and the product sides [98]. Bubble coverage on the electrode is also influenced by different factors such as current density and the nature of an electrode surface. Bubble coverages on electrodes need to be managed not only for activation losses but also for other losses such as ohmic losses and mass transport losses [37,99]. As a result, it is critical to determine how much of the active electrode area is covered by the surrounding bubbles, which is expressed as follows [100]:
i a c t = I 1 Θ A p r o j = i 1 Θ
where I is the applied current, Aproj is the projected electrode area, and Θ is the portion of the electrode surface covered by bubbles. Therefore, the activation overpotential (Vact) for both the anode and the cathodic side is expressed as follows [101,102,103]:
V a c t = R T α Z F ln i θ ¯ i 0 T
where R is the gas constant, Z is the stoichiometric number that denotes the number of electrons transferred over a specific electrochemical reaction, α is the charge transfer coefficient (CCC) of the anode and cathode side and θ ¯ is the anodic and cathodic activation fraction.

3.2. Impact of Bubbles on Ohmic Overpotential

The additional energy required by the system to overcome the impedance produced by protons as they move over the membrane electrode is known as the ohmic overpotential. Ohmic losses can result from both electronic losses and ionic losses. Electronic losses occur when the electric current faces resistance in components such as bipolar plates, electrodes, and current collector plates [104]. Conversely, the ionic losses are linked to the resistance faced by the proton as it transfers through the membrane. The nature of the material used for fabrication and the method employed during the process are key factors that determine how much overpotential energy is required [105]. Ohm’s law is the function of total resistance to that of current density, which is expressed as [106]
V o h m = I R t o t a l = I ( R e + R i )
where I is the current density and Re and Ri are the resistance contributed by electronic and ionic.
Increased gas evolution can significantly increase the number of bubbles coverage on the electrode surface, which may contribute to ohmic losses [107]. The formation of bubble layers on the electrode surface may hinder direct contact between the electrode and electrolysis by blocking a portion of the active electrode surface area for gas evolution, resulting in a decrease in electrode efficiency [24]. Proper bubble management can effectively control gas evolution and enhance electrolysis. Increased gas evolution can significantly increase the number of bubbles on the electrode surface, which can lead to increased ohmic losses [107]. In PEM water electrolysis, the ability of the ionomer to conduct the proton is influenced by the presence of water. A low proton conductivity can result in decreased ion transfer across the membrane, which can increase ohmic losses within the cell [92].

3.3. Impact of Bubbles on Mass Transport Overpotential

This is also referred to as mass transport overpotential, which corresponds to the additional voltage energy desired to overcome the restrictions produced by the transfer of reactants and end products between electrodes in a PEM water electrolysis. The diffusion overpotential can be calculated using the Nernst equation as follows [108]:
V d i f f = R T n F ln C C r f
where R is the universal gas constant, T is the temperature, C indicates the amount of oxygen gas concentration at the electrode surface, Crf is the reference concentration, and F is the Faraday constant.
Water flow can impact mass transport losses either by removing bubbles in the cell or by other factors unrelated to bubble removal [41]. The impact of mass transport has been investigated in a 2D system for predicting the polarization curve. However, that study was solely bound to the theoretical Nernstian approach. It emphasized primarily how substances moved inside via diffusion [108]. Mass transfer losses occur solely in the anode region due to its complex two-phase flow dynamics. They are more pronounced when the applied current density exceeds 1 Acm−2 [109]. When operating PEM water electrolysis at a low current density, the main contributors to overpotential losses are sources other than mass transport overpotential. Mass transfer overpotential performance influence is often insignificant under these conditions [110].

4. Bubble Formation in PEMWE

The formation of gas bubbles at the anode and cathode surfaces can affect the production of hydrogen gas in PEM water electrolysis. The growth of oxygen gas bubbles can be controlled by changing several parameters such as current densities and temperatures [17]. When two distinct surfaces, i.e., hydrophilic and hydrophobic surfaces, were employed for a bubble detachment study, the results demonstrated that the influence of the wettability surface was less important at lower current densities [111]. It is vital to understand how different components influence voltage in a water electrolysis system and the movement of bubbles. How bubbles develop and migrate and how they disturb different parts of the cell are still not well understood. Previous reports have suggested that excess bubble formation can delay the detachment of bubbles and lead to insufficient bubble growth in the cell. As a result, considerable mass transfer loss, reduced catalyst utilization, and unpredictable cell performance can occur [92]. Therefore, there is a substantial need for developing practical and well-considered methods for handling and controlling bubbles. For instance, Yaun et al. [92] have developed a novel electrode to improve bubble management by utilizing an anode catalyst that is 24 times more effective than the standard design. This PEMWE is more adaptable than the standard technique in terms of energy efficiency, oxidation, lightweight design, and output rate [35]. Nonetheless, practical manufacturing of hydrogen/oxygen gas has encountered some significant challenges, including high component costs, GDL lifespan, and its pricey coated catalyst layer [112]. Enhancing bubble evolution and transport are two primary aspects of bubble management in water electrolysis [113]. In the first procedure, bubbles that emerge from the catalyst layer (CL) must be removed as quickly as possible [92]. Several studies have shown that a porous transport layer (PTL) plays a crucial role in removing bubbles. By altering its structure, it can enable bubbles to flow more freely and decrease the efficiency loss induced by bubbles [49]. For example, drilling holes in the PTL can save up to 76.7% of the efficiency loss [114]. Another study has developed a novel catalyst design that allows bubbles to move more quickly and effectively by coating the layer at the edge of Ti foil [115]. For enhancing bubble transport, the process can be carried out by generating more nucleation sites where smaller bubbles can develop when they detach. By allowing bubbles to detach more, the oxygen in water will be reduced, which will improve the system [92,99]. Studying characteristics such as the nucleation, growth, and detachment of bubbles under different operating conditions is necessary to comprehend the dynamics of bubbles in the flow channel and LGDL [35]. Figure 8 illustrates the evolution of the bubble stages in electrodes. In PEM water electrolysis, hydrogen bubbles produced are smaller than oxygen bubbles due to their difference in stoichiometry.
Ultrasound has a notable impact on the optimization of bubble evolution in water electrolysis. Ultrasound enhances nucleation, and it also influences bubble growth and allows bubble detachment from electrode surfaces via cavitation. Under the influence of an ultrasonic wave, the bubbles tend to merge into larger bubbles, along with an increase in bubble velocity on the electrode surface [116]. They have also noticed a decrease in critical bubble diameter and residence time under sonication. When the ultrasonic wave is applied, cavitation bubbles form because of rapid changes in pressure within the liquid. When ultrasound cavitation is applied in the pure water splitting process, the production of hydrogen and oxygen doubles. This improvement is due to the rapid release of the oxygen bubble induced by the ultrasonic effect. As a result, it minimizes the chance of dissolved oxygen and hydrogen merging, resulting in a more effective catalytic process [117]. During cavitation, rapid pressure changes induce bubbles in a liquid to grow and collapse quickly, especially when the negative pressure falls below the saturated vapor pressure [118]. During this stage, the bubbles promptly nucleate and grow. When bubbles enter a positive pressure zone, they collapse abruptly and explosively due to the pressure exerted by the surrounding liquid. This sudden increase in pressure has a variety of repercussions, including mechanical stress, increased turbulence, and alterations in the electrochemical environment, especially when it collides with nearby electrode surfaces. The cavitation of bubbles is influenced by the frequency of the ultrasound waves, and higher frequencies usually result in a stronger cavitation impact. The sound waves cause pressure to fluctuate. When these bubbles collapse, it creates a strong localized force and sound waves and this leads to intense mixing, which produces a faster reaction rate and higher efficiency. Ultrasonic waves offer an advantage in photocatalytic water splitting via piezoelectric action due to their high transmission frequency and deep penetration in water [117]. While this discussion on ultrasound’s impact on bubbles was based on general water electrolysis, it is important to highlight that the same concept may apply to PEM water electrolysis.

4.1. Nucleation of Bubbles

Nucleation is the process in which the first gas bubbles appear on the electrode surface. It happens when there is a dissolved gas buildup at the electrode surface [119]. If the dissolved gas concentration exceeds its saturation concentration during electrolysis, the gas will subsequently cause bubbles. How bubbles form, grow, and separate from the electrode surfaces affects the volume of gas released from the surrounding surface, which is crucial for determining the rate of bubble formation [120]. In PEM water electrolysis, the driving force for bubble nucleation depends on the degree of supersaturation of dissolved oxygen at the anode and hydrogen at the cathode [121,122]. Hydrogen and oxygen molecules are generated by electrochemical processes on the electrode surface and supersaturated to produce bubbles [123]. Bubbles become detached from the surface once they reach a critical size diameter. The critical bubble size for oversaturation within pores can be calculated using the classical nucleation theory as follows [25].
R c = 2 γ P g P l
P g = S P l
where Rc is the minimal size at which the bubble nucleates, S is the supersaturation of dissolved oxygen in the PTL pore, γ is the water surface tension, Pg is the pressure inside the bubble, and Pl is the surrounding water pressure.
Two processes are involved in the nucleation of bubbles: a homogeneous nucleation process, in which bubbles nucleate within the liquid without any solid surfaces, and a heterogeneous nucleation process, in which the formation of bubbles is facilitated by the presence of a solid surface [124,125]. Bubble nucleation is significantly influenced by non-wettable surfaces [37]. In the water electrolysis process, the generation of bubbles occurs at the interface between the catalyst layer (CL) and the porous liquid gas diffusion layer (LGDL) [18]. Bubbles then combine with their neighbors to form a cluster structure, thereby increasing their volume and surface energy [25]. Once these cluster bubbles reach a critical size, they disengage from the nucleation sites, resulting in the formation of new bubbles [126]. Another study has found that increasing porosities and decreasing pore size can lead to higher bubble nucleation at the triple-phase boundary [127]. The addition of a hydrophobic layer between the electrocatalyst and the PTL anode-side LGDL increases the contact angle, resulting in more bubbles on the surface, particularly at low current densities [128]. Efficient management of pressure is essential for controlling the bubble behavior inside the system. The bubble behavior is influenced by current density, temperature, and the liquid flow rate. In contrast, current density and temperature have considerable impacts on bubble nucleation sites, growth, and the overall number of bubbles [40]. Increasing current density accelerates the initiation of bubbles (bubble nucleation), resulting in quicker bubble formation on the anode catalyst layer [35].
Bubble nucleation takes place within a frequency range of 10 to 50 Hz. Nucleated bubbles will detach from the CL while the shape of bubble growth resembles a semispherical cap inside the PTL pore [25]. Previous studies have found that ideal areas for bubble nucleation can result in a heterogeneous crack on the catalyst surface as they are less prone to water movement or external forces [127,129,130]. The size of the catalyst crack surface can influence how the initial bubble forms and grows. In PEM water electrolysis, bubble density nucleation is analogous to a nucleation site in a boiling pool, where vapor bubbles develop on a heated surface in contact with water [25]. Different techniques are available for isolating the nucleation of bubbles and examining their impact on the electrode that evolves gas. Nucleation of bubbles usually emerges when there is an active OER. However, it is crucial to note that bubbles may not always appear at the precise location where the reaction occurs [92]. Figure 8 illustrates how the nucleation of bubbles results in water electrolysis. Nucleation is due to a constant increase in dissolved gas beneath the catalyst surface (Cgas). The water electrolyzer action introduces gas molecules into the water phase, increasing Cgas above its saturation concentration, Csat. The equilibrium concentration of saturation gas is proportional to the partial pressure of the gas (Henry’s Law) as shown below [37,92].
C s a t = P K H ( T )
Henry’s solubility constant KH decreases with temperature for each pair of liquid–gas molecules [131,132]. The supersaturation of gas (ζ) results when the dissolved gas is large enough, which is expressed as follows:
ζ = C g a s C s a t C s a t
A novel ring-shaped electrode has been used to study the formation of bubbles. However, it was discovered that the catalyst-free center of the ring was where the bubbles formed, which is shown in Figure 9 [133].
The bubble nucleation starts after a few seconds of the reaction. This occurs because the dissolved gas congregates in a hydrophobic microgravity area. The liquid is supersaturated when ζ > 0 (Cgas > Csat) and unsaturated if ζ < 0 (Cgas < Csat) [134]. To avoid bubble formation near the catalyst surface, the bubble generation and gas evolution reactions must be separated. This can help prevent the overpotential effect of gas evolution in the bubble formation method [135,136].

4.2. Growth of Bubbles

After the nucleation stage, the subsequent phase involves bubble growth which depends on various properties such as surface tension, viscosity, inertia, and turbulence [120]. In electrolysis, the growth of bubbles involves three phases, each of which is governed by a distinct force. The initial growth phase is regulated by the liquid inertia that surrounds the bubble. At this point, the radius of the bubble increases quickly with time [137]. The second stage happens when the dissolved gas surrounding bubbles in the liquid becomes supersaturated. Based on how quickly the gas can permeate from the bulk liquid, the bubble growth rate is constrained. The bubble radius increases with the square root of time [134]. In the third stage, the electrode produces more gas than it can dissipate into a bubble. Bubble growth frequency decreases because of the electrochemical process [36,138]. In PEM water electrolysis, bubble growth is governed by the difference in concentration between the dissolved gas molecules and the solubility of a gas in water [92]. The gas solubility in water increases with temperature. As a result, bubble growth accelerates significantly with a high temperature. The bubble growth rate is dependent on different factors including geometrical design, pressure, temperature, current densities, and surfactants [17,139]. Bubble growth in water electrolysis is shown in Figure 8. Some bubbles grow continuously even after bubbles have detached from the surface, indicating that as long as the surrounding liquid remains supersaturated, the bubble size will continue to increase [40,140]. However, the inability to observe inside the microstructure of opaque cells has resulted in a relatively limited understanding of bubble growth [141]. Numerous studies have postulated a two-phase bubble transport in a porous transport layer (PTL). A conventional PTL degrades faster than a modified PTL which exhibits higher durability and contact mass transport [142,143]. A PTL with a patterned structure and perforated pores can significantly improve bubble management in an electrolyzer [144,145]. A study has compared the growth of bubbles and detachment of bubbles with a through-pore PTL and a normal pore structure PTL and found that the through-pore PTL has higher gas flow [144]. It has also been found that the through-pore-type PTL has better water movement by enhancing the mass transport which is critical for system efficiency. However, some pores are inactive in a through-pore PTL, which results in an ineffective in-plane water movement [146]. Bubble growth took only 0.3 s with a through-pore PTL, whereas it took 2.88 s with the regular-pore PTL. This suggests that the through-pore PTL is more effective for higher gas removal, as shown in Figure 10. Furthermore, bubbles emerging from the through-pore PTL can continue their growth until they come together with surrounding bubbles, as seen in the through-pore PTL at t = 0.75 s.

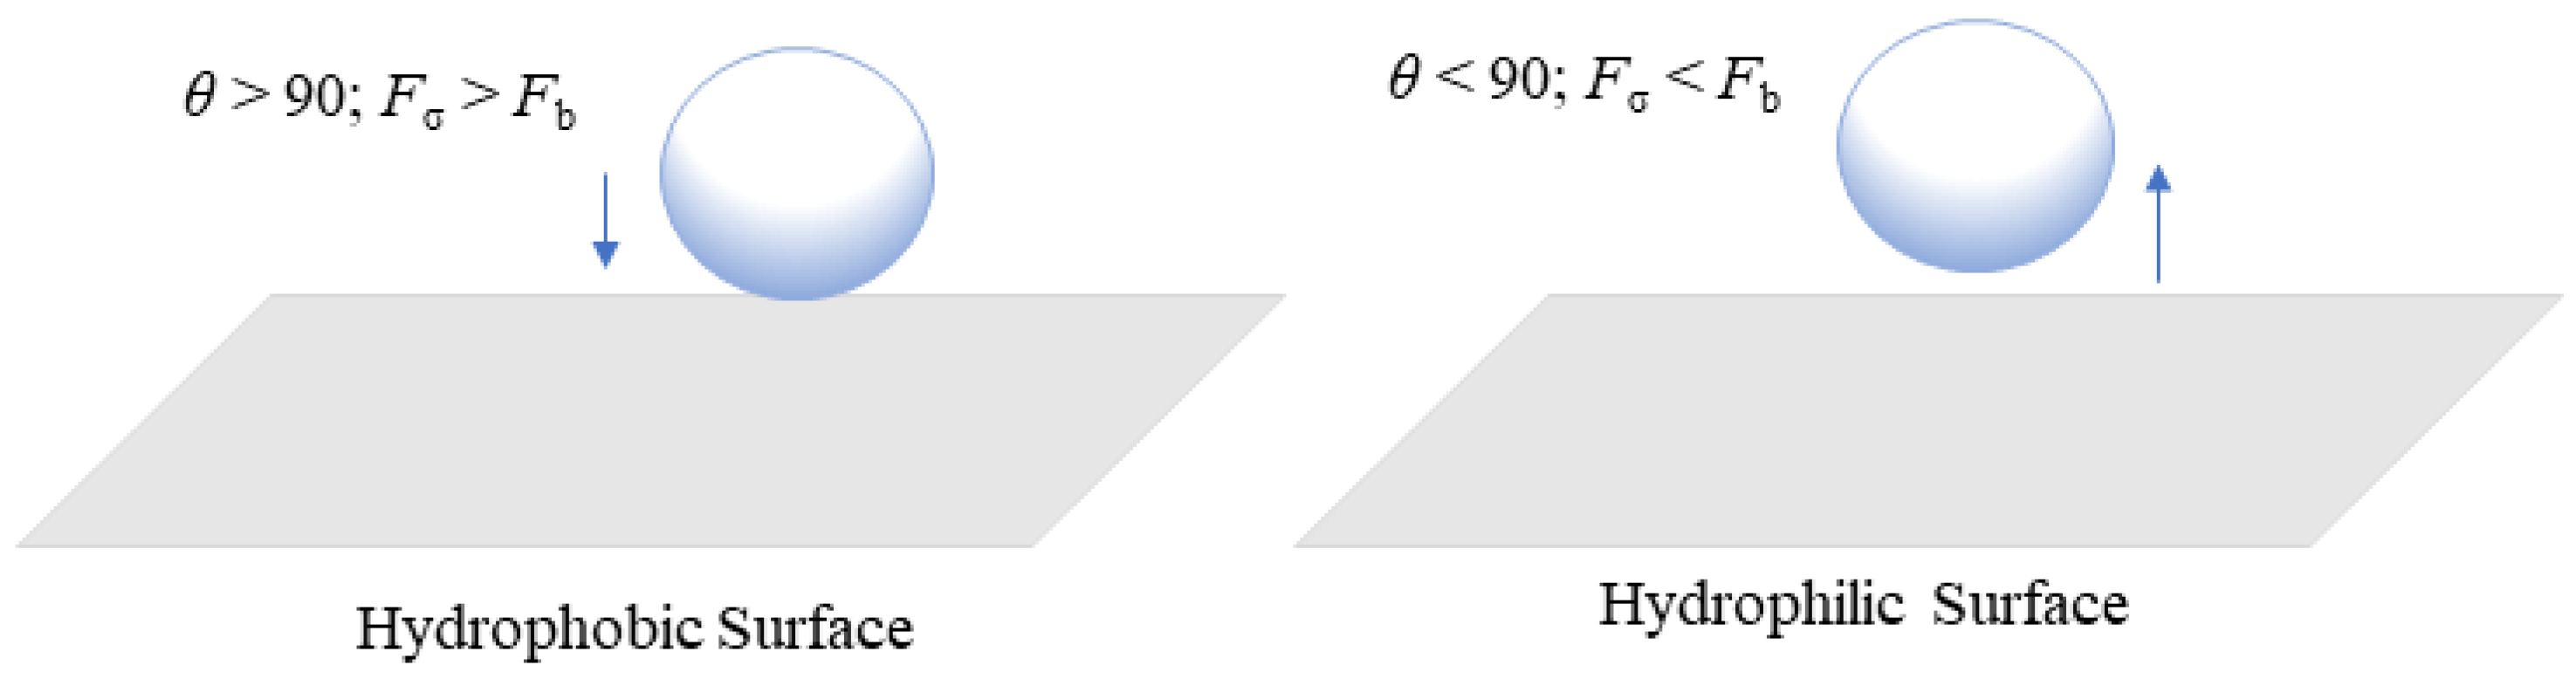
4.3. Detachment of Bubbles

Bubble detachment occurs when the upward force of buoyancy dominates the downward force of surface tension. Two main forces that can affect bubble departure in a pool of liquid are the force of buoyancy and the force of surface tension [147]. Bubble detachment diameter (Dd) can be calculated by correlating the surface tension force (γ) with the buoyancy force, which is expressed as [125,148].
D d π γ   sin 2 θ = Δ ρ g f θ D d 3
where ρ is the liquid density, θ the contact angle between a bubble and the surface, Δρ is the density difference between water and gas bubble, and g is the acceleration due to gravity experienced by the bubble. The frequency f based on the different bubble detachment diameters has been presented previously [149]. Although research on active catalysts has been significantly advanced over the years, very few studies have been conducted on electrocatalyst activities to effectively design suitable bubble detachment from the electrode surface [150]. For quick removal of bubbles from the surface, it is essential to lower the adhesion between the surface and bubbles [151]. In the water electrolysis process, there are various methods to detach the bubble from the electrode surface by using magnets, sound waves, mechanical frequency, and a supergravity field. The study also suggested that effective bubble detachment requires changing the liquid composition and system design. These techniques can facilitate the movement of forces in a liquid, which can accelerate the movement of bubbles on the surface [150]. Generally, more homogeneous and smaller bubbles can be removed from the cell faster, allowing more water to pass through [30]. They studied the bubble transport mechanism using a PTL as titanium felt with PTL and thin titanium with LGDL and compared three different indexes (i.e., bubble average detachment diameter (ADD), standard deviation diameter (SDD), and detachment frequency (DF)). Figure 11a shows the average bubble and detachment frequency for both PTLs. The ADD was 161 µm for Ti-felt and 24 µm for TT in the LGDL. The bubble formed by TT in the presence of the LGDL was found to be more uniform and smaller. Furthermore, the DF for TT in the LGDL was higher than that for Ti-felt. The growth of bubbles and stability on flat electrodes and the PTL flow channel interface can be changed with advanced imaging technologies [25]. Bubble detachment occurs due to two primary factors: (1) bubble nucleation near the anode catalyst layer caused by increased localized oxygen supersaturation in that region, resulting in the formation of fresh bubbles; and (2) balancing forces such as pressure and buoyancy. When these forces reach their critical point, the bubble detaches from its origin [25]. Figure 11b shows the effects of liquid velocity on bubble overpotential and bubble detachment. Liquid velocity plays a significant role in bubble management. When the flow velocity is low, the bubble tends to merge and form a large slug, which requires more time to detach. Similarly, when the flow velocity is increased, it is more difficult for smaller bubbles to clutch together due to the higher pressure difference and shear stress at the bubble surface. The detachment of hydrogen bubbles on the cathode side is always lower than the detachment of oxygen bubbles on the anode side [40].
Once the bubble detaches from the cell, the concentration of dissolved gas starts to increase in water, and when it reaches a particular level, the nucleation process starts, which initiates the bubble evolution cycle [36,152]. Bubble detachment of H2 and O2 at constant current density and flow velocity with time is depicted in Figure 11c. The bubble detachment study has been conducted using neutron and X-ray imaging methods. It has shown that initially, the bubble detaches very rapidly, and it slows down until it reaches a critical size [86]. Figure 11d presents the different stages of bubble growth on microelectrodes. Here, bubbles are generated and detached more consistently and progressively instead of detaching all the bubbles at once [135]. Garcia-Navarro et al. [153] used MATLAB code and studied O2 bubble detachment and explained that the bubble detachment remains constant regardless of the change in water flow rate. However, some other researchers have reported that an increase in water flow velocity leads to quicker detachment of smaller bubbles [154,155]. At constant operating potential, the size of bubbles decreases with an increase in the water flow rate. This phenomenon can be explained when water flow increases when water flow increases it creates less space (void fraction) available for gas bubbles. As the bubble rises, it displaces the water, causing transverse motion. Larger bubbles at a certain range of size contributed to water displacement and thus swept away other bubbles on the electrode surface. In the present review study, the intricate discussions on bubble nucleation, growth, detachment, and the effects of catalysts are presented mostly in the context of general water electrolysis. However, the underlying concepts of bubble dynamics and its applications may also be applied similarly in the context of PEM water electrolysis. This broad fundamental study of bubbles can result more specialized area of PEM water electrolysis specialized area of PEM water electrolysis.

5. Bubble Dynamics in Different Components of PEM Water Electrolysis

When a voltage is supplied during the water electrolysis process, then O2 and H2 bubbles are produced on the anode and cathode sides, respectively. The movement of bubbles is influenced by factors including buoyancy, surface tension, and drag force. The O2 bubbles are formed on the catalyst surface and start to grow until they reach the critical size and get detached away in the flow channel through the PTL. In most studies, water is supplied toward the anode. However, in some cases, water is also passed via the cathode-side channel to prevent the degradation of the membrane [29,156,157]. The following section discusses bubble dynamics in PEMWE with different components.

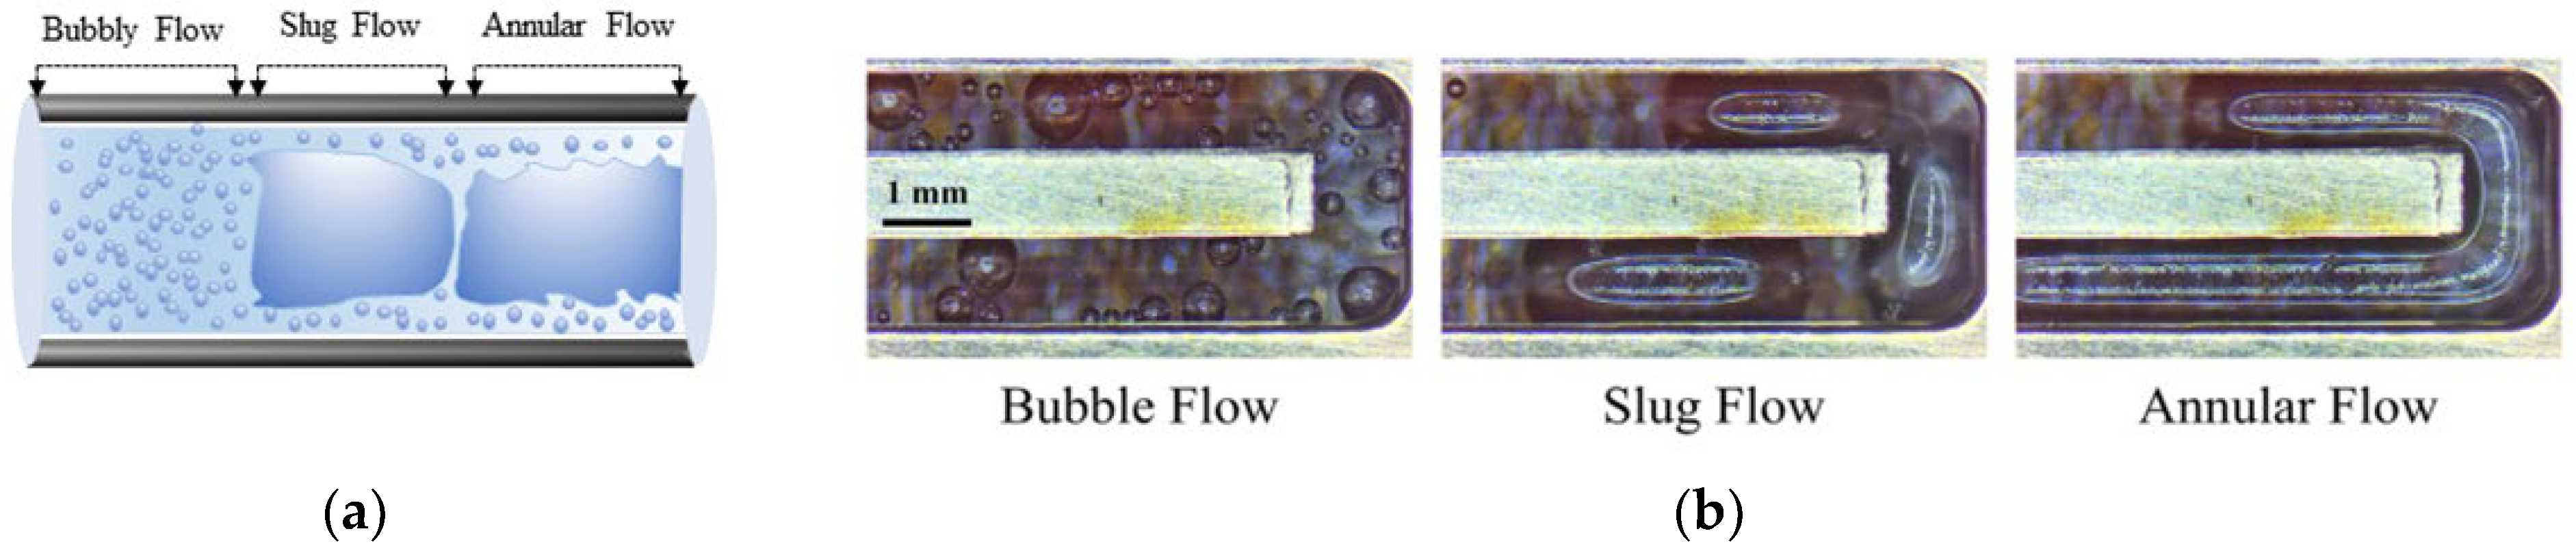
5.1. Bubble Dynamics in Flow Channels

The flow channel is an important structure used for designing the PEM water electrolysis. In PEM water electrolysis, various flow channels have been used for study, including serpentine, parallel, pin-type, interdigitated, mesh-type, and cascade channels [14,22,38,83]. In comparison with serpentine flow, the parallel field performs better at low pressure drop with constant flow velocity and lesser turbulence, which can increase corrosion resistance [158]. Polarization curves for various channels, including single and dual serpentine flow (SF) and parallel flow (PF) fields, have shown that more parallel channels can lead to more effective system performance [29,159]. A dual serpentine flow field is advantageous with respect to pressure drop, temperature, and current density distribution because it allows more reactants to penetrate porous layers and increase system reaction [160]. It has been found that a serpentine channel with a longer flow field produces elongated gas bubbles that can block the flow channel [38]. That research showed that, when SF and PF were compared at the same water flow, PF performed better than SF, especially at higher current densities. In the case of the SF, an annular regime was observed at high current densities. This caused the gas bubble to occupy the entire channel length, resulting in water obstruction across the LGDL and minimizing cell performance. O2 deposition in the channel may increase pressure drop and impede the system’s nonuniform temperature and current flow [38]. They also mentioned that while designing the flow field, significant attention must be considered for pressure drop management. The circuit board was printed, and the bubble flow was observed to investigate the current density along the system [154]. Those studies showed that the removal of gas bubbles from the electrode surface and the movement of water flow were significantly influenced by the presence of larger bubbles. This operation from smaller bubbles to larger bubbles enhanced mass transport results due to an increase in uniform current distribution across the channel. To maintain the two-phase flow as a bubbly flow, an ideal flow rate is required to enhance mass transfer and minimize overvoltage concentration [29]. Ojong et al. [42] stated that when only a BPP is used without a flow channel, pressure drop increases and the bubble formed tends to deposit throughout the PTL surface. This bubble accumulation had an adverse effect on mass transfer within the cell. Bubble motion inside the parallel channel gets restricted at a high current density, as shown in Figure 12a. Stagnant bubbles covered almost the whole channel length and made it more difficult to remove the gas [24]. Deposition of O2 gas bubble in a serpentine channel is more severe than in a parallel channel due to the formation of a long slug, as shown in Figure 12b [38]. The long slug flow caused a significant amount of gas bubbles to build along the channel, which considerably slowed down the movement of water and degraded system performance [40]. Similarly, Figure 12c depicts a mesh channel with two distinct types of bubbles involved: small bubbles and large bubbles. Small bubbles with a size of 30 mm detached quickly from the surface. However, a larger bubble remained attached to the adjoining bubble and eventually obstructed the PTL.
One study indicated that cascaded flow channels used on the anode side performed better than serpentine and parallel channels due to the low deposition of bubbles across the field [83]. Figure 12d depicts a zigzag flow pattern of bubbles on the expanded metal mesh. Lafmejani et al. [161] studied both single-phase and two-phase flow by injecting blue ink along the water flow and observing how it behaves in the mesh channel. The presence of the bubble along a vertical path was shown to be favorable for liquid flow. An interdigital field channel analysis of single- and two-phase flow models was performed to understand the influence of gas bubbles on the geometry structure of the anode [163,164]. It showed that unequal flow and temperature distribution in the cell was due to the equal land width of the flow field and the presence of a gas bubble at the exit phase. Maier et al. [85] used a non-invasive technique termed acoustic emission for tracking the movement of bubbles in the flow channel and this allowed them to record system changes such as the shifting of tiny bubbles to larger bubbles and changes in bubble shape in the cell. A square-shaped pin-type channel showed a consistent distribution of temperature and current, resulting in effective elimination of gas bubbles [165].
Zhang et al. [162] found that the impact of H2 bubbles on stainless steel (SS) mesh is influenced by the current density, mesh diameter, and pore size. They also found that the SS mesh performed better than the expanded mesh as a catalyst for hydrogen evolution, which is shown in Figure 12e.

5.2. Bubble Dynamics in a Catalyst Layer

Metals such as Pt are commonly coated on the cathode side of the catalyst for examining the hydrogen evolution reaction (HER), whereas IrOx is loaded on the anode-side region of the catalyst for studying the oxygen evolution reaction (OER) for coating on the membrane (CCM) [84]. However, these metals are not cost-friendly when they are used for upscaling. In addition, the use of Pt metal can be poisonous when chemicals such as sulfide (commonly found in wastewater) are used [166,167]. Nonmetal catalysts such as metal sulfide, metal carbides, and metal phosphides have been used as HER catalysts in acidic conditions [168,169,170,171]. However, these nonmetals have numerous downsides, such as consuming higher voltage energy and exhibiting weaker stability when they are subjected to higher current densities [172,173,174,175,176]. Contrary to conventional Pt and other nonmetal catalysts, a Fe-N-C catalyst has been designed for HER, showing high onset [177]. Hybrid catalysts such as CoMnP/Ni2P/NF showed significant activity for HER with low overpotentials in both acidic and alkaline environments [178]. As indicated in Figure 13a, this CoMnP/Ni2P/NF exhibits superaerophobic behavior when it is studied underwater with a high contact angle of 158° and a negligible adhesive force between the bubble and the electrode surface. During the operation of electrolysis, some cathode and anode surfaces are covered by hydrogen and oxygen gas bubbles. The diameter of these bubbles can be measured by taking two elements into account: liquid surface tension and pressure difference at the meniscus. Relationships between liquid properties, pressure difference, and bubble size can be presented as follows [179]:
r b = 4 T P i P 0
where Pi is the pressure inside the gas bubble, and P0 is the external pressure which is influenced by the height and the density of a liquid.
The performance and durability of the anode-side catalyst and anode plate are important to consider especially when it operates at a higher voltage to produce O2 on the anode [180]. Simply focusing on the OER may not be sufficient to prevent the catalyst from corrosion resistance [181]. They also suggested having a thorough knowledge based on different surfaces against catalyst erosion. This further understanding is essential for developing the catalyst, which not only can exhibit its life expectancy but also may resist corrosion, preventing the catalyst from leaching over time. The bubble interaction at high voltage can result in the leaching of coated catalyst material. Catalyst leaching studies were carried out for different catalyst loading, and particularly on the anode side with lower catalyst loading lower catalyst loading (0.34 mg cm−2) led to higher degradation rates compared to higher loading (1.27 mg cm−2) [182]. They stated that catalyst loading has a substantial influence on the degradation rate. If the catalyst loading is insufficient, it may fail to resist the elevated heat and ultimately it could break the catalyst material causing catalyst leaching. Compared to an MEA with low catalyst loading, an optimal loading lifespan is three times higher, which can decrease catalyst leaching and increase catalyst efficiency [183]. This nonlinear mechanical stress results specifically due to fluctuating energy supply, which in turn can cause nonuniform bubbles in electrodes that may affect the electrochemical reaction in the system [184].
Bubbles formed in the CL must exit the system via the porous transport layer (PTL) and the flow field channel [185]. Controlling the ideal catalyst loading thickness is essential for ensuring free water flow within the layer [92]. The cracks in the CL during the reaction process may lead to a negative impact on bubble management. These cracks may cause irregular and uncontrolled bubble nucleation, disrupting efficient gas transfer and system performance [186,187]. In CL, another type of surface structure known as superaerophobic surface structure serves to control gas bubbles on the OER and HER sides. This superaerophobic structure resembles an array and inhibits the bubble from adhering to the CL for an extended period [178]. For quick removal of H2 gas bubbles from the electrode surface, hybrid catalysts called FG-WS2 and VGNHs-WS2 have been employed and researchers measured their bubble size distributions (BDS), which are presented in Figure 13b,c [188]. The VGNHs-WS2 hybrid catalyst produced smaller and more uniform bubbles than the FG-WS2 hybrid catalyst, which was attributed to the nanorough surface of the VGNHs. As a result, the H2 gas bubble in the electrode can escape from the HER area faster. The Pt nanoarray shape that resembled pine showed a higher contact angle. As a result, the H2 bubble detached quickly from the electrode surface [189]. When two hybrid coated catalysts were used, namely, MoS2 flat film and MoS2 nanoplatelets array, the flat film showed higher adhesive force, resulting in higher bubble attachment [190]. The MoS2 nanoplatelets array exhibited significant bubble management with a higher bubble contact angle and thus detached bubbles faster on the surface. Han et al. [191] employed a hybrid catalyst to analyze the HER reaction side by using an N-WC nanoarray and flat N-WC. When the bubble contact angle increased from 148° (flat) to 163° (N-WC nanoarray), the N-WC nanoarray demonstrated improved bubble management with respect to the flat N-WC and detached bubble size decreased from 15 µm to 5 µm. Figure 13d exhibits the BSDs of two distinct topologies, nanoarray and non-array electrodes. The nanoarray structure produced a smaller bubble, a larger contact angle, and a lower adhesive force. The researchers examined two distinct catalysts, and in the first set, they coated Ir-C on the anode and nitrogen-tungsten carbide (N-WC) at 1.5 V. In the other set, they coated single non-noble metal catalyst N-WC on both the anode side and the cathode side at 1.4 V, as shown in Figure 14a,b. They found that using N-WC non-noble metal as a bifunctional catalyst on both the anode and cathode sides could increase the yield of the water-splitting process at a low voltage. Thus, maintaining efficient electrolysis relies significantly on managing bubbles on the HER and OER reaction sides of the CL.
Figure 13. (a) CoMnP/Ni2P/NF measurement of bubble adhesive force. Copyright 2021, with permission from the Royal Society of Chemistry [178]. (b) BSD of FG-WS2. Copyright 2017, with permission from the American Chemical Society [188]. (c) BSD of VGNHs-WS2. Copyright 2017, with permission from the American Chemical Society [188]. (d) BSD on various nanoarrays. Copyright 2018, with permission from Springer Nature [191].
Micromachines 14 02234 g013
On the anode, two different cost-effective catalyst coatings were performed using honeycomb Ir and dense Ir. Their comparison showed that honeycomb Ir has better bubble management due to the interconnected structures which enabled fast bubble discharge and effective water diffusion [192]. Figure 14c,d depict the bubble dynamics using a dense Ir-catalyst-coated liquid gas diffusion layer (CCLGDL) and the honeycomb (HC)-coated membrane surface. At a current density of 200 mA/cm2, the honeycomb catalyst layer outperformed the dense layer in terms of bubble nucleation and detachment times. The formation of gas bubbles in the CL alone was insufficient to optimize cell performance. However, how these bubbles are circulated within the cell plays a significant role in determining the overall voltage loss in the cell. This voltage is lost due to an accumulation of O2 bubbles on the anode side [193]. The O2 bubble generated on the CL takes more time to travel through the PTL when the applied current density is high, and the bubble transport is low. As a result, gas removal becomes very slow, and more bubbles build on the anode region [126,194]. Furthermore, the presence of the ionomer in the CL determined cell performance. The higher the ionomer in the CL, the more mass transfer losses, resulting in inefficient O2 bubble transfer [195]. This obstruction impedes efficient bubble reduction and degrades cell efficiency [93].

5.3. Bubble Dynamics in Porous Transport Layers

A porous transport layer (PTL), also known as a liquid gas diffusion layer (LGDL), can be utilized on the anode side with a gas diffusion layer (GDL) on the cathode side. It aids in the stability of several components such as membrane, collecting current, and counter flow of gas and water [196]. The PTL with a porosity between 30% and 50% performs well for gas bubbles to navigate faster and regular flow of intake water [197,198]. If larger pores are present in the PTL interface, they can cause insufficient contact between catalyst nanoparticles and the PTL material [199]. Recently, a novel sponge-like material with small holes known as through-pores has been developed to easily move water and gas bubbles by avoiding the longer route in the PTL, as presented in Figure 15a [144]. After examining the behavior of gas bubbles in the PTL flow field using an X-ray imaging approach, it was found that bubble growth and detachment using the through-pores occurred more quickly than those through conventional pores. Although gas bubbles developed along the boundary between the CL and the PTL, they ended up migrating through pores toward the PTL surface [200]. Figure 15b depicts the movement of gas bubbles in the PTL and bubbles produced at the interface between the CL and the PTL.
When these bubbles merges with neighboring bubbles, its volume and surface energy are increased, and when it reaches the critical size, it breaks from the nucleation zone [141]. For an efficient gas bubble transfer, it is critical to minimize gas accumulation on the CL. This can be accomplished by employing a suitable PTL, which provides a conduit for gas bubbles to migrate away from the anode CL [204]. At a higher current supply, O2 gas bubbles generated in the PTL can block the flow of water toward the anode CL, resulting in water supply deficiency [25,205]. To effectively deliver water to the anode side, the PTL’s pores need to be larger, followed by a thicker catalyst coating [206]. The pore size and the thickness of the CL can significantly influence the PTL in a cell. As shown in Figure 15c, resistance increases with a decrease in the thickness of the CL because a thinner CL causes more restriction of electrons [201]. Additionally, Miličić et al. [202] reported that by increasing the liquid flow rate, the PTL liquid saturation is enhanced because of the efficient removal of gas bubbles from the PTL, which can reduce gas deposition in both the PTL and the anode CL, as presented in Figure 15d. The most common materials used for fabrication of the PTL on the anode side include Ti mesh, sintered powder, felt, multilayered, perforated plates, and others [127,144,207]. These materials have excellent chemical and mechanical stability [208]. Understanding the behavior of the bubble in the porous transport layer (PTL) becomes crucial to minimize voltage loss, increase efficiency, and improve the performance of the cell’s durability. Figure 15e depicts the growth and detachment of a single gas bubble in a channel at different times. A real-time study for gas bubbles showed that at time t = 0 ms, the bubble size diameter was 70 µm. By increasing the time t to 900 ms, the bubble size increased to 130 µm [203]. Understanding how gas bubbles travel in the PTL in real time can assist in determining factors that impact mass transport and optimize the PTL structure to improve system efficiency. Furthermore, analysis of how voltage fluctuates over time at a high current density has revealed that the commercial PTL experiences a quick increase in voltage due to inadequate removal of gas bubbles at reaction sites [144].

6. Measurement Techniques for Bubble Dynamics

There are various techniques available to measure the bubble size in a PEM water electrolysis system, including photography, neutron imaging, X-ray imaging, and acoustic emission. These methods are discussed as follows.

6.1. Photography Technique

This technique is one of the simplest and most intuitive tools for measuring bubbles in a PEM water electrolysis system. Over the years, various studies have used both intrusive and nonintrusive methods to measure bubble size. In this methodology, the bubble sizes are measured using a photographic method followed by image analysis. Conventional microscopes or cameras cannot capture gas bubble dynamics at the microscale with ultra-high speeds. A high-speed camera is used to capture the different bubbles inside the PEM water electrolysis system since the bubbles generated in this type of instrument exhibit microbubble dynamics [111]. While using the high-speed camera, an LED light source is used for capturing the bubble images [38]. The light source is used to make moving bubbles more visible, preventing blurred motion and enabling accurate bubble behavior analysis. The image analysis process involves several processes, such as image segmentation, visibility adjustments, and contrast enhancement. Image analysis tools such as MATLAB, ImageJ, Adobe Reader, and Digimizer can be used to measure bubble size images. A captured bubble image from the PEM water electrolysis system using a high-speed camera is presented in Figure 16. The following expression can be used to measure the Sauter mean bubble diameter [209,210]:
d 32 = i = 1 n n i d d 3 i = 1 n n i d d 2
where ni denotes the number of bubbles with size diameter dd. For bubbles with an ellipsoidal shape, the bubble diameter can be measured using the following equation:
d e q = l m a j 2 l min 3
where lmaj and lmin are the major and minimum measured bubble lengths, respectively.

6.2. Neutron Imaging Technique

In this method, images are recorded and the amount of water and gas in the porous layer is measured. Although the neutron imaging approach cannot provide clarity or detailed image quality like X-ray images, it has a significant advantage. Figure 17a shows neutron beam radiography images used for capturing bubble size while performing the experiment. It can penetrate through certain metals such as titanium, which is often used in electrolysis as a porous layer [211]. In neutron imaging, the PEM water electrolysis is initially placed at the neutron beam, and images are captured at a rate of 1 Hz. While experimenting, the neutron imaging failed to differentiate between gas bubbles and the titanium mesh used for the flow field. Therefore, combining both neutron and optical imaging techniques could help distinguish gas bubble evolution from the Ti mesh layers [130]. The intensity of the neutron is altered based on the presence of water inside the cell. Lee et al. [212] initially captured the reference image without applying a current under a fully saturated liquid in the anode when nitrogen gas is purged in the cathode side to remove the presence of water during the reference image capture. Finally, the image was captured by supplying the current in the electrolysis. An integrated bubble image is shown in Figure 17b. For image processing, three steps were used to measure the images [213]. While capturing images, random spots might be captured owing to changes in camera illumination. To eliminate these spots, the median value from multiple images is taken, yielding a sharper and cleaner image. The second step involves taking the median at every frame of three by three pixels to reduce electronic system noise [212]. Lastly, a procedure known as image restriction is adopted to avoid image alignment being disturbed during image capture due to changes in camera equipment alignment. These integrated approaches can improve our understanding of water behavior. They can be used to optimize PEM electrolysis performance. Another study used the same neutron imaging exposure duration of 5 s with two distinct types of images taken before the experiment. One is known as a dark field image (without using a neutron beam) and the other is described as a dry image (before circulating water inside the cell) [196]. Captured images were edited with ImageJ software and 30 images from each batch were merged using a process known as median averaging to further enhance the image quality. Real-time images from PEMWE were captured with a neutron beam and analyzed to determine water thickness using the Beer–Lambert law. The area known as land location was taken into consideration. The water within the land and in pore structures was then examined.
Using the Lambert–Beer Law, the thickness of water (t) in the region surrounding the bubble can be measured to comprehend and quantify its impact on the movement of water, which is expressed as [90,130]:
t = 1 n w ln I c I d
where nw, Ic, and Id denote the number of neutrons absorbed or scattered by water during the process, the actual neutron image captured during the cell operation, and the neutron image recorded when the cell is completely dry.

6.3. X-ray Imaging Technique

This non-invasive method produces high-resolution 3D images. It has been used for measuring bubbles inside a PEM water electrolysis system. For studying the in-situ measurement of gas bubbles, different types of imaging such as optical, neutron, and X-ray imaging have been used [212,214]. This method is used as an ex-situ technique for assessing the physical structure and characteristics of materials such as the PTL in a water electrolysis system [215]. X-ray imaging and X-ray radiography have been employed to measure the presence of oxygen bubbles inside a PEM water electrolysis system, as shown in Figure 18a [203]. The setup was rotated 180°, and the tomography was allowed to scan from different angles by carefully selecting the beam energy for penetrating the system. Hoeh et al. [86] studied the evolution of gas in the PTL using the X-ray technique and analyzed a comprehensive review through plane and in-plane orientation. They used a concentrated beam of X-ray energy and allowed it to pass through the PEM water electrolysis system. Bubble images were captured using a CCD camera after every 5 s. They adopted a method called in-plane synchrotron radiography and determined gas bubbles between the PTL and flow channels. Figure 18b depicts how hydrogen bubbles change over time, indicating that higher current densities result in faster hydrogen bubble production and discharge, whereas lower current densities result in slower bubble growth. De Angelis et al. [216] have used the tomography method and studied how oxygen bubbles formed and interacted with or without the PTL structure. They observed bubble growth and detachment at the PTL, as well as the bubble rise velocity and change in behavior.

6.4. Acoustic Technique

Acoustic emission can be measured by using a cylindrical piezoelectric sensor at the anode side as shown in Figure 19a. In the HER process, a new design called surface-reflected bulk wave, which is a specific type of acoustic wave, was developed to prevent the accumulation of gas bubbles on the electrode, particularly at high current densities [218]. For operating the system, a constant current (galvanostatic) is applied, and the data collected every 1 min. Unlike other sensors, this acoustic emission (AE) can detect signals from all sides of the PEMWE cell. Further, collected data can be processed with AEwin software for enhancing the acoustic signal and for removing unwanted noise. During the operation, the system experiences mechanical perturbation due to the movement of bubbles, pressure fluctuation, and flow disturbance. These sensors can continuously generate voltage/time signals when perturbation waves are generated from the cell. With an increase in the physical vibration around the anode side, a sensor produces a high voltage in response. When the resulting voltage/time signal is higher than the desired noise threshold (set at 37 dB) for the purpose of detecting these AEs, it is referred to as an acoustic hit. While gathering data, each acoustic signal generates a distinctive sound. Four separate signals are generated, including frequency (hit rate), maximum sound wave volume (hit amplitude), time (hit duration), and energy (hit energy) produced with each impact. This can be used to understand whether the system has abnormal sound events or if there are any regions that need to be fixed while constructing the system. Thus, using this special sensor can monitor bubble behavior in the system. The impulse pressure generated by oscillating bubbles in the cell produces a certain sound frequency [219,220]. These oscillatory forces generated by vibration can trigger the shifting of the bubbles [221]. A captured bubble using the AE sensor is shown in Figure 19b. Larger bubbles have lower frequency oscillations, whereas smaller ones have higher frequencies. As a result, the velocity at which a bubble moves is influenced by its size. The relationship between bubble size and the frequency of the fluctuation has value for understanding bubble behavior in liquids. It potentially has several research applications [85]. For free oscillation of the bubble in the liquid, the relationship between the initial bubble size (R0) and the oscillating frequency (f) can be expressed as [222]:
f = 1 2 π 3 k p ρ R 0 2 2 σ ρ R 0 3
where p is the liquid pressure at a point distance from the oscillating bubble, ρ is the liquid density, σ is the liquid surface tension, and k denotes the polytropic coefficient. The relationship between the pressure (P) and the volume (V) during the growth or reduction of the gas bubbles is as follows [223]:
PVk = constant
Similarly, the frequency oscillation of the bubble is expressed as [222,224]:
f = 1 2 π 3 k p ρ R 0 2
This shows that the bubble frequency is inversely proportional to the bubble radius. Although bubbles in an electrolyzer flow channel may not be able to freely oscillate, bubble collisions may induce similar interactions between bubble size and frequency. Such relationships may provide knowledge regarding bubble dynamics in a flow channel, resulting in an impact on the operation of the whole system and bubble management.

7. Current Challenges and Outlook

PEM water electrolysis holds significant promise for producing the optimal green hydrogen. However, an in-depth understanding of the role of bubble dynamics in system performance is essential for solving the existing challenges before industrial-scale setups. In the literature, there are different studies carried out for the development of novel on the development of novel catalysts, bipolar plates, flow channels, and PTL materials. All these investigations have significantly enhanced the system performance, but challenges remain, particularly the controlling of bubbles across the electrode surface and from the flow channel. Different studies have been carried out in the context of catalyst coatings for the enhancement of the OER and HER through nanostructures, which have improved the bubble evolution [190,225]. However, it is still not identified how these nanostructures impact the bubble evolution. One such persistent problem is the effective removal of bubbles from electrode surfaces, which necessitates higher current densities, lowering system efficiency significantly. When these bubbles build up on the electrode surface, they can obstruct the pores, which in turn causes activation losses and mass transport losses [23,226,227]. Another key step is to identify hotspots for bubble generation on electrode surfaces. Bubble evolution may vary for electrode surfaces with different pore diameters. Thus, identifying these hotspots is critical for the timely removal of oxygen gas bubbles. Therefore, future research should emphasize the detailed investigation of how these bubbles cover the electrode surfaces to improve gas bubble removal and minimize system damage. Flow channel rib pressure may destabilize the PTL layer, preventing proper gas flow in the region. It is still unclear how the flow channel’s rib affects the PTL layer. Future studies ought to focus on the complex relation between flow channels, ribs, and PTL layers to optimize gas distribution and enable effective electrolysis. More experimental and modeling research is needed to comprehend the role of bubble evolution in overcoming present challenges in industrial-scale setups. This will bridge the gap between laboratory findings and real-world applications. The present review paper lays the foundation for future research initiatives aimed at overcoming current barriers and advancing PEM water electrolysis.

8. Conclusions

Hydrogen gas is regarded as one of the greenest and most sustainable energy sources. It has the potential to replace traditional fossil fuels in various applications such as automobile fuel, energy generation, heating, industrial operations, and so on. Using electrical energy, PEM water electrolysis can produce green hydrogen gas by simply splitting water molecules into oxygen and hydrogen. Despite significant advances in hydrogen gas production via water electrolysis, there are still numerous obstacles in predicting and managing bubbles inside a cell. Although innovative electrode design can provide efficient bubble control in the cell, there is a main issue associated with the cost of various components. This article presented a comprehensive review based on how the bubbles stick on the electrode surface and its substantial impact on cell performance, resulting in various losses in the system. It also addressed the effectiveness of PEM water electrolysis which can be greatly impacted by interactions between activation overpotential, ohmic overpotential, and diffusion overpotential due to mass transport losses. Overpotential losses can be minimized by lowering bubble buildup on the electrode surface, which in turn can improve ion flow and mass transfer efficiency. Both bubble evolution and transport must be enhanced to control bubbles by improving the porous transport layer and catalyst coatings. Efficient bubble dynamics and the different stages of a bubble from nucleation to detachment were discussed. Increased bubble nucleation can generate a swarm of small bubbles on the CL, which can enhance mass transport, promote gas evolution, and decrease the formation of large bubbles. This paper also focused on the complex bubble dynamics inside a flow channel, a catalyst layer, and a porous transport layer. It highlighted the crucial function of low pressure drop, restricted bubble accumulation, and precise ionomer control in the CL, underlining their ability to prevent bubble buildup. Furthermore, it demonstrated that bubbles can be swiftly removed when PTL structures are designed with appropriate pore size and thickness. In addition, measurement techniques for various methods of measuring bubble size in a PEMWE cell were explained. The incorporation of accurate measuring techniques enhances a thorough understanding of bubble behavior, enabling the development of more efficient and optimal PEMWE systems.

Author Contributions

B.T.S., conceptualization and writing of the manuscript; H.P., supervision, review, conceptualization, and editing. All authors have read and agreed to the published version of the manuscript.

Funding

This work was supported by a National Research Foundation of Korea (NRF) grant funded by the Korea Government (MSIT) (No. 2021R1I1A3050982). The results of a study on the “Leaders in INdustry-University Cooperation 3.0” Project, supported by the Ministry of Education and National Research Foundation of Korea. This work was also supported by the Soonchunhyang University Research Fund.

Data Availability Statement

Not applicable.

Conflicts of Interest

The authors declare no conflict of interest.

References

  1. Gür, T.M. Review of Electrical Energy Storage Technologies, Materials and Systems: Challenges and Prospects for Large-Scale Grid Storage. Energy Environ. Sci. 2018, 11, 2696–2767. [Google Scholar] [CrossRef]
  2. Pivovar, B.; Rustagi, N.; Satyapal, S. Hydrogen at Scale (H2@ Scale): Key to a Clean, Economic, and Sustainable Energy System. Electrochem. Soc. Interface 2018, 27, 47. [Google Scholar] [CrossRef]
  3. Falcão, D.S.; Pinto, A. A Review on PEM Electrolyzer Modelling: Guidelines for Beginners. J. Clean. Prod. 2020, 261, 121184. [Google Scholar] [CrossRef]
  4. Kazim, A.; Veziroglu, T.N. Utilization of Solar-Hydrogen Energy in the UAE to Maintain Its Share in the World Energy Market for the 21st Century. Renew. Energy 2001, 24, 259–274. [Google Scholar] [CrossRef]
  5. Li, Y.; Yang, G.; Yu, S.; Kang, Z.; Talley, D.A.; Zhang, F.-Y. Direct Thermal Visualization of Micro-Scale Hydrogen Evolution Reactions in Proton Exchange Membrane Electrolyzer Cells. Energy Convers. Manag. 2019, 199, 111935. [Google Scholar] [CrossRef]
  6. Lim, H. Hydrogen Selectivity and Permeance Effect on the Water Gas Shift Reaction (WGSR) in a Membrane Reactor. Korean J. Chem. Eng. 2015, 32, 1522–1527. [Google Scholar] [CrossRef]
  7. Muthukumar, M.; Rengarajan, N.; Velliyangiri, B.; Omprakas, M.A.; Rohit, C.B.; Raja, U.K. The Development of Fuel Cell Electric Vehicles-A Review. Mater. Today Proc. 2021, 45, 1181–1187. [Google Scholar] [CrossRef]
  8. Bruce, S.; Temminghoff, M.; Hayward, J.; Schmidt, E.; Munnings, C.; Palfreyman, D.; Hartley, P. National Hydrogen Roadmap; CSIRO: Canberra, Australia, 2018; Available online: www.csiro.au (accessed on 23 August 2018).
  9. Glenk, G.; Reichelstein, S. Economics of Converting Renewable Power to Hydrogen. Nat. Energy 2019, 4, 216–222. [Google Scholar] [CrossRef]
  10. Hadikhani, P.; Hashemi, S.M.H.; Schenk, S.A.; Psaltis, D. A Membrane-Less Electrolyzer with Porous Walls for High Throughput and Pure Hydrogen Production. Sustain. Energy Fuels 2021, 5, 2419–2432. [Google Scholar] [CrossRef]
  11. Ren, Z.; Wang, J.; Yu, Z.; Zhang, C.; Gao, S.; Wang, P. Experimental Studies and Modeling of a 250-KW Alkaline Water Electrolyzer for Hydrogen Production. J. Power Sources 2022, 544, 231886. [Google Scholar] [CrossRef]
  12. Falcão, D.S. Green Hydrogen Production by Anion Exchange Membrane Water Electrolysis: Status and Future Perspectives. Energies 2023, 16, 943. [Google Scholar] [CrossRef]
  13. Mo, J.; Kang, Z.; Yang, G.; Li, Y.; Retterer, S.T.; Cullen, D.A.; Toops, T.J.; Bender, G.; Pivovar, B.S.; Green, J.B.; et al. In Situ Investigation on Ultrafast Oxygen Evolution Reactions of Water Splitting in Proton Exchange Membrane Electrolyzer Cells. J. Mater. Chem. A Mater. 2017, 5, 18469–18475. [Google Scholar] [CrossRef]
  14. Lin, R.; Lu, Y.; Xu, J.; Huo, J.; Cai, X. Investigation on Performance of Proton Exchange Membrane Electrolyzer with Different Flow Field Structures. Appl. Energy 2022, 326, 120011. [Google Scholar] [CrossRef]
  15. Fallah Vostakola, M.; Ozcan, H.; El-Emam, R.S.; Amini Horri, B. Recent Advances in High-Temperature Steam Electrolysis with Solid Oxide Electrolysers for Green Hydrogen Production. Energies 2023, 16, 3327. [Google Scholar] [CrossRef]
  16. Carmo, M.; Fritz, D.L.; Mergel, J.; Stolten, D. A Comprehensive Review on PEM Water Electrolysis. Int. J. Hydrogen Energy 2013, 38, 4901–4934. [Google Scholar] [CrossRef]
  17. Li, Y.; Kang, Z.; Mo, J.; Yang, G.; Yu, S.; Talley, D.A.; Han, B.; Zhang, F.Y. In-Situ Investigation of Bubble Dynamics and Two-Phase Flow in Proton Exchange Membrane Electrolyzer Cells. Int. J. Hydrogen Energy 2018, 43, 11223–11233. [Google Scholar] [CrossRef]
  18. Mo, J.; Kang, Z.; Retterer, S.T.; Cullen, D.A.; Toops, T.J.; Green, J.B.; Mench, M.M.; Zhang, F.-Y. Discovery of True Electrochemical Reactions for Ultrahigh Catalyst Mass Activity in Water Splitting. Sci. Adv. 2016, 2, e1600690. [Google Scholar] [CrossRef]
  19. Feng, Q.; Liu, G.; Wei, B.; Zhang, Z.; Li, H.; Wang, H. A Review of Proton Exchange Membrane Water Electrolysis on Degradation Mechanisms and Mitigation Strategies. J. Power Sources 2017, 366, 33–55. [Google Scholar] [CrossRef]
  20. Xin, S.; LiJun, X.; Di, Z.; Bing, H.; LuXiang, M. Electrochemical Performance Study of Proton Exchange Membrane Electrolyzer Considering the Effect of Bubble Coverage. Int. J. Hydrogen Energy 2023, 48, 27079–27094. [Google Scholar] [CrossRef]
  21. Lettenmeier, P.; Wang, R.; Abouatallah, R.; Helmly, S.; Morawietz, T.; Hiesgen, R.; Kolb, S.; Burggraf, F.; Kallo, J.; Gago, A.S. Durable Membrane Electrode Assemblies for Proton Exchange Membrane Electrolyzer Systems Operating at High Current Densities. Electrochim. Acta 2016, 210, 502–511. [Google Scholar] [CrossRef]
  22. Ito, H.; Maeda, T.; Nakano, A.; Hwang, C.M.; Ishida, M.; Kato, A.; Yoshida, T. Experimental Study on Porous Current Collectors of PEM Electrolyzers. Int. J. Hydrogen Energy 2012, 37, 7418–7428. [Google Scholar] [CrossRef]
  23. Su, X.; Xu, L.; Hu, B. Simulation of Proton Exchange Membrane Electrolyzer: Influence of Bubble Covering. Int. J. Hydrogen Energy 2022, 47, 20027–20039. [Google Scholar] [CrossRef]
  24. Maier, M.; Meyer, Q.; Majasan, J.; Owen, R.E.; Robinson, J.B.; Dodwell, J.; Wu, Y.; Castanheira, L.; Hinds, G.; Shearing, P.R.; et al. Diagnosing Stagnant Gas Bubbles in a Polymer Electrolyte Membrane Water Electrolyser Using Acoustic Emission. Front. Energy Res. 2020, 8, 582919. [Google Scholar] [CrossRef]
  25. Nouri-Khorasani, A.; Tabu Ojong, E.; Smolinka, T.; Wilkinson, D.P. Model of Oxygen Bubbles and Performance Impact in the Porous Transport Layer of PEM Water Electrolysis Cells. Int. J. Hydrogen Energy 2017, 42, 28665–28680. [Google Scholar] [CrossRef]
  26. Kadyk, T.; Bruce, D.; Eikerling, M. How to Enhance Gas Removal from Porous Electrodes? Sci. Rep. 2016, 6, 38780. [Google Scholar] [CrossRef] [PubMed]
  27. Vogt, H.; Stephan, K. Local Microprocesses at Gas-Evolving Electrodes and Their Influence on Mass Transfer. Electrochim. Acta 2015, 155, 348–356. [Google Scholar] [CrossRef]
  28. Vassie, P.R.; Tseung, A.C.C. A Study of Gas Evolution in Teflon Bonded Porous Electrodes-I: The Mechanical and Chemical Stability of Teflon Bonded Graphite Electrodes. Electrochim. Acta 1975, 20, 759–761. [Google Scholar] [CrossRef]
  29. Ito, H.; Maeda, T.; Nakano, A.; Hasegawa, Y.; Yokoi, N.; Hwang, C.M.; Ishida, M.; Kato, A.; Yoshida, T. Effect of Flow Regime of Circulating Water on a Proton Exchange Membrane Electrolyzer. Int. J. Hydrogen Energy 2010, 35, 9550–9560. [Google Scholar] [CrossRef]
  30. Wang, W.; Yu, S.; Li, K.; Ding, L.; Xie, Z.; Li, Y.; Yang, G.; Cullen, D.A.; Yu, H.; Kang, Z.; et al. Insights into the Rapid Two-Phase Transport Dynamics in Different Structured Porous Transport Layers of Water Electrolyzers through High-Speed Visualization. J. Power Sources 2021, 516, 230641. [Google Scholar] [CrossRef]
  31. Butterworth, D.; Hewitt, G.F. Two-Phase Flow and Heat Transfer; Oxford University Press: Oxford, UK; New York, NY, USA, 1977; pp. 18–39. [Google Scholar]
  32. Chien, S.-F.; Ibele, W. Pressure Drop and Liquid Film Thickness of Two-Phase Annular and Annular-Mist Flows. J. Heat Transf. 1964, 86, 89–96. [Google Scholar] [CrossRef]
  33. Sakuma, G.; Fukunaka, Y.; Matsushima, H. Nucleation and Growth of Electrolytic Gas Bubbles under Microgravity. Int. J. Hydrogen Energy 2014, 39, 7638–7645. [Google Scholar] [CrossRef]
  34. Jiang, Y.; Li, Y.; Ding, Y.; Hu, S.; Dang, J.; Yang, F.; Ouyang, M. Simulation and Experiment Study on Two-Phase Flow Characteristics of Proton Exchange Membrane Electrolysis Cell. J. Power Sources 2023, 553, 232303. [Google Scholar] [CrossRef]
  35. Mo, J. Fundamental Studies of Electrochemical Reactions and Microfluidics in Proton Exchange Membrane Electrolyzer Cells. Ph.D. Dissertation, University of Tennessee, Knoxville, TN, USA, 2016. [Google Scholar]
  36. Yang, X.; Karnbach, F.; Uhlemann, M.; Odenbach, S.; Eckert, K. Dynamics of Single Hydrogen Bubbles at a Platinum Microelectrode. Langmuir 2015, 31, 8184–8193. [Google Scholar] [CrossRef]
  37. Angulo, A.; van der Linde, P.; Gardeniers, H.; Modestino, M.; Fernández Rivas, D. Influence of Bubbles on the Energy Conversion Efficiency of Electrochemical Reactors. Joule 2020, 4, 555–579. [Google Scholar] [CrossRef]
  38. Majasan, J.O.; Cho, J.I.S.; Dedigama, I.; Tsaoulidis, D.; Shearing, P.; Brett, D.J.L. Two-Phase Flow Behaviour and Performance of Polymer Electrolyte Membrane Electrolysers: Electrochemical and Optical Characterisation. Int. J. Hydrogen Energy 2018, 43, 15659–15672. [Google Scholar] [CrossRef]
  39. Wang, Z.; Wang, X.; Chen, Z.; Liao, Z.; Xu, C.; Du, X. Energy and Exergy Analysis of a Proton Exchange Membrane Water Electrolysis System without Additional Internal Cooling. Renew. Energy 2021, 180, 1333–1343. [Google Scholar] [CrossRef]
  40. Li, Y.; Yang, G.; Yu, S.; Kang, Z.; Mo, J.; Han, B.; Talley, D.A.; Zhang, F.Y. In-Situ Investigation and Modeling of Electrochemical Reactions with Simultaneous Oxygen and Hydrogen Microbubble Evolutions in Water Electrolysis. Int. J. Hydrogen Energy 2019, 44, 28283–28293. [Google Scholar] [CrossRef]
  41. Li, H.; Inada, A.; Fujigaya, T.; Nakajima, H.; Sasaki, K.; Ito, K. Effects of Operating Conditions on Performance of High-Temperature Polymer Electrolyte Water Electrolyzer. J. Power Sources 2016, 318, 192–199. [Google Scholar] [CrossRef]
  42. Ojong, E.T.; Kwan, J.T.H.; Nouri-Khorasani, A.; Bonakdarpour, A.; Wilkinson, D.P.; Smolinka, T. Development of an Experimentally Validated Semi-Empirical Fully-Coupled Performance Model of a PEM Electrolysis Cell with a 3-D Structured Porous Transport Layer. Int. J. Hydrogen Energy 2017, 42, 25831–25847. [Google Scholar] [CrossRef]
  43. Sauermoser, M.; Kizilova, N.; Pollet, B.G.; Kjelstrup, S. Flow Field Patterns for Proton Exchange Membrane Fuel Cells. Front. Energy Res. 2020, 8, 00013. [Google Scholar] [CrossRef]
  44. Chakraborty, S.; Elangovan, D.; Palaniswamy, K.; Fly, A.; Ravi, D.; Seelan, D.A.S.; Rajagopal, T.K.R. A Review on the Numerical Studies on the Performance of Proton Exchange Membrane Fuel Cell (PEMFC) Flow Channel Designs for Automotive Applications. Energies 2022, 15, 9520. [Google Scholar] [CrossRef]
  45. Dedigama, I.; Angeli, P.; Ayers, K.; Robinson, J.B.; Shearing, P.R.; Tsaoulidis, D.; Brett, D.J.L. In Situ Diagnostic Techniques for Characterisation of Polymer Electrolyte Membrane Water Electrolysers-Flow Visualisation and Electrochemical Impedance Spectroscopy. Int. J. Hydrogen Energy 2014, 39, 4468–4482. [Google Scholar] [CrossRef]
  46. Holladay, J.D.; Hu, J.; King, D.L.; Wang, Y. An Overview of Hydrogen Production Technologies. Catal. Today 2009, 139, 244–260. [Google Scholar] [CrossRef]
  47. Jiao, K.; Ni, M. Challenges and Opportunities in Modelling of Proton Exchange Membrane Fuel Cells (PEMFC). Int. J. Energy Res. 2017, 41, 1793–1797. [Google Scholar] [CrossRef]
  48. Nasser, M.; Megahed, T.F.; Ookawara, S.; Hassan, H. A Review of Water Electrolysis–Based Systems for Hydrogen Production Using Hybrid/Solar/Wind Energy Systems. Environ. Sci. Pollut. Res. 2022, 29, 86994–87018. [Google Scholar] [CrossRef] [PubMed]
  49. Zhang, T.; Cao, Y.; Zhang, Y.; Wang, K.; Xu, C.; Ye, F. Relationship of Local Current and Two-Phase Flow in Proton Exchange Membrane Electrolyzer Cells. J. Power Sources 2022, 542, 231742. [Google Scholar] [CrossRef]
  50. Villagra, A.; Millet, P. An Analysis of PEM Water Electrolysis Cells Operating at Elevated Current Densities. Int. J. Hydrogen Energy 2019, 44, 9708–9717. [Google Scholar] [CrossRef]
  51. Chen, Y.; Liu, C.; Xu, J.; Xia, C.; Wang, P.; Xia, B.Y.; Yan, Y.; Wang, X. Key Components and Design Strategy for a Proton Exchange Membrane Water Electrolyzer. Small Struct. 2023, 4, 2200130. [Google Scholar] [CrossRef]
  52. Ghernaout, D.; Elboughdiri, N. Towards Combining Electrochemical Water Splitting and Electrochemical Disinfection. Open Access Libr. J. 2021, 8, e7445. [Google Scholar] [CrossRef]
  53. Wang, H.; Turner, J.A. Reviewing Metallic PEMFC Bipolar Plates. Fuel Cells 2010, 10, 510–519. [Google Scholar] [CrossRef]
  54. Jung, H.-Y.; Huang, S.-Y.; Popov, B.N. High-Durability Titanium Bipolar Plate Modified by Electrochemical Deposition of Platinum for Unitized Regenerative Fuel Cell (URFC). J. Power Sources 2010, 195, 1950–1956. [Google Scholar] [CrossRef]
  55. Ayers, K. The Potential of Proton Exchange Membrane-Based Electrolysis Technology. Curr. Opin. Electrochem. 2019, 18, 9–15. [Google Scholar] [CrossRef]
  56. Han, B.; Steen, S.M.; Mo, J.; Zhang, F.Y. Electrochemical Performance Modeling of a Proton Exchange Membrane Electrolyzer Cell for Hydrogen Energy. Int. J. Hydrogen Energy 2015, 40, 7006–7016. [Google Scholar] [CrossRef]
  57. Li, H.; Xu, Y.; Lv, N.; Zhang, Q.; Zhang, X.; Wei, Z.; Wang, Y.; Tang, H.; Pan, H. Ti-Doped SnO2 Supports IrO2 Electrocatalysts for the Oxygen Evolution Reaction (OER) in PEM Water Electrolysis. ACS Sustain. Chem. Eng. 2023, 11, 1121–1132. [Google Scholar] [CrossRef]
  58. Liu, R.-T.; Xu, Z.-L.; Li, F.-M.; Chen, F.-Y.; Yu, J.-Y.; Yan, Y.; Chen, Y.; Xia, B.Y. Recent Advances in Proton Exchange Membrane Water Electrolysis. Chem. Soc. Rev. 2023, 52, 5652–5683. [Google Scholar] [CrossRef]
  59. Babic, U.; Suermann, M.; Büchi, F.N.; Gubler, L.; Schmidt, T.J. Critical Review-Identifying Critical Gaps for Polymer Electrolyte Water Electrolysis Development. J. Electrochem. Soc. 2017, 164, F387. [Google Scholar] [CrossRef]
  60. Liu, L. Platinum Group Metal Free Nano-Catalysts for Proton Exchange Membrane Water Electrolysis. Curr. Opin. Chem. Eng. 2021, 34, 100743. [Google Scholar] [CrossRef]
  61. Najafi, L.; Bellani, S.; Oropesa-Nuñez, R.; Ansaldo, A.; Prato, M.; Del Rio Castillo, A.E.; Bonaccorso, F. Doped-MoSe2 Nanoflakes/3d Metal Oxide-Hydr (Oxy) Oxides Hybrid Catalysts for PH-Universal Electrochemical Hydrogen Evolution Reaction. Adv. Energy Mater. 2018, 8, 1801764. [Google Scholar] [CrossRef]
  62. Rong, C.; Shen, X.; Wang, Y.; Thomsen, L.; Zhao, T.; Li, Y.; Lu, X.; Amal, R.; Zhao, C. Electronic Structure Engineering of Single-Atom Ru Sites via Co-N4 Sites for Bifunctional PH-Universal Water Splitting. Adv. Mater. 2022, 34, 2110103. [Google Scholar] [CrossRef]
  63. Peng, X.; Zhao, S.; Mi, Y.; Han, L.; Liu, X.; Qi, D.; Sun, J.; Liu, Y.; Bao, H.; Zhuo, L. Trifunctional Single-atomic Ru Sites Enable Efficient Overall Water Splitting and Oxygen Reduction in Acidic Media. Small 2020, 16, 2002888. [Google Scholar] [CrossRef]
  64. Streckova, M.; Petrus, O.; Guboova, A.; Orinakova, R.; Girman, V.; Bera, C.; Batkova, M.; Balaz, M.; Shepa, J.; Dusza, J. Nanoarchitectonics of Binary Transition Metal Phosphides Embedded in Carbon Fibers as a Bifunctional Electrocatalysts for Electrolytic Water Splitting. J. Alloys Compd. 2022, 923, 166472. [Google Scholar] [CrossRef]
  65. Ma, P.; Zhao, M.; Zhang, L.; Wang, H.; Gu, J.; Sun, Y.; Ji, W.; Fu, Z. Self-Supported High-Entropy Alloy Electrocatalyst for Highly Efficient H2 Evolution in Acid Condition. J. Mater. 2020, 6, 736–742. [Google Scholar] [CrossRef]
  66. Hui, L.; Xue, Y.; Yu, H.; Liu, Y.; Fang, Y.; Xing, C.; Huang, B.; Li, Y. Highly Efficient and Selective Generation of Ammonia and Hydrogen on a Graphdiyne-Based Catalyst. J. Am. Chem. Soc. 2019, 141, 10677–10683. [Google Scholar] [CrossRef] [PubMed]
  67. Xue, Y.; Huang, B.; Yi, Y.; Guo, Y.; Zuo, Z.; Li, Y.; Jia, Z.; Liu, H.; Li, Y. Anchoring Zero Valence Single Atoms of Nickel and Iron on Graphdiyne for Hydrogen Evolution. Nat. Commun. 2018, 9, 1460. [Google Scholar] [CrossRef] [PubMed]
  68. Wan, J.; Zhao, Z.; Shang, H.; Peng, B.; Chen, W.; Pei, J.; Zheng, L.; Dong, J.; Cao, R.; Sarangi, R. In Situ Phosphatizing of Triphenylphosphine Encapsulated within Metal-Organic Frameworks to Design Atomic Co1-P1N3 Interfacial Structure for Promoting Catalytic Performance. J. Am. Chem. Soc. 2020, 142, 8431–8439. [Google Scholar] [CrossRef]
  69. Chan, C.-Y.; Chang, C.-H.; Tuan, H.-Y. Colloidal Synthesis of Porous Red Phosphorus Nanoparticles as a Metal-Free Electrocatalyst for the Hydrogen Evolution Reaction. Chem. Commun. 2020, 56, 2937–2940. [Google Scholar] [CrossRef]
  70. He, F.; Xing, C.; Xue, Y. Metal-Free Amino-Graphdiyne for Applications in Electrocatalytic Hydrogen Evolution. J. Catal. 2021, 395, 129–135. [Google Scholar] [CrossRef]
  71. Li, Y.; Ai, C.; Deng, S.; Wang, Y.; Tong, X.; Wang, X.; Xia, X.; Tu, J. Nitrogen Doped Vertical Graphene as Metal-Free Electrocatalyst for Hydrogen Evolution Reaction. Mater. Res. Bull. 2021, 134, 111094. [Google Scholar] [CrossRef]
  72. Gao, R.; Dai, Q.; Du, F.; Yan, D.; Dai, L. C60-Adsorbed Single-Walled Carbon Nanotubes as Metal-Free, PH-Universal, and Multifunctional Catalysts for Oxygen Reduction, Oxygen Evolution, and Hydrogen Evolution. J. Am. Chem. Soc. 2019, 141, 11658–11666. [Google Scholar] [CrossRef]
  73. Pu, Z.; Liu, T.; Zhao, W.; Shi, X.; Liu, Y.; Zhang, G.; Hu, W.; Sun, S.; Liao, S. Versatile Route to Fabricate Precious-Metal Phosphide Electrocatalyst for Acid-Stable Hydrogen Oxidation and Evolution Reactions. ACS Appl. Mater. Interfaces 2020, 12, 11737–11744. [Google Scholar] [CrossRef]
  74. Gago, A.S.; Ansar, A.S.; Gazdzicki, P.; Wagner, N.; Arnold, J.; Friedrich, K.A. Low Cost Bipolar Plates for Large Scale PEM Electrolyzers. ECS Trans. 2014, 64, 1039–1048. [Google Scholar] [CrossRef]
  75. Liu, G.; Shan, D.; Fang, B.; Wang, X. Novel Hybrid Coating of TiN and Carbon with Improved Corrosion Resistance for Bipolar Plates of PEM Water Electrolysis. Int. J. Hydrogen Energy 2023, 48, 18996–19007. [Google Scholar] [CrossRef]
  76. Rojas, N.; Sánchez-Molina, M.; Sevilla, G.; Amores, E.; Almandoz, E.; Esparza, J.; Vivas, M.R.C.; Colominas, C. Coated Stainless Steels Evaluation for Bipolar Plates in PEM Water Electrolysis Conditions. Int. J. Hydrogen Energy 2021, 46, 25929–25943. [Google Scholar] [CrossRef]
  77. Mo, J.; Dehoff, R.R.; Peter, W.H.; Toops, T.J.; Green, J.B., Jr.; Zhang, F.-Y. Additive Manufacturing of Liquid/Gas Diffusion Layers for Low-Cost and High-Efficiency Hydrogen Production. Int. J. Hydrogen Energy 2016, 41, 3128–3135. [Google Scholar] [CrossRef]
  78. Yang, G.; Xie, Z.; Yu, S.; Li, K.; Li, Y.; Ding, L.; Wang, W.; Zhang, F.-Y. All-in-One Bipolar Electrode: A New Concept for Compact and Efficient Water Electrolyzers. Nano Energy 2021, 90, 106551. [Google Scholar] [CrossRef]
  79. Langemann, M.; Fritz, D.L.; Müller, M.; Stolten, D. Validation and Characterization of Suitable Materials for Bipolar Plates in PEM Water Electrolysis. Int. J. Hydrogen Energy 2015, 40, 11385–11391. [Google Scholar] [CrossRef]
  80. Toops, T.J.; Brady, M.P.; Zhang, F.-Y.; Meyer, H.M., III; Ayers, K.; Roemer, A.; Dalton, L. Evaluation of Nitrided Titanium Separator Plates for Proton Exchange Membrane Electrolyzer Cells. J. Power Sources 2014, 272, 954–960. [Google Scholar] [CrossRef]
  81. Hemauer, J.; Rehfeldt, S.; Klein, H.; Peschel, A. Performance and Cost Modelling Taking into Account the Uncertainties and Sensitivities of Current and Next-Generation PEM Water Electrolysis Technology. Int. J. Hydrogen Energy 2023, 48, 25619–25634. [Google Scholar] [CrossRef]
  82. Frensch, S.H.; Fouda-Onana, F.; Serre, G.; Thoby, D.; Araya, S.S.; Kær, S.K. Influence of the Operation Mode on PEM Water Electrolysis Degradation. Int. J. Hydrogen Energy 2019, 44, 29889–29898. [Google Scholar] [CrossRef]
  83. Li, H.; Nakajima, H.; Inada, A.; Ito, K. Effect of Flow-Field Pattern and Flow Configuration on the Performance of a Polymer-Electrolyte-Membrane Water Electrolyzer at High Temperature. Int. J. Hydrogen Energy 2018, 43, 8600–8610. [Google Scholar] [CrossRef]
  84. Watanabe, K.; Wakuda, K.; Wani, K.; Araki, T.; Nagasawa, K.; Mitsushima, S. Existence of Dissolved Oxygen near Anode Catalyst in Proton Exchange Membrane Water Electrolyzers. J. Electrochem. Soc. 2022, 169, 044515. [Google Scholar] [CrossRef]
  85. Maier, M.; Meyer, Q.; Majasan, J.; Tan, C.; Dedigama, I.; Robinson, J.; Dodwell, J.; Wu, Y.; Castanheira, L.; Hinds, G. Operando Flow Regime Diagnosis Using Acoustic Emission in a Polymer Electrolyte Membrane Water Electrolyser. J. Power Sources 2019, 424, 138–149. [Google Scholar] [CrossRef]
  86. Hoeh, M.A.; Arlt, T.; Manke, I.; Banhart, J.; Fritz, D.L.; Maier, W.; Lehnert, W. In Operando Synchrotron X-Ray Radiography Studies of Polymer Electrolyte Membrane Water Electrolyzers. Electrochem. Commun. 2015, 55, 55–59. [Google Scholar] [CrossRef]
  87. Selamet, Ö.F.; Becerikli, F.; Mat, M.D.; Kaplan, Y. Development and Testing of a Highly Efficient Proton Exchange Membrane (PEM) Electrolyzer Stack. Int. J. Hydrogen Energy 2011, 36, 11480–11487. [Google Scholar] [CrossRef]
  88. Zhang, Z.; Xing, X. Simulation and Experiment of Heat and Mass Transfer in a Proton Exchange Membrane Electrolysis Cell. Int. J. Hydrogen Energy 2020, 45, 20184–20193. [Google Scholar] [CrossRef]
  89. Lee, C.H.; Lee, J.K.; Zhao, B.; Fahy, K.F.; LaManna, J.M.; Baltic, E.; Hussey, D.S.; Jacobson, D.L.; Schulz, V.P.; Bazylak, A. Temperature-Dependent Gas Accumulation in Polymer Electrolyte Membrane Electrolyzer Porous Transport Layers. J. Power Sources 2020, 446, 227312. [Google Scholar] [CrossRef]
  90. Panchenko, O.; Borgardt, E.; Zwaygardt, W.; Hackemüller, F.J.; Bram, M.; Kardjilov, N.; Arlt, T.; Manke, I.; Müller, M.; Stolten, D. In-Situ Two-Phase Flow Investigation of Different Porous Transport Layer for a Polymer Electrolyte Membrane (PEM) Electrolyzer with Neutron Spectroscopy. J. Power Sources 2018, 390, 108–115. [Google Scholar] [CrossRef]
  91. Lee, C.; Lee, J.K.; George, M.G.; Fahy, K.F.; LaManna, J.M.; Baltic, E.; Hussey, D.S.; Jacobson, D.L.; Bazylak, A. Reconciling Temperature-Dependent Factors Affecting Mass Transport Losses in Polymer Electrolyte Membrane Electrolyzers. Energy Convers. Manag. 2020, 213, 112797. [Google Scholar] [CrossRef]
  92. Yuan, S.; Zhao, C.; Cai, X.; An, L.; Shen, S.; Yan, X.; Zhang, J. Bubble Evolution and Transport in PEM Water Electrolysis: Mechanism, Impact, and Management. Prog. Energy Combust. Sci. 2023, 96, 101075. [Google Scholar] [CrossRef]
  93. Alia, S.M.; Reeves, K.S.; Baxter, J.S.; Cullen, D.A. The Impact of Ink and Spray Variables on Catalyst Layer Properties, Electrolyzer Performance, and Electrolyzer Durability. J. Electrochem. Soc. 2020, 167, 144512. [Google Scholar] [CrossRef]
  94. Modestino, M.A.; Hashemi, S.M.H.; Haussener, S. Mass Transport Aspects of Electrochemical Solar-Hydrogen Generation. Energy Environ. Sci. 2016, 9, 1533–1551. [Google Scholar] [CrossRef]
  95. Newman, J.; Balsara, N.P. Electrochemical Systems; John Wiley & Sons: Hoboken, NJ, USA, 2021; ISBN 1119514606. [Google Scholar]
  96. Tijani, A.S.; Kamarudin, N.A.B.; Mazlan, F.A.B. Investigation of the Effect of Charge Transfer Coefficient (CTC) on the Operating Voltage of Polymer Electrolyte Membrane (PEM) Electrolyzer. Int. J. Hydrogen Energy 2018, 43, 9119–9132. [Google Scholar] [CrossRef]
  97. Tijani, A.; Amirul, M.; Najib, A.; Mustafa, N. Numerical Analysis of the Effect of Charge Transfer Coefficient (CTC) on Bubble Evolution of Polymer Electrolyte Membrane (PEM) Electrolyzer. J. Mech. Eng. 2022, 11, 81–94. [Google Scholar] [CrossRef]
  98. Balzer, R.J.; Vogt, H. Effect of Electrolyte Flow on the Bubble Coverage of Vertical Gas-Evolving Electrodes. J. Electrochem. Soc. 2002, 150, E11. [Google Scholar] [CrossRef]
  99. Zhao, X.; Ren, H.; Luo, L. Gas Bubbles in Electrochemical Gas Evolution Reactions. Langmuir 2019, 35, 5392–5408. [Google Scholar] [CrossRef] [PubMed]
  100. He, Y.; Cui, Y.; Shang, W.; Zhao, Z.; Tan, P. Insight into the Bubble-Induced Overpotential towards High-Rate Charging of Zn-Air Batteries. Chem. Eng. J. 2022, 448, 137782. [Google Scholar] [CrossRef]
  101. Abdin, Z.; Webb, C.J.; Gray, E.M. Modelling and Simulation of a Proton Exchange Membrane (PEM) Electrolyser Cell. Int. J. Hydrogen Energy 2015, 40, 13243–13257. [Google Scholar] [CrossRef]
  102. Aubras, F.; Deseure, J.; Kadjo, J.-J.; Dedigama, I.; Majasan, J.; Grondin-Perez, B.; Chabriat, J.-P.; Brett, D.J.L. Two-Dimensional Model of Low-Pressure PEM Electrolyser: Two-Phase Flow Regime, Electrochemical Modelling and Experimental Validation. Int. J. Hydrogen Energy 2017, 42, 26203–26216. [Google Scholar] [CrossRef]
  103. Li, L.; Nakajima, H.; Moriyama, A.; Ito, K. Theoretical Analysis of the Effect of Boiling on the Electrolysis Voltage of a Polymer Electrolyte Membrane Water Electrolyzer (PEMWE). J. Power Sources 2023, 575, 233143. [Google Scholar] [CrossRef]
  104. García-Valverde, R.; Espinosa, N.; Urbina, A. Simple PEM Water Electrolyser Model and Experimental Validation. Int. J. Hydrogen Energy 2012, 37, 1927–1938. [Google Scholar] [CrossRef]
  105. Biaku, C.Y.; Dale, N.V.; Mann, M.D.; Salehfar, H.; Peters, A.J.; Han, T. A Semiempirical Study of the Temperature Dependence of the Anode Charge Transfer Coefficient of a 6 KW PEM Electrolyzer. Int. J. Hydrogen Energy 2008, 33, 4247–4254. [Google Scholar] [CrossRef]
  106. Ma, Z.; Witteman, L.; Wrubel, J.A.; Bender, G. A Comprehensive Modeling Method for Proton Exchange Membrane Electrolyzer Development. Int. J. Hydrogen Energy 2021, 46, 17627–17643. [Google Scholar] [CrossRef]
  107. Bazarah, A.; Majlan, E.H.; Husaini, T.; Zainoodin, A.M.; Alshami, I.; Goh, J.; Masdar, M.S. Factors Influencing the Performance and Durability of Polymer Electrolyte Membrane Water Electrolyzer: A Review. Int. J. Hydrogen Energy 2022, 47, 35976–35989. [Google Scholar] [CrossRef]
  108. Marangio, F.; Santarelli, M.; Calì, M. Theoretical Model and Experimental Analysis of a High Pressure PEM Water Electrolyser for Hydrogen Production. Int. J. Hydrogen Energy 2009, 34, 1143–1158. [Google Scholar] [CrossRef]
  109. Pushkarev, A.S.; Pushkareva, I.V.; Solovyev, M.A.; Prokop, M.; Bystron, T.; Rajagopalan, S.K.; Bouzek, K.; Grigoriev, S.A. On the Influence of Porous Transport Layers Parameters on the Performances of Polymer Electrolyte Membrane Water Electrolysis Cells. Electrochim. Acta 2021, 399, 139436. [Google Scholar] [CrossRef]
  110. Sood, S.; Prakash, O.; Boukerdja, M.; Dieulot, J.-Y.; Ould-Bouamama, B.; Bressel, M.; Gehin, A.-L. Generic Dynamical Model of PEM Electrolyser under Intermittent Sources. Energies 2020, 13, 6556. [Google Scholar] [CrossRef]
  111. Li, Y.; Kang, Z.; Deng, X.; Yang, G.; Yu, S.; Mo, J.; Talley, D.A.; Jennings, G.K.; Zhang, F.Y. Wettability Effects of Thin Titanium Liquid/Gas Diffusion Layers in Proton Exchange Membrane Electrolyzer Cells. Electrochim. Acta 2019, 298, 704–708. [Google Scholar] [CrossRef]
  112. Barbir, F. PEM Electrolysis for Production of Hydrogen from Renewable Energy Sources. Solar Energy 2005, 78, 661–669. [Google Scholar] [CrossRef]
  113. Yuan, S.; Zhao, C.; Mei, X.; Shen, S.; Wang, Q.; Yan, X.; Zhang, J. Bubble Management in PEM Water Electrolysis via Imprinting Patterned Grooves on Catalyst Layer. Int. J. Heat Mass Transf. 2023, 212, 124249. [Google Scholar] [CrossRef]
  114. Lee, C.H.; Lee, J.K.; Zhao, B.; Fahy, K.F.; Bazylak, A. Transient Gas Distribution in Porous Transport Layers of Polymer Electrolyte Membrane Electrolyzers. J. Electrochem. Soc. 2020, 167, 024508. [Google Scholar] [CrossRef]
  115. Yu, C.; Zhang, P.; Wang, J.; Jiang, L. Superwettability of Gas Bubbles and Its Application: From Bioinspiration to Advanced Materials. Adv. Mater. 2017, 29, 1703053. [Google Scholar] [CrossRef] [PubMed]
  116. Cho, K.M.; Deshmukh, P.R.; Shin, W.G. Hydrodynamic Behavior of Bubbles at Gas-Evolving Electrode in Ultrasonic Field during Water Electrolysis. Ultrason. Sonochem. 2021, 80, 105796. [Google Scholar] [CrossRef] [PubMed]
  117. Yang, F.; Wang, P.; Hao, J.; Qu, J.; Cai, Y.; Yang, X.; Li, C.M.; Hu, J. Ultrasound-Assisted Piezoelectric Photocatalysis: An Effective Strategy for Enhancing Hydrogen Evolution from Water Splitting. Nano Energy 2023, 118, 108993. [Google Scholar] [CrossRef]
  118. Duan, X.; Xiao, J.; Lin, W.; Wang, S.; Wen, J. Experimental and Numerical Investigation of the Impact of Operating Conditions on Water Electrolysis with Ultrasonic. Int. J. Hydrogen Energy 2023, 49, 404–416. [Google Scholar] [CrossRef]
  119. Solymosi, T.; Geißelbrecht, M.; Mayer, S.; Auer, M.; Leicht, P.; Terlinden, M.; Malgaretti, P.; Bösmann, A.; Preuster, P.; Harting, J. Nucleation as a Rate-Determining Step in Catalytic Gas Generation Reactions from Liquid Phase Systems. Sci. Adv. 2022, 8, eade3262. [Google Scholar] [CrossRef] [PubMed]
  120. Lavenson, D.M.; Kelkar, A.V.; Daniel, A.B.; Mohammad, S.A.; Kouba, G.; Aichele, C.P. Gas Evolution Rates-A Critical Uncertainty in Challenged Gas-Liquid Separations. J. Pet. Sci. Eng. 2016, 147, 816–828. [Google Scholar] [CrossRef]
  121. Shibata, S. Supersaturation of Oxygen in Acidic Solution in the Vicinity of an Oxygen-Evolving Platinum Anode. Electrochim. Acta 1978, 23, 619–623. [Google Scholar] [CrossRef]
  122. Trinke, P.; Bensmann, B.; Hanke-Rauschenbach, R. Current Density Effect on Hydrogen Permeation in PEM Water Electrolyzers. Int. J. Hydrogen Energy 2017, 42, 14355–14366. [Google Scholar] [CrossRef]
  123. Wang, M.; Wang, Z.; Gong, X.; Guo, Z. The Intensification Technologies to Water Electrolysis for Hydrogen Production—A Review. Renew. Sustain. Energy Rev. 2014, 29, 573–588. [Google Scholar] [CrossRef]
  124. Caupin, F.; Herbert, E. Cavitation in Water: A Review. C. R. Phys. 2006, 7, 1000–1017. [Google Scholar] [CrossRef]
  125. Jones, S.F.; Evans, G.; Galvin, K.P. Bubble Nucleation from Gas Cavities—A Review. Adv. Colloid Interface Sci. 1999, 80, 27–50. [Google Scholar] [CrossRef]
  126. Satjaritanun, P.; O’Brien, M.; Kulkarni, D.; Shimpalee, S.; Capuano, C.; Ayers, K.E.; Danilovic, N.; Parkinson, D.Y.; Zenyuk, I. V Observation of Preferential Pathways for Oxygen Removal through Porous Transport Layers of Polymer Electrolyte Water Electrolyzers. iScience 2020, 23, 101783. [Google Scholar] [CrossRef] [PubMed]
  127. Kang, Z.; Mo, J.; Yang, G.; Retterer, S.T.; Cullen, D.A.; Toops, T.J.; Green, J.B.; Mench, M.M.; Zhang, F.Y. Investigation of Thin/Well-Tunable Liquid/Gas Diffusion Layers Exhibiting Superior Multifunctional Performance in Low-Temperature Electrolytic Water Splitting. Energy Environ. Sci. 2017, 10, 166–175. [Google Scholar] [CrossRef]
  128. Brussieux, C.; Viers, P.; Roustan, H.; Rakib, M. Controlled Electrochemical Gas Bubble Release from Electrodes Entirely and Partially Covered with Hydrophobic Materials. Electrochim. Acta 2011, 56, 7194–7201. [Google Scholar] [CrossRef]
  129. Zeradjanin, A.R.; Ventosa, E.; Bondarenko, A.S.; Schuhmann, W. Evaluation of the Catalytic Performance of Gas-Evolving Electrodes Using Local Electrochemical Noise Measurements. ChemSusChem 2012, 5, 1905–1911. [Google Scholar] [CrossRef] [PubMed]
  130. Selamet, O.F.; Pasaogullari, U.; Spernjak, D.; Hussey, D.S.; Jacobson, D.L.; Mat, M.D. Two-Phase Flow in a Proton Exchange Membrane Electrolyzer Visualized in Situ by Simultaneous Neutron Radiography and Optical Imaging. Int. J. Hydrogen Energy 2013, 38, 5823–5835. [Google Scholar] [CrossRef]
  131. Soto, A.M.; German, S.R.; Ren, H.; Van Der Meer, D.; Lohse, D.; Edwards, M.A.; White, H.S. The Nucleation Rate of Single O2 Nanobubbles at Pt Nanoelectrodes. Langmuir 2018, 34, 7309–7318. [Google Scholar] [CrossRef]
  132. Kolasinski, K.W. Bubbles: A Review of Their Relationship to the Formation of Thin Films and Porous Materials. Open Mater. Sci. 2014, 1, 49–60. [Google Scholar] [CrossRef]
  133. Peñas, P.; van der Linde, P.; Vijselaar, W.; van der Meer, D.; Lohse, D.; Huskens, J.; Gardeniers, H.; Modestino, M.A.; Rivas, D.F. Decoupling Gas Evolution from Water-Splitting Electrodes. J. Electrochem. Soc. 2019, 166, H769–H776. [Google Scholar] [CrossRef]
  134. Enríquez, O.R.; Hummelink, C.; Bruggert, G.-W.; Lohse, D.; Prosperetti, A.; Van Der Meer, D.; Sun, C. Growing Bubbles in a Slightly Supersaturated Liquid Solution. Rev. Sci. Instrum. 2013, 84, 065111. [Google Scholar] [CrossRef]
  135. Fernández, D.; Maurer, P.; Martine, M.; Coey, J.M.D.; Möbius, M.E. Bubble Formation at a Gas-Evolving Microelectrode. Langmuir 2014, 30, 13065–13074. [Google Scholar] [CrossRef] [PubMed]
  136. Raman, A.; Penas, P.; van der Meer, D.; Lohse, D.; Gardeniers, H.; Rivas, D.F. Potential Response of Single Successive Constant-Current-Driven Electrolytic Hydrogen Bubbles Spatially Separated from the Electrode. Electrochim. Acta 2022, 425, 140691. [Google Scholar] [CrossRef]
  137. Brandon, N.P.; Kelsall, G.H. Growth Kinetics of Bubbles Electrogenerated at Microelectrodes. J. Appl. Electrochem. 1985, 15, 475–484. [Google Scholar] [CrossRef]
  138. Donose, B.C.; Harnisch, F.; Taran, E. Electrochemically Produced Hydrogen Bubble Probes for Gas Evolution Kinetics and Force Spectroscopy. Electrochem. Commun. 2012, 24, 21–24. [Google Scholar] [CrossRef]
  139. Moreno Soto, Á. Bubbles on Surfaces: Diffusive Growth & Electrolysis; University of Twente: Enschede, The Netherland, 2019. [Google Scholar]
  140. Kikuchi, K.; Tanaka, Y.; Saihara, Y.; Maeda, M.; Kawamura, M.; Ogumi, Z. Concentration of Hydrogen Nanobubbles in Electrolyzed Water. J. Colloid Interface Sci. 2006, 298, 914–919. [Google Scholar] [CrossRef]
  141. Jeon, D.H.; Kim, S.; Kim, M.J.; Lee, C.; Cho, H.S. Oxygen Bubble Transport in a Porous Transport Layer of Polymer Electrolyte Water Electrolyzer. J. Power Sources 2023, 553, 232322. [Google Scholar] [CrossRef]
  142. Lettenmeier, P.; Kolb, S.; Burggraf, F.; Gago, A.S.; Friedrich, K.A. Towards Developing a Backing Layer for Proton Exchange Membrane Electrolyzers. J. Power Sources 2016, 311, 153–158. [Google Scholar] [CrossRef]
  143. Stiber, S.; Balzer, H.; Wierhake, A.; Wirkert, F.J.; Roth, J.; Rost, U.; Brodmann, M.; Lee, J.K.; Bazylak, A.; Waiblinger, W. Porous Transport Layers for Proton Exchange Membrane Electrolysis under Extreme Conditions of Current Density, Temperature, and Pressure. Adv. Energy Mater. 2021, 11, 2100630. [Google Scholar] [CrossRef]
  144. Lee, J.K.; Lee, C.H.; Fahy, K.F.; Kim, P.J.; Krause, K.; LaManna, J.M.; Baltic, E.; Jacobson, D.L.; Hussey, D.S.; Bazylak, A. Accelerating Bubble Detachment in Porous Transport Layers with Patterned Through-Pores. ACS Appl. Energy Mater. 2020, 3, 9676–9684. [Google Scholar] [CrossRef]
  145. Mo, J.; Kang, Z.; Yang, G.; Retterer, S.T.; Cullen, D.A.; Toops, T.J.; Green, J.B., Jr.; Zhang, F.-Y. Thin Liquid/Gas Diffusion Layers for High-Efficiency Hydrogen Production from Water Splitting. Appl. Energy 2016, 177, 817–822. [Google Scholar] [CrossRef]
  146. Kim, P.J.; Lee, C.; Lee, J.K.; Fahy, K.F.; Bazylak, A. In-Plane Mass Transport in Polymer Electrolyte Membrane Electrolyzer Porous Transport Layers with Through Pores. ECS Trans. 2019, 92, 787. [Google Scholar] [CrossRef]
  147. Friz, W. Maximum Volume of Vapor Bubbles. Physic. Zeitschz. 1935, 36, 354–379. [Google Scholar]
  148. Jones, S.F.; Evans, G.M.; Galvin, K.P. The Cycle of Bubble Production from a Gas Cavity in a Supersaturated Solution. Adv. Colloid Interface Sci. 1999, 80, 51–84. [Google Scholar] [CrossRef]
  149. Duhar, G.; Colin, C. Dynamics of Bubble Growth and Detachment in a Viscous Shear Flow. Phys. Fluids 2006, 18, 077101. [Google Scholar] [CrossRef]
  150. Darband, G.B.; Aliofkhazraei, M.; Shanmugam, S. Recent Advances in Methods and Technologies for Enhancing Bubble Detachment during Electrochemical Water Splitting. Renew. Sustain. Energy Rev. 2019, 114, 109300. [Google Scholar] [CrossRef]
  151. Kuang, M.; Wang, J.; Jiang, L. Bio-Inspired Photonic Crystals with Superwettability. Chem. Soc. Rev. 2016, 45, 6833–6854. [Google Scholar] [CrossRef] [PubMed]
  152. Chen, Q.; Wiedenroth, H.S.; German, S.R.; White, H.S. Electrochemical Nucleation of Stable N2 Nanobubbles at Pt Nanoelectrodes. J. Am. Chem. Soc. 2015, 137, 12064–12069. [Google Scholar] [CrossRef] [PubMed]
  153. Garcia-Navarro, J.C.; Schulze, M.; Friedrich, K.A. Detecting and Modeling Oxygen Bubble Evolution and Detachment in Proton Exchange Membrane Water Electrolyzers. Int. J. Hydrogen Energy 2019, 44, 27190–27203. [Google Scholar] [CrossRef]
  154. Dedigama, I.; Angeli, P.; Van Dijk, N.; Millichamp, J.; Tsaoulidis, D.; Shearing, P.R.; Brett, D.J.L. Current Density Mapping and Optical Flow Visualisation of a Polymer Electrolyte Membrane Water Electrolyser. J. Power Sources 2014, 265, 97–103. [Google Scholar] [CrossRef]
  155. Li, Y.; Yang, G.; Yu, S.; Mo, J.; Li, K.; Xie, Z.; Ding, L.; Wang, W.; Zhang, F.-Y. High-Speed Characterization of Two-Phase Flow and Bubble Dynamics in Titanium Felt Porous Media for Hydrogen Production. Electrochim. Acta 2021, 370, 137751. [Google Scholar] [CrossRef]
  156. Bonanno, M.; Müller, K.; Bensmann, B.; Hanke-Rauschenbach, R.; Peach, R.; Thiele, S. Evaluation of the Efficiency of an Elevated Temperature Proton Exchange Membrane Water Electrolysis System. J. Electrochem. Soc. 2021, 168, 094504. [Google Scholar] [CrossRef]
  157. Moon, J.W.; Kim, S.K.; Jung, S.Y. In-Situ Visualization of Cathode Flow Channel in Polymer Electrolyte Membrane Fuel Cell: Effect of GDL Degradation. Int. J. Hydrogen Energy 2023, in press. [Google Scholar] [CrossRef]
  158. Tijani, A.S.; Barr, D.; Rahim, A.H.A. Computational Modelling of the Flow Field of an Electrolyzer System Using CFD. Energy Procedia 2015, 79, 195–203. [Google Scholar] [CrossRef]
  159. Lee, B.; Park, K.; Kim, H.-M. Dynamic Simulation of PEM Water Electrolysis and Comparison with Experiments. Int. J. Electrochem. Sci. 2013, 8, 235–248. [Google Scholar] [CrossRef]
  160. Toghyani, S.; Afshari, E.; Baniasadi, E.; Atyabi, S.A. Thermal and Electrochemical Analysis of Different Flow Field Patterns in a PEM Electrolyzer. Electrochim. Acta 2018, 267, 234–245. [Google Scholar] [CrossRef]
  161. Lafmejani, S.S.; Müller, M.; Olesen, A.C.; Kær, S.K. Experimental and Numerical Study of Flow in Expanded Metal Plate for Water Electrolysis Applications. J. Power Sources 2018, 397, 334–342. [Google Scholar] [CrossRef]
  162. Zhang, Y.; Merrill, M.D.; Logan, B.E. The Use and Optimization of Stainless Steel Mesh Cathodes in Microbial Electrolysis Cells. Int. J. Hydrogen Energy 2010, 35, 12020–12028. [Google Scholar] [CrossRef]
  163. Olesen, A.C.; Rømer, C.; Kær, S.K. A Numerical Study of the Gas-Liquid, Two-Phase Flow Maldistribution in the Anode of a High Pressure PEM Water Electrolysis Cell. Int. J. Hydrogen Energy 2016, 41, 52–68. [Google Scholar] [CrossRef]
  164. Olesen, A.C.; Frensch, S.H.; Kær, S.K. Towards Uniformly Distributed Heat, Mass and Charge: A Flow Field Design Study for High Pressure and High Current Density Operation of PEM Electrolysis Cells. Electrochim. Acta 2019, 293, 476–495. [Google Scholar] [CrossRef]
  165. Minnaar, C.; De Beer, F.; Bessarabov, D. Current Density Distribution of Electrolyzer Flow Fields: In Situ Current Mapping and Neutron Radiography. Energy Fuels 2020, 34, 1014–1023. [Google Scholar] [CrossRef]
  166. Logan, B.E.; Call, D.; Cheng, S.; Hamelers, H.V.M.; Sleutels, T.H.J.A.; Jeremiasse, A.W.; Rozendal, R.A. Microbial Electrolysis Cells for High Yield Hydrogen Gas Production from Organic Matter. Environ. Sci. Technol. 2008, 42, 8630–8640. [Google Scholar] [CrossRef] [PubMed]
  167. Ayers, K.E.; Renner, J.N.; Danilovic, N.; Wang, J.X.; Zhang, Y.; Maric, R.; Yu, H. Pathways to Ultra-Low Platinum Group Metal Catalyst Loading in Proton Exchange Membrane Electrolyzers. Catal. Today 2016, 262, 121–132. [Google Scholar] [CrossRef]
  168. Cheng, L.; Huang, W.; Gong, Q.; Liu, C.; Liu, Z.; Li, Y.; Dai, H. Ultrathin WS2 Nanoflakes as a High-performance Electrocatalyst for the Hydrogen Evolution Reaction. Angew. Chem. Int. Ed. 2014, 53, 7860–7863. [Google Scholar] [CrossRef] [PubMed]
  169. Xie, J.; Zhang, H.; Li, S.; Wang, R.; Sun, X.; Zhou, M.; Zhou, J.; Lou, X.W.; Xie, Y. Defect-rich MoS2 Ultrathin Nanosheets with Additional Active Edge Sites for Enhanced Electrocatalytic Hydrogen Evolution. Adv. Mater. 2013, 25, 5807–5813. [Google Scholar] [CrossRef] [PubMed]
  170. Kornienko, N.; Resasco, J.; Becknell, N.; Jiang, C.-M.; Liu, Y.-S.; Nie, K.; Sun, X.; Guo, J.; Leone, S.R.; Yang, P. Operando Spectroscopic Analysis of an Amorphous Cobalt Sulfide Hydrogen Evolution Electrocatalyst. J. Am. Chem. Soc. 2015, 137, 7448–7455. [Google Scholar] [CrossRef] [PubMed]
  171. Lu, S.; Zhuang, Z. Electrocatalysts for Hydrogen Oxidation and Evolution Reactions. Sci. China Mater. 2016, 3, 217–238. [Google Scholar] [CrossRef]
  172. Shi, J.; Ma, L.; Wu, P.; Zhou, Z.; Guo, P.; Shen, S.; Jing, D.; Guo, L. A Novel Sn2Sb2O7 Nanophotocatalyst for Visible-Light-Driven H2 Evolution. Nano Res. 2012, 5, 576–583. [Google Scholar] [CrossRef]
  173. Fan, X.; Zhou, H.; Guo, X. WC Nanocrystals Grown on Vertically Aligned Carbon Nanotubes: An Efficient and Stable Electrocatalyst for Hydrogen Evolution Reaction. ACS Nano 2015, 9, 5125–5134. [Google Scholar] [CrossRef]
  174. Ma, R.; Zhou, Y.; Chen, Y.; Li, P.; Liu, Q.; Wang, J. Ultrafine Molybdenum Carbide Nanoparticles Composited with Carbon as a Highly Active Hydrogen-evolution Electrocatalyst. Angew. Chem. 2015, 127, 14936–14940. [Google Scholar] [CrossRef]
  175. Zhou, H.; Wang, Y.; He, R.; Yu, F.; Sun, J.; Wang, F.; Lan, Y.; Ren, Z.; Chen, S. One-Step Synthesis of Self-Supported Porous NiSe2/Ni Hybrid Foam: An Efficient 3D Electrode for Hydrogen Evolution Reaction. Nano Energy 2016, 20, 29–36. [Google Scholar] [CrossRef]
  176. Li, F.; Li, J.; Lin, X.; Li, X.; Fang, Y.; Jiao, L.; An, X.; Fu, Y.; Jin, J.; Li, R. Designed Synthesis of Multi-Walled Carbon Nanotubes@ Cu@MoS2 Hybrid as Advanced Electrocatalyst for Highly Efficient Hydrogen Evolution Reaction. J. Power Sources 2015, 300, 301–308. [Google Scholar] [CrossRef]
  177. Liu, S.; Meyer, Q.; Jia, C.; Wang, S.; Rong, C.; Nie, Y.; Zhao, C. Operando Deconvolution of the Degradation Mechanisms of Iron–Nitrogen–Carbon Catalysts in Proton Exchange Membrane Fuel Cells. Energy Environ. Sci. 2023, 16, 3792–3802. [Google Scholar] [CrossRef]
  178. Liu, M.; Sun, Z.; Li, S.; Nie, X.; Liu, Y.; Wang, E.; Zhao, Z. Hierarchical Superhydrophilic/Superaerophobic CoMnP/Ni2P Nanosheet-Based Microplate Arrays for Enhanced Overall Water Splitting. J. Mater. Chem. A Mater. 2021, 9, 22129–22139. [Google Scholar] [CrossRef]
  179. Chen, Y.; Mojica, F.; Li, G.; Chuang, P.Y.A. Experimental Study and Analytical Modeling of an Alkaline Water Electrolysis Cell. Int. J. Energy Res. 2017, 41, 2365–2373. [Google Scholar] [CrossRef]
  180. Jung, G.; Yu, J.-W.; Dlamini, M.M.; Kan, M.-Y.; Lai, C.-J.; Yeh, C.-C.; Chan, S.H. Proton Exchange Membrane Water Electrolysis-Effect of Pretreatment before Electrocoating Ti Anode Support. Int. J. Hydrogen Energy 2023, in press. [Google Scholar] [CrossRef]
  181. Roy, C.; Rao, R.R.; Stoerzinger, K.A.; Hwang, J.; Rossmeisl, J.; Chorkendorff, I.; Shao-Horn, Y.; Stephens, I.E.L. Trends in Activity and Dissolution on RuO2 under Oxygen Evolution Conditions: Particles versus Well-Defined Extended Surfaces. ACS Energy Lett. 2018, 3, 2045–2051. [Google Scholar] [CrossRef]
  182. Siracusano, S.; Hodnik, N.; Jovanovic, P.; Ruiz-Zepeda, F.; Šala, M.; Baglio, V.; Aricò, A.S. New Insights into the Stability of a High Performance Nanostructured Catalyst for Sustainable Water Electrolysis. Nano Energy 2017, 40, 618–632. [Google Scholar] [CrossRef]
  183. Siracusano, S.; Baglio, V.; Van Dijk, N.; Merlo, L.; Aricò, A.S. Enhanced Performance and Durability of Low Catalyst Loading PEM Water Electrolyser Based on a Short-Side Chain Perfluorosulfonic Ionomer. Appl. Energy 2017, 192, 477–489. [Google Scholar] [CrossRef]
  184. Rakousky, C.; Reimer, U.; Wippermann, K.; Kuhri, S.; Carmo, M.; Lueke, W.; Stolten, D. Polymer Electrolyte Membrane Water Electrolysis: Restraining Degradation in the Presence of Fluctuating Power. J. Power Sources 2017, 342, 38–47. [Google Scholar] [CrossRef]
  185. Hreiz, R.; Abdelouahed, L.; Fuenfschilling, D.; Lapicque, F. Electrogenerated Bubbles Induced Convection in Narrow Vertical Cells: PIV Measurements and Euler-Lagrange CFD Simulation. Chem. Eng. Sci. 2015, 134, 138–152. [Google Scholar] [CrossRef]
  186. Zeradjanin, A.R.; La Mantia, F.; Masa, J.; Schuhmann, W. Utilization of the Catalyst Layer of Dimensionally Stable Anodes-Interplay of Morphology and Active Surface Area. Electrochim. Acta 2012, 82, 408–414. [Google Scholar] [CrossRef]
  187. Zeradjanin, A.R.; Ventosa, E.; Masa, J.; Schuhmann, W. Utilization of the Catalyst Layer of Dimensionally Stable Anodes. Part 2: Impact of Spatial Current Distribution on Electrocatalytic Performance. J. Electroanal. Chem. 2018, 828, 63–70. [Google Scholar] [CrossRef]
  188. Akbar, K.; Hussain, S.; Truong, L.; Roy, S.B.; Jeon, J.H.; Jerng, S.-K.; Kim, M.; Yi, Y.; Jung, J.; Chun, S.-H. Induced Superaerophobicity onto a Non-Superaerophobic Catalytic Surface for Enhanced Hydrogen Evolution Reaction. ACS Appl. Mater. Interfaces 2017, 9, 43674–43680. [Google Scholar] [CrossRef] [PubMed]
  189. Li, Y.; Zhang, H.; Xu, T.; Lu, Z.; Wu, X.; Wan, P.; Sun, X.; Jiang, L. Under-water Superaerophobic Pine-shaped Pt Nanoarray Electrode for Ultrahigh-performance Hydrogen Evolution. Adv. Funct. Mater. 2015, 25, 1737–1744. [Google Scholar] [CrossRef]
  190. Lu, Z.; Zhu, W.; Yu, X.; Zhang, H.; Li, Y.; Sun, X.; Wang, X.; Wang, H.; Wang, J.; Luo, J. Ultrahigh Hydrogen Evolution Performance of Under-water “Superaerophobic” MoS2 Nanostructured Electrodes. Adv. Mater. 2014, 26, 2683–2687. [Google Scholar] [CrossRef] [PubMed]
  191. Han, N.; Yang, K.R.; Lu, Z.; Li, Y.; Xu, W.; Gao, T.; Cai, Z.; Zhang, Y.; Batista, V.S.; Liu, W. Nitrogen-Doped Tungsten Carbide Nanoarray as an Efficient Bifunctional Electrocatalyst for Water Splitting in Acid. Nat. Commun. 2018, 9, 924. [Google Scholar] [CrossRef] [PubMed]
  192. Ding, L.; Wang, W.; Xie, Z.; Li, K.; Yu, S.; Capuano, C.B.; Keane, A.; Ayers, K.; Zhang, F.-Y. Highly Porous Iridium Thin Electrodes with Low Loading and Improved Reaction Kinetics for Hydrogen Generation in PEM Electrolyzer Cells. ACS Appl. Mater. Interfaces 2023, 15, 24284–24295. [Google Scholar] [CrossRef] [PubMed]
  193. Lee, C.H.; Banerjee, R.; Arbabi, F.; Hinebaugh, J.; Bazylak, A. Porous Transport Layer Related Mass Transport Losses in Polymer Electrolyte Membrane Electrolysis: A Review. In Proceedings of the International Conference on Nanochannels, Microchannels, and Minichannels, Washington, DC, USA, 10–14 July 2016; American Society of Mechanical Engineers: New York, NY, USA, 2016; Volume 50343, p. V001T07A003. [Google Scholar]
  194. Lee, C.; Hinebaugh, J.; Banerjee, R.; Chevalier, S.; Abouatallah, R.; Wang, R.; Bazylak, A. Influence of Limiting Throat and Flow Regime on Oxygen Bubble Saturation of Polymer Electrolyte Membrane Electrolyzer Porous Transport Layers. Int. J. Hydrogen Energy 2017, 42, 2724–2735. [Google Scholar] [CrossRef]
  195. Kulkarni, D.; Huynh, A.; Satjaritanun, P.; O’Brien, M.; Shimpalee, S.; Parkinson, D.; Shevchenko, P.; DeCarlo, F.; Danilovic, N.; Ayers, K.E. Elucidating Effects of Catalyst Loadings and Porous Transport Layer Morphologies on Operation of Proton Exchange Membrane Water Electrolyzers. Appl. Catal. B 2022, 308, 121213. [Google Scholar] [CrossRef]
  196. Maier, M.; Dodwell, J.; Ziesche, R.; Tan, C.; Heenan, T.; Majasan, J.; Kardjilov, N.; Markötter, H.; Manke, I.; Castanheira, L.; et al. Mass Transport in Polymer Electrolyte Membrane Water Electrolyser Liquid-Gas Diffusion Layers: A Combined Neutron Imaging and X-Ray Computed Tomography Study. J. Power Sources 2020, 455, 227968. [Google Scholar] [CrossRef]
  197. Grigoriev, S.A.; Millet, P.; Volobuev, S.A.; Fateev, V.N. Optimization of Porous Current Collectors for PEM Water Electrolysers. Int. J. Hydrogen Energy 2009, 34, 4968–4973. [Google Scholar] [CrossRef]
  198. Ito, H.; Maeda, T.; Nakano, A.; Kato, A.; Yoshida, T. Influence of Pore Structural Properties of Current Collectors on the Performance of Proton Exchange Membrane Electrolyzer. Electrochim. Acta 2013, 100, 242–248. [Google Scholar] [CrossRef]
  199. Lopata, J.; Kang, Z.; Young, J.; Bender, G.; Weidner, J.W.; Shimpalee, S. Effects of the Transport/Catalyst Layer Interface and Catalyst Loading on Mass and Charge Transport Phenomena in Polymer Electrolyte Membrane Water Electrolysis Devices. J. Electrochem. Soc. 2020, 167, 064507. [Google Scholar] [CrossRef]
  200. Kim, P.J.; Lee, C.H.; Lee, J.K.; Fahy, K.F.; Bazylak, A. In-Plane Transport in Water Electrolyzer Porous Transport Layers with through Pores. J. Electrochem. Soc. 2020, 167, 124522. [Google Scholar] [CrossRef]
  201. Parra-Restrepo, J.; Bligny, R.; Dillet, J.; Didierjean, S.; Stemmelen, D.; Moyne, C.; Degiovanni, A.; Maranzana, G. Influence of the Porous Transport Layer Properties on the Mass and Charge Transfer in a Segmented PEM Electrolyzer. Int. J. Hydrogen Energy 2020, 45, 8094–8106. [Google Scholar] [CrossRef]
  202. Miličić, T.; Altaf, H.; Vorhauer-Huget, N.; Živković, L.A.; Tsotsas, E.; Vidaković-Koch, T. Modeling and Analysis of Mass Transport Losses of Proton Exchange Membrane Water Electrolyzer. Processes 2022, 10, 2417. [Google Scholar] [CrossRef]
  203. Leonard, E.; Shum, A.D.; Normile, S.; Sabarirajan, D.C.; Yared, D.G.; Xiao, X.; Zenyuk, I.V. Operando X-Ray Tomography and Sub-Second Radiography for Characterizing Transport in Polymer Electrolyte Membrane Electrolyzer. Electrochim. Acta 2018, 276, 424–433. [Google Scholar] [CrossRef]
  204. Nie, J.; Chen, Y. Numerical Modeling of Three-Dimensional Two-Phase Gas–Liquid Flow in the Flow Field Plate of a PEM Electrolysis Cell. Int. J. Hydrogen Energy 2010, 35, 3183–3197. [Google Scholar] [CrossRef]
  205. Arbabi, F.; Kalantarian, A.; Abouatallah, R.; Wang, R.; Wallace, J.S.; Bazylak, A. Feasibility Study of Using Microfluidic Platforms for Visualizing Bubble Flows in Electrolyzer Gas Diffusion Layers. J. Power Sources 2014, 258, 142–149. [Google Scholar] [CrossRef]
  206. Bernt, M.; Siebel, A.; Gasteiger, H.A. Analysis of Voltage Losses in PEM Water Electrolyzers with Low Platinum Group Metal Loadings. J. Electrochem. Soc. 2018, 165, F305–F314. [Google Scholar] [CrossRef]
  207. Yuan, X.-Z.; Shaigan, N.; Song, C.; Aujla, M.; Neburchilov, V.; Kwan, J.T.H.; Wilkinson, D.P.; Bazylak, A.; Fatih, K. The Porous Transport Layer in Proton Exchange Membrane Water Electrolysis: Perspectives on a Complex Component. Sustain. Energy Fuels 2022, 6, 1824–1853. [Google Scholar] [CrossRef]
  208. Schmidt, G.; Suermann, M.; Bensmann, B.; Hanke-Rauschenbach, R.; Neuweiler, I. Modeling Overpotentials Related to Mass Transport through Porous Transport Layers of PEM Water Electrolysis Cells. J. Electrochem. Soc. 2020, 167, 114511. [Google Scholar] [CrossRef]
  209. Ikeda, H.; Misumi, R.; Kojima, Y.; Haleem, A.A.; Kuroda, Y.; Mitsushima, S. Microscopic High-Speed Video Observation of Oxygen Bubble Generation Behavior and Effects of Anode Electrode Shape on OER Performance in Alkaline Water Electrolysis. Int. J. Hydrogen Energy 2022, 47, 11116–11127. [Google Scholar] [CrossRef]
  210. Sangtam, B.T.; Prakash, R.; Majumder, S.K. Drop Sizes and Its Distribution in Jet-Driven Liquid-Liquid Mixing Column: Substantial Application for the Liquid-Liquid Extraction Process. Chem. Eng. Res. Des. 2021, 172, 186–203. [Google Scholar] [CrossRef]
  211. Seweryn, J.; Biesdorf, J.; Schmidt, T.J.; Boillat, P. Communication-Neutron Radiography of the Water/Gas Distribution in the Porous Layers of an Operating Electrolyser. J. Electrochem. Soc. 2016, 163, F3009. [Google Scholar] [CrossRef]
  212. Lee, C.H.; Banerjee, R.; Ge, N.; Lee, J.K.; Zhao, B.; Baltic, E.; LaManna, J.M.; Hussey, D.S.; Jacobson, D.L.; Abouatallah, R.; et al. The Effect of Cathode Nitrogen Purging on Cell Performance and in Operando Neutron Imaging of a Polymer Electrolyte Membrane Electrolyzer. Electrochim. Acta 2018, 279, 91–98. [Google Scholar] [CrossRef]
  213. Hussey, D.S.; Spernjak, D.; Weber, A.Z.; Mukundan, R.; Fairweather, J.; Brosha, E.L.; Davey, J.; Spendelow, J.S.; Jacobson, D.L.; Borup, R.L. Accurate Measurement of the through-Plane Water Content of Proton-Exchange Membranes Using Neutron Radiography. J. Appl. Phys. 2012, 112, 104906. [Google Scholar] [CrossRef]
  214. Tanaka, Y.; Kikuchi, K.; Saihara, Y.; Ogumi, Z. Bubble Visualization and Electrolyte Dependency of Dissolving Hydrogen in Electrolyzed Water Using Solid-Polymer-Electrolyte. Electrochim. Acta 2005, 50, 5229–5236. [Google Scholar] [CrossRef]
  215. Lettenmeier, P.; Kolb, S.; Sata, N.; Fallisch, A.; Zielke, L.; Thiele, S.; Gago, A.-S.; Friedrich, K.A. Comprehensive Investigation of Novel Pore-Graded Gas Diffusion Layers for High-Performance and Cost-Effective Proton Exchange Membrane Electrolyzers. Energy Environ. Sci. 2017, 10, 2521–2533. [Google Scholar] [CrossRef]
  216. De Angelis, S.; Schuler, T.; Charalambous, M.A.; Marone, F.; Schmidt, T.J.; Büchi, F.N. Unraveling Two-Phase Transport in Porous Transport Layer Materials for Polymer Electrolyte Water Electrolysis. J. Mater. Chem. A Mater. 2021, 9, 22102–22113. [Google Scholar] [CrossRef]
  217. Leonard, E.; Shum, A.D.; Danilovic, N.; Capuano, C.; Ayers, K.E.; Pant, L.M.; Weber, A.Z.; Xiao, X.; Parkinson, D.Y.; Zenyuk, I.V. Interfacial Analysis of a PEM Electrolyzer Using X-Ray Computed Tomography. Sustain. Energy Fuels 2020, 4, 921–931. [Google Scholar] [CrossRef]
  218. Ehrnst, Y.; Sherrell, P.C.; Rezk, A.R.; Yeo, L.Y. Acoustically-Induced Water Frustration for Enhanced Hydrogen Evolution Reaction in Neutral Electrolytes. Adv. Energy Mater. 2023, 13, 2203164. [Google Scholar] [CrossRef]
  219. Manasseh, R.; LaFontaine, R.F.; Davy, J.; Shepherd, I.; Zhu, Y.-G. Passive Acoustic Bubble Sizing in Sparged Systems. Exp. Fluids 2001, 30, 672–682. [Google Scholar] [CrossRef]
  220. Pandit, A.B.; Varley, J.; Thorpe, R.B.; Davidson, J.F. Measurement of Bubble Size Distribution: An Acoustic Technique. Chem. Eng. Sci. 1992, 47, 1079–1089. [Google Scholar] [CrossRef]
  221. Movassat, M.; Ashgriz, N.; Bussmann, M. Oscillation and Breakup of a Bubble under Forced Vibration. Int. J. Heat Fluid Flow 2015, 54, 211–219. [Google Scholar] [CrossRef]
  222. Plesset, M.S.; Prosperetti, A. Bubble Dynamics and Cavitation. Annu. Rev. Fluid Mech. 1977, 9, 145–185. [Google Scholar] [CrossRef]
  223. Zhou, G.; Prosperetti, A. Modelling the Thermal Behaviour of Gas Bubbles. J. Fluid Mech. 2020, 901, R3. [Google Scholar] [CrossRef]
  224. Hwang, P.A.; Teague, W.J. Low-Frequency Resonant Scattering of Bubble Clouds. J. Atmos. Ocean. Technol. 2000, 17, 847–853. [Google Scholar] [CrossRef]
  225. Faber, M.S.; Dziedzic, R.; Lukowski, M.A.; Kaiser, N.S.; Ding, Q.; Jin, S. High-Performance Electrocatalysis Using Metallic Cobalt Pyrite (CoS2) Micro-and Nanostructures. J. Am. Chem. Soc. 2014, 136, 10053–10061. [Google Scholar] [CrossRef]
  226. Vogt, H.; Balzer, R.J. The Bubble Coverage of Gas-Evolving Electrodes in Stagnant Electrolytes. Electrochim. Acta 2005, 50, 2073–2079. [Google Scholar] [CrossRef]
  227. Iwata, R.; Zhang, L.; Wilke, K.L.; Gong, S.; He, M.; Gallant, B.M.; Wang, E.N. Bubble Growth and Departure Modes on Wettable/Non-Wettable Porous Foams in Alkaline Water Splitting. Joule 2021, 5, 887–900. [Google Scholar] [CrossRef]
Figure 1. Flow patterns in PEM water electrolysis channel. (a) Different gas bubble formation. (b) Observation of different gas bubble flow patterns inside the cell. Copyright 2023, with permission from Elsevier [20].
Micromachines 14 02234 g001
Figure 2. Formation of bubbles at hydrophobic and hydrophilic surfaces.
Micromachines 14 02234 g002
Figure 3. Schematic diagram of a PEM water electrolysis and PEM fuel cell.
Micromachines 14 02234 g003
Figure 5. Comparison of IrO2 catalyst doped with and without Ti-SnO2: (a) Anode side 40 wt.%. IrO2-TSO and cathode side with 20 wt.% Pt/C. Copyright 2023, with permission from the American Chemical Society [57]. (b) Durability test at constant current 10 mAcm−2. Copyright 2023, with permission from the American Chemical Society [57]. (c) Cathode side HER with Pt/C and IrP2-rGO. Copyright 2020, with permission from the American Chemical Society [73]. (d) Single-wall carbon nanotubes/exfoliated MoSe2 doped with CdCl2. Copyright 2018, with permission from Wiley [61].
Micromachines 14 02234 g005
Figure 6. (a) Three different BPPs such as Ti, stainless steel, and Au-Ti. Copyright 2014, with permission from IOP Publishing [74]. (b) Durability test between Ti and TiN-C coating in BPP. Copyright 2023, with permission from Elsevier [75].
Micromachines 14 02234 g006
Figure 7. Different stages of voltage losses in water electrolysis. Copyright 2020, with permission from IOP Publishing [93].
Micromachines 14 02234 g007
Figure 8. Different stages of bubble formation. Copyright 2020, with permission from Elsevier [37].
Micromachines 14 02234 g008
Figure 9. Evolution of bubble from nucleation and growth of hydrogen bubble on SiO2 substrate. Copyright 2019, with permission from IOP Publishing [133].
Micromachines 14 02234 g009
Figure 10. Bubble growth in through-pore PTL and commercial pore PTL at different times. Copyright 2020, with permission from American Chemical Society [144].
Micromachines 14 02234 g010
Figure 11. (a) Comparison of bubble detachment between commercial Ti and hybrid coating (Ti-LGDL). Copyright 2021, with permission from Elsevier [30]. (b) Effects of water flow rate velocity on bubble overpotential and the bubble detachment. Copyright 2017, with permission from Elsevier [25]. (c) Detachment of O2 and H2 bubbles from a Pt electrode. Copyright 2019, with permission from Elsevier [40]. (d) Different stages of H2 bubble growth. Copyright 2014, with permission from the American Chemical Society [135].
Micromachines 14 02234 g011
Figure 12. Bubble motion in different flow channels. (a) Parallel-type channel. Copyright 2020, with permission from Frontiers [24]. (b) Serpentine flow channel. Copyright 2018, with permission from Elsevier [38]. (c) Mesh-type channel. Copyright 2019, with permission from Elsevier [153]. (d) Expanded metal mesh. Copyright 2018, with permission from Elsevier [161]. (e) Stainless steel mesh. Copyright 2010, with permission from Elsevier [162].
Micromachines 14 02234 g012
Figure 14. Captured bubble size images. (a) Ir-C coated on the anode and N-WC nanoarray on the cathode side at 1.5 V. Copyright 2018, with permission from Springer Nature [191]. (b) Coated N-WC nanoarray on both regions. Copyright 2018, with permission from Springer Nature [191]. (c) Dense Ir CCLGDL. Copyright 2023, with permission from the American Chemical Society [192]. (d) Honeycomb Ir CCLGDL formation of bubble dynamics in OER CCM side. Copyright 2023, with permission from the American Chemical Society [192].
Micromachines 14 02234 g014aMicromachines 14 02234 g014b
Figure 15. (a) Bubble transport patterned through-pores in PTL. Copyright 2020, with permission from the American Chemical Society [144]. (b) Movement of gas bubble through PTL. Copyright 2023, with permission from Elsevier [141]. (c) Variation in pore size on constriction resistance based on the different CL thickness. Copyright 2020, with permission from Elsevier [201]. (d) Influence of inlet water on PTL liquid saturation and thickness. Copyright 2022, with permission from MDPI [202]. (e) Formation and detachment of O2 bubble at different times. Copyright 2018, with permission from Elsevier [203].
Micromachines 14 02234 g015
Figure 16. Captured bubble size image in PEM water electrolysis. Copyright Thesis 2016, with permission from Mo [35].
Micromachines 14 02234 g016
Figure 17. PEMWE neutron radiography. (a) Schematic image of neutron radiography. Copyright 2018, with permission from Elsevier [90]. (b) Integrated neutron-captured bubble image. The dotted circles represent stationary gas bubbles, whereas the solid circles depict increasing bubbles moving between holes. Copyright 2013, with permission from Elsevier [130].
Micromachines 14 02234 g017
Figure 18. X-ray imaging setup. (a) Schematic diagram of the X-ray imaging in a PEM water electrolysis. Copyright 2020, with permission from the Royal Society of Chemistry [217]. (b) Formation of hydrogen bubble between PTL and cathode channel at different current densities. Copyright 2015, with permission from Elsevier [86].
Micromachines 14 02234 g018
Figure 19. Schematic diagram of the PEMWE. (a) With an acoustic emission sensor. Copyright 2020, with permission from Frontiers [24]. (b) Captured bubble images using AE sensor. Copyright 2019, with permission from Elsevier [85].
Micromachines 14 02234 g019
Table 1. Advantages and disadvantages of PEM water electrolysis and PEM fuel cells [47,48,49].
CharacteristicPEM Fuel CellPEM Water Electrolysis
Advantage
Energy efficiencyProduction of power from hydrogen and oxygen supply.Utilized renewable energy to produce hydrogen gas.
Low environment impactOnly produces water as a byproduct.Oxygen as a byproduct.
UsageUsed in various applications like transportation and power sources.It can be used for large-scale hydrogen production.
Start-up processAbility to start and stop quickly, making it viable for different power demands.Fast response and simple control.
Disadvantage
Higher costCatalysts like Pt are expensive, which increases production costs.PEM membrane manufacturing requires expensive components and infrastructure.
Catalyst shortageCatalysts require metals like Pt, resulting in supply concerns.Catalyst materials are constrained, which affects both cost and efficiency.
Longevity and stabilityCatalyst’s lifespan decreases over time.Gradual degradation of the catalyst’s membrane impacts its durability.
Table 2. Different key components used in PEM water electrolysis.
Anode- and Cathode-Side Current DistributorAnode-Side CatalystCathode-Side CatalystCatalyst-Coated MembraneCathode-Side Diffusion LayerCell AreaBipolar PlateFlow PatternAuthors
Ti2.3 mg/cm2 IrO21.0 mg/cm2
carbon-supported Pt
Nafion-115 and Nafion-117Sigracet® 28BCE carbon and Ti25 cm2TiParallel flow[82]
Ti3.0 mg/cm2 Ir/RuOx0.6 mg/cm2 PtNafion-115Toray H-060 carbon paper9 cm2-Parallel flow[24]
Ti mesh and carbon paper (type 34BA)1.5 mg/cm2 IrO20.5 mg/cm2 Pt (46 wt% Pt/C)Nafion® 117-64 cm2-Parallel flow, serpentine flow, cascade flow[83]
Ti1.0 mg/cm2 Pt1.0 mg/cm2 PtNafion-25 cm2Standard graphiteParallel[80]
Pt-plated Ti (anode) and carbon (cathode)IrOxPt/CNafion-115Toray H-060 carbon paper---[84]
Gold-coated Ti (anode) and Cu (cathode)2.0 mg/cm2 Ir/IrOx1.0 mg/cm2 Pt blackNafion-117Toray 090 carbon paper5 cm2GraphiteParallel[30]
-3.0 mg/cm2 Ir/RuO20.6 mg/cm2 PtNafion-115Sintered Ti powder13.5 cm2-Single flow[85]
Ti (anode) and carbon (cathode)IrO2Pt/CNafion-117Toray H 120 carbon paper11.9 and 17.6 cm2GraphiteParallel and meander shaped single channel[86]
Ti (cathode)3.0 mg/cm2 IrRuOx3.0 mg/cm2 Pt blackNafion-115Toray 090 carbon paper (anode side)5 cm2-Parallel flow[5]
Carbon paper, fine Ti meshes and sintered porous Ti2.0 mg/cm2 Pt and 2.0 mg/cm2 Ir4.0 mg/cm2 PtNafion-110-50 cm2TiMesh[87]
-2.0, 0.3, 3.0, 1.0 mg/cm2IrO2/Ir/Ir black0.8, 0.5, 3.0, 0.9 mg/cm2
Pt and Pt/C
Nafion-115-120 cm2--[21]
-3.0 mg/cm2 IrO21.0 mg/cm2 PtNafion-117Sintered porous Ti plate25 cm2TiParallel flow[88]
Ti and gold-plated1.0 mg/cm2 Ir0.3 mg/cm2 PtNafion-HPSintered Ti powder0.8 cm2TiParallel flow[89]
-2.2 mg/cm2 Ir0.8 mg/cm2 PtNafion-117Toray H 120 carbon paper1.5 cm2-Parallel and interdigitated flow[90]
Ti and gold-plated1.0 mg/cm2 Ir0.3 mg/cm2 PtNafion-1110Toray H 060 carbon paper0.8 cm2-Parallel flow[91]
Disclaimer/Publisher’s Note: The statements, opinions and data contained in all publications are solely those of the individual author(s) and contributor(s) and not of MDPI and/or the editor(s). MDPI and/or the editor(s) disclaim responsibility for any injury to people or property resulting from any ideas, methods, instructions or products referred to in the content.

