Article

Voltammetric Investigation of Ferulic Acid at Disposable Pencil Graphite Electrode

by
Iulia Gabriela David
1,*,
Dana Elena Popa
1,*,
Mihaela Buleandra
1,
Silvia Nicoleta Codreanu
1,
Lorelei Croitoru
1,
Laura Andreea Iordache
1 and
Hassan Noor
2,3
1
Department of Analytical Chemistry and Physical Chemistry, Faculty of Chemistry, University of Bucharest, Panduri Av. 90-92, District 5, 050663 Bucharest, Romania
2
Department of Surgery, Faculty of Medicine, “Lucian Blaga” University Sibiu, Lucian Blaga Street 25, 550169 Sibiu, Romania
3
European Hospital Medlife-Polisano, Strada Izvorului 1A, 550169 Sibiu, Romania
*
Authors to whom correspondence should be addressed.
Micromachines 2023, 14(10), 1951; https://doi.org/10.3390/mi14101951
Submission received: 28 September 2023 / Revised: 12 October 2023 / Accepted: 17 October 2023 / Published: 19 October 2023
(This article belongs to the Special Issue Carbon-Based Electrodes for Electrochemical Analysis and Detection)

Abstract

:
Ferulic acid (FA), a monohydroxycinnamic acid, is an antioxidant with multiple beneficial effects on human health, presenting also importance in the food and cosmetics industry. Its electrochemical behavior was investigated at the disposable and cost-effective pencil graphite electrode (PGE). Cyclic voltammetry emphasized its pH-dependent, diffusion-controlled oxidation. Using the optimized conditions (HB type PGE, Britton Robinson buffer pH 4.56) differential pulse and square-wave voltammetric techniques were applied for its quantitative determination in the range 4.00 × 10⁻⁷–1.00 × 10⁻³ mol/L FA. The developed methods were employed for the rapid and simple assessment of the FA content from a commercially available powder designed for cosmetic use.

1. Introduction

Ferulic acid (FA, 3-(4-hydroxy-3-methoxyphenyl)prop-2-enoic acid or 4-hydroxy-3-methoxy cinnamic acid) was named after the plant (Ferula foetida) from which it was extracted for the first time in 1866 [1]. FA is a phenolic compound, more specifically a derivative of the cinnamic acid, and contains in its structure a benzene ring with two functional groups (methoxy and hydroxyl), as well as a carboxylic moiety [2] (Figure S1). These structural characteristics are probably responsible for most of FA’s properties. Thus, FA is a powerful natural antioxidant, having a strong scavenger effect for various free radicals (hydroxyl, superoxide, hydrogen peroxide and nitrogen dioxide) [3].
In the various studies published over the years, it has been proven that FA plays a crucial role in the human body and has countless beneficial effects: anti-inflammatory, antimicrobial, antiviral, antifungal, vasodilatory, antithrombotic, antiarrhythmic, hepatoprotective, anticarcinogenic, antiallergic, analgesic, neuroprotective, cholesterol-lowering, potential antidepressant, reducing the risk of chronic diseases as diabetes, and skin-protective (enhances wound healing) [3,4,5,6,7,8,9]. FA helps increase sperm viability, is used as food additive, as a component in nutraceuticals and is a constituent in cosmetics and dermatological products [4,9,10,11]. On the other hand, it is worth mentioning that FA is a precursor for the production of vanillin, a flavor compound mainly used in food industry [10]. This is particularly important considering that recently more and more emphasis is placed on the consumption of natural products.
FA is an ubiquitous compound in plant cell walls, constituent of lignocellulose, occurring as a result of the phenylalanine and tyrosine metabolism by the shikimic acid pathway, being found free, dimerized or esterified [1,3,4,10]. FA can be extracted from manifold plants (Poaceae, Solanaceae, Chenopodiaceae, Amaranthaceae, Ranunculaceae, Gramineae, Ligusticum chuanxiong Hort., Ferula asafoetida L., Ziziphus jujuba Mill. var. spinosa, Angelica sinensis (Oliv.) Diels, Cimicifuga foetida L., parsley, bamboo, and fodder plants), vegetables (spinach, artichoke, rhubarb, sugar beet, carrot, and peanut), fruits (grape, banana, orange, grapefruit, berries, pineapple, pomegranate, pistachio shells, tomato, and nuts), flowers, cereals (rice, wheat, barley, oats, rye, sweet corn, rice bran, and whole grains), beverages (coffee, and beer) [1,4,6,9,10,12]. Moreover, FA is present in some agro-industrial secondary products, for example, corn fiber used for animal feed [11].
Details regarding the identification, biological sources and metabolism of FA, but also challenges associated with FA biopharmaceutical delivery, along with its numerous applications, were addressed in a recent review [4], thereby proving the importance of this compound, as well as the continuous interest shown towards it. Consequently, FA is a significant bioactive compound, representing a trace element essential in life, its identification, characterization and quantification becoming indispensable [13].
Usually, FA is determined employing analytical procedures based on spectrometric (within mixtures) and chromatographic (after separation) methods [2,12]. These have some established strong points, this statement being supported by the fact that the European Pharmacopoeia [14] mentions FA quite often, for instance, as reference or internal standard for the liquid chromatographic assay of herbal species. But, at the same time, these methods also have drawbacks that cannot be overlooked (they are expensive, time consuming, are not suitable for field analysis, involve sample preparation steps, and use toxic solvents).
Taking into account the previously mentioned aspects, the necessity of further developing fast, simple and reliable analytical methods for FA determination from different real samples is self-evident. Within this context, given their multiple advantages (cost-effective, simple, rapid, versatile, characterized by convenient analytical performance parameters, suitable for routine analysis), electrochemical techniques such as cyclic voltammetry (CV), differential pulse voltammetry (DPV) and square-wave voltammetry (SWV) represent a viable option to rely on in order to elaborate useful tools applied for achieving the above-specified objectives. On this line, CV and DPV were applied to study the electrochemical redox mechanism of four polyphenols (gallic acid, caffeic acid, vanillic acid and FA) [15]. The analytes’ redox potentials were used to assess their antioxidant properties, which are useful in pharmaceutical applications.
Next, to go one step further in this endeavor, a well-known thing must be highlighted, namely the importance of the electrode material when a certain analyte is examined. For example, electrochemical sensors based on nano-materials were extensively applied for natural antioxidant determinations in food and biological samples, including FA. A recent review addressed this topic in detail and exhibited the performances, the limitations and the perspectives of this technology [13]. Also, in this regard, disposable pencil graphite electrodes (PGEs) are easily available and constitute useful working electrodes employed for diverse organic and inorganic species determination from various matrices due to their avails: they are cheap, eco-friendly and chemically inert, have uniform surface and mechanical resistance, possess amendable electroactive surface area, present low background currents, and can be used over a wide potential range [16,17,18].
Bearing in mind the benefits of both electrochemical techniques and PGEs, they were combined to study the electrochemical behavior of FA and its quantitative determination. Thus, this paper presents for the first time the results of FA voltammetric analysis at an unmodified, disposable sensor and discusses it in comparison to similar reports previously published in the literature. To the best of our knowledge, the composite graphite material used in the PGE was not exploited till now for FA electroanalysis, despite the fact that this electrode has a very large applicability in voltammetry, including the polyphenolics analysis [19], due to its positive above-mentioned electrochemical and economic advantages [16,17,18]. Moreover, often using unmodified PGE, analytical performances similar to those reported for modified electrodes are obtained, but with a smaller number of steps and a lower consumption of reagents.

2. Materials and Methods

FA (≥99%), caffeic acid (≥98%, HPLC), gallic acid (ACS reagent, ≥98.0%), naringin (≥98%, HPLC), ethanol (absolute for analysis EMSURE®ACS, ISO, Reag. Ph Eur), boric acid (ACS reagent, ≥99.5%), phosphoric acid (ACS reagent, ≥85 wt. % in H2O), hydrochloric acid (ACS reagent, 37%), acetic acid (glacial, ACS reagent, ≥99.7%), NaOH (anhydrous pellets, reagent grade, ≥98%), sodium acetate (anhydrous for analysis EMSURE®ACS, ISO, Reag. Ph Eur), di-potassium hydrogen phosphate and potassium dihydrogen phosphate (anhydrous for analysis EMSURE) were Sigma-Aldrich products purchased from Merck (Romania). Double-distilled water was employed for vessel rinsing and solution preparation if not stated otherwise. The 2.00 × 10⁻² mol/L FA stock solution was freshly prepared daily by dissolving in ethanol the corresponding amount weighed exactly on an analytical balance with four decimal places. The working solutions were obtained by appropriate dilutions with supporting electrolyte from the stock solution, which, when not in use, was kept in the refrigerator. Britton–Robinson buffer (BRB) solutions with various pH values, used as supporting electrolyte, were prepared by adding 0.2 mol/L NaOH solution to the acid mixture (0.04 mol/L H3BO3, 0.04 mol/L H3PO4 and 0.04 mol/L CH3COOH) until the desired pH was reached. Other employed supporting electrolytes were 0.1 mol/L HCl, acetate buffer solution (ABS) pH 4.00 and phosphate-buffered solution (PBS) pH 7.00.
Powder for cosmetic preparations with a content of 98% FA extracted from the root of the Ferula assafoetida L. plant, supplied by Elemental SRL, Oradea, Romania, was purchased from a local drug store and used to test the analytical applicability of the developed voltammetric method. The FA content of the commercially available powder was assessed applying the standard addition method. The amount of powder necessary for the preparation of an FA solution with the theoretical concentration of 3.35 ×10⁻³ mol/L was accurately weighed and dissolved with ethanol in a 10 mL volumetric flask. An aliquot of 0.06 mL from this solution was diluted with BRB pH 4.56 solution to obtain 10 mL of working solution which was analyzed by DPV at PGE. Differential pulse voltammograms were recorded for the 10 mL sample solution before and after each of the four additions of 0.05 mL of 4.00 × 10⁻³ mol/L FA intermediary stock solution and the corresponding obtained peak currents were used to determine the FA concentration in the analyzed sample.
The 0.5 mm Rotring pencil graphite leads that acted as an active surface of the working electrode were purchased at once from a local bookstore.
The pH of the solutions was measured using a combined pH-sensitive glass electrode connected to a pH/mV-meter Consort P901 Scientific Instrument (Belgium).
The voltammetric measurements were made at an Autolab PGSTAT 12 with a GPES 4.9 software, as well as a Voltalab PST 050 Radiometer with a VoltaMaster 4.0 software. For the voltammetric recordings, the electrochemical cell contained 10.00 mL solution to be analyzed, in which the Ag/AgCl/KCl (3.00 mol/L) reference electrode, the platinum wire counter electrode and the PGE working electrode (if not stated otherwise) were immersed. The solid electrodes consisting of glassy carbon (GCE) and platinum (Pt) with a diameter of 0.30 cm and the corresponding geometrical surface area (Ag) of 0.0707 cm2 were employed for comparison. The PGE (Figure S2) was prepared as described in a previous paper [19] and every time, 1.00 cm of the graphite lead was introduced in the solution so that the Ag was always constant (0.1589 cm2), thus ensuring the reproducibility of the measurements.
Cyclic voltammetry (CV) was used to investigate the voltammetric behavior of FA while, due to their higher sensitivity, differential pulse voltammetry (DPV) and square-wave voltammetry (SWV) were exploited for FA quantification.

3. Results and Discussion

Like any analytical study, the present one involved the optimization of various parameters for the FA determination and the investigation of its voltammetric behavior at the disposable PGE, having as the final goal the development of a sensitive method for its simple and rapid quantification in real samples.

3.1. Optimization of the Working Conditions for FA Voltammetric Analysis

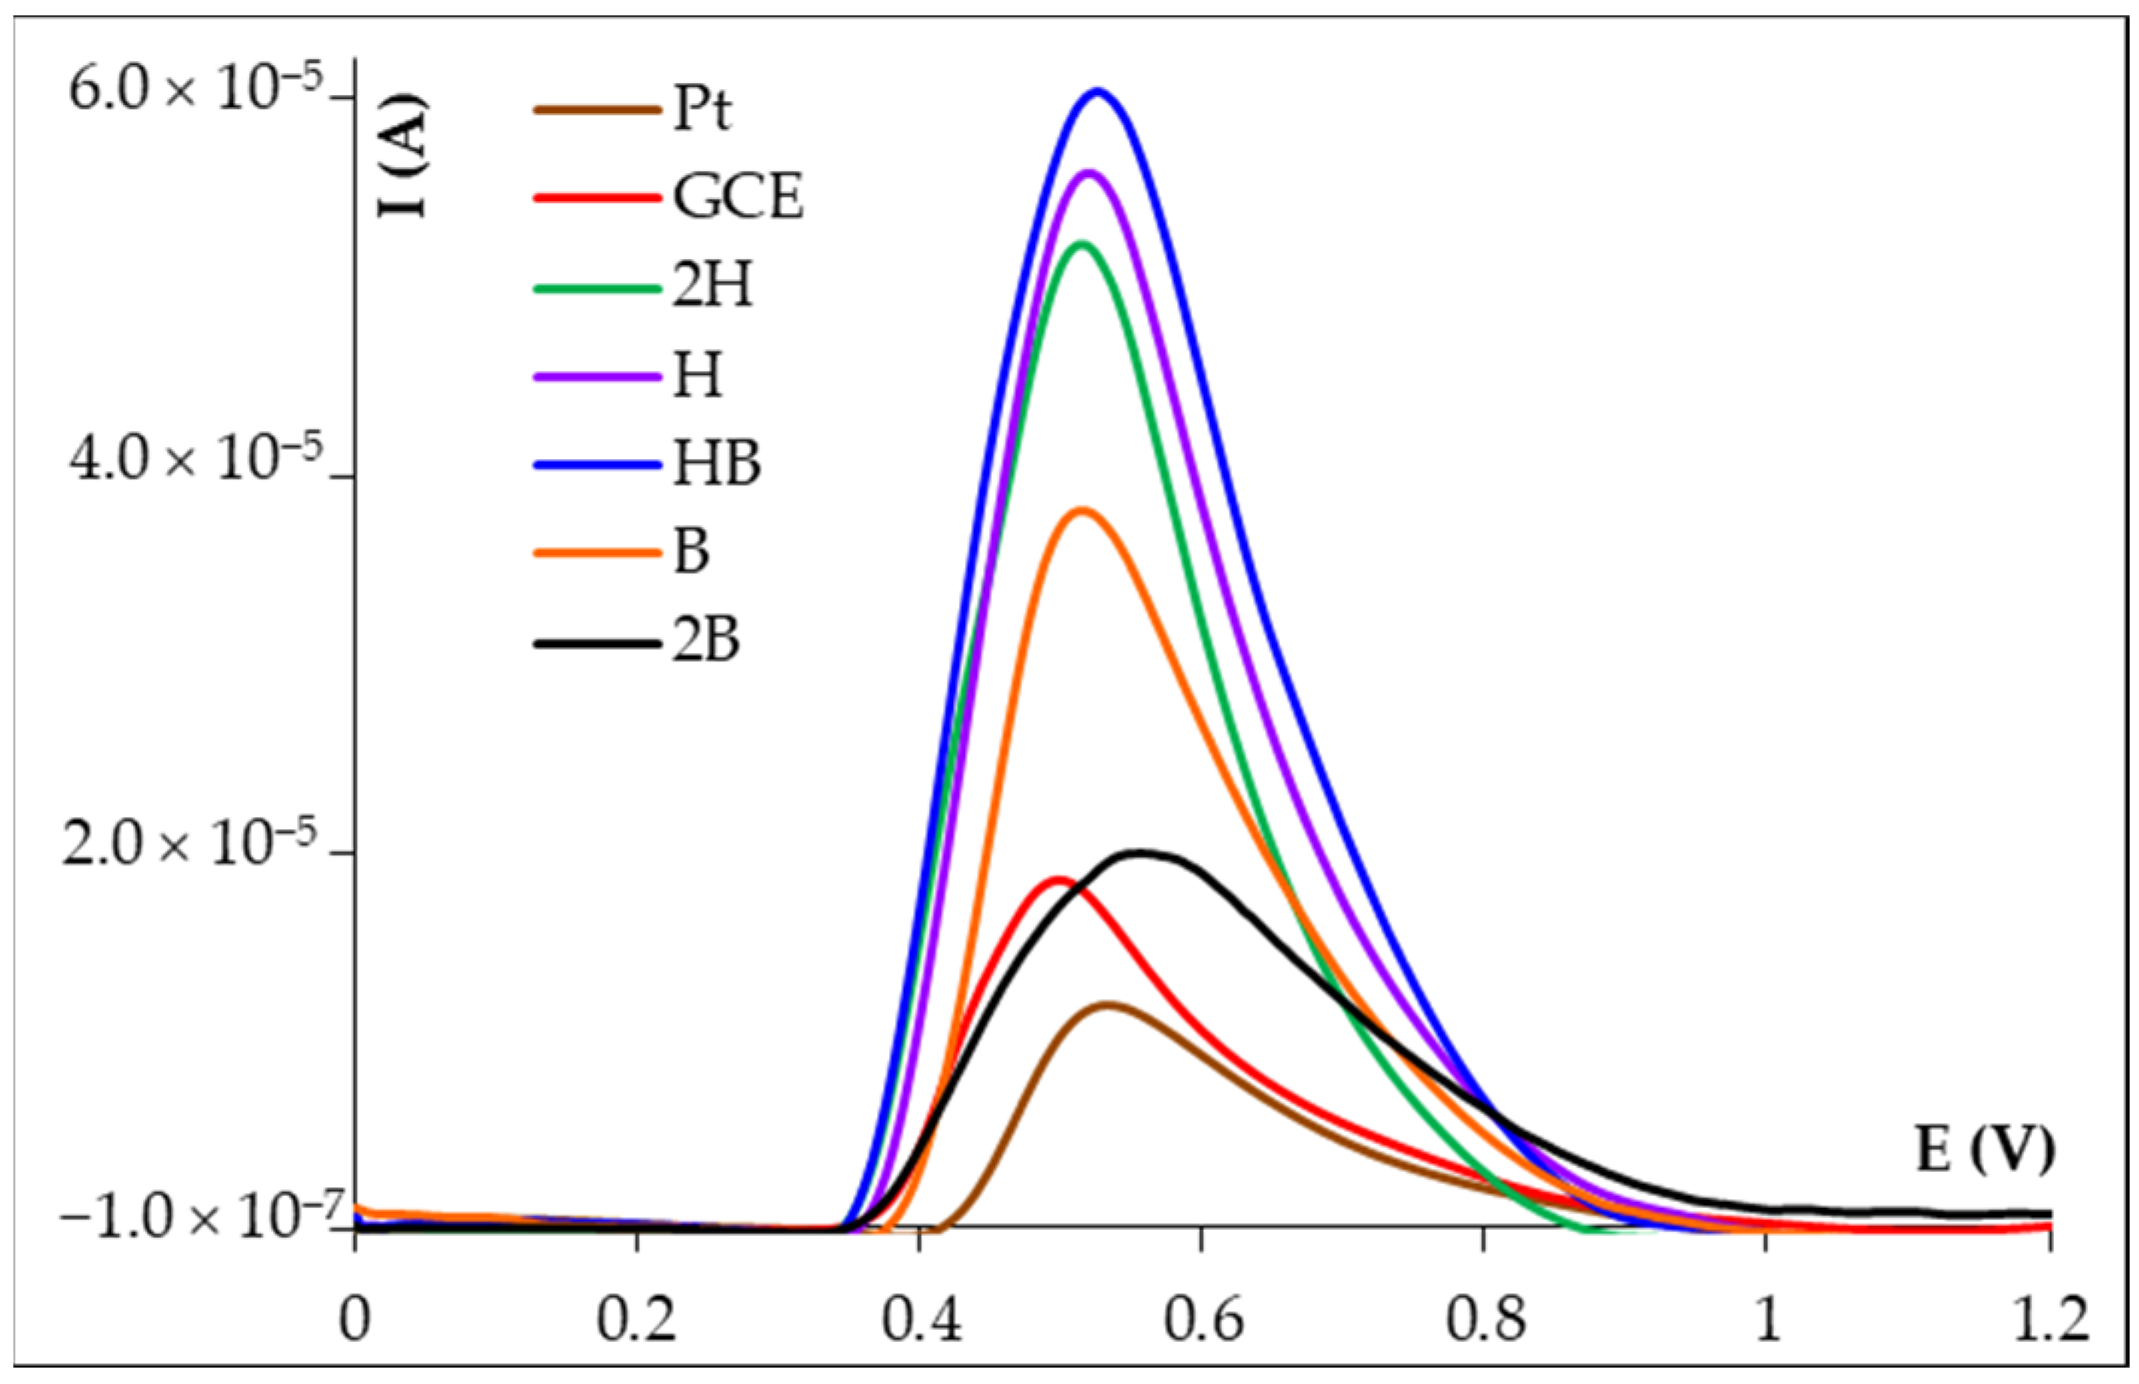
3.1.1. Selection of the Working Electrode Material

The choice of PGE as a working electrode was based on the fact that graphite pencil leads have good electrochemical characteristics and by simply changing the pencil lead, a new electroactive surface can be ensured and thus the time-consuming cleaning step of the electrode surface is eliminated. The main components of graphite pencil leads are graphite and resin or high polymer. Depending on the ratio between these two components, there are several types of leads which present different hardness. The softer ones, labeled with B (from blackness) have a higher graphite content, while the harder ones, marked with H (from hardness) contain more polymer or resin [17]. The FA voltammetric response on the classical solid working electrodes (GCE and Pt) as well as on various types of disposable PGEs (Figure 1) emphasized that the highest DPV signal corresponding to the FA oxidation was recorded at the HB type PGE (HB_PGE). The sensitivity (S, expressed in A × L/mol × cm2) of the electrodes, an analyte-concentration- and Ag-electrode-independent parameter, decreased in the order HB_PGE (0.3857) > H_PGE (0.3564) > 2H_PGE (0.3340) > GCE (0.2637) > B_PGE (0.2438) > Pt (0.1742) > 2B_PGE (0.1248).
The selectivity and sensitivity of the voltammetric determinations are strongly influenced by the nature of the electroactive surface, which, most often, is modified in order to improve these characteristics. A simple procedure performed to change the electrode surface is the electrochemical pretreatment, which consists of applying either very negative or very positive potentials or scanning the potential between certain potential values. During this process, the surface is cleaned and oxygen-containing functional groups are created on it. However, the improvements brought by this treatment step to the voltammetric behavior of the analyte depend on both the analyzed species and the chemical and electrochemical applied conditions. FA oxidation signals recorded at HB_PGE pretreated electrochemically either potentiostatic (E constant) or potentiodynamic (CV) using three different supporting electrolytes were compared with that obtained at bare, untreated HB_PGE. As it can be observed from Table 1, the electrochemical pretreatment of the working electrode did not result in an improvement of FA anodic peak current. Therefore, for all following voltammetric investigations, an untreated HB_PGE was employed as the working electrode.

3.1.2. The Stability of the FA Solution

Since antioxidants are chemical species susceptible to being easily oxidized by atmospheric oxygen, both the stability of the FA stock and working solutions were studied. Thus, the variation of FA maximum anodic peak current was monitored during a week by recording the DPV curves for working solutions, freshly prepared at different time intervals, from the same stock solution kept in the refrigerator, when it was not in use. The results showed that the FA oxidation peak intensity slightly increased during the first three days being followed by a decrease (Figure S3). Although the peak current enhancement was only 2.57% one day after the preparation of the FA stock solution, for all subsequent measurements, a stock solution prepared on the day of the determinations was used. Voltammetry has the great advantage that it allows several measurements to be performed at the same solution without changing the concentration of the analyte, and this can only be achieved if the solution in the voltammetric cell is stable under the working conditions (usually ambient). In this context, the DPV anodic currents of FA recorded for 100 min on the same solution were almost constant (Figure S4), indicating that the working solution is stable enough to allow a large number of recordings (at least 50) to be made.

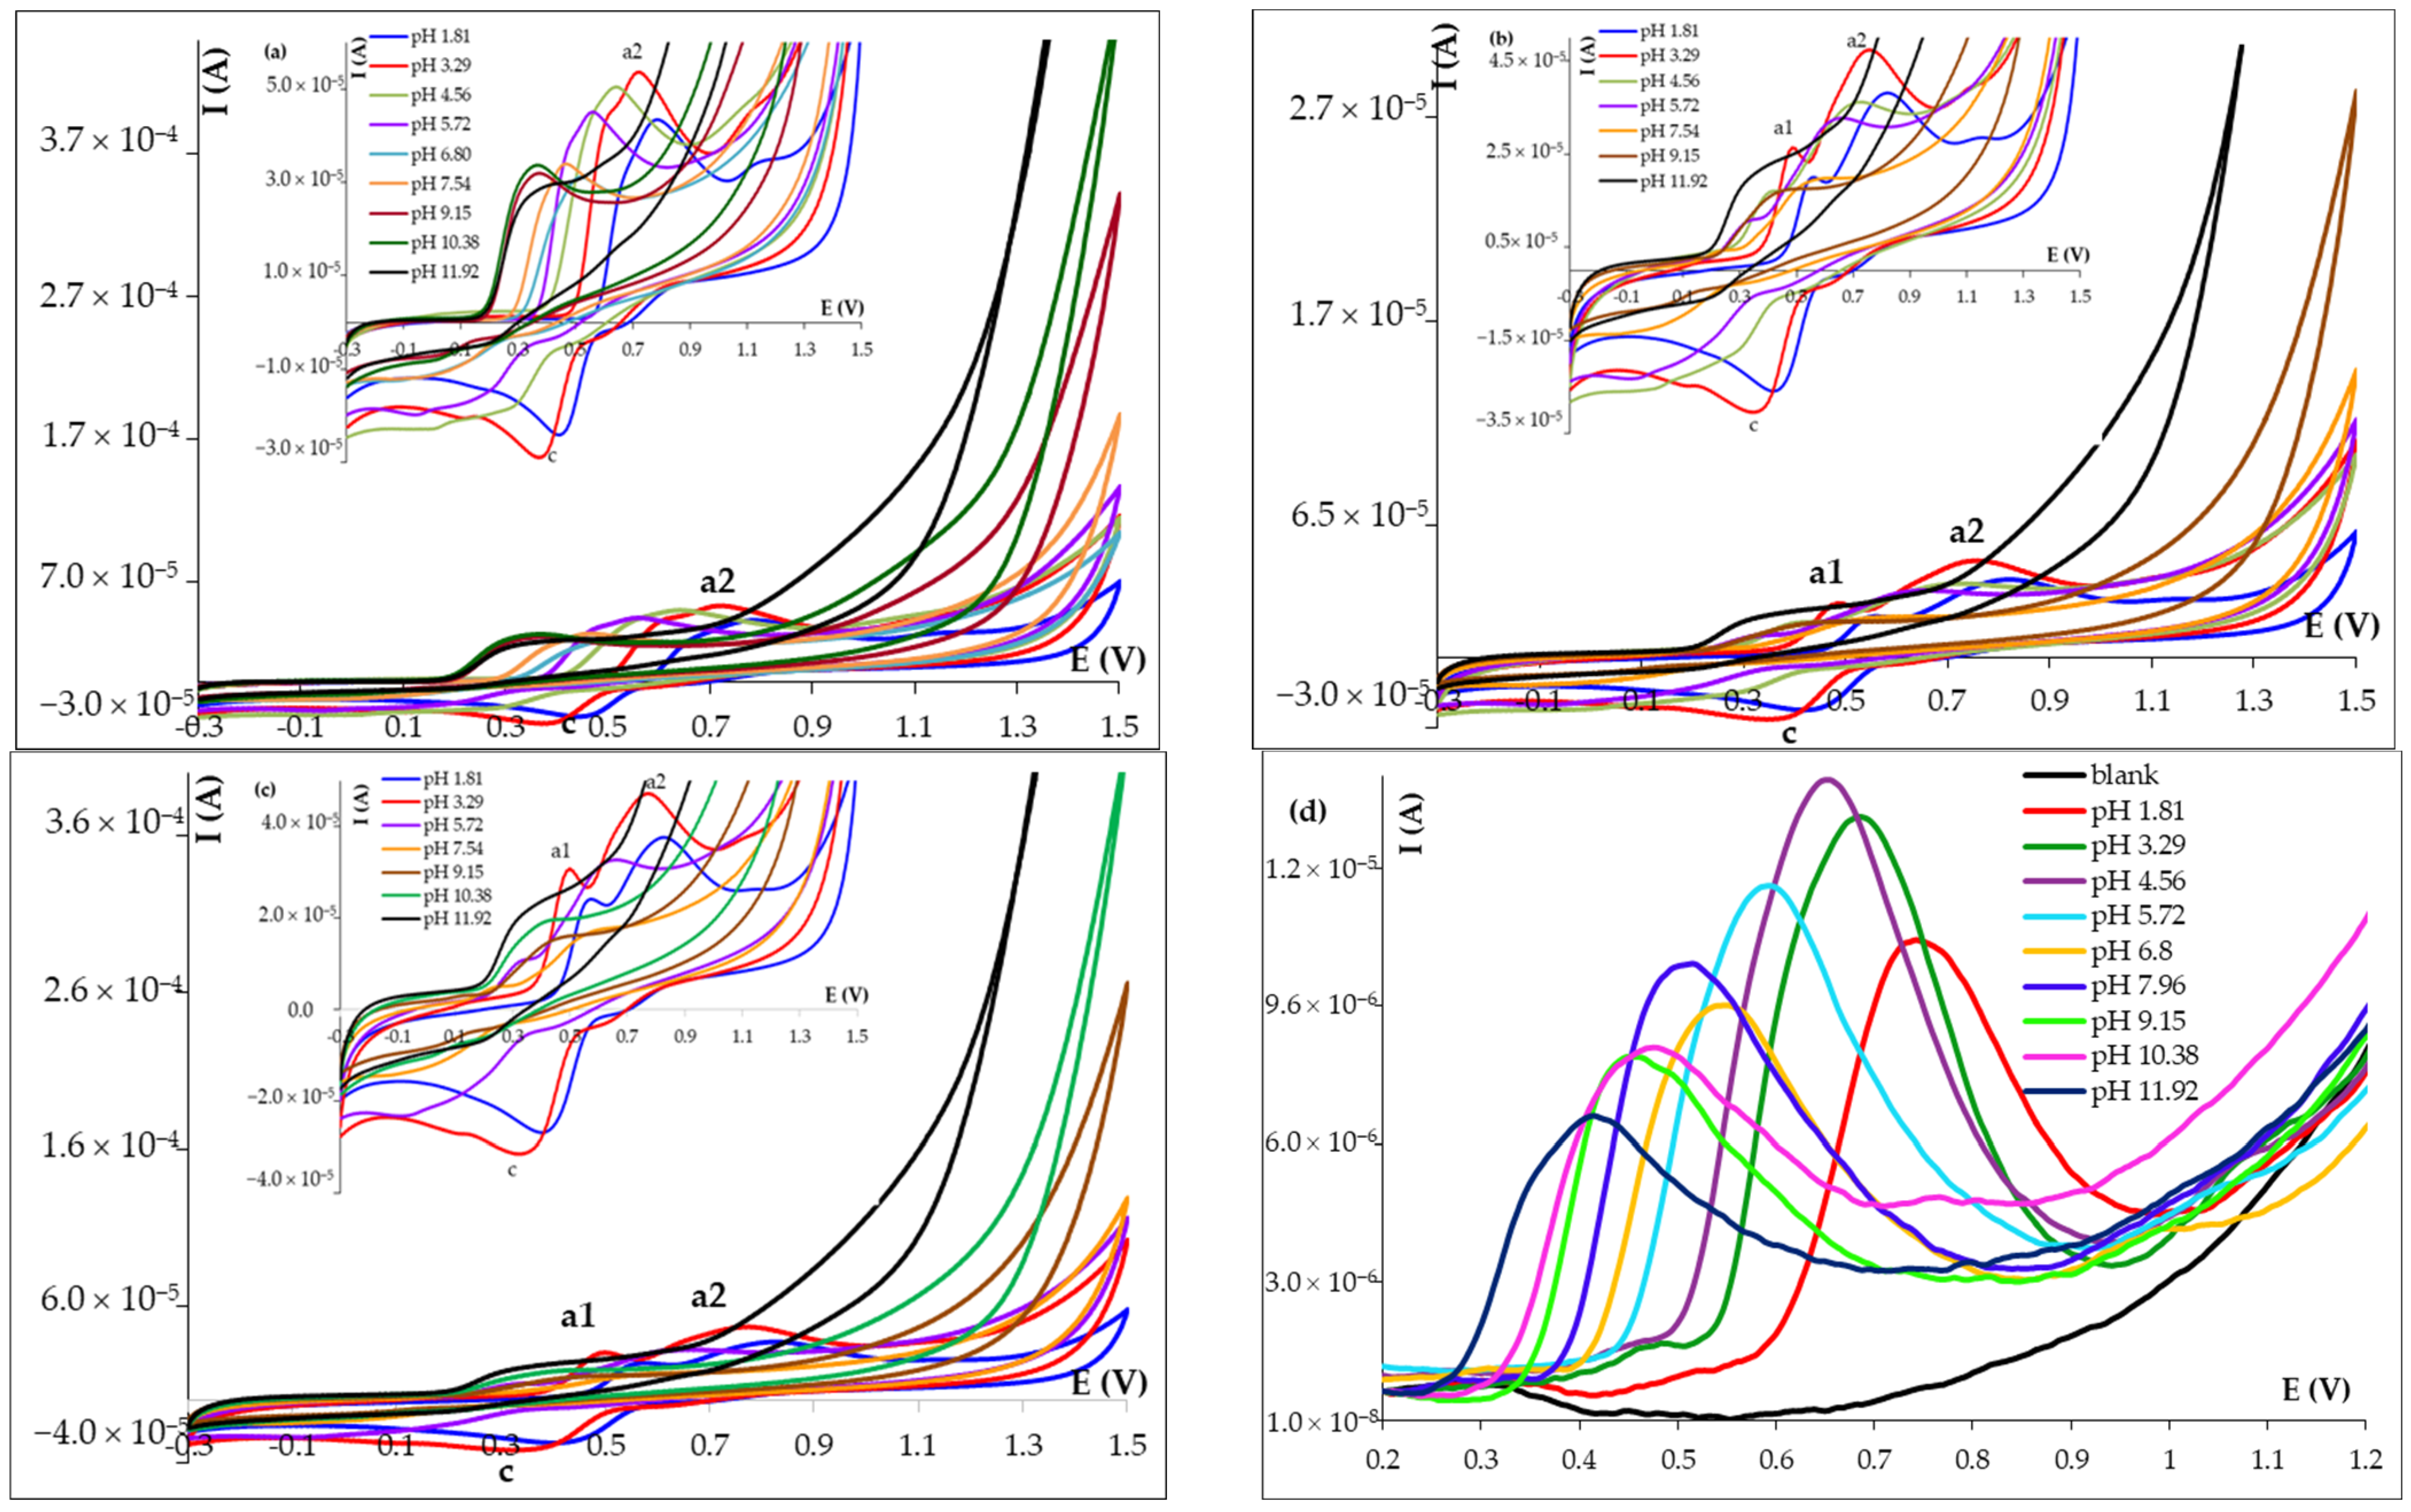
3.1.3. Influence of the Solution pH

Most often, the electrode processes of organic compounds involve, besides the electrons, protons. Therefore, the voltammetric behavior of the analyte depends on the solution pH and consequently the investigation of this chemical parameter is an important issue in the development of electroanalytical methods aimed for the quantitative determination of the corresponding species. The influence of the supporting electrolyte pH on FA voltammetric behavior at HB_PGE was investigated in the pH range 1.81 to 11.92 using the universal BRB and applying CV, DPV and SWV.
Cyclic voltammetric recordings emphasized that in the first direct scan, one anodic wave (a2) appeared (Figure 2a), while starting with the second forward scan, an additional smaller oxidation peak (a1) can be observed at less positive potentials (Figure 2b,c), up to a pH of about 8.00. Regardless of the scan number, a cathodic signal (c) appeared during the reversed potential sweep. This behavior was similar to that reported by Malagutti et al. [20] according to which the main oxidation signal (a2) corresponded to a two-step oxidation of the guaiacol moiety (similar to GCE, at HB_PGE, the two steps did not give distinct signals, only a small pre-wave can be observed at pH values below approximately 6). The cathodic signal was attributed to the reduction of the previously formed o-quinone, whose oxidation generated in the subsequent scans the anodic signal a1, corresponding to the quasi-reversible quinone–hydroquinone couple (the peaks a1 and c had close potentials, but the current of the cathodic peak was much higher than that of the oxidation signal).
The DPV and SWV recordings (Figure 2d) showed only one oxidation peak during the entire investigated pH range. However, all three applied electrochemical techniques demonstrated that the FA voltammetric peaks shifted towards less positive potentials with the increase of the solution pH, indicating the participation of protons in the corresponding electrode reactions. The variations of the peak potential (Ep) of a2 signal vs. the solution pH were linear in the pH range 1.81–9.15, while for a1 and c, linear Ep = f(pH) dependencies were obtained in the range 1.81–7.96. The corresponding regression equations for each of the FA voltammetric signals showed slopes near to the theoretical value of 0.0592 V/pH from the Nernst equation, suggesting that in each considered electrode reaction, the number of exchanged electrons was equal to that of protons (Table 2).
The highest current intensity of the FA main voltammetric signal (a2) was obtained in the pH range 3.29–4.56, while the more sensitive voltammetric techniques, DPV and SWV (Figure 2d), pointed out that pH 4.56 was the optimum value for FA quantitative determination at HB_PGE and therefore all subsequent measurements were performed in this medium.

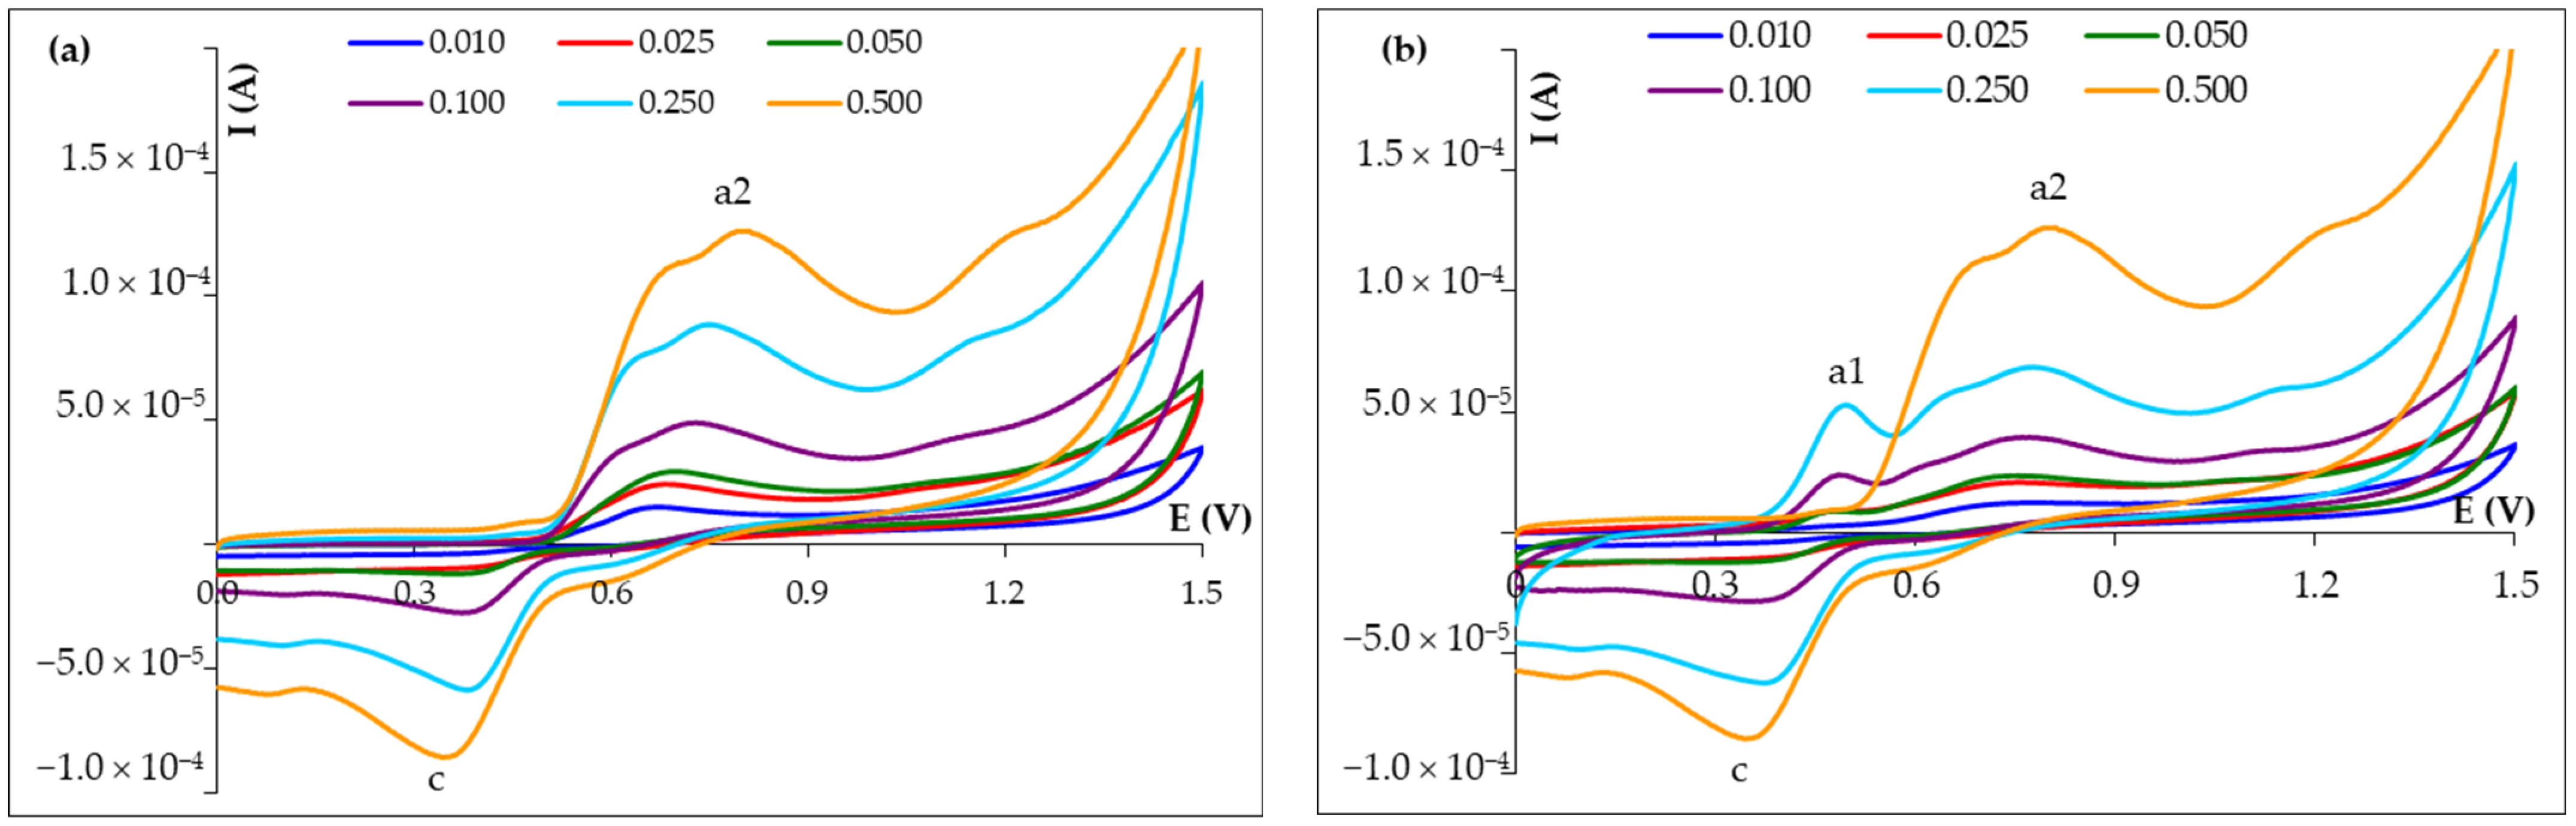
3.2. Investigation of FA Voltammetric Behavior at HB_PGE

Cyclic voltammetry is the frequently chosen technique for studying the voltammetric behavior of an analyte in certain conditions (in this case, at HB_PGE in BRB pH 4.56) because it provides information about the type and the reversibility of the redox process in which the species of interest participates, as well as on the number of involved electrons and the rate-limiting step.
In order to clarify the voltammetric behavior of FA at HB_PGE, the first two scans were recorded applying different scan rates (v). The cyclic voltammograms corresponding to the first potential scan (Figure 3a) presented two peaks, an oxidation one (a2) at potentials around 0.600–0.700 V and a cathodic signal (c) at 0.350–0.400 V. The positions of these peaks indicated that they did not belong to the same redox couple, so that FA was irreversibly oxidized in the process generating the peak a2. In the second potential scan (Figure 3b), a new anodic peak (a1) appeared at about 0.400–0.450 V, which can be considered to be the counter-partner of the reduction signal (c). These correspond to a redox couple [20] that is quasi-reversible, due to the fact that the peak separation was more than 0.059/n V (n represents the number of electrons involved in the process) and the ratio of the peak currents (Ipa1/Ipc) was sub-unitary, the reduction reaction being faster.
From Figure 3, it can be seen that the heights of FA voltammetric signals increased and their potentials shifted (towards more positive values for the anodic peaks and towards less positive potentials for the cathodic one), this last observation being characteristic for quasi-reversible and irreversible electrode processes. The nature and thus the limiting step of the electrode process corresponding to each peak were derived from the various dependencies of the peak height on the scan rate (Table 3). Hence, the FA main oxidation signal a2 was due to a diffusion-controlled process, while the electrode reactions corresponding to the redox couple generating the a1-c peaks pair were controlled by the analyte adsorption at the electrode surface.
At high scan rates, FA oxidation signal a2 seems to represent the sum of two unresolved signals (Figure 3). According to the literature data [20,21], this behavior would be due to a two-step process of one electron each, during which radical species are formed and can further be involved in electropolymerization reactions [22].
Repetitive voltammetric measurements performed at the same graphite pencil lead (Figure 4) showed that the anodic peak a2 was diminished with the increase of scan number (Figure 4a). For example, in the second and third SWV recordings, the peak decreased by 70% and 10%, respectively. Starting with the second scan, the anodic signal a1 appeared at less positive potentials and its intensity was enhanced by successive potential sweeps, this fact being further amplified in the square-wave voltammograms (Figure 4b), where the peak intensity was almost doubled in the second scan, while it increased with about 20% during the third scan. This observation, combined with the surface-confined character of the processes corresponding to the a1-c peaks pair, as well as the previously reported results [22], led to the conclusion that during the voltammetric measurements, FA electropolymerization took place. As a result, most probably a weak conductive polymeric film (due to the reduced increase of the a1 and c peaks intensities in the cyclic voltammograms) arose at the electrode surface, hindering the electron transfer between FA and the PGE surface, a fact reflected in the lowered intensity of peak a2. Thus, a new graphite lead must be used for each voltammetric measurement. Fortunately, due to the fact that PGE is disposable and cheap, this is not a disadvantage.

3.3. Voltammetric Quantitative Analysis of FA at HB_PGE

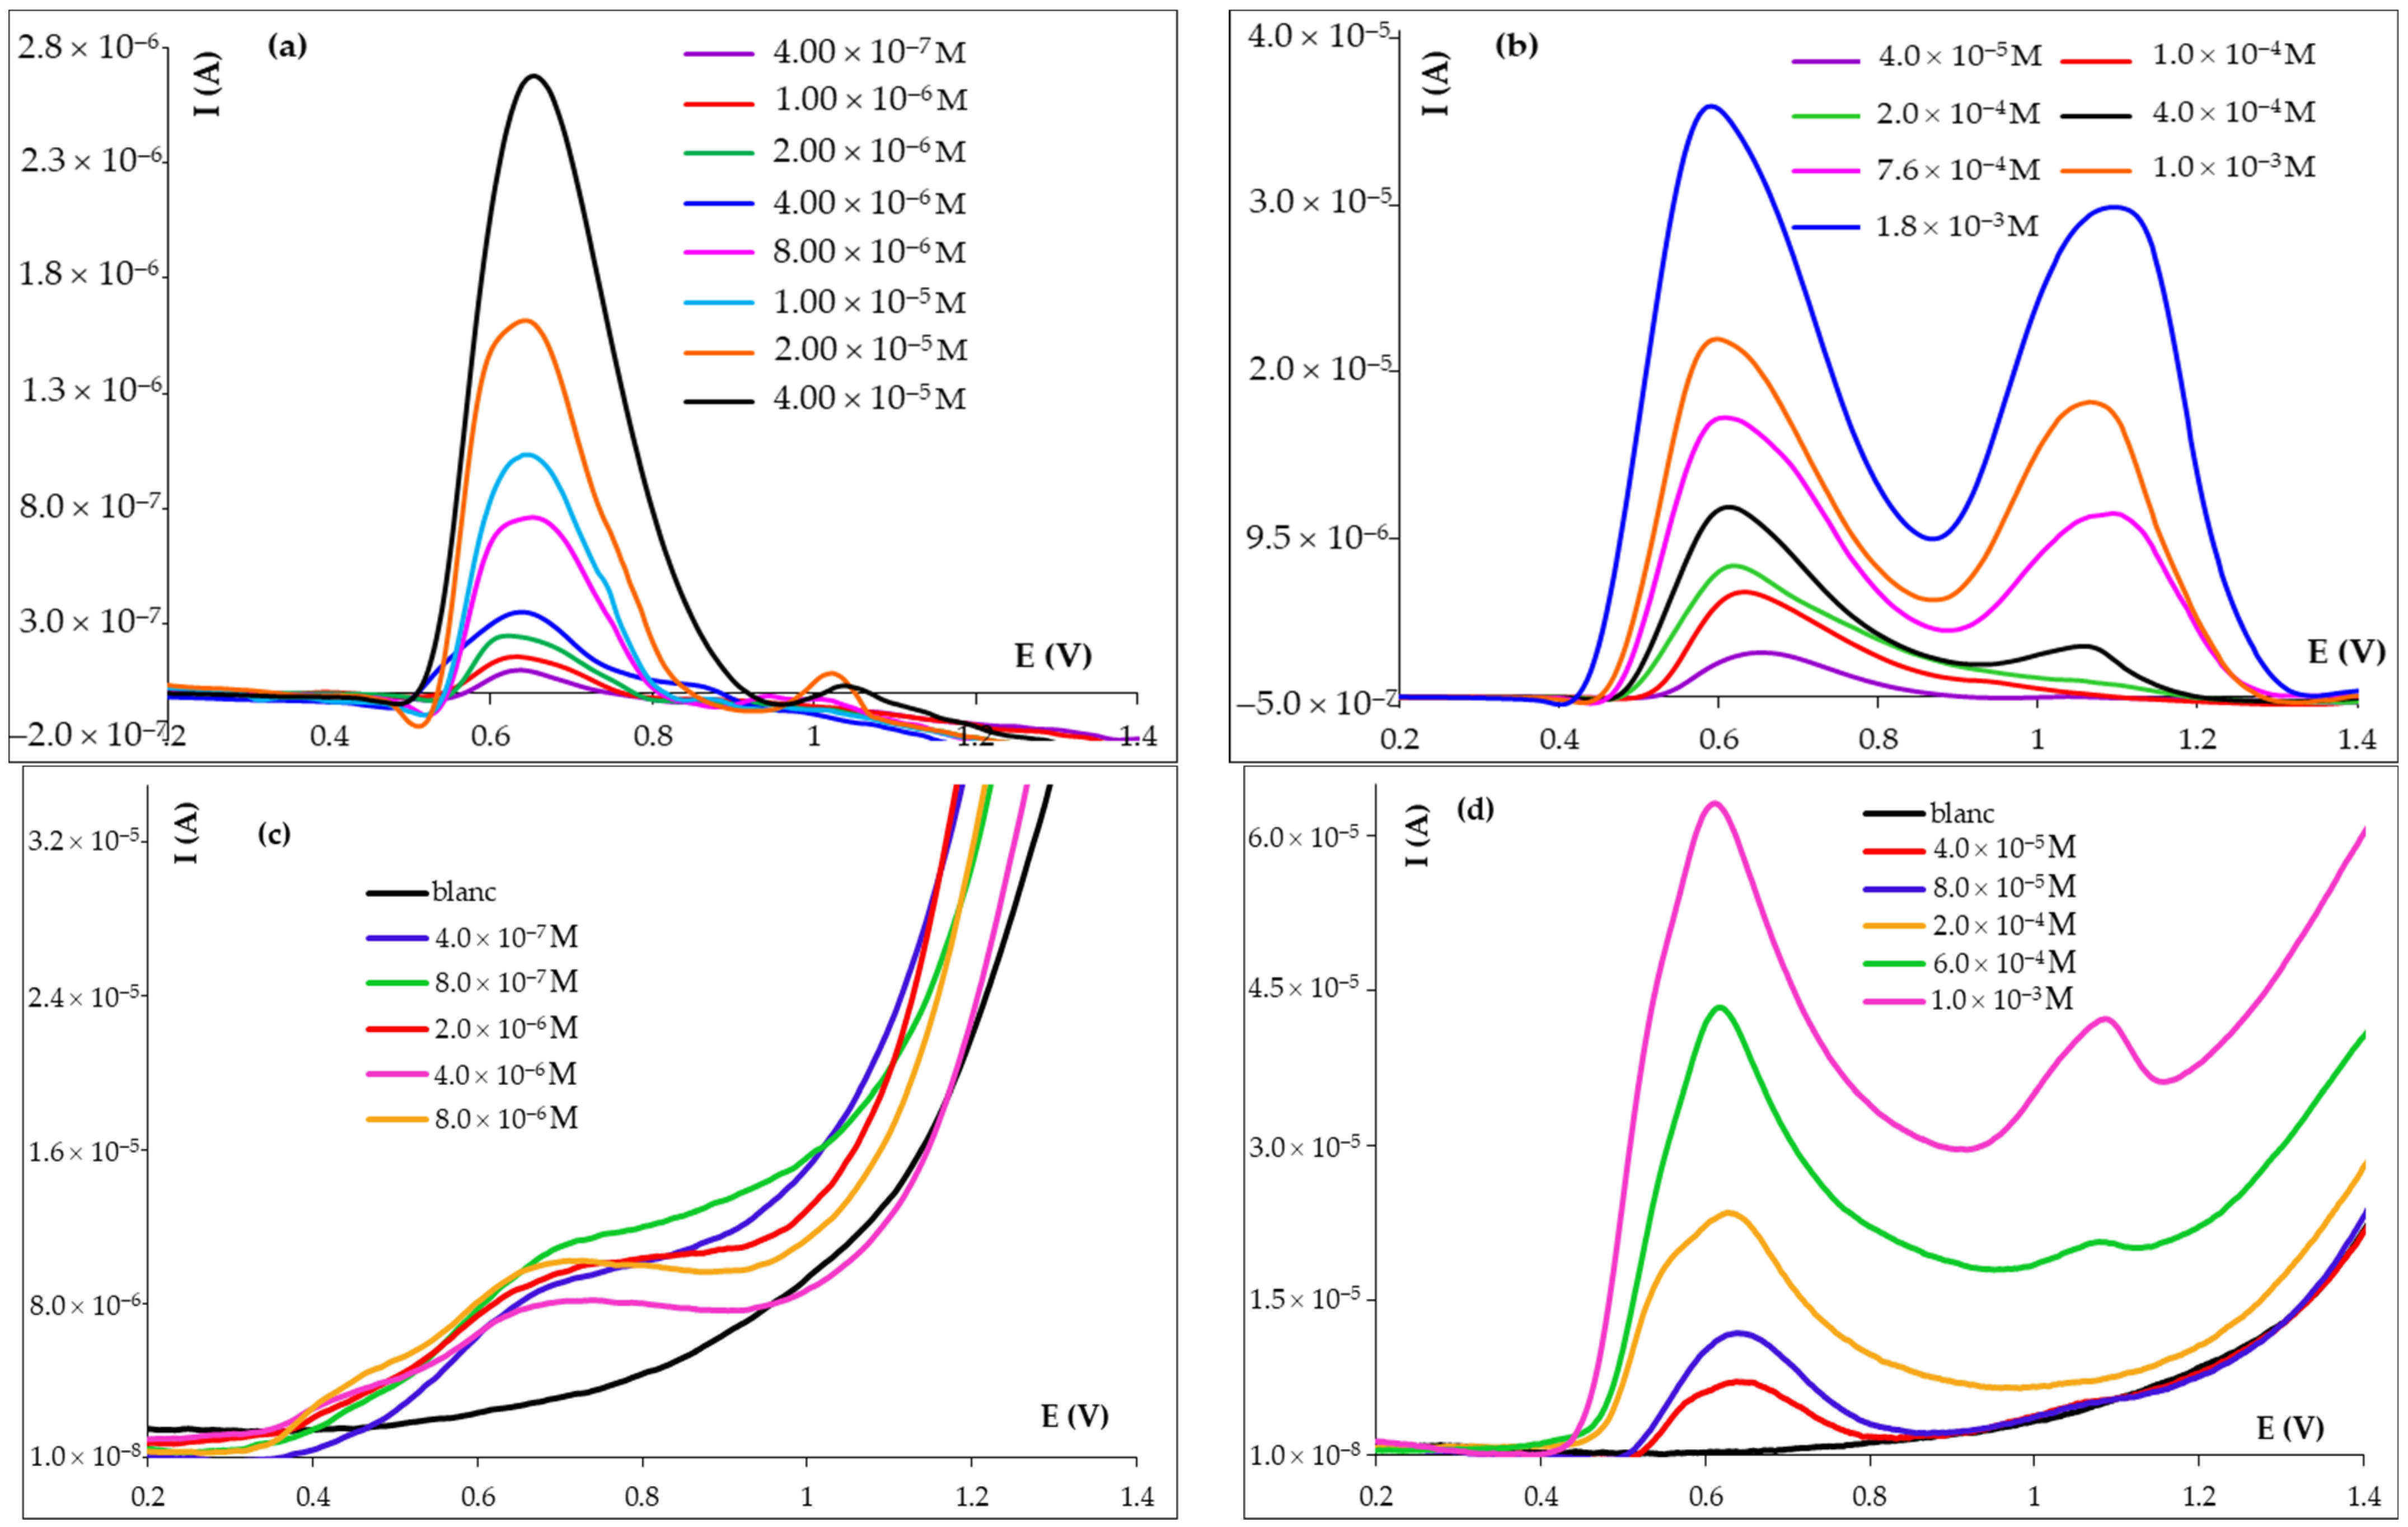
3.3.1. Linear Range, Limits of Detection and Quantification

The influence of the FA concentration on the intensity of its main oxidation peak a2 was investigated in the range 1.00 × 10⁻⁷–2.00 × 10⁻³ mol/L FA using the more sensitive voltammetric techniques, namely DPV and SWV (Figure 5). It can be observed that at higher FA concentrations, a third anodic signal appeared at more positive potentials (≥~1.00 V), but its Ipa = f(c) was not investigated. The height of the anodic signal a2 increased with the enhancement of the FA concentration from 4.00 ×10⁻⁷ to ~1.00 × 10⁻³ mol/L, but the linear dependence between the peak current (Ipa2) and the analyte concentration was divided into two segments with different slopes. Thus, the calibration graph presented two linear ranges (Table 4) described by the following regression equations (Figure S5): Ipa2 (A) = 0.0637 C (mol/L) + 2.00 × 10⁻⁷ (R2 = 0.9993) and Ipa2 (A) = 0.0148 C (mol/L) + 5.00 × 10⁻⁶ (R2 = 0.9987) for DPV and Ipa2 (A) = 0.1144 C (mol/L) + 2.00 × 10⁻⁶ (R2 = 0.9997) and Ipa2 (A) = 0.0406 C (mol/L) + 1.00 × 10⁻⁵ (R2 = 0.9993) for SWV. The limits of detection (LOD) (Table 4) and quantification (LOQ) were calculated as 3.3 σ/b and 10 σ/b, respectively, where σ represents the standard deviation of the intercept of the regression equation of the lower linear range and b was the slope (0.0637 A×L/mol for DPV and 0.1144 A × L/mol for SWV) of the calibration curve corresponding to that concentration range. The obtained LOQs were 9.33 × 10⁻⁷ and 5.52 × 10⁻⁷ mol/L FA for DPV and SWV, respectively. According to the values of the slopes of the calibration graphs, SWV was more sensitive than DPV, but the performance characteristics of the two techniques are somewhat similar. Compared to other methods developed for FA voltammetric quantification, those presented in this paper, which use bare carbon-based electrodes, have linear ranges (of almost three orders of magnitude) and LODs (at 10−7 mol/L level) similar or better than half of those reported in the literature till now (Table 4), all of them using modified working electrodes.

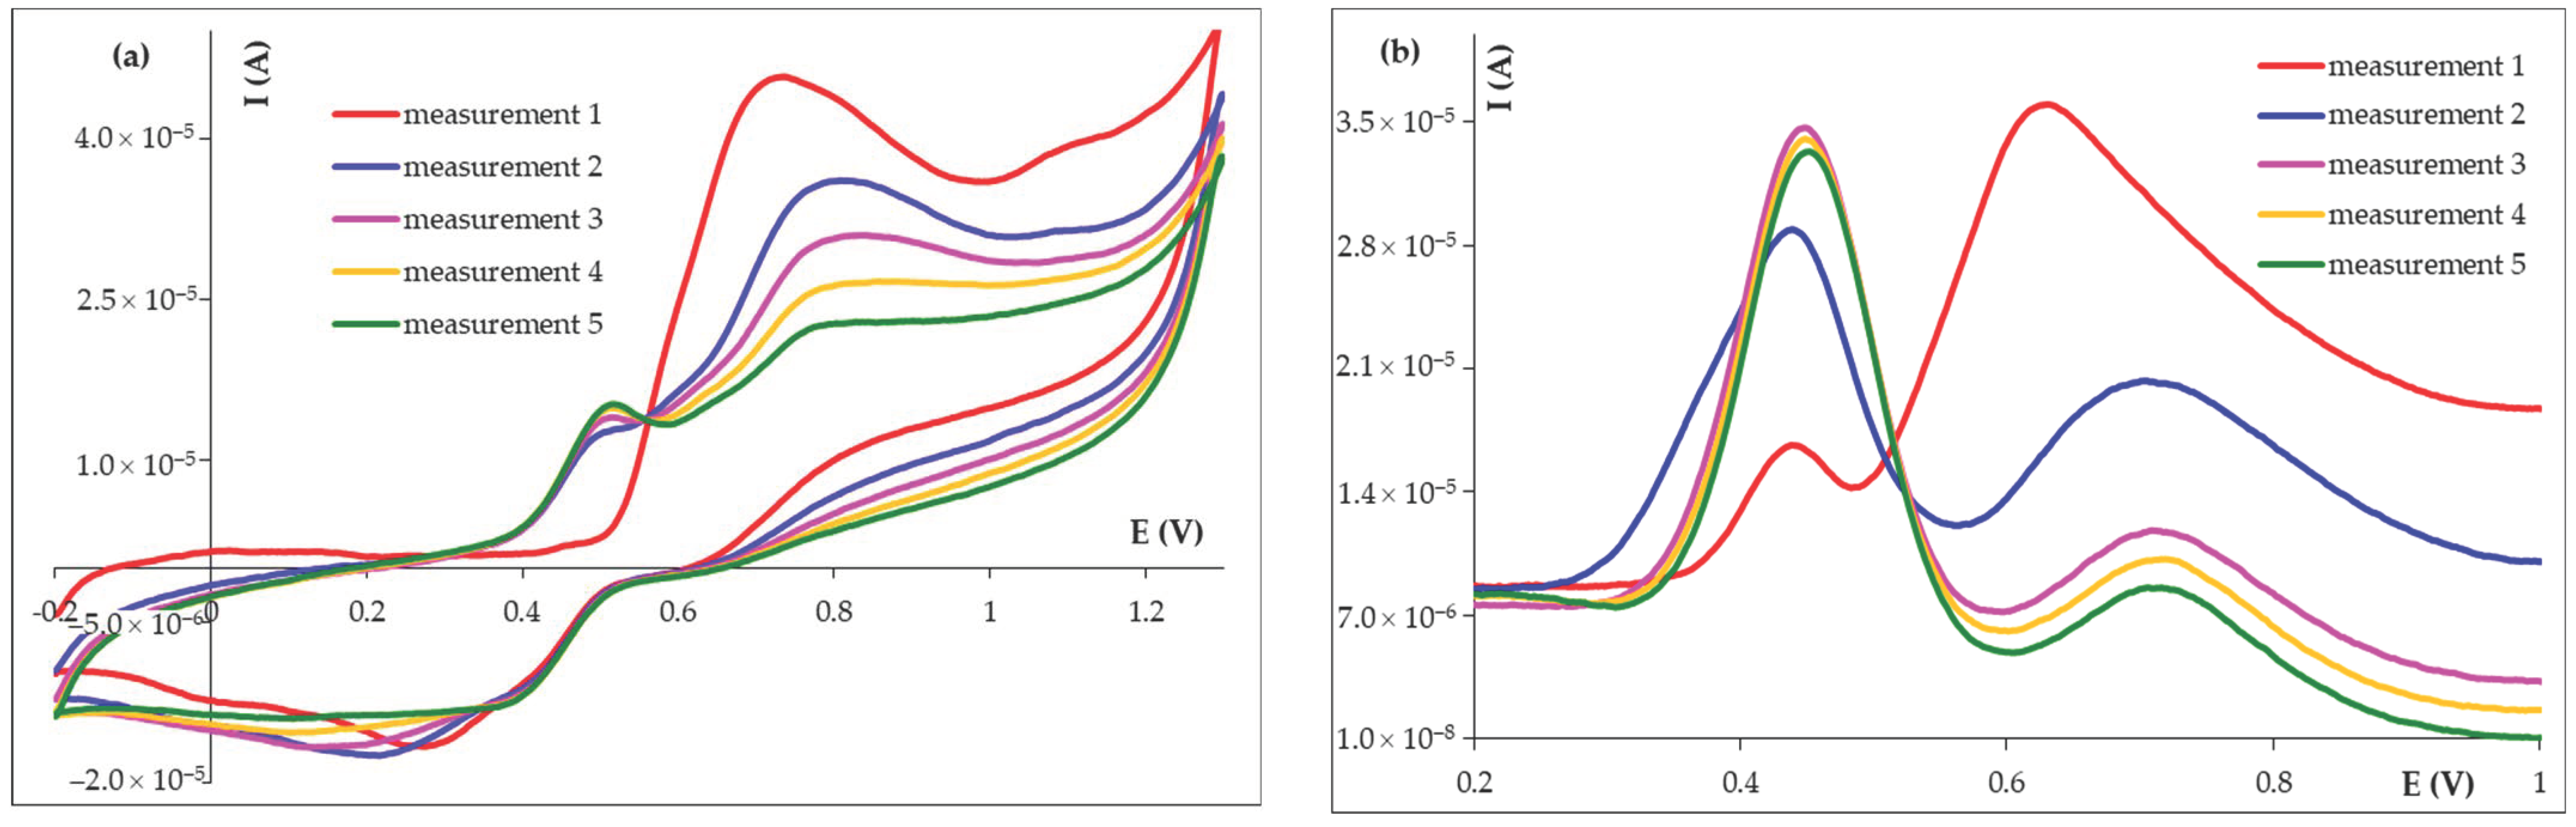
3.3.2. Reproducibility of the Electrode Response

The reproducibility of the HB_PGE voltammetric response expressed as a percentage relative standard deviation (RSD%) and calculated as a standard deviation × 100/average of ten measurements was estimated by both DPV and SWV at three concentration levels situated within the linear range of the methods, each recording being carried out on a new HB_PGE. The RSD% values (Table 5) obtained for each tested concentration fell within the corresponding accepted limits [55], thus demonstrating the good precision of the DPV and SWV methods developed for FA quantification at HB_PGE.
RSD% values from other reported methods can be significantly compared with those obtained in our work only if they were given for the same concentration level. However, a search of the RSD% values reported in the papers published for FA voltammetric analysis revealed the fact that the RSD% values obtained in our study are similar to many of the previously published ones [26,29,31,37,41,43,46], while there are also some with lower RSD% values [20,34,35,44].

3.4. Investigation of Possible Interferents on FA Voltammetric Analysis at HB_PGE

The effect of some polyphenolic antioxidants on FA voltammetric analysis at HB_PGE was investigated in BRB pH 4.56 solution. From the huge number of phenolic phytochemicals, which can coexist with FA in various matrices, gallic acid, a hydroxybenzoic acid most commonly used as reference to express the total phenolic content of samples, the structurally related hydroxycinnamic acid, caffeic acid and the glycosylated bioflavonoid naringin (Figure S6) were tested as possible interferents in FA determination by DPV at HB_PGE at molar concentration ratios FA/interferent of 1:1 and 1:10. All examined polyphenols presented oxidation peaks at potentials quite different from that of FA (Figure S7), namely caffeic acid and gallic acid at about 0.300 V and naringin at ~0.890 V and ~1.150 V. Thus, in the given working conditions the investigated antioxidants did not significantly influence the FA oxidation peak current due to the fact that the separation of their peak potentials was about 0.300 V even if the FA anodic peak potential (~0.635 V) was shifted with about 0.03–0.04 V in the negative direction in the presence of caffeic acid and gallic acid and with 0.02 V towards more positive values when it was mixed with naringin. Moreover, it must be specified that the FA signal did not vary more than ±5% in the presence of the tested interferents.

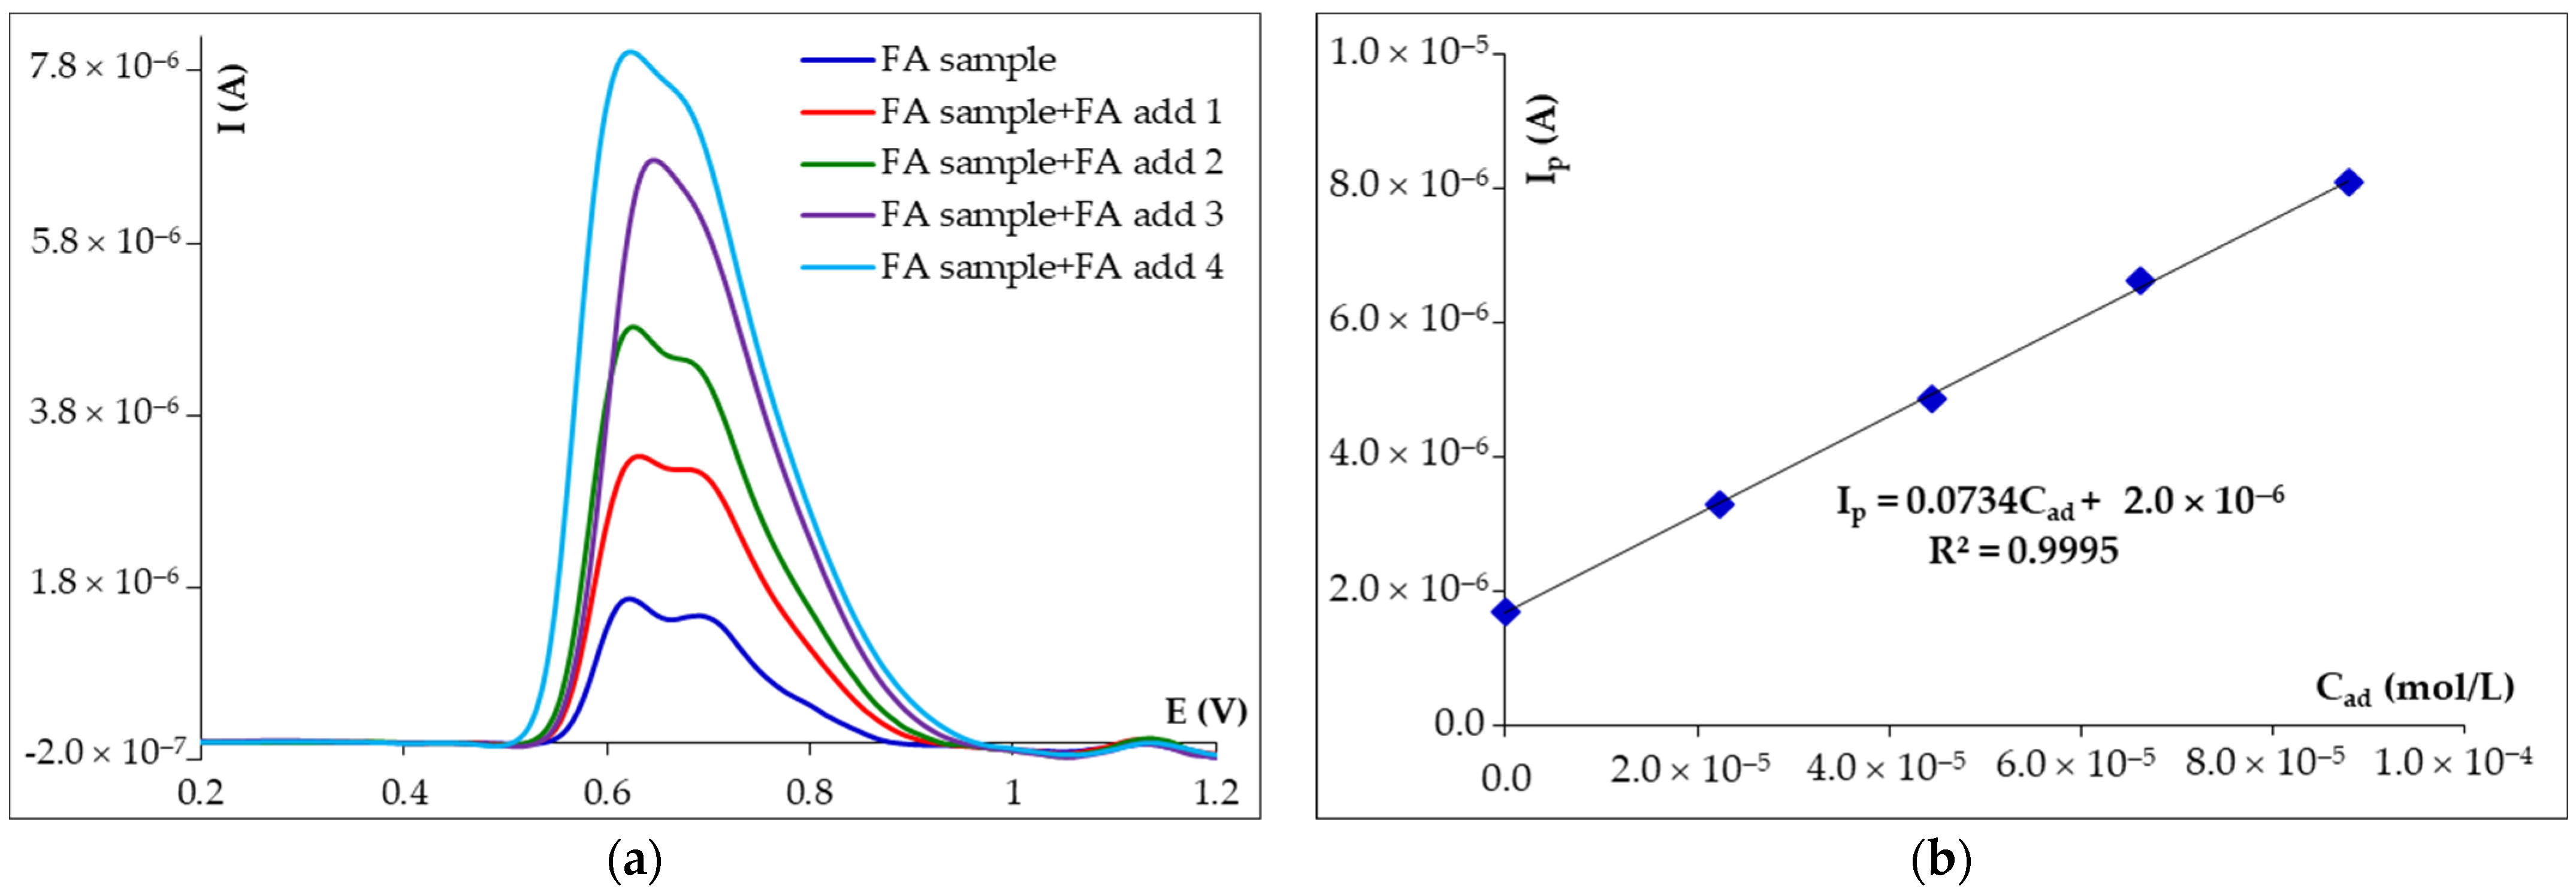
3.5. Analytical Application of DPV and SWV at HB_PGE Method for FA Voltammetric Analysis

The analytical applicability of the developed voltammetric methods for rapid FA voltammetric analysis was tested using, as real sample, a commercially available powder for cosmetic preparations with a content of 98% FA extracted from the root of the Ferula assafoetida L. The sample working solution was prepared in BRB pH 4.56 solution as previously described in the Experimental section. Differential pulse (Figure 6) and square-wave voltammograms (not shown) recorded for 10 mL powder sample solution before and after each of the four additions of FA solution with exactly known concentration presented only the signal characteristic for the analyte, indicating that there are no interfering species. In both cases, this signal increased linearly with the addition of FA, the corresponding currents being used to determine the FA concentration based on the standard addition method. Thus, the FA recoveries (%) from tested samples were 101.00 ± 2.40% and 99.85 ± 2.76% by DPV and SWV, respectively. The results suggested that the proposed voltammetric methods using HB_PGE are suitable for FA quantification in real samples.

4. Conclusions

The present paper describes for the first time the electroanalysis of FA at the unmodified, single-use and cost-effective PGE whose electroactive surface area is a composite graphite-based material. The results were discussed in correlation with those previously reported in the literature and FA voltammetric behavior was similar with that already described for other working electrodes. The use of the HB_PGE in FA voltammetric quantification by both DPV and SWV presented wide linear concentration ranges of more than three orders of magnitude, which are comparable [20,37,39,42,43,45,47,51,53] or even better than almost all (with four exceptions) [15,23,24,25,26,27,28,33,34,35,36,38,40,41,44,46,48,49,50,52,54] voltammetric methods, using modified electrodes reported to date for the FA quantitative determination (Table 4). The LOD values of the voltammetric methods employing the bare PGE for FA detection were similar [25,26,40,41,51,53,54] or even better [27,33,36,38,47,52] than about 1/3 of the 35 papers (Table 4) published strictly on FA voltammetric analysis on modified sensors. Moreover, the selectivity of the bare PGE towards other commonly encountered natural polyphenols was good and last, but not least, the analysis was simple, rapid and involved few, non-toxic reagents so that the methods can be considered to be eco- and user-friendly. The analytical applicability of the HB_PGE was confirmed by the good recoveries generated for FA quantification in a commercially available powder for cosmetic use so that it proved to be a valuable tool for the quality control of various products with not very complicated matrices and could be employed in their routine analysis.

Supplementary Materials

The following supporting information can be downloaded at https://www.mdpi.com/article/10.3390/mi14101951/s1. Figure S1: FA chemical structure; Figure S2: The PGE; Figure S3: The variation of the DPV anodic peak current recorded at HB_PGE for 1.00 × 10⁻³ mol/L FA in ABS pH 4.00 prepared at different days from the same ethanolic 1.00 × 10⁻² mol/L FA stock solution; Figure S4: The variation of the DPV anodic peak current recorded at different time intervals at HB_PGE for a 5.00 × 10⁻⁴ mol/L FA in ABS pH 4.00. Figure S5: The Ip = f(C) dependencies obtained for the analysis of FA in BRB pH 4.56 solutions at HB_PGE by (a) DPV and (b) SWV; Figure S6: Chemical structures of the polyphenols tested as possible interferents in FA DPV analysis at HB_PGE (a) gallic acid (GA), (b) caffeic acid (CA) and (c) naringin (NG); Figure S7: Differential pulse voltammograms recorded at HB_PGE for 8.00 × 10⁻⁶ mol/L FA in BRB pH 4.56 solutions in the presence of (a) gallic acid, (b) caffeic acid and (c) naringin.

Author Contributions

Conceptualization, I.G.D. and D.E.P.; methodology, I.G.D. and D.E.P.; validation, M.B., S.N.C., L.C. and L.A.I.; formal analysis, I.G.D., D.E.P. and M.B.; investigation, S.N.C., L.C. and L.A.I.; data curation, H.N., S.N.C., L.C. and L.A.I.; writing—original draft preparation, I.G.D. and D.E.P.; writing—review and editing, M.B. and H.N. All authors have read and agreed to the published version of the manuscript.

Funding

This research received no external funding.

Data Availability Statement

Data are contained within the article or supplementary material.

Acknowledgments

The authors acknowledge the University of Bucharest for the administrative and technical support offered through the grant C1.2.PFE_CDI.2021-587/contract no.41PFE/30.12.2021.

Conflicts of Interest

The authors declare no conflict of interest. The funders had no role in the design of the study; in the collection, analyses, or interpretation of data; in the writing of the manuscript; or in the decision to publish the results.

Abbreviations

α-Fe2O3/MWCNTsα-ferric oxide/multi-walled carbon nanotubes
Ag/MWCNTssilver decorated multi-walled carbon nanotubes
Ampamperometry
CAchronoamperometry
CCcarbon cloth
CDEcarbon disc electrode
CNFcarbon nanofiber
CPEcarbon paste electrode
CVcyclic voltammetry
DDAB/Nafdidodecyldimethylammonium bromide/Nafion composite film
DPVdifferential pulse voltammetry
EPD-LnPc2 sensorselectrophoretic deposition-lanthanoid bisphthalocyanines voltammetric multisensor
erGOelectrochemically reduced graphene oxide
FIAflow injection analysis
g-C3N4/CSgraphite-like carbon nitride/chitosan
GCEglassy carbon electrode
GNgraphene nanosheet
G-novolacGraphene–phenolic novolac resin composite
GO/MWCNTsgraphene oxide sheets and multi-walled carbon nanotubes nanocomposite
La–TyLaccase–Tyrosinase
L-Cys/SAML-cysteine self-assembled monolayers
LSVlinear sweep voltammetry
MBIBr/NiO-SWCNTsNiO-embedded single-walled carbon nanotube nanocomposite and n-methyl-3-butylimidazolium bromide
MgO/SWCNTs-[Bmim][Tf2N]magnesium oxide/single-walled carbon nanotubes/1-butyl-3-methylimidazolium bis(trifluoromethylsulfonyl)imide
MnFe2O4/BMIM-PF6MnFe2O4 nanoparticle/1-butyl-3-methylimidazolium hexafluorophosphate
MnO2-NPs/MWCNTsMnO2 nanoparticles decorated multi-walled carbon nanotubes
MWCNTsmulti-walled carbon nanotubes
pBCP/f-SWCNTspolybromocresol purple/polyaminobenzene sulfonic acid functionalized single-walled carbon nanotubes
PDDA-Gpoly(diallyldimethylammoniumchloride) functionalized graphene
PEI/MWCNTpolyethyleneimine–multi-walled carbon nanotube
PGEpencil graphite electrode
pGlupoly(glutamic acid)
PPy/MWCNTpolypyrrole-multiwalled carbon nanotubes
pSY/MWCNTspoly(Sunset Yellow)/multiwalled carbon nanotubes
rG-CdO/MOITFreduced graphene decorated CdO nanocomposite/1- methyl-3-octylimidazolium tetrafuoroborate ionic liquid
rGO-AuNPs/MIP-(a)SPEmolecularly imprinted on reduced graphene oxide-gold nanoparticles modified activated screen printed electrode
rGO/ZrHCF-PIGEreduced graphene oxide/zirconium hexacyanoferrate modified paraffin impregnated graphite electrode
SPEscreen-printed electrode
SWVsquare-wave voltammetry
TiO2-NPs/rGOTiO2 nanoparticle-decorated, chemically reduced graphene oxide

References

  1. Drăgan, M.; Tătărîngă, G.; Mircea, C.; Cioancă, O.; Dragostin, O.; Iacob, A.T.; Profire, L.; Stan, C.D. Ferulic acid—A versatile molecule. Acta Biol. Marisiensis 2018, 1, 53–60. [Google Scholar] [CrossRef]
  2. Marcato, D.C.; Spagnol, C.M.; Salgado, H.R.N.; Isaac, V.L.B.; Corrêa, M.A. New and potential properties, characteristics, and analytical methods of ferulic acid: A review. Braz. J. Pharm. Sci. 2022, 58, e18747. [Google Scholar] [CrossRef]
  3. Boz, H. Ferulic acid in cereals—A review. Czech J. Food Sci. 2015, 33, 1–7. [Google Scholar] [CrossRef]
  4. Raj, N.D.; Singh, D. A critical appraisal on ferulic acid: Biological profile, biopharmaceutical challenges and nano formulations. Health Sci. Rev. 2022, 5, 100063. [Google Scholar] [CrossRef]
  5. Ou, S.; Kwok, K. Ferulic acid: Pharmaceutical functions, preparation and applications in foods. J. Sci. Food Agric. 2004, 84, 1261–1269. [Google Scholar] [CrossRef]
  6. Dong, X.; Huang, R. Ferulic acid: An extraordinarily neuroprotective phenolic acid with anti-depressive properties. Phytomedicine 2022, 105, 154355. [Google Scholar] [CrossRef]
  7. Tian, W.; Chen, G.; Gui, Y.; Zhang, G.; Li, Y. Rapid quantification of total phenolics and ferulic acid in whole wheat using UV–Vis spectrophotometry. Food Control 2021, 123, 107691. [Google Scholar] [CrossRef]
  8. Karimi-Maleh, H.; Farahmandfar, R.; Hosseinpour, R.; Alizadeh, J.; Abbaspourrad, A. Determination of ferulic acid in the presence of butylated hydroxytoluene as two phenolic antioxidants using a highly conductive food nanostructure electrochemical sensor. Chem. Pap. 2019, 73, 2441–2447. [Google Scholar] [CrossRef]
  9. Janus, E.; Pinheiro, L.R.; Nowak, A.; Kucharska, E.; Swiatek, E.; Podolak, N.; Peruzynska, M.; Piotrowska, K.; Duchnik, W.; Kucharski, L.; et al. New ferulic acid and amino acid derivatives with increased cosmeceutical and pharmaceutical potential. Pharmaceutics 2023, 15, 117. [Google Scholar] [CrossRef]
  10. Sibhatu, H.K.; Jabasingh, S.A.; Yimam, A.; Ahmed, S. Ferulic acid production from brewery spent grains, an agro-industrial waste. LWT Food Sci. Technol. 2021, 135, 110009. [Google Scholar] [CrossRef]
  11. Valerio, R.; Torres, C.A.V.; Brazinha, C.; da Silva, M.G.; Coelhoso, I.M.; Crespo, J.G. Purification of ferulic acid from corn fibre alkaline extracts for bio-vanillin production using an adsorption process. Sep. Purif. Technol. 2022, 298, 121570. [Google Scholar] [CrossRef]
  12. Barberousse, H.; Roiseux, O.; Robert, C.; Paquot, M.; Deroanne, C.; Blecker, C. Analytical methodologies for quantification of ferulic acid and its oligomers. J. Sci. Food Agric. 2008, 88, 1494–1511. [Google Scholar] [CrossRef]
  13. Wang, H.; Jiang, S.; Pan, J.; Lin, J.; Wang, J.; Li, M.; Xie, A.; Luo, S. Nanomaterials-based electrochemical sensors for the detection of natural antioxidants in food and biological samples: Research progress. Microchim. Acta 2022, 189, 318. [Google Scholar] [CrossRef]
  14. European Pharmacopoeia; Council of Europe: Strasbourg, France, 2019.
  15. Li, X.; Gao, Y.; Xiong, H.; Yang, Z. The electrochemical redox mechanism and antioxidant activity of polyphenolic compounds based on inlaid multi-walled carbon nanotubes modified graphite electrode. Open Chem. 2021, 19, 961–973. [Google Scholar] [CrossRef]
  16. David, I.G.; Popa, D.E.; Buleandra, M. Pencil graphite electrodes: A versatile tool in electroanalysis. J. Anal. Methods Chem. 2017, 2017, 1905968. [Google Scholar] [CrossRef] [PubMed]
  17. David, I.G.; Buleandra, M.; Popa, D.E.; Cheregi, M.C.; David, V.; Iorgulescu, E.E.; Tartareanu, G.O. Recent developments in voltammetric analysis of pharmaceuticals using disposable pencil graphite electrodes. Processes 2022, 10, 472. [Google Scholar] [CrossRef]
  18. Pandey, A.; Sharma, S.; Jain, R.; Raja, A.N. Review—Pencil graphite electrode: An emerging sensing material. J. Electrochem. Soc. 2020, 167, 037501. [Google Scholar] [CrossRef]
  19. David, I.G.; Litescu, S.C.; Moraru, R.; Albu, C.; Buleandra, M.; Popa, D.E.; Riga, S.; Ciobanu, A.M.; Noor, H. Electroanalysis of naringin at electroactivated pencil graphite electrode for the assessment of polyphenolics with intermediate antioxidant power. Antioxidants 2022, 11, 2306. [Google Scholar] [CrossRef]
  20. Malagutti, M.A.; de Fátima Ulbrich, K.; Winiarski, J.P.; Paes, V.Z.C.; Geshev, J.; Jost, C.L.; de Campos, C.E.M. Mechanochemical synthesis of γ-CoTe2 nanocrystals and their application for determination of ferulic acid. Mater. Today Commun. 2022, 31, 103481. [Google Scholar] [CrossRef]
  21. Guillén-Villar, R.C.; Vargas-Álvarez, Y.; Vargas, R.; Garza, J.; Matus, M.H.; Salas-Reyes, M.; Domínguez, Z. Study of the oxidation mechanisms associated to new dimeric and trimeric esters of ferulic acid. J. Electroanal. Chem. 2015, 740, 95–104. [Google Scholar] [CrossRef]
  22. da Silva, L.V.; Lopes, C.B.; da Silva, W.C.; de Paiva, Y.G.; de Assis dos Santos Silva, F.; Lima, P.R.; Kubota, L.T.; Goulart, M.O.F. Electropolymerization of ferulic acid on multi-walled carbon nanotubes modified glassy carbon electrode as a versatile platform for NADH, dopamine and epinephrine separate detection. Microchem. J. 2017, 133, 460–467. [Google Scholar] [CrossRef]
  23. Sousa, W.R.; da Rocha, C.; Cardoso, C.L.; Silva, D.H.S.; Zanoni, M.V.B. Determination of the relative contribution of phenolic antioxidants in orange juice by voltammetric methods. J. Food Compos. Anal. 2004, 17, 619–633. [Google Scholar] [CrossRef]
  24. Zhang, L.; Dong, S.; Yang, Z.; Wang, Q.; He, P.; Fang, Y. Determination of four polyphenolic active ingredients from a pharmaceutical preparation by capillary zone electrophoresis with amperometric detection. J. Pharm. Biomed. Anal. 2008, 48, 198–200. [Google Scholar] [CrossRef] [PubMed]
  25. Yua, Y.-Y.; Wu, Q.-S.; Wang, X.-G.; Ding, Y.P. Electrochemical determination of ferulic acid in Chinese traditional medicine Xiao Yao pills at electrode modified with carbon nanotube. Russ. J. Electrochem. 2009, 45, 170–174. [Google Scholar] [CrossRef]
  26. Ziyatdinova, G.; Aytuganova, I.; Nizamova, A.; Budnikov, H. Differential pulse voltammetric assay of coffee antioxidant capacity with MWNT-modified electrode. Food Anal. Methods 2013, 6, 1629–1638. [Google Scholar] [CrossRef]
  27. Zhao, X.; Zhang, Y.; Gao, D.; Xiong, H.; Gao, Y.; Li, S.; Li, X.; Yang, Z.; Liu, M.; Dai, J.; et al. Electrochemical behavior and determination of four drugs using multi-wall carbon nanotubes modified glassy carbon electrode. Int. J. Electrochem. Sci. 2019, 14, 506–515. [Google Scholar] [CrossRef]
  28. Xia, Z.; Zhang, Y.; Li, Q.; Du, H.; Gui, G.; Zhao, G. Electrochemical determination of ferulic acid in Pinellia Ternata based on Gos/MWCNTs nanocomposite modified electrode. Int. J. Electrochem. Sci. 2020, 15, 559–566. [Google Scholar] [CrossRef]
  29. Erady, V.; Mascarenhas, R.J.; Satpati, A.K.; Detriche, S.; Mekhalif, Z.; Dalhalle, J.; Dhason, A. Sensitive detection of ferulic acid using multi-walled carbon nanotube decorated with silver nano-particles modified carbon paste electrode. J. Electroanal. Chem. 2017, 806, 22–31. [Google Scholar] [CrossRef]
  30. Li, G.; Luo, B.; Lv, X.; Tian, X. MWCNTs modified α-Fe2O3 derived from MIL-53(fe) with highly sensitive electrochemical sensor for ferulic acid. J. Porous Mater. 2023, 2023, 470y. [Google Scholar] [CrossRef]
  31. Vilian, A.T.E.; Chen, S.-M. Preparation of carbon nanotubes decorated with manganese dioxide nanoparticles for electrochemical determination of ferulic acid. Microchim. Acta 2015, 182, 1103–1111. [Google Scholar] [CrossRef]
  32. Zabihpoura, T.; Shahidia, S.-A.; Karimi-Malehb, H.; Ghorbani-HasanSaraeia, A. An ultrasensitive electroanalytical sensor based on MgO/SWCNTs-1-Butyl3-methylimidazolium bis(trifluoromethylsulfonyl)imide paste electrode for the determination of ferulic acid in the presence sulfite in food samples. Microchem. J. 2020, 154, 104572. [Google Scholar] [CrossRef]
  33. Jing, L.; Lin, J.; Fei, Q.; Tang, H.; Yang, X.; Sun, C. Simultaneous quantitation of caffeic acid and ferulic acid based on graphite-like C3N4/chitosan modified film. Int. J. Electrochem. Sci. 2017, 12, 8504–8515. [Google Scholar] [CrossRef]
  34. Ziyatdinova, G.; Zhupanova, A.; Davletshin, R. Simultaneous determination of ferulic acid and vanillin in Vanilla extracts using voltammetric sensor based on electropolymerized bromocresol purple. Sensors 2022, 22, 288. [Google Scholar] [CrossRef]
  35. Ziyatdinovaa, G.K.; Gussa, E.V.; Morozovaa, E.V.; Budnikova, H.C. An electrode based on electropolymerized Sunset Yellow for the simultaneous voltammetric determination of chlorogenic and ferulic acids. J. Anal. Chem. 2021, 76, 371–380. [Google Scholar] [CrossRef]
  36. Abdel-Hamid, R.; Newair, E.F. Voltammetric determination of ferulic acid using polypyrrole-multiwalled carbon nanotubes modified electrode with sample application. Nanomaterials 2015, 5, 1704–1715. [Google Scholar] [CrossRef] [PubMed]
  37. Arribas, A.S.; Martinez-Fernandez, M.; Moreno, M.; Bermejo, E.; Zapardiel, A.; Chicharro, M. Analysis of total polyphenols in wines by FIA with highly stable amperometric detection using carbon nanotube-modified electrodes. Food Chem. 2013, 136, 1183. [Google Scholar] [CrossRef]
  38. Martin, M.G.; de Saja, J.A.; Munoz, R.; Rodriguez-Mendez, M.L. Multisensor system based on bisphthalocyanine nanowires for the detection of antioxidants. Electrochim. Acta 2012, 68, 88–94. [Google Scholar] [CrossRef]
  39. Wang, X.-G.; Li, J.; Fan, Y.-J.; Zhang, X. Determination of ferulic acid in Chinese proprietary medicine based on a poly-glutamic acid film sensor. Russ. J. Electrochem. 2012, 48, 1160–1165. [Google Scholar] [CrossRef]
  40. Luo, L.; Wang, X.; Li, Q.; Ding, Y.; Jia, J.; Deng, D. Voltammetric determination of ferulic acid by didodecyldimethylammonium bromide/nafion composite film-modified carbon paste electrode. Anal. Sci. 2010, 26, 907–911. [Google Scholar] [CrossRef]
  41. Zhang, Y.; Liu, Y.; Yang, Z.; Yang, Y.; Pang, P.; Gao, Y.; Hu, Q. Rapid electrochemical detection of ferulic acid based on a graphene modified glass carbon electrode. Anal. Methods 2013, 5, 3834–3839. [Google Scholar] [CrossRef]
  42. Liu, L.-J.; Gao, X.; Zhang, P.; Feng, S.-L.; Hu, F.-D.; Li, Y.-D.; Wang, C.-M. Ultrasensitive detection of ferulic acid using poly(diallyldimethylammonium chloride) functionalized graphene-based electrochemical sensor. J. Anal. Meth. Chem. 2014, 2014, 790. [Google Scholar] [CrossRef] [PubMed]
  43. Liu, L.; Gou, Y.; Gao, X.; Zhang, P.; Chen, W.; Feng, S.; Hu, F.; Li, Y. Electrochemically reduced graphene oxide-based electrochemical sensor for the sensitive determination of ferulic acid in A. sinensis and biological samples. Mat. Sci. Eng. C 2014, 42, 227–233. [Google Scholar] [CrossRef] [PubMed]
  44. Buffon, E.; Stradiotto, N.R. A molecularly imprinted polymer on reduced graphene oxide-gold nanoparticles modified screen-printed electrode for selective determination of ferulic acid in orange peels. Microchem. J. 2021, 167, 106339. [Google Scholar] [CrossRef]
  45. Bharathi, T.D.; Anandh, P.S.; Rangarajan, M. Differential pulse voltammetric detection of ferulic acid using RGO-TiO2 electrodes. In Proceedings of the 2018 15th IEEE India Council International Conference (INDICON), Combatore, India, 5–18 December 2018; pp. 1–6. [Google Scholar] [CrossRef]
  46. Ebrahimi, P.; Shahidi, S.A.; Bijad, M. A rapid voltammetric strategy for determination of ferulic acid using electrochemical nanostructure tool in food samples. J. Food Meas. Charact. 2020, 14, 3389–3396. [Google Scholar] [CrossRef]
  47. Mao, H.; Zhang, Y.; Chen, G. Determination of three phenolic acids in Cimicifugae rhizoma by capillary electrophoresis with a graphene–phenolic resin composite electrode. Anal. Methods 2019, 11, 303–308. [Google Scholar] [CrossRef]
  48. Saranya, S.; Deepa, P.N. Evolution of novel rGO/ZrHCF composite and utility in electrocatalysis towards nanomolar detection of sodium nitrite and ferulic acid. J. Mater. Sci. Mater. Electron. 2020, 31, 18923–18936. [Google Scholar] [CrossRef]
  49. Murugesan, D.; Amir, H.; Ponpandian, N.; Viswanathan, C. Development of RF magnetron-sputtered molybdenum oxide-modified carbon cloth thin film as a ferulic acid sensor. Appl. Phys. A 2021, 127, 805. [Google Scholar] [CrossRef]
  50. Elkaoutit, M.; Naranjo-Rodriguez, I.; Temsamani, K.R.; de la Vega, M.D.; Hidalgo-Hidalgo de Cisneros, J.L. Dual laccase–tyrosinase based sonogel–carbon biosensor for monitoring polyphenols in beers. J. Agric. Food Chem. 2007, 55, 8011–8018. [Google Scholar] [CrossRef]
  51. Li-Jun, L.; Lai-Bo, Y.; Qi-Feng, C.; Hao, C.; Feng-Min, W.; Jian-Ling, W.; Hong-Xing, K. Determination of ferulic acid based on L-cysteine self-assembled modified gold electrode coupling irreversible biamperometry. Chin. J. Anal. Chem. 2007, 35, 933–937. [Google Scholar] [CrossRef]
  52. Tee-ngam, P.; Nunant, N.; Rattanarat, P.; Siangproh, W.; Chailapakul, O. Simple and rapid determination of ferulic acid levels in food and cosmetic samples using paper-based platforms. Sensors 2013, 13, 13039–13053. [Google Scholar] [CrossRef]
  53. Zabihpour, T.; Shahidi, S.-A.; Karimi-Maleh, H.; Saraei, A.G.-H. MnFe2O4/1-Butyl-3-methylimidazolium hexafluorophosphate modified carbon paste electrode: An amplified food sensor for determination of gallic acid in the presence of ferulic acid as two phenolic antioxidants. Eurasian Chem. Commun. 2020, 2, 362–373. [Google Scholar] [CrossRef]
  54. Bounegru, A.V.; Apetrei, C. Simultaneous determination of caffeic acid and ferulic acid using a carbon nanofiber-based screen-printed sensor. Sensors 2022, 22, 4689. [Google Scholar] [CrossRef] [PubMed]
  55. AOAC International. Guidelines for Standard Method Performance Requirements; Appendix F; AOAC International: Rockville, MD, USA, 2012; pp. 1–17. [Google Scholar]
Figure 1. Differential pulse voltammograms recorded at different electrodes for 1.00 × 10⁻³ mol/L FA in ABS pH 4.00.
Micromachines 14 01951 g001
Figure 2. Cyclic voltammograms (a) first scan; (b) second scan (selection); and (c) third scan (selection) of 5.00 × 10⁻⁴ mol/L FA solutions (scan rate v 0.100 V/s); and (d) square-wave voltammograms of 1.00 × 10⁻⁴ mol/L FA in BRB solutions with different pH values recorded at HB_PGE.
Micromachines 14 01951 g002
Figure 3. Cyclic voltammograms recorded at HB_PGE for 5.00 × 10⁻⁴ mol/L FA in BRB pH 4.56 solution at different scan rates: (a) first scan; (b) second scan.
Micromachines 14 01951 g003
Figure 4. Successive cyclic voltammograms (a) and square-wave voltammograms (b) recorded at the same HB_PGE for 5.00 × 10⁻⁴ mol/L FA in BRB pH 4.56 solution.
Micromachines 14 01951 g004
Figure 5. Differential pulse (a,b) and square-wave (c,d) voltammograms recorded at HB_PGE for different concentrations of FA in BRB pH 4.56 solutions.
Micromachines 14 01951 g005
Figure 6. (a) Differential pulse voltammograms recorded at HB_PGE for 10 mL FA powder sample in BRB pH 4.56 solution before and after each addition of 0.05 mL of 4.00 × 10⁻³ M FA solution, and (b) the corresponding calibration graph.
Micromachines 14 01951 g006
Table 1. Anodic peak currents (Ipa) obtained by DPV for 2.00 × 10⁻⁴ mol/L FA in ABS pH 4.00 using untreated and electrochemically pretreated HB_PGEs.
Electrochemical
Pretreatment
E Constant
(2.00 V; 60 s)
CV
(−2.00 to 2.00 V;
Can Rate 0.500 V/s; 10 Cycles)
None
Medium Ipa (A)
0.1 mol/L HCl1.82 × 10−51.74 × 10−51.87 × 10−5
ABS pH 4.001.57 × 10−51.85 × 10⁻⁵
PBS pH 7.001.67 × 10−51.47 × 10⁻⁵
Table 2. The regression equations and the determination coefficients (R2) for the Ep = f(pH) dependencies of each voltammetric signal of FA observed at HB_PGE.
TechniquepH Rangea1 Signala2 Signalc Signal
CV scan 11.81–9.15 Epa2 = −0.0566 × pH + 0.8747
(R2 = 0.9998)
Epc = −0.0566 × pH + 0.8747
(R2 = 0.9998)/1.81–7.96
CV scan 21.81–7.96Epa1 = −0.0569 × pH + 0.6467
(R2 = 0.9960)
Epa2 = −0.0494 × pH + 0.8998
(R2 = 0.9965)
Epc = −0.0566 × pH + 0.8747
(R2 = 0.9998)
CV scan 31.81–7.96Epa1 = −0.0574 × pH + 0.6575
(R2 = 0.9979)
Epa2 = −0.0498 × pH + 0.9201
(R2 = 0.9924)
Epc = −0.0566 × pH + 0.8747
(R2 = 0.9998)
DPV1.81–9.15 Epa2 = −0.0504 × pH + 0.8198
(R2 = 0.9750)
SWV1.81–9.15 Epa2 = −0.0505 × pH + 0.8633
(R2 = 0.9959)
Table 3. Various dependencies of the FA peak currents on the potential scan rate corresponding to the cyclic voltammograms from Figure 3.
Dependence Regression Equation
Peaka1 (Epa1 ~0.450–0.500 V)a2 (Epa2 ~0.700–0.800 V)c (Epc ~0.350–0.400 V)
Scan 1
Ip = f(v) Non-linearIpc = 2.00 × 10⁻⁴ × v − 9.00 × 10⁻⁹ (R2 = 0.9934)
Ip = f(v1/2) Ipa2 = 1.00 × 10⁻⁴ × v1/2 + 3.00 × 10⁻⁶ (R2 = 0.9964)Non-linear
log Ip = f(log v) log Ipa2 = 0.5367 × log v − 3.9449
(R2 = 0.9931)
log Ipc = 1.0536 × log v − 3.7689 (R2 = 0.9947)
Scan 2
Ip = f(v)Ipa1 = 1.00 × 10⁻⁴ × v − 8.00 × 10⁻⁷ (R2 = 0.9933)Non-linearIpc = −2.00 × 10⁻⁴ × v + 7.00 × 10⁻⁷ (R2 = 0.9962)
Ip = f(v1/2)Non-linearIpa2 = 5.00 × 10⁻⁵ × v1/2 − 4.00 × 10⁻⁷ (R2 = 0.9974)Non-linear
log Ip = f(log v)log Ipa1 = 1.1625 × log v − 3.8592
(R2 = 0.9871)
log Ipa2 = 0.5036 × log v − 4.3285
(R2 = 0.9934)
log Ipc = 1.1620 × log v − 3.6963
(R2 = 0.9964)
Table 4. The performance characteristics of voltammetric methods reported in the literature for FA determination.
TechniqueElectrodeLinear Range (mol/L)Limit of
Detection (mol/L)
SampleRef.
CV/LSVGCE4.00 × 10−4–1.00 × 10⁻³-Orange juice[23]
AmpCDE2.57 × 10−7–2.57 × 10−55.15 × 10−8Nao Xue Shuan Tablets[24]
CVMWCNTs-GCE1.00 × 10−5–5.00 × 10−31.00 × 10−7Xiao Yao Pill[25]
DPVMWCNTs-GCE5.30 × 10−6–5.30 × 10−43.20 × 10−7Coffee[26]
DPVMWCNTs-GCE2.00 × 10−6–1.00 × 10−51.00 × 10−6Tablets[27]
DPVMWCNTs-GCE1.03 × 10−8–6.17 × 10⁻⁷--[15]
CVGO/MWCNT-GCE2.40 × 10−7–3.20 × 10⁻⁵
8.80 × 10⁻⁵–1.23 × 10⁻³
8.00 × 10⁻⁸Pinellia ternate[28]
AmpAg/MWCNTs-CPE4.00 × 10−8–1.00 × 10−33.00 × 10−8Spiked urine; wine[29]
DPVα-Fe2O3/MWCNTs-GCEup to 6.00 × 10−61.75 × 10−8Tablets[30]
SWVMnO2-NPs/MWCNTs-GCE8.20 × 10−8–2.20 × 10−41.00 × 10−8Spiked human serum[31]
DPVMgO/SWCNTs-[Bmim][Tf2N]-CPE9.00 × 10−9–4.50 × 10−43.00 × 10−9Red wine; white rice[32]
DPVg-C3N4/CS-GCE2.57 × 10−5–1.54 × 10−42.55 × 10−5Food[33]
DPVpBCP/f-SWCNTs-GCE1.00 × 10−7–5.00 × 10⁻⁶
5.00 × 10⁻⁶–2.50 × 10⁻⁵
7.20 × 10⁻⁸Vanilla extracts[34]
DPVpSY/MWCNTs-GCE5.00 × 10−7–4.00 × 10−69.80 × 10−8Coffee[35]
SWVPPy/MWCNT-GCE3.32 × 10−6–2.59 × 10−51.17 × 10−6Popcorn[36]
AmpGCE
PEI/MWCNT/GCE
5.00 × 10⁻⁷–2.00 × 10⁻⁵
1.00 × 10⁻⁷–1.00 × 10⁻⁴
2.00 × 10⁻⁷
8.00 × 10⁻⁸
Wines[37]
CVEPD-DyPc2
EPD-GdPc2
EPD-LuPc2
6.00 × 10⁻⁵–1.00 × 10−42.19 × 10−6
3.18 × 10⁻⁵
6.91 × 10⁻⁶
-[38]
LSVpGlu-GCE2.00 × 10−7–3.00 × 10−47.00 × 10−8Chinese proprietary medicine[39]
CVDDAB/Naf-CPE2.00 × 10−6–1.20 × 10−43.90 × 10−7Pharmaceuticals[40]
DPVGN-GCE5.00 × 10−7–5.00 × 10−52.00 × 10−7Tablets[41]
DPVPDDA-G-GCE8.95 × 10−8–5.29 × 10−54.42 × 10−8Angelica sinensis; spiked human urine[42]
SWVγ-CoTe2-GCE4.00 × 10−8–2.80 × 10−51.30 × 10−8Cosmetics[20]
DPVerGO-GCE8.49 × 10−8–3.89 × 10−52.06 × 10−8Powder of A. sinensis; spiked urine and plasma[43]
DPVrGO-AuNPs/MIP-(a)SPE1.00 × 10−8–1.00 × 10−63.10 × 10−9Orange peels[44]
DPVTiO2-NPs/rGO-GCE1.00 × 10−7–3.00 × 10−41.00 × 10−8Popcorn, corn milk[45]
SWVrG-CdO/MOITF-CPE2.00 × 10−8–4.00 × 10−68.00 × 10−8Wheat flour; corn cider; corn milk[46]
AmpG-novolac-CPE1.00 × 10−6–1.00 × 10−37.50 × 10−7Cimicifugae rhizoma[47]
SWVrGO/ZrHCF-PIGE1.14 × 10−9–4.20 × 10−83.80 × 10−10Milk, water[48]
CAMoO3-CC3.00 × 10−5–3.00 × 10−42.30 × 10−9Pineapple juice, water[49]
AmpLa–Ty Sonogel–Carbon biosensor3.00 × 10−8–2.50 × 10−66.40 × 10−8Beer[50]
FIA-AmpL-Cys/SAM-Au5.00 × 10−7–8.00 × 10⁻⁵
1.00 × 10⁻⁴–1.00 × 10⁻³
1.20 × 10⁻⁷Sodium ferulate injection[51]
DPVPaper-based electrochemical device1.54 × 10−5–7.20 × 10−45.15 × 10−6Corn cider, corn milk[52]
SVWMBIBr/NiO-SWCNTs-CPE6.00 × 10−8–9.00 × 10−42.00 × 10−8Corn milk, wheat flour,
corn cider
[8]
DPVMnFe2O4/BMIM-PF6-CPE3.00 × 10−7–2.50 × 10−41.00 × 10−7Blueberry, white rice, mango dried powder[53]
CVCNF-SPE1.00 × 10−5–1.00 × 10−32.33 × 10−7Eye Blend product[54]
DPV
SWV
PGE4.00 × 10−7–1.00 × 10⁻⁴
1.00 × 10⁻⁴–1.82 × 10⁻³
4.00 × 10⁻⁷–8.00 × 10⁻⁵
1.00 × 10⁻⁴–1.00 × 10⁻³
3.08 × 10⁻⁷
1.82 × 10⁻⁷
This work
Table 5. Results of the reproducibility studies obtained for the voltammetric determination at HB_PGE in BRB pH 4.56 of FA at different concentration levels.
Concentration (mol/L) RSD%
TechniqueSWVDPV
4.00 × 10−76.366.03
2.00 × 10−64.594.42
5.00 × 10−43.103.33
Disclaimer/Publisher’s Note: The statements, opinions and data contained in all publications are solely those of the individual author(s) and contributor(s) and not of MDPI and/or the editor(s). MDPI and/or the editor(s) disclaim responsibility for any injury to people or property resulting from any ideas, methods, instructions or products referred to in the content.

