Firstly, the accuracy of the volume determination is analysed, which is crucial for the application of this technique. Then the behaviour of the drops from injection to long-term measurements is examined. The importance of liquid phase degassing in this technique is discussed. Finally, the influence of the standing waves on the drop’s vicinity with different dispersed substances is examined.
4.2. Behaviour of Levitating Drops
The basis for accurate mass transfer measurements of immobilised drops is certainly the stability in the position of the levitated drop and a uniform shape during the contact time itself. Every movement in position or shape oscillations results in increased mass transfer. We take a close look at several time periods to map a complete long-term measurement. The focus is on the shift of the centroid and its circularity in addition to the optically acquired volume. Within this subsection, the toluene/water system is examined due to its low aqueous solubility and, therefore, slow volume change within a measurement.
Injection behaviour (0–20 s): After the volume of the drop is injected, the drop is still attached to the capillary. When the capillary is pulled back, the drop detaches and moves towards the pressure anti-node and orbits around it for a short time. An injection of a Ø 3.5 mm drop is shown in
Video S1 of the Supplementary Material.
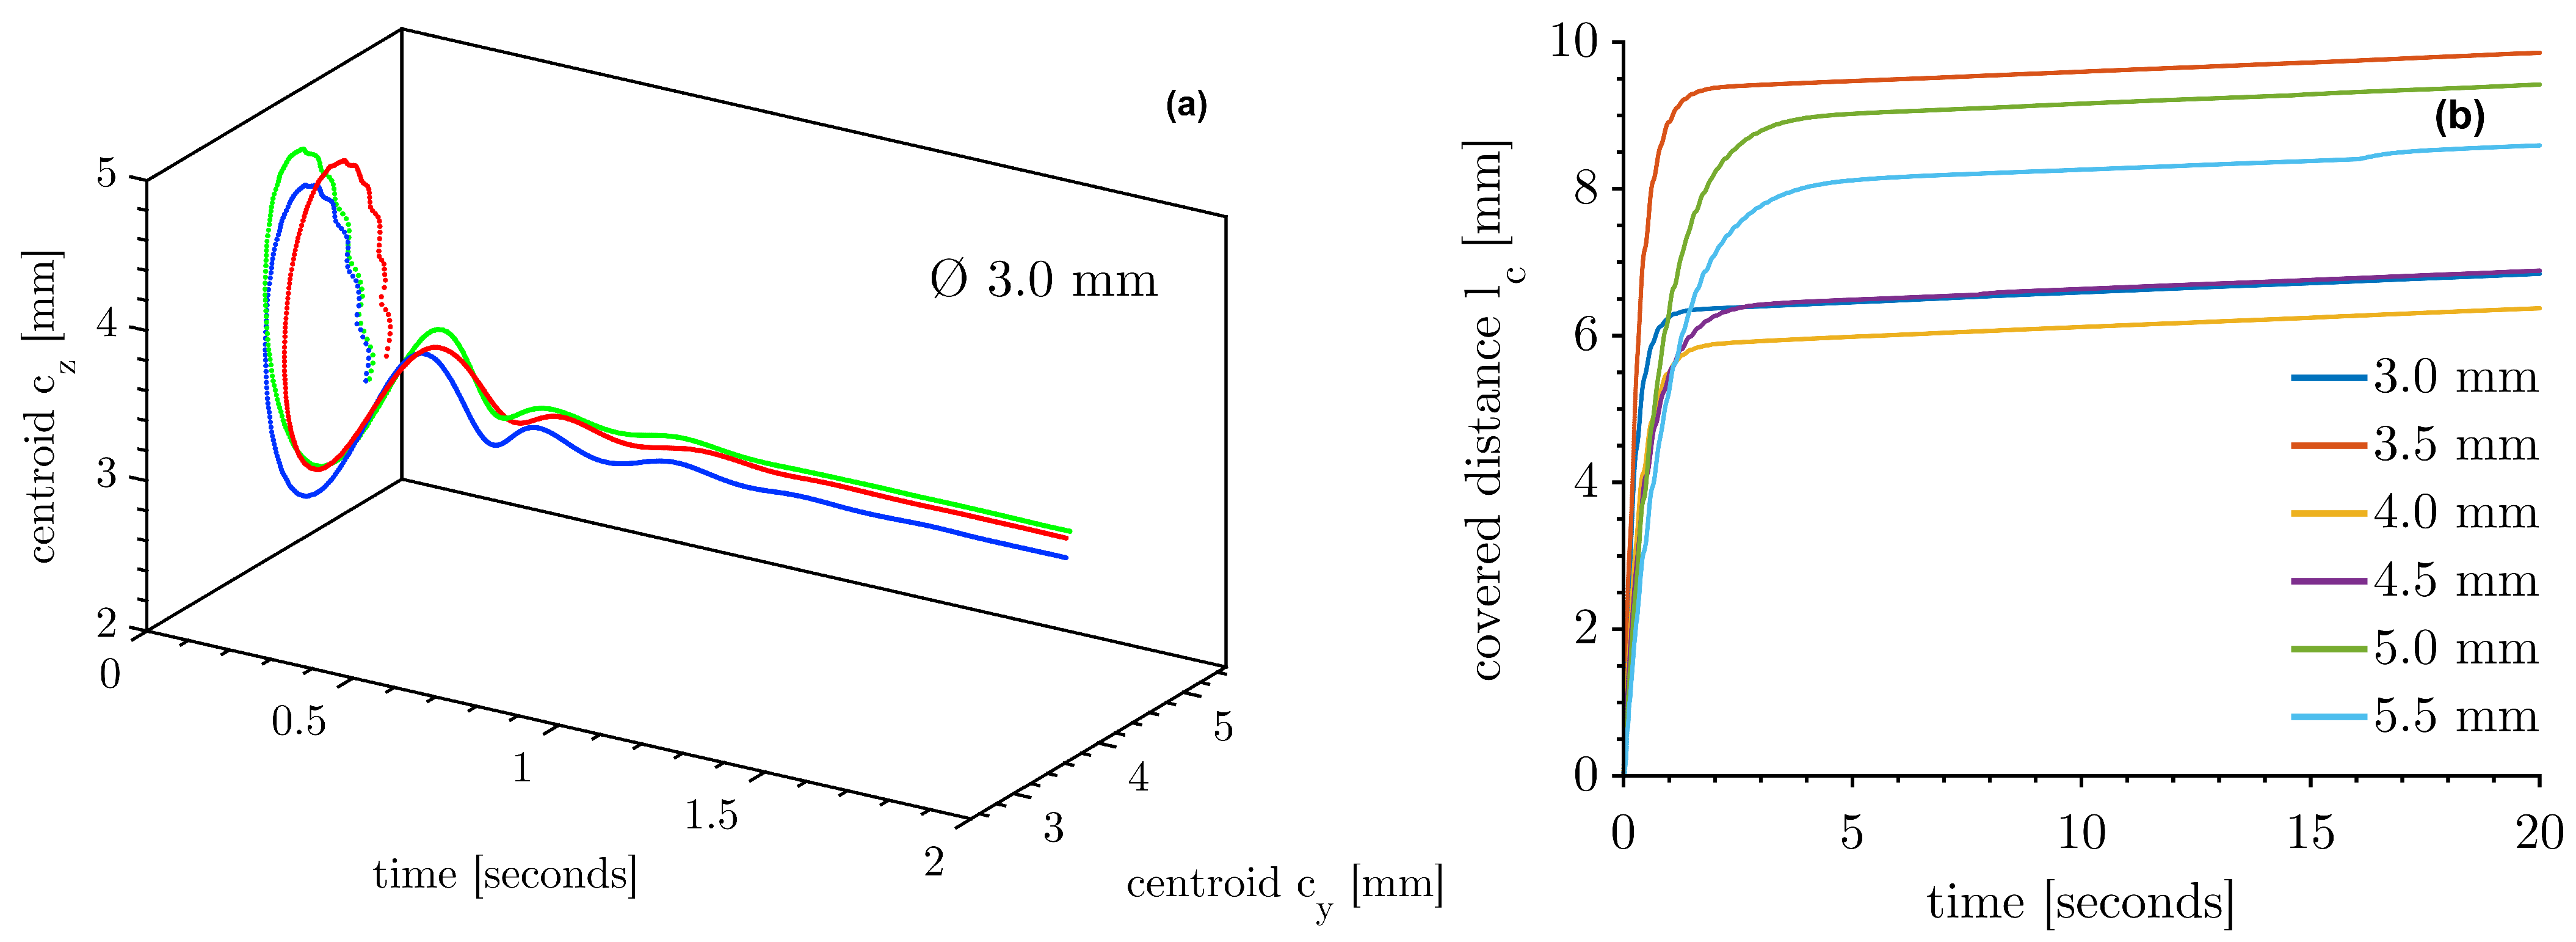
Figure 3a shows representative two-dimensional paths of three Ø 3 mm drops from the point of detaching and the following two seconds approaching the resting position. The first movement upwards is caused by the buoyancy of the drop which then deflects toward the pressure anti-node and orbits around it until the momentum decays. Drops of different diameters behave similarly. This behaviour is analysed in more detail below.
Figure 3b shows the trajectories of drops with differing initial diameters. The initial covered distance does not correlate with the diameter and is in the range between 5 and 10 mm. Movement in the x-direction is not captured with this setup; the actual covered distance is certainly higher. A three-dimensional movement trajectory would lead to a smaller variation in the initial range of the covered distance. After the decay of the initial motion, the curves of the drops in
Figure 3b are parallel and have a slope of ~27 µm/s or ~1.62 mm/min, respectively. This slope can be understood as the velocity of the centroid in the yz-direction and is the idle velocity
(Equation (
7)). The idle velocity characterises the measurement and how the standing waves affect the vibrations of the drop. It is a simple and reliable indicator of a successful and usable measurement. After injection, a jump in the average idle velocity can indicate a deviation in levitation (e.g.,
Figure 3b, Ø 5.5 mm drop at 16.5 s). Considering the x-direction, we estimate that the three-dimensional movement is below 40 µm/s and 2.4 mm/min, respectively. The injection behaviour measurements are made at a frame rate of 500 Hz, so the signal noise of the centroid increases the idle velocity compared to the 10 Hz measurements below.
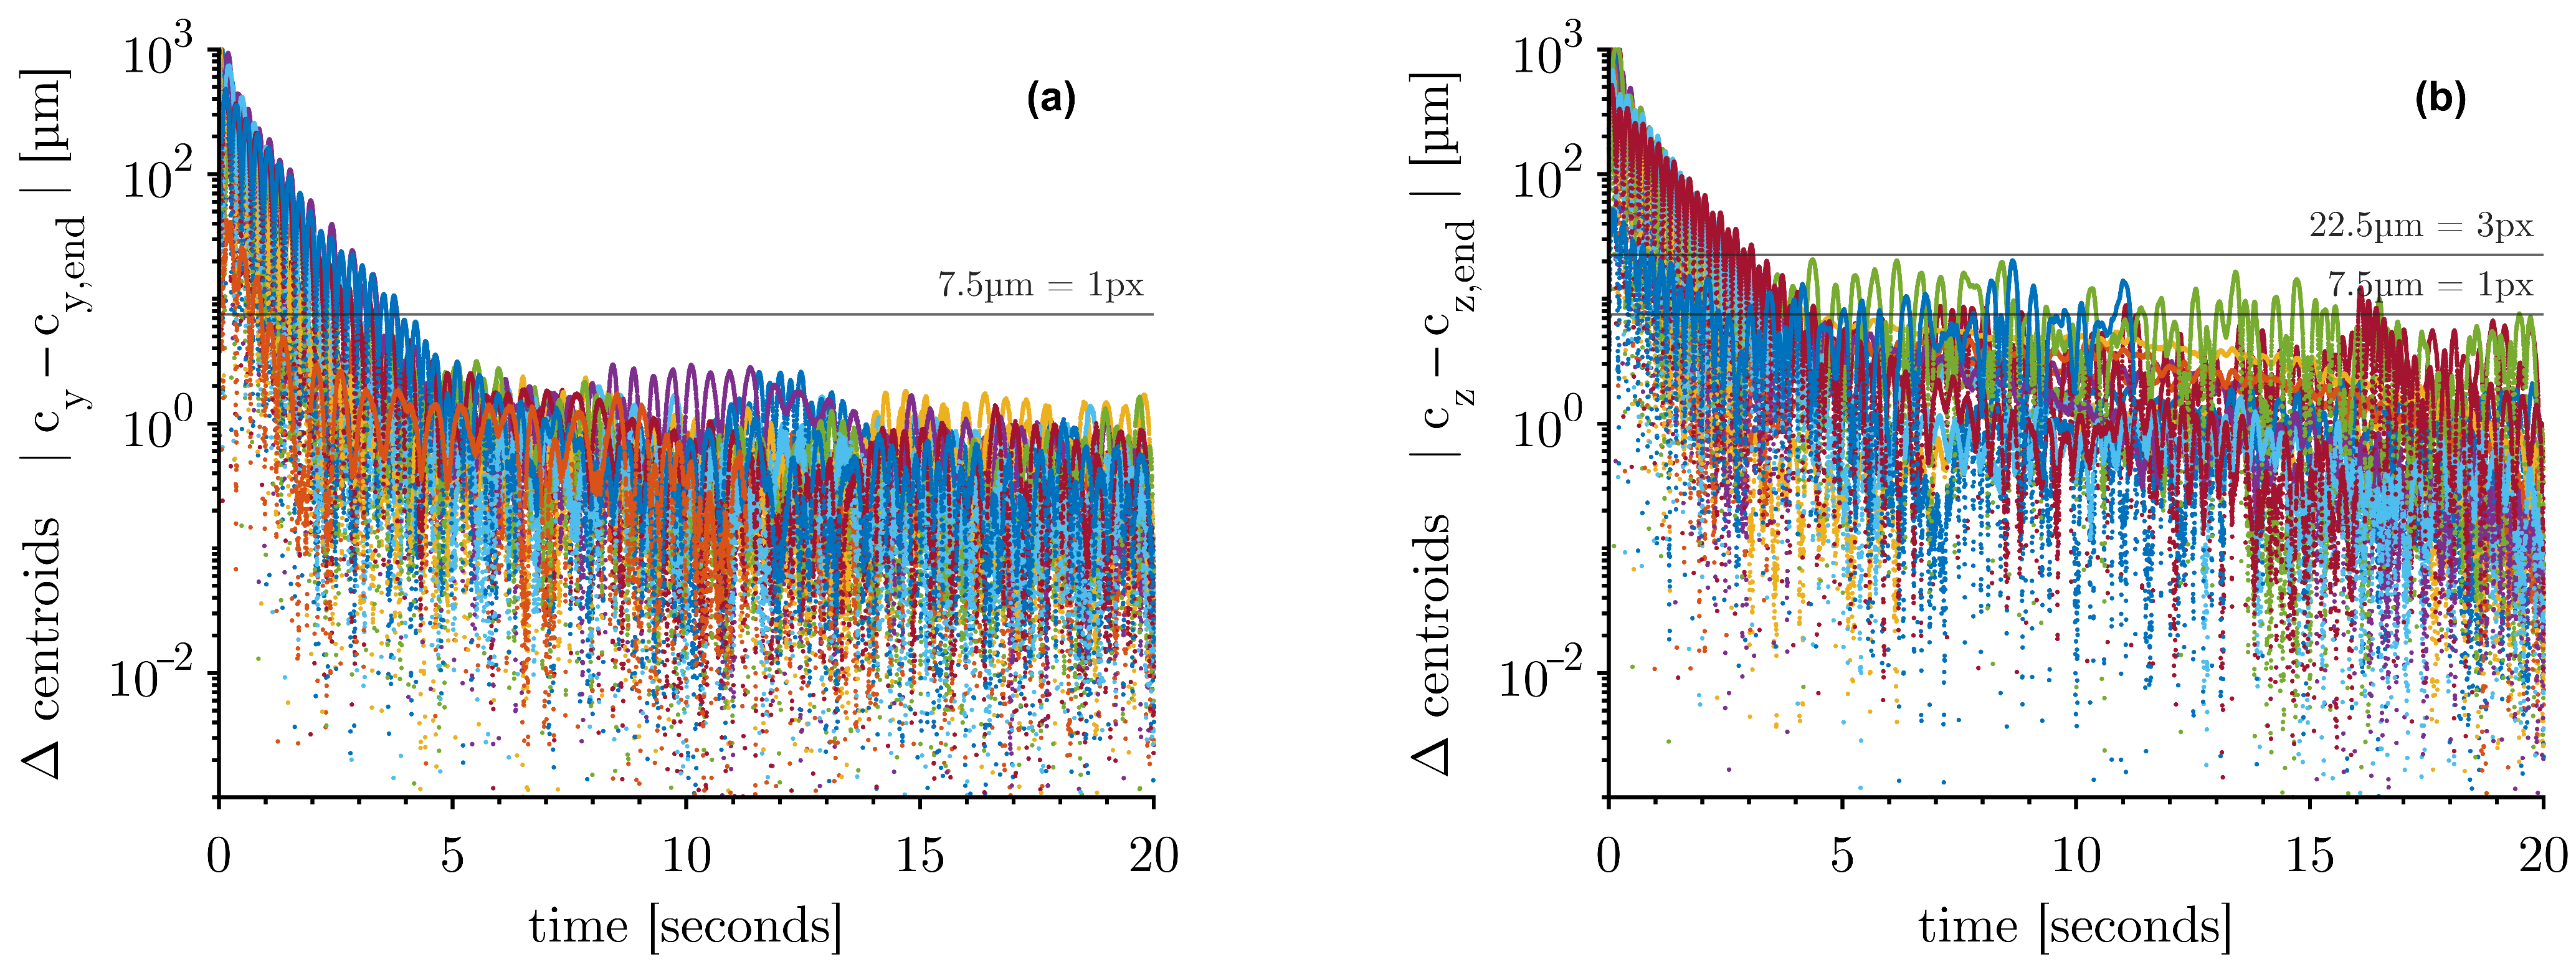
A more detailed insight into the decaying behaviour is given in
Figure 4. The trajectories of the distance between the actual centroid and the centroid at 20 s of the horizontal and the vertical axis of all measurements with different diameters are shown.
After four seconds, the horizontal deflection (
Figure 4a) falls below the edge length of one pixel of the HSC image (7.5 µm). For the vertical deflection, the initial motions decay more slowly (
Figure 4b). Most drops decay within the first three seconds below 7.5 µm. A minority of the drops need a longer decay time, some taking up to 16 s. The drops are, in conclusion, about to be almost stationary in position after 16 s at the latest. The drops are more stable horizontally than in the vertical direction.
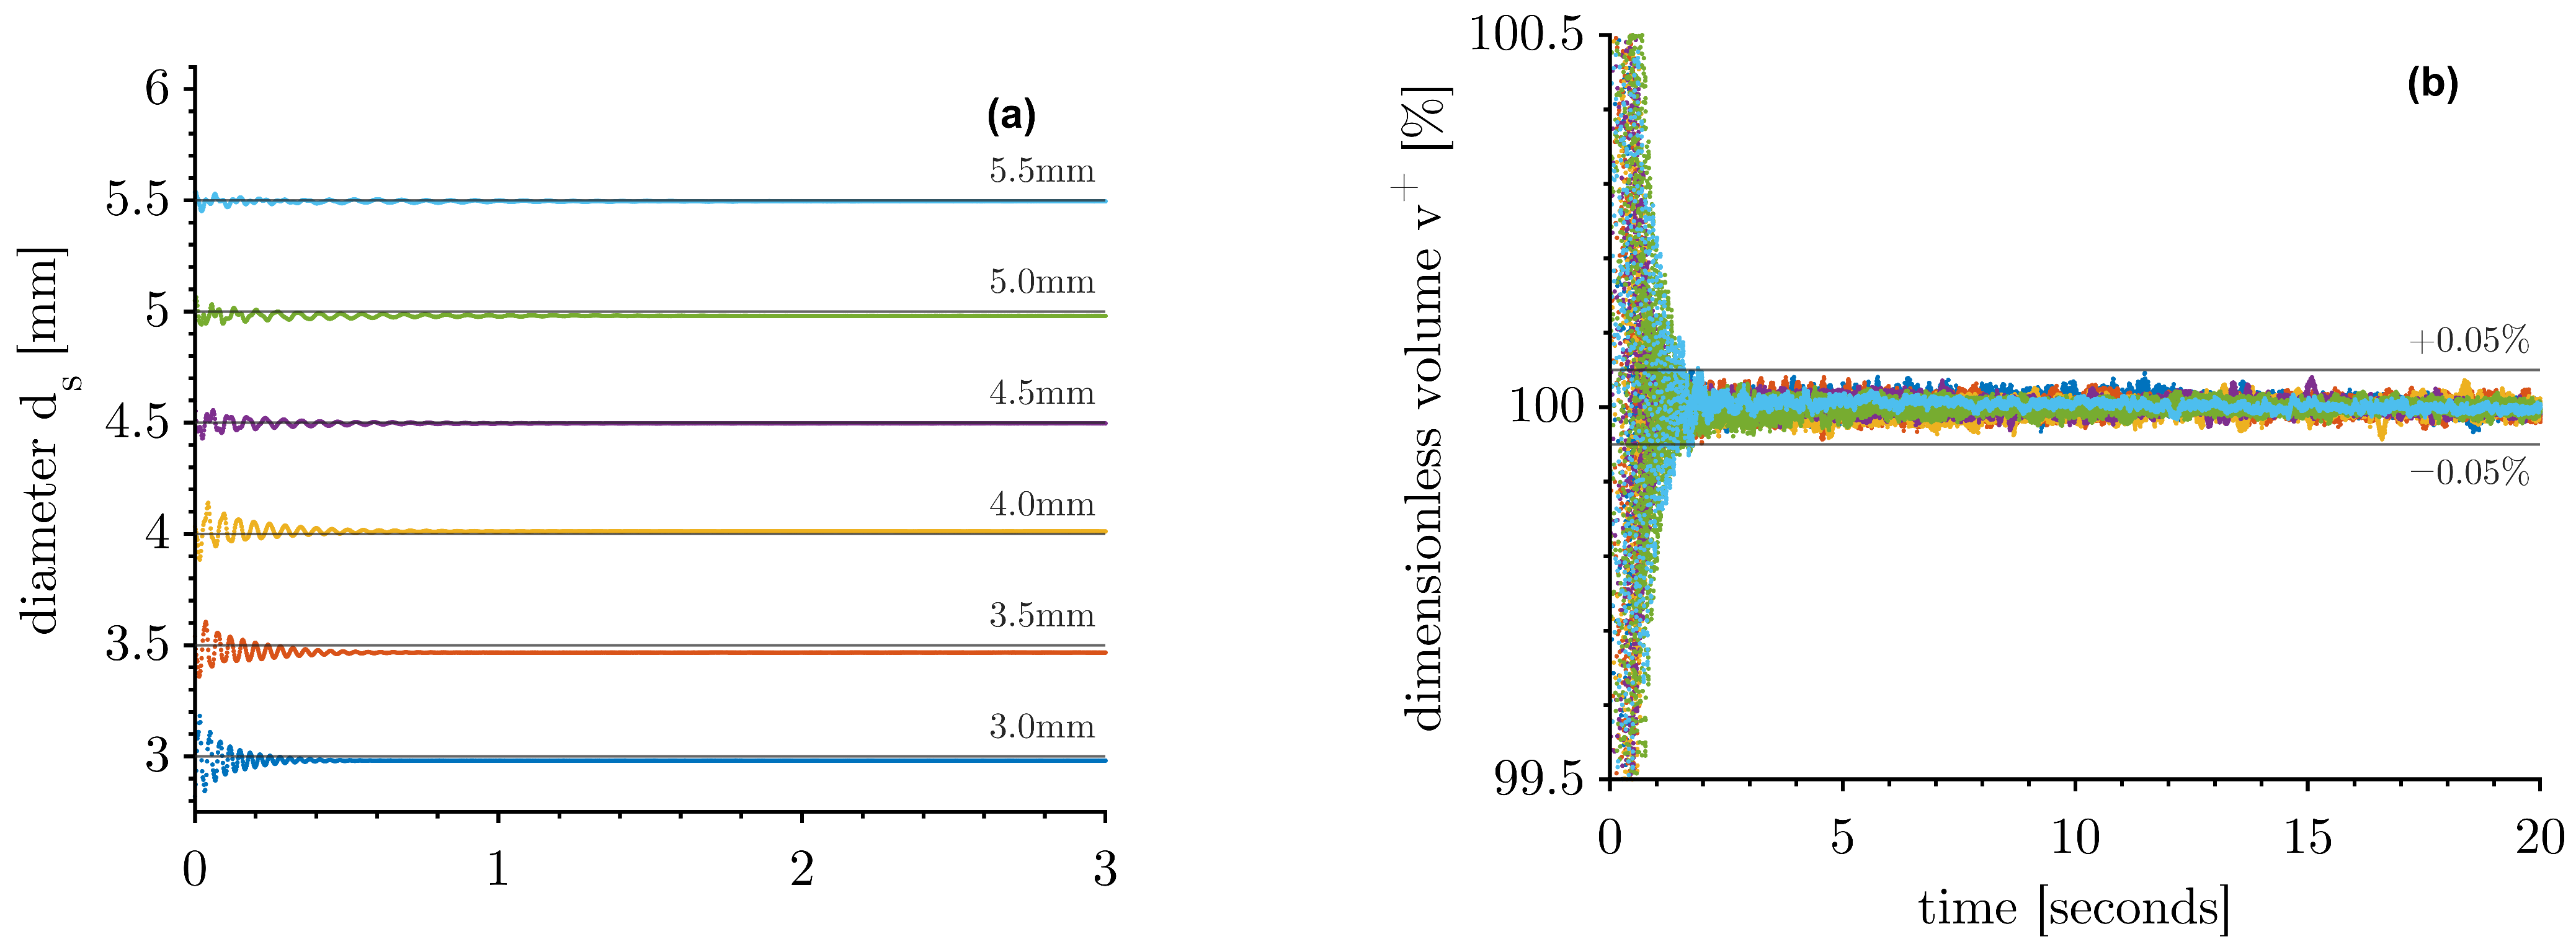
The acquired volume of these initially moving and deformed drops is shown in
Figure 5a, which illustrates one representative drop of each diameter. When the oscillation in shape decays, the calculated volume is constant and results in the actual volume of the drop. At this point, the drops show a circularity
C of more than 0.98, and the drops can be assumed to be rotationally symmetric about the z-axis. With increasing drop size, the time of oscillation lasts longer, and this behaviour can also be seen in
Figure 3b by reaching the constant slope more slowly. The variation of the dimensionless volume
(recorded volume/recorded end volume) is less than ±0.05% (
Figure 5b) two seconds after injection.
In conclusion, the decay of the shape is faster than the decay of the position. The acquired drop volume is, therefore, reliable after two seconds. A total of 20 s after the detachment from the capillary, the movement is stable. In addition, the transient circularity C of an acquired drop can be used to verify whether the drop volume is reliable. To acquire volumes of asymmetrical shape caused by dynamic drop movements, at least one additional optical axis is necessary. This additional axis would also allow the measurement of the three-dimensional idle velocity of a drop.
Short-term behaviour (1–2 min): One minute after the drop is injected, the initial movement of the drop has dissipated. For this time interval, about 600 images were analysed for drops of different initial diameters. The characteristic values for one representative drop of every diameter are summarised in
Table 4.
The optical volume acquisition has a signal noise of less than 0.5‰ in the range of Ø 3–5.5 mm drops, almost independent of the diameter. The signal noise in the volume of a Ø 5 mm drop is 0.27‰ and the raw optical signal noise of a Ø 5.00 mm optical target is 0.28‰ (
Table 3). The signal noise in volume is, therefore, due to the optical acquisition and does not originate from any induced vibrations. The absolute deviation in the injected volume of the drops is caused by the random uncertainty of the injection system. By withdrawing the injection capillary, some of the dispersed phase may be left on the capillary, lowering the injected volume. The interfacial tension also affects the deviation of the injection of the target volume. Since this uncertainty is quantifiable, it has no negative effect on the measurements. The acquired deflection length
is in the sub-pixel range; the drops are overall not moving or vibrating significantly. For all drops, the two-dimensional idle velocity at a frame rate of 10 Hz is less than 0.55 mm/min. In addition, taking into account the undetected movement in the x-direction, the three-dimensional idle velocity caused by the occurring vibrations can be estimated to be less than 0.8 mm/min.
In terms of shape, the drops are of a spherical nature with a minimum circularity
C of 0.99 (
Table 4). The larger the diameter, the more it deviates from a perfect sphere. The cubic cuvette and the transducer are not exactly concentric; therefore, there is a small negative offset in the tilt
.
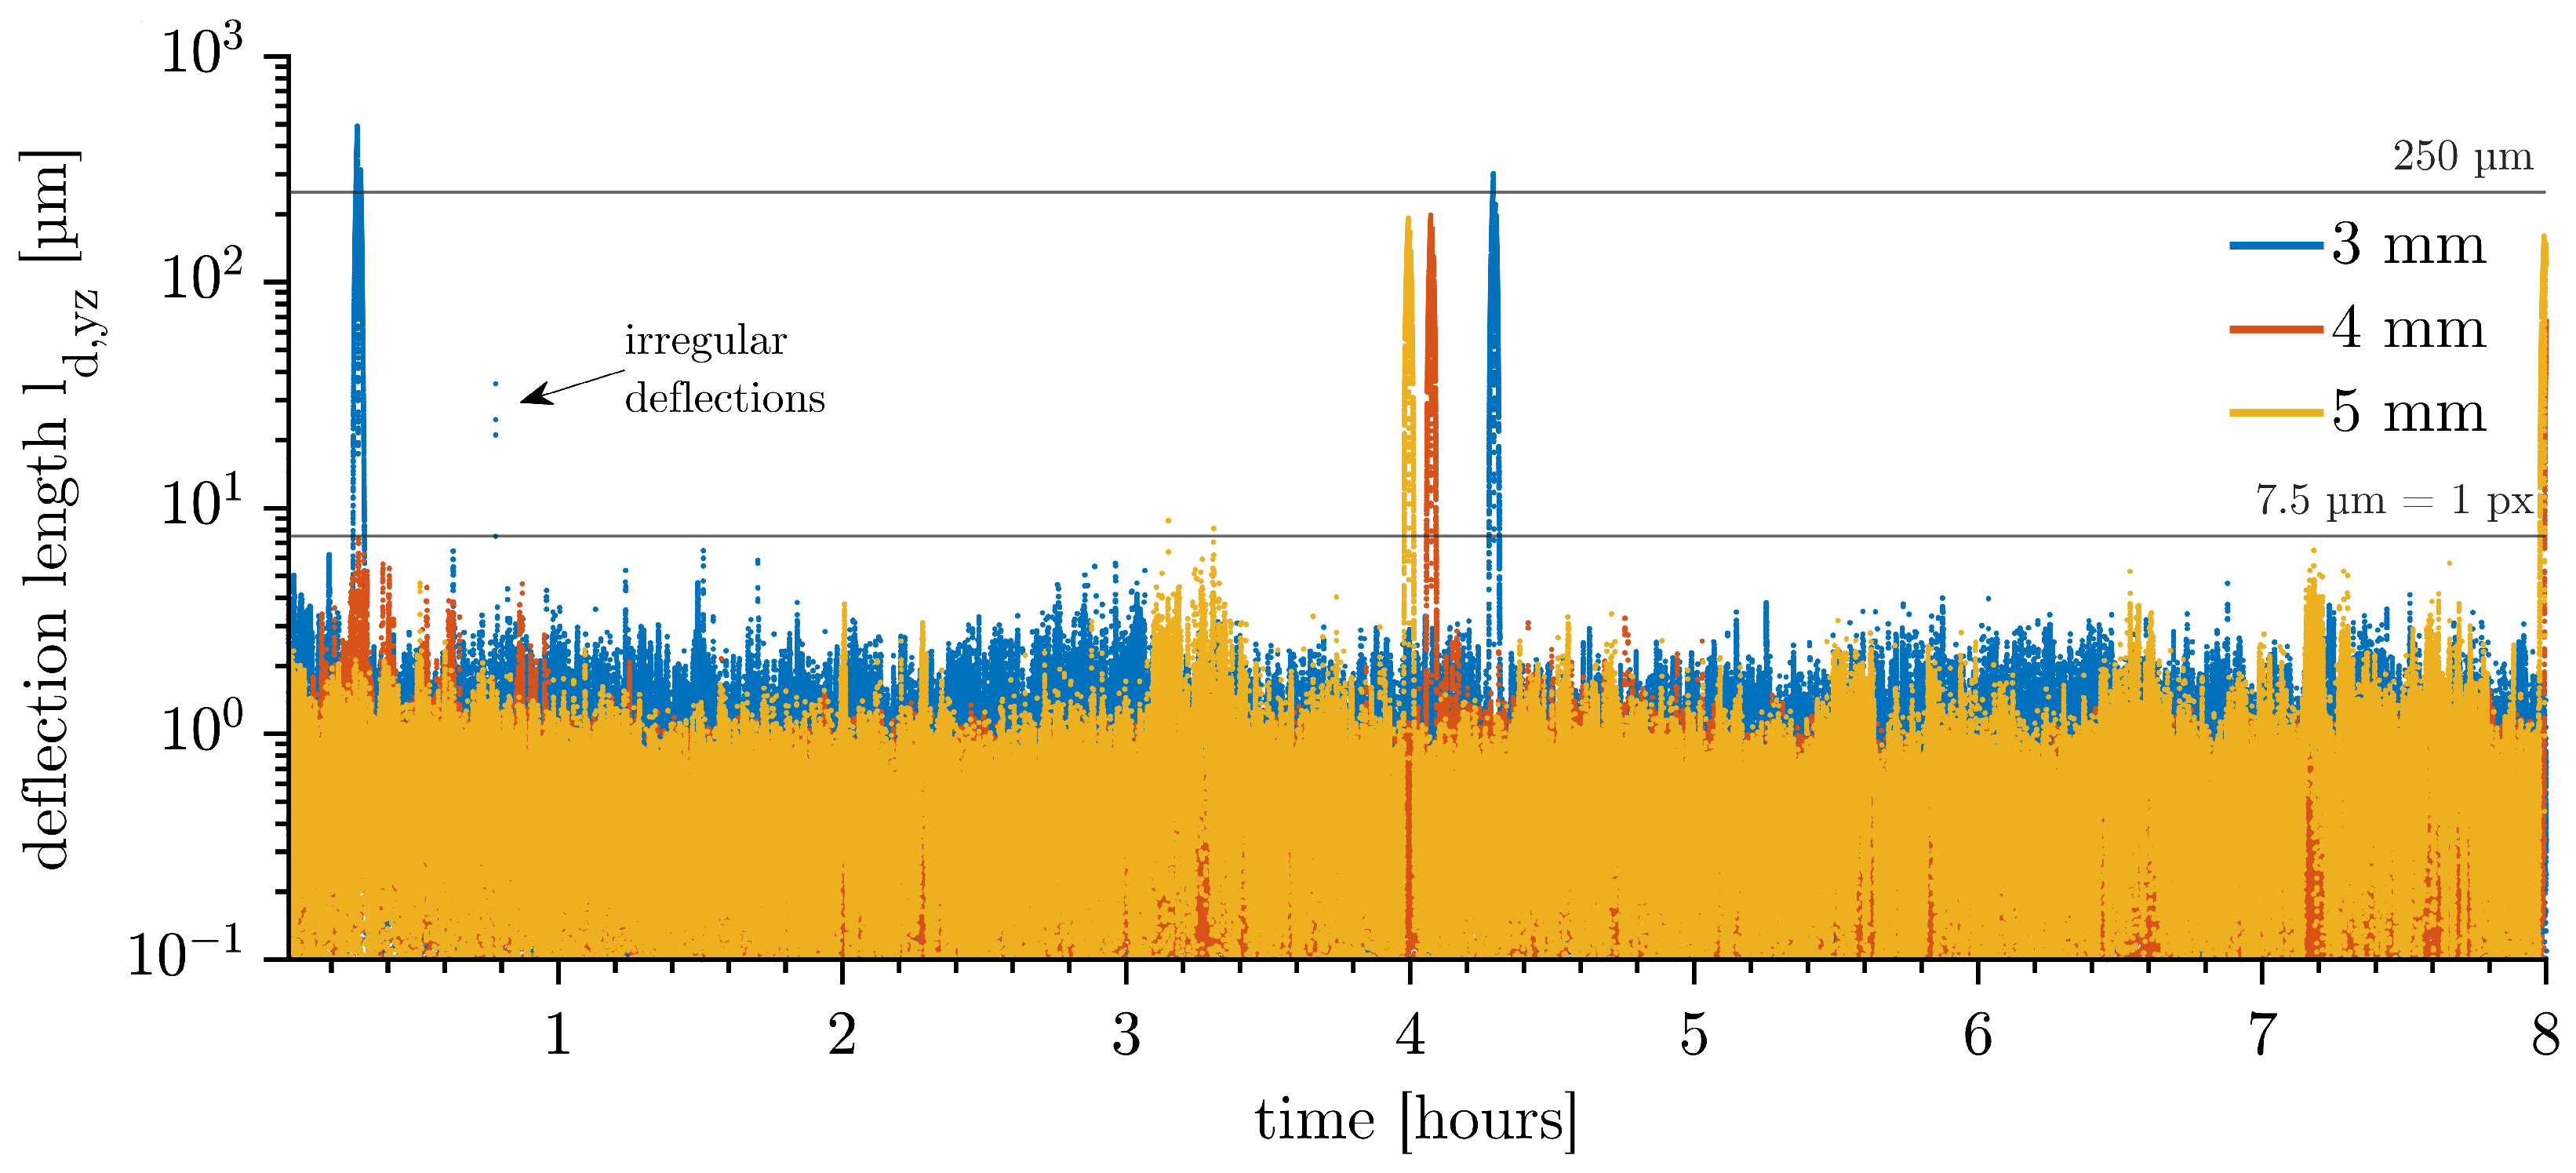
Long-term behaviour (1 min–8 h):
Figure 6 shows the deflection length
of a Ø 3, 4, and 5 mm drop. The irregular peaks at four-hour intervals are caused by the deliberate slow relevelling of the water in the cuvette. A changing water level affects the position of the drop mainly in the z-direction. Apart from these outliers, the deflections of the drops are almost all below 7.5 µm and, therefore, extraordinarily stable in position, regardless of the drop diameter. A time-lapse of a long-term measurement of a Ø 3 mm drop is shown in
Video S2 of the Supplementary Material. External vibrations cannot be completely ruled out, as can be seen by three dots above 7.5 µm in
Figure 6 of the Ø 3 mm drop at 0.8 h.
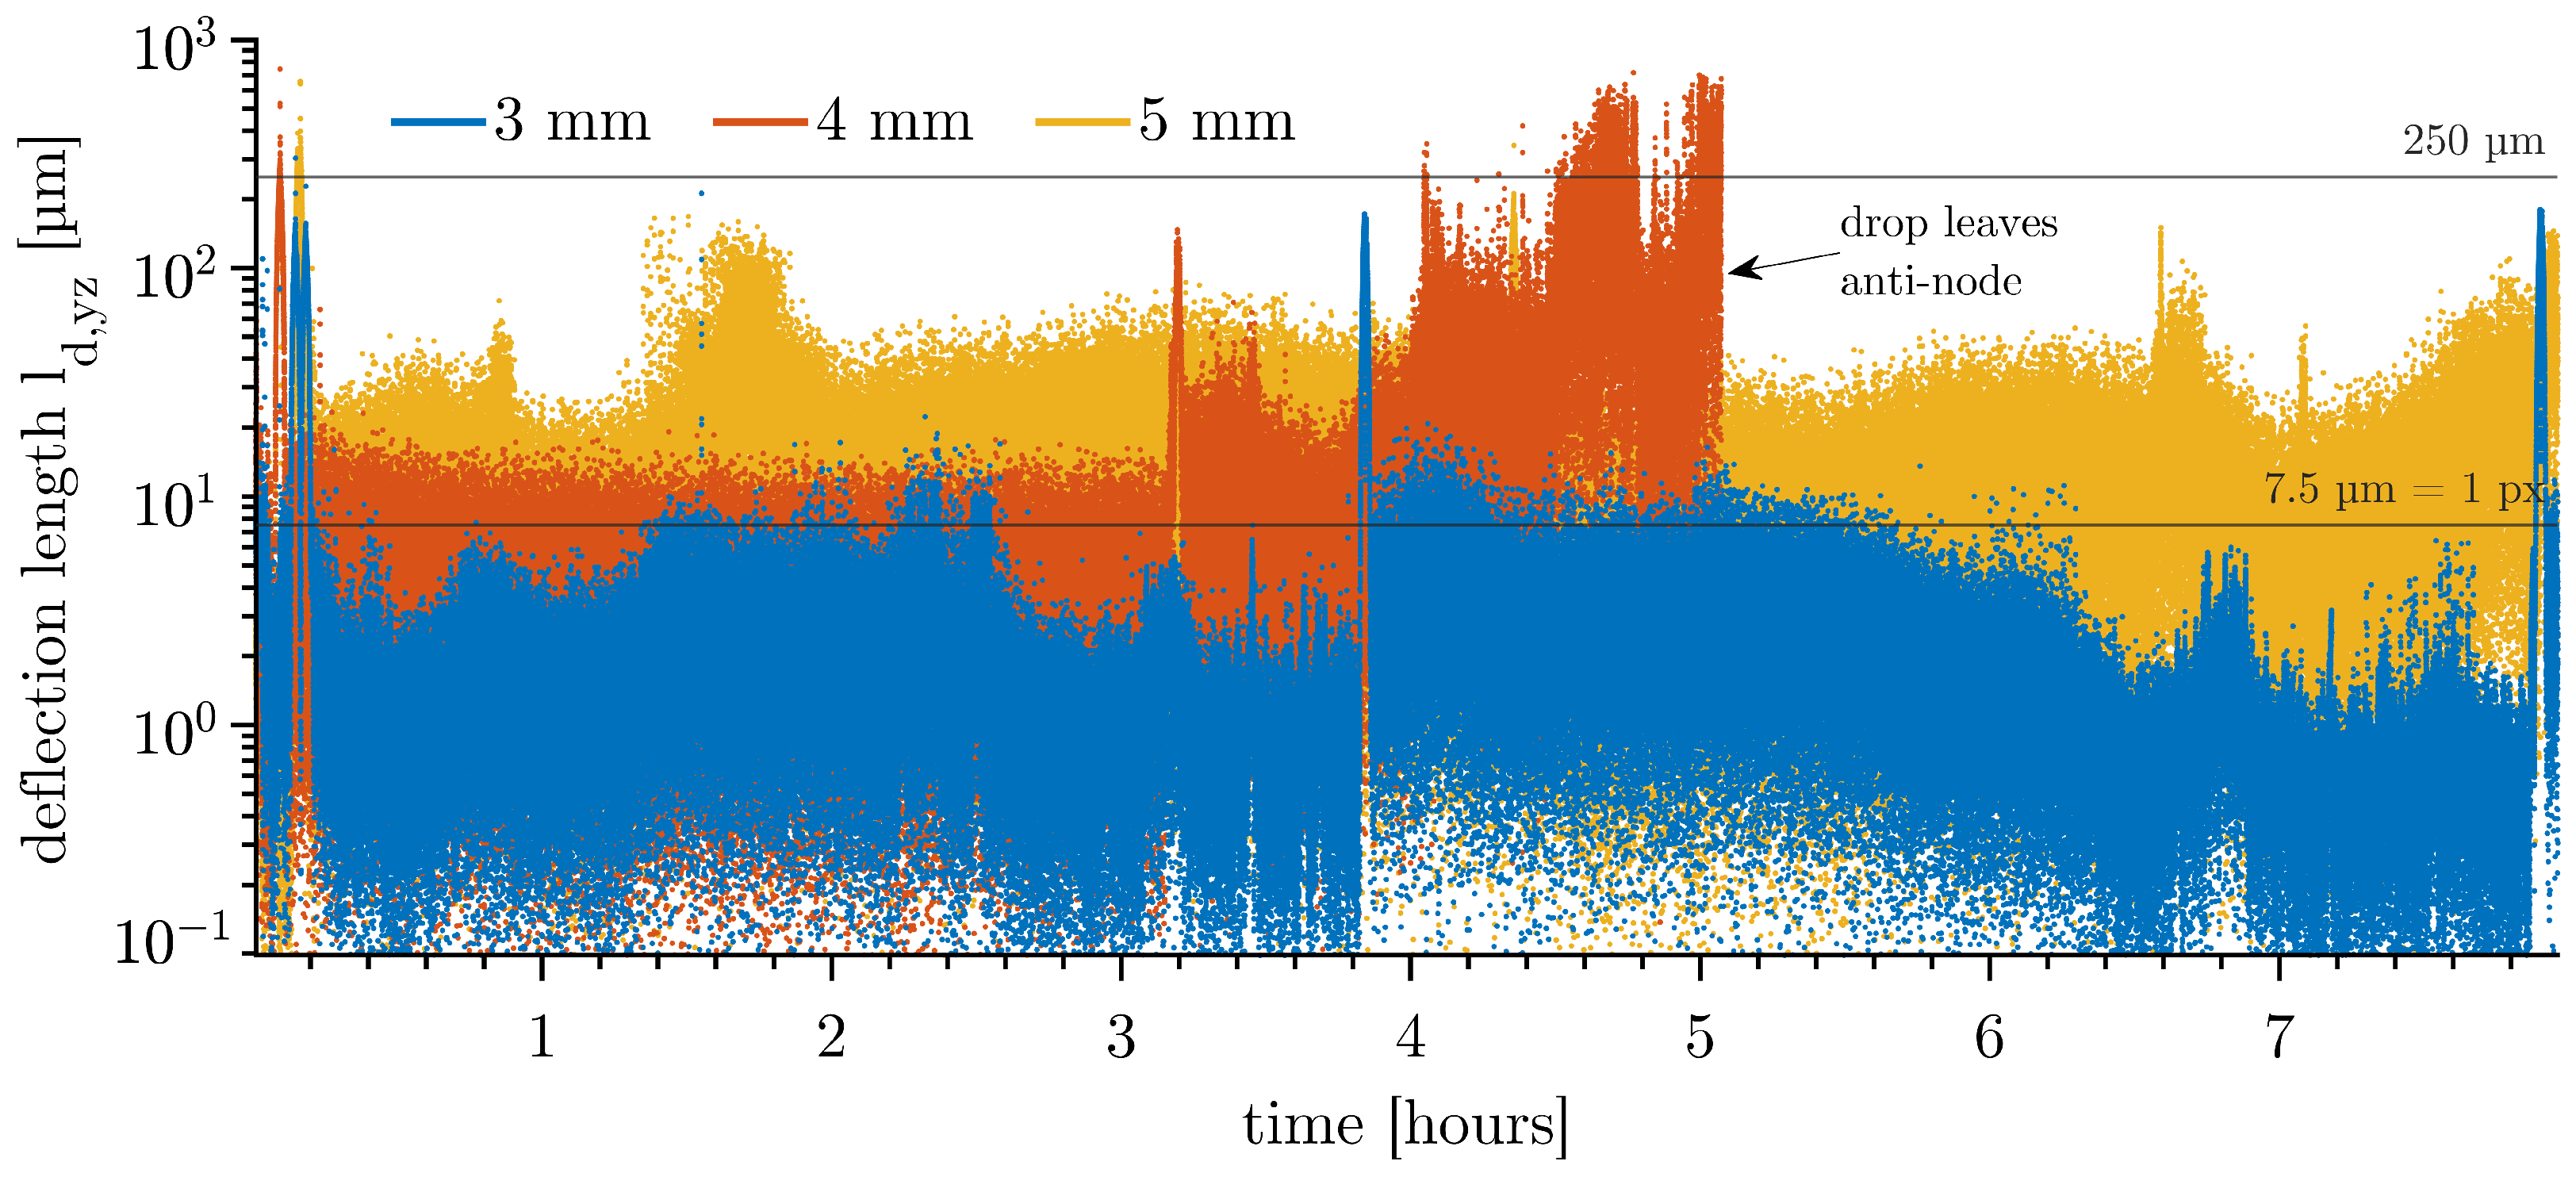
The drops vibrate strongly when the dispersed and continuous phases are initially saturated with air. This is shown in
Figure 7 for three example drops of different diameters. The trajectories do not show a stable behaviour. Overall, the measurements are not reproducible. The ultrasonic field degasses the phases, resulting in many small gas bubbles on the walls of the cuvette. These compressible cavities absorb the ultrasonic waves and strongly influence the resonant system. This can lead to a failure of the drop levitation, as seen for the Ø 4 mm drop leaving the anti-node at 5.1 h with no further signal acquired.
The idle velocities from 1 minute to 8 h, including the deflections caused by relevelling the water, are given in
Table 5 for the previously shown measurements of degassed (
Figure 6) and non-degassed (
Figure 7) systems.
The measurements show that the standing waves do not induce significant drop vibrations in systems that have been degassed. It can be estimated that up to 10% of the idle velocity of the degassed systems is caused by the signal noise of the optical acquisition system (cf.
Table 3, Ø 5 mm). The idle velocities of the long-term measurements are generally lower than the short-term measurements. We believe that the continuous exposure to the acoustic field degasses the system even more. This results in fewer vibrations over time and also prevents the dissolution of ambient air components into the continuous phase in the open cuvette. To achieve a high level of vibrations and idle velocity, the dispersed and continuous phase should not be degassed or can be additionally gassed beforehand. The idle velocities of non-degassed systems are highly variable and, therefore, not reproducible. In this case, long-term measurements are difficult. Bubbles are the result of degassing and have a very strong negative effect on the resonance system and thus on the acoustic trapping of the drops.
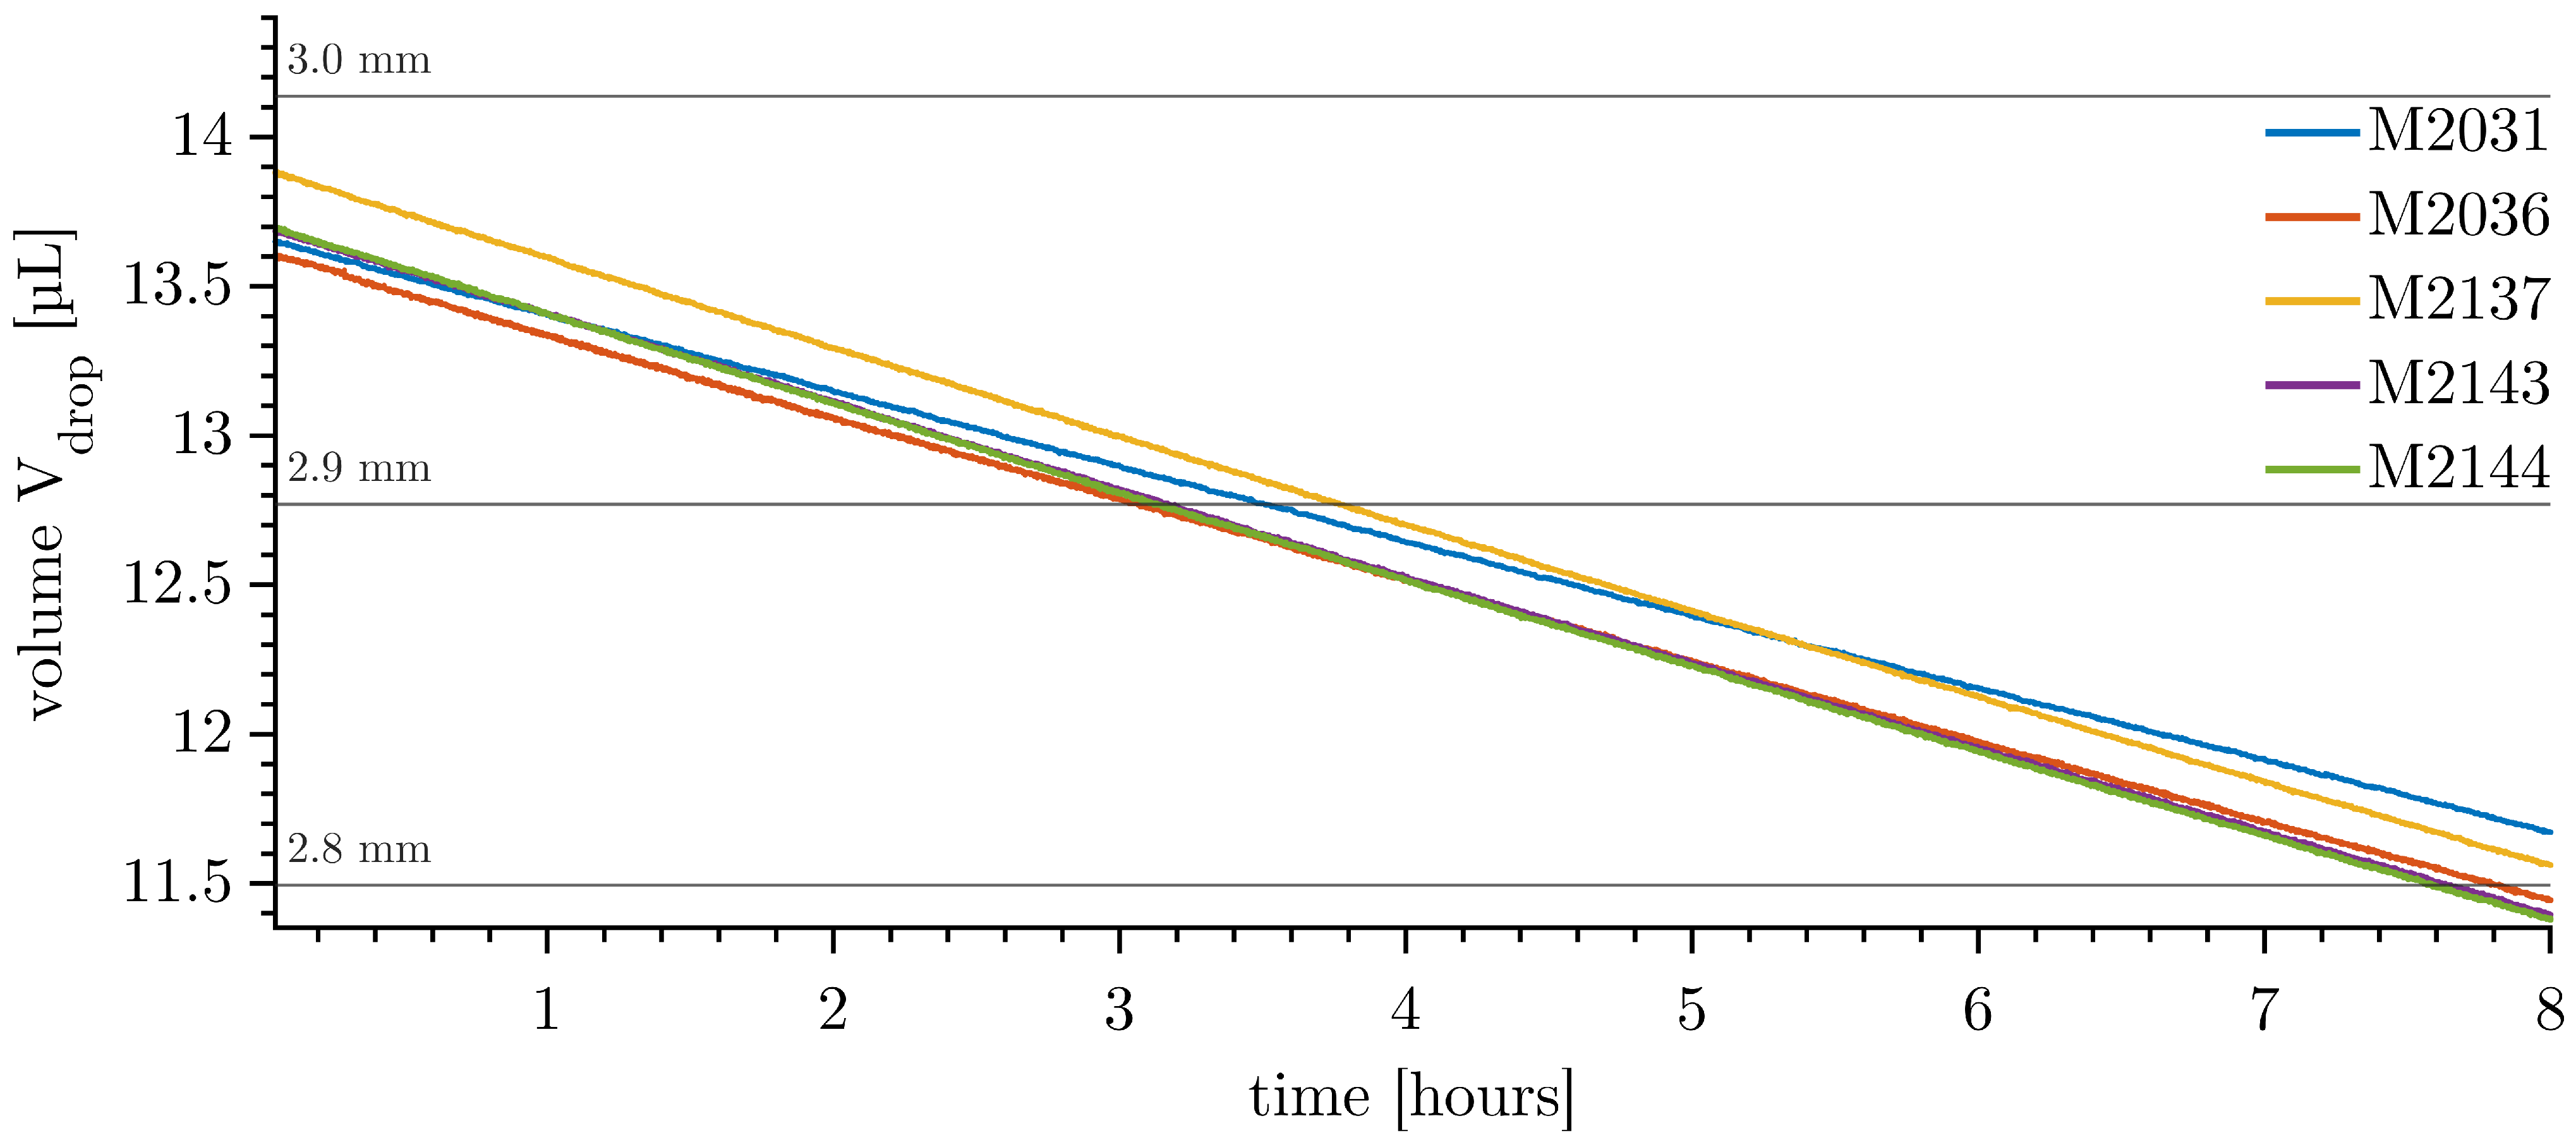
Drops of small diameter show lower reproducibility of mass transfer rates, making them the preferred choice for further investigations.
Figure 8 shows the reproducibility of the dissolution of five Ø 3 mm drops in degassed ultrapure water.
The initial volume has a maximum offset of 3.5% compared to a perfect Ø 3 mm sphere, due to the random injection behaviour mentioned above. The mass transfer rates, here measured as the volume transfer rate, given as the slope of the volume trajectory, range from 0.249 to 0.293 µL/h, as shown in
Table 6. The idle velocity of the measurement can be an indicator of enhanced mass transfer. Measurement M2031 has by far the smallest mass transfer rate and a small corresponding idle velocity. In addition, the temperature and, therefore, the aqueous solubility of toluene in water is reduced.
The measurements show good reproducibility if only measurements M2137, M2143, and M2144 are considered. In this case, the temperatures and the idle velocities are within a narrow range. The effect of temperature on the solubilities and, therefore, on mass transfer cannot be eliminated by tempering the system presented. An isolated tempering chamber would be required. However, the temperature is known and the effect can be quantified.
4.3. Flow Field in the Vicinity of the Drop
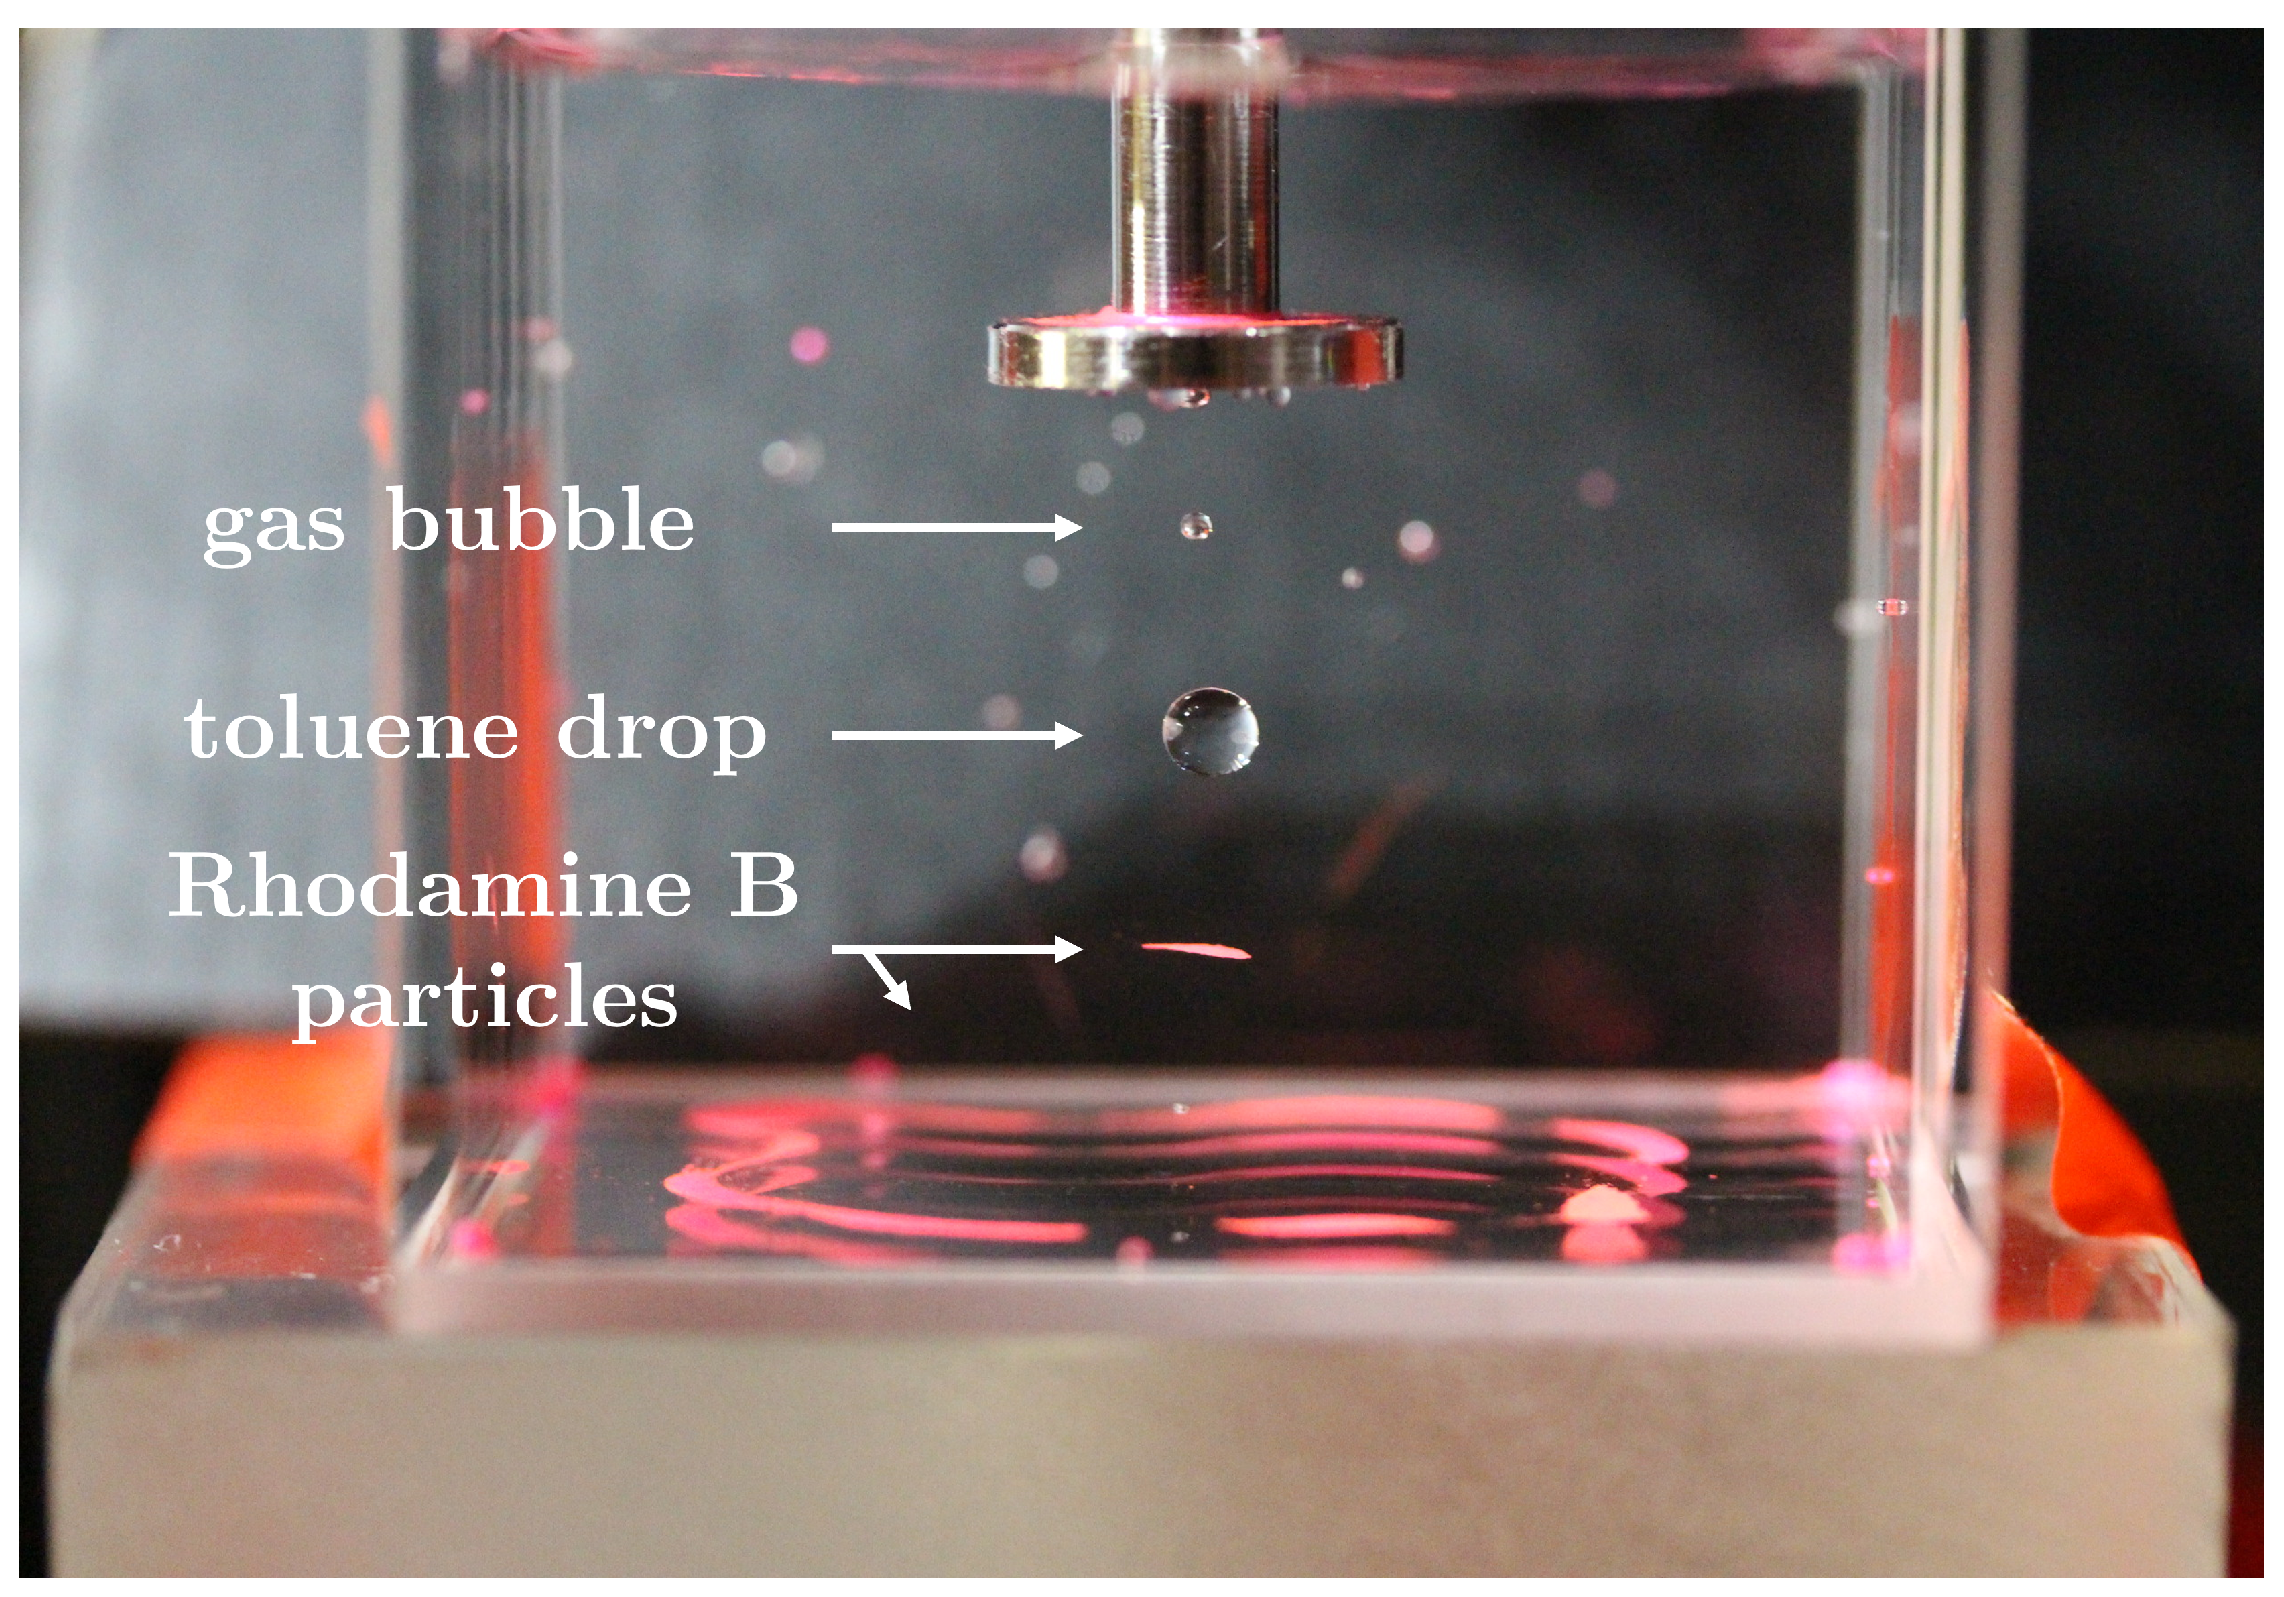
Particle Image Velocimetry (PIV): The principle of PIV is to seed a fluid with sufficient small tracer particles to visualise flow fields by tracking their paths. The main idea is that the particles have negligible sedimentation velocities and, therefore, fully follow an induced flow field. The experiments were conducted with non-degassed water accompanied by acoustic streaming, with the result shown in
Figure 9.
The acoustic field collects and levitates the particles in the node, forming a circular plane. In a second node, a gas bubble was formed by releasing gas from the continuous phase caused by the ultrasonic field. Both Rhodamine B particles and gas bubbles have a positive acoustic contrast factor and are attracted to the nodes in the system. The pressure field created a symmetrical particle formation at the bottom of the cuvette.
The seeded particles are not only affected by acoustic streaming but also by the standing waves themselves. Therefore, PIV cannot be used to measure the flow field in the continuous phase in this levitation system and the rainbow schlieren deflectometry technique will be used to partly visualise flow patterns in the continuous phase.
Rainbow Schlieren Deflectometry (RSD): The occurring concentration gradients in the continuous phase caused by mass transfer are visualised by RSD measurements and are used for indirect flow field measurements. A prevailing flow field caused by acoustic streaming in the continuous phase would affect and deflect the uniform one-dimensional concentration streak. Two vertical directions of mass transfer, up and down, are investigated. In addition to measuring the flow field, this technique can also be used to determine the dispersion of the inhomogeneous dissolved substance.
Butyl acetate with ,
slightly soluble:
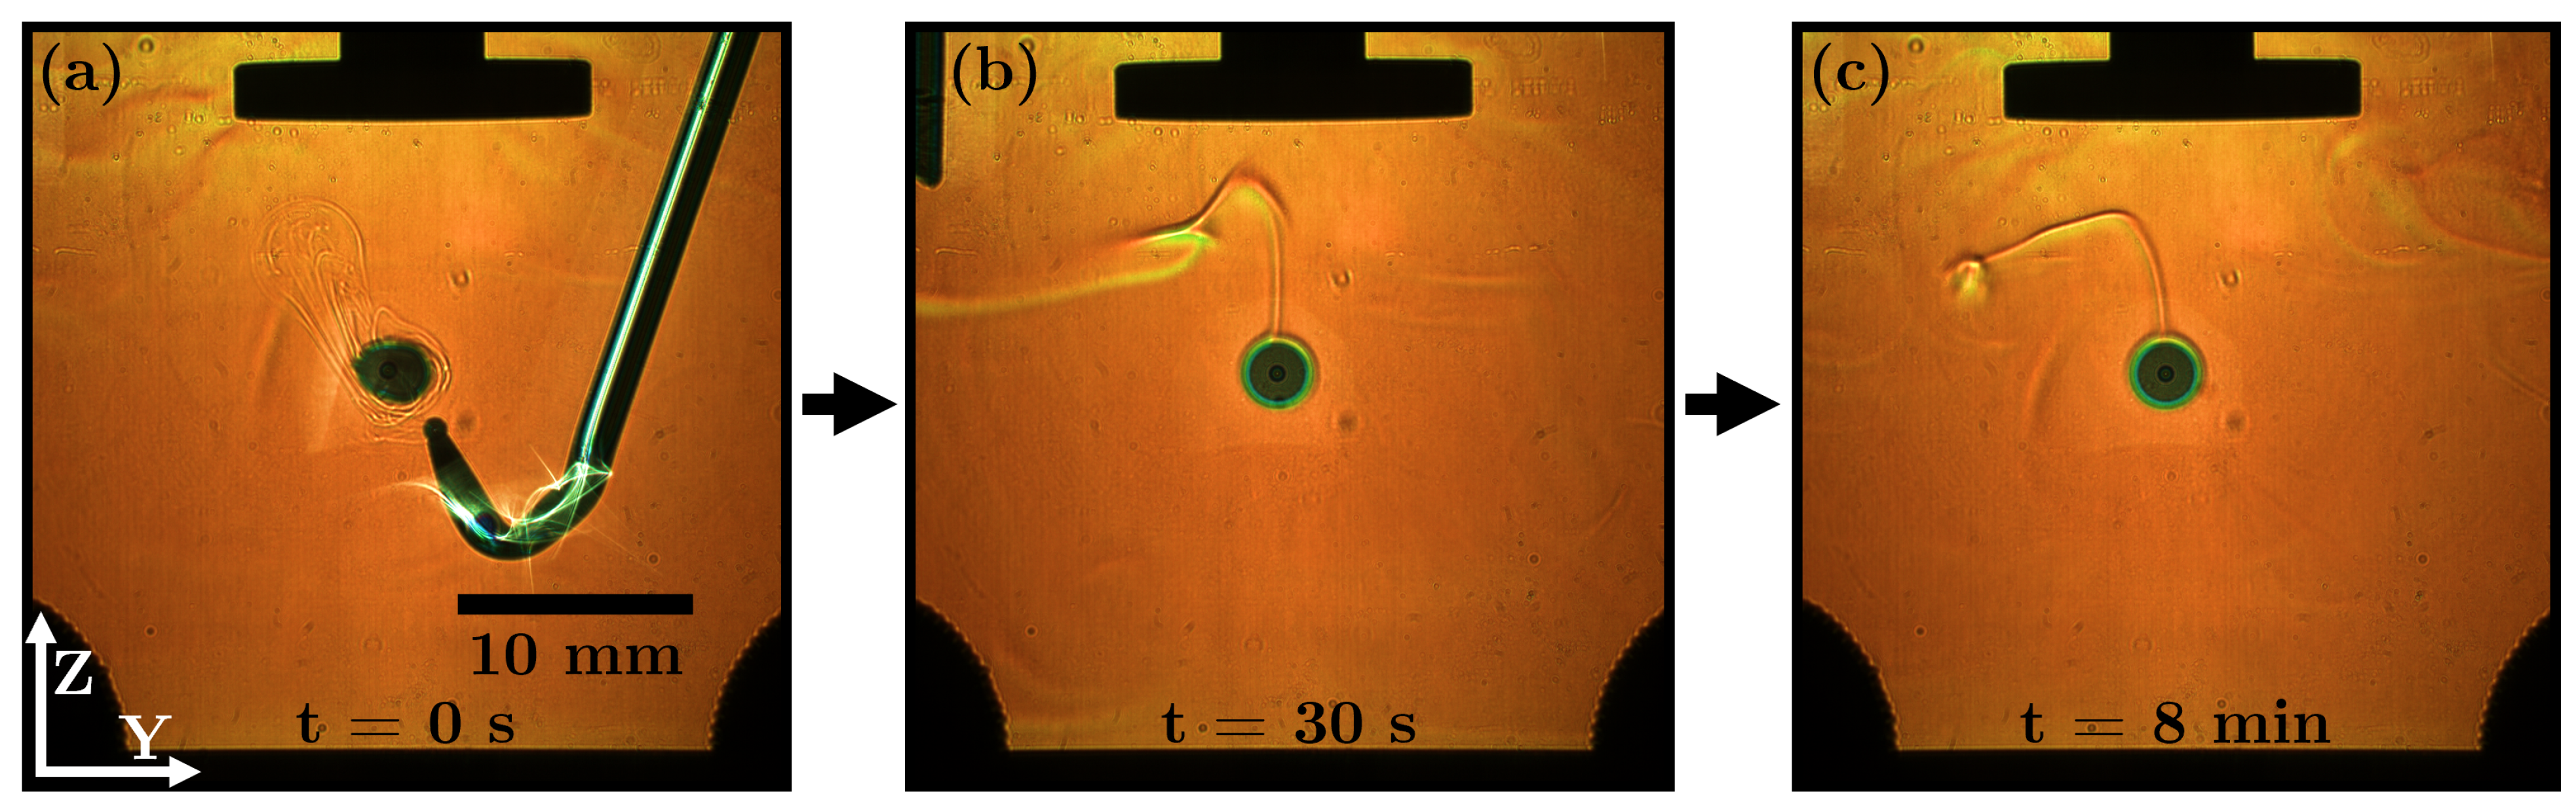
Figure 10a shows the injection of a butyl acetate drop; initially, a weak and disturbed concentration field is visible. Pulling out the capillary creates a turbulent flow field in the continuous phase. After about 30 s, the turbulence of the concentration field disappears (
Figure 10b). From this point on, the concentration streak in the vicinity of the drop has a stationary shape, and the streak points upwards and tilts in the −y-direction. It can be assumed that no flow field is induced by acoustic streaming in close vicinity above the drop. The standing waves affect the dissolved butyl acetate and prevent it from reaching the tip of the ultrasonic transducer. It is repelled by the nodal plane halfway between the anti-node and the tip of the ultrasonic transducer.
1-butanol with , sparingly soluble:
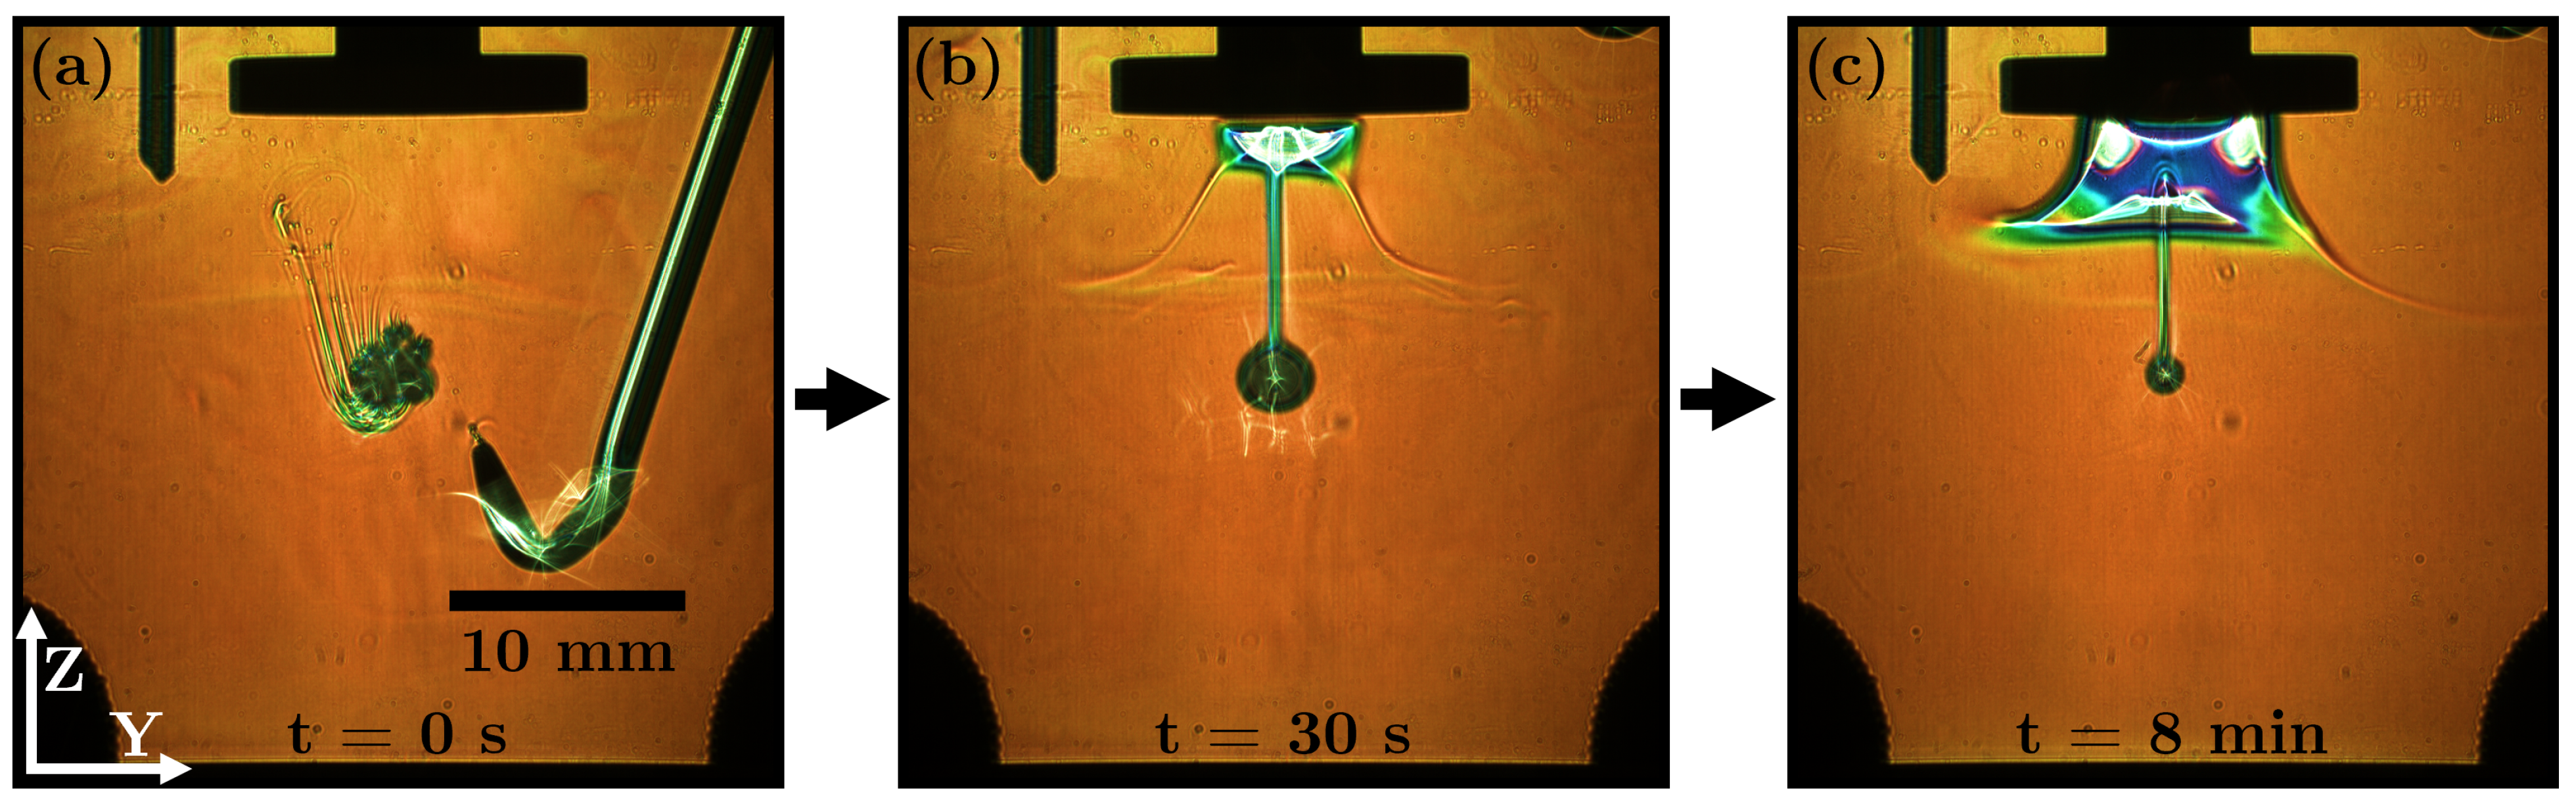
Figure 11a shows the injection of a 1-butanol drop; initially a strong and rapidly forming concentration field is visible. The complete measurement is shown in
Video S3 of the Supplementary Material. The turbulence caused by the withdrawal of the capillary has a slight and brief impact on the concentration streak. The aqueous solubility results in a rapidly dissolving drop with high mass transfer rates by observing the diameter of the drop (
Figure 11b,c). The transferred and dissolved 1-butanol is trapped below the centre of the ultrasonic horn. The dissolved 1-butanol cannot pass through the volume around the edge of the plate tip (
Figure 11c). In this region, the acoustic particle velocity is at its maximum and keeps 1-butanol away. It can be clearly seen that even dissolved substances can be strongly affected by standing waves.
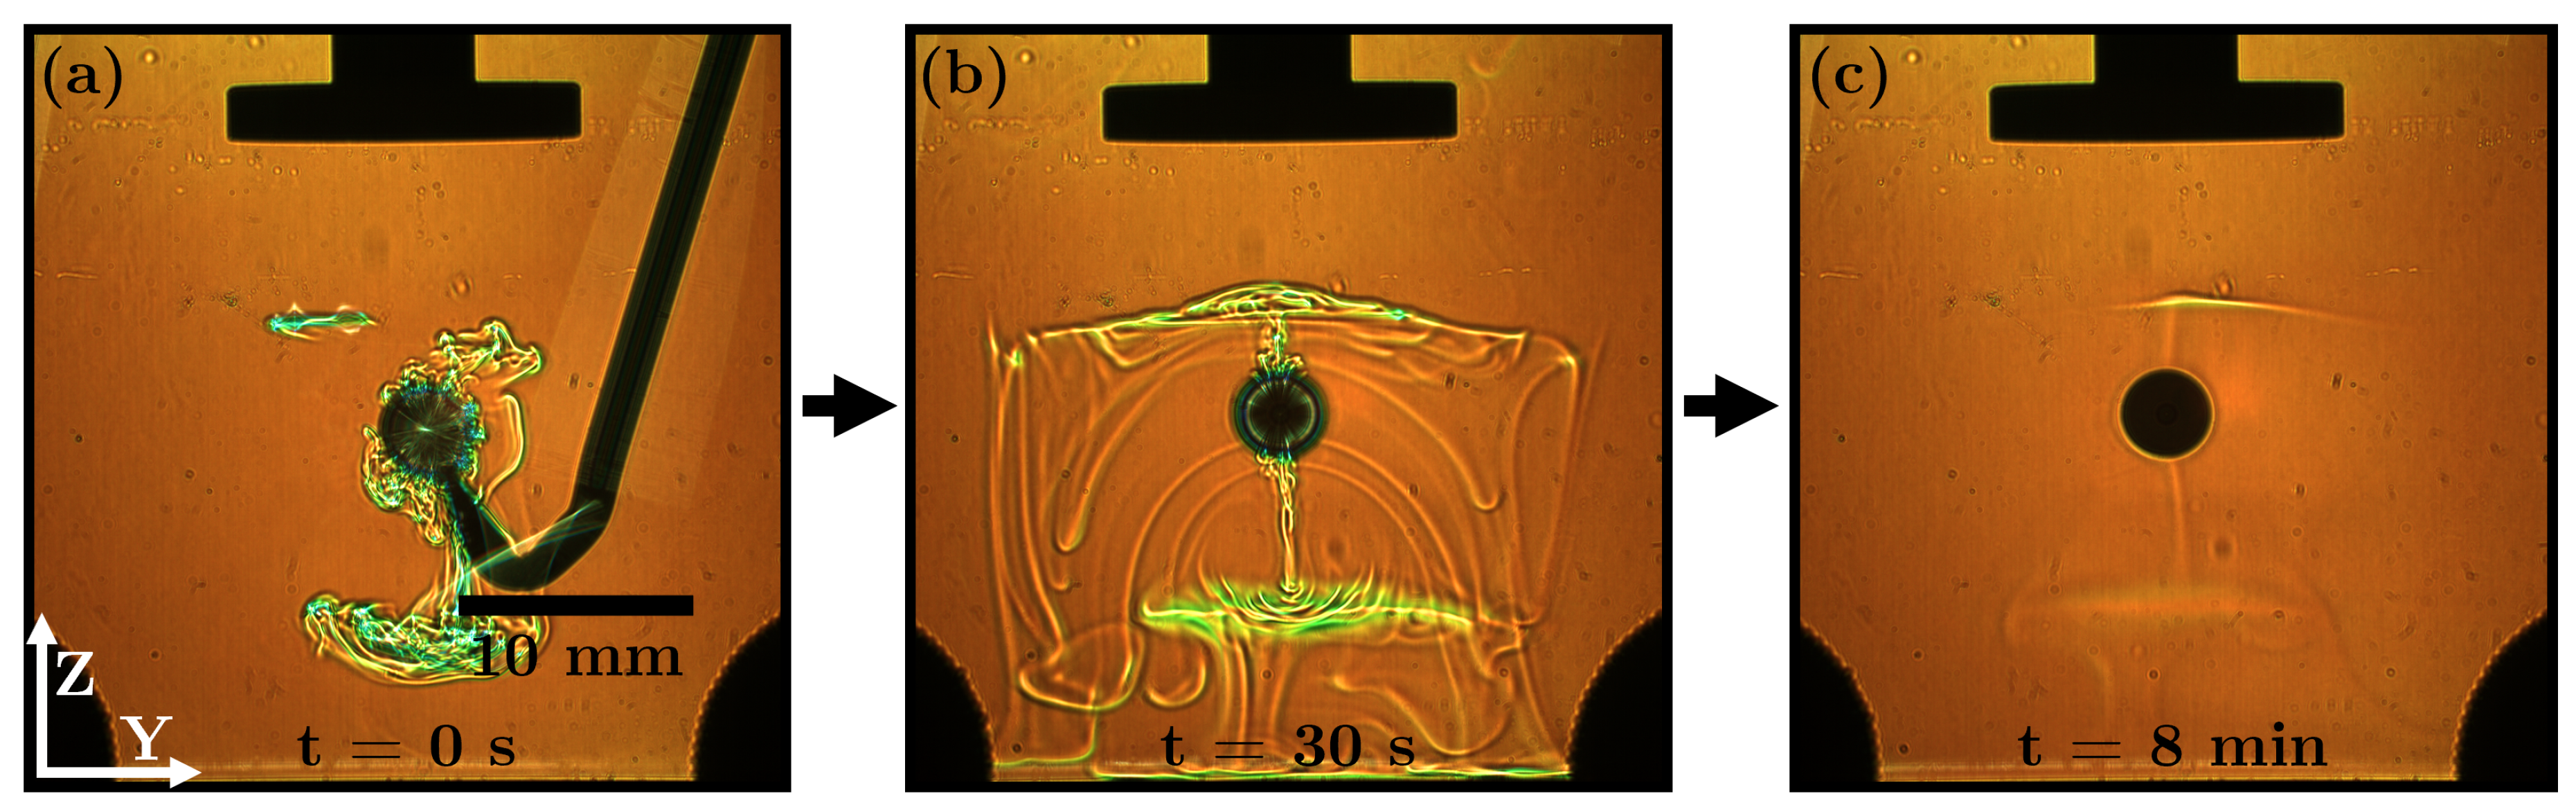
5 vol% propylene carbonate in toluene with , freely soluble: To levitate propylene carbonate (
) in the anti-node, it is mixed with toluene, which acts as a carrier for acoustic levitation. The density of propylene carbonate is higher than that of water, so the concentration streaks in the continuous phase should theoretically only point downward. Propylene carbonate is the main transfer component (TC) in the system. The slow mass transfer of toluene is not seen in this setup, which is very slightly soluble in water.
Figure 12 shows the behaviour of propylene carbonate as it is transferred to the continuous phase. The entire measurement is shown in
Video S4 of the Supplementary Material. The high aqueous solubility (240 g/L) of the TC results in rapid mass transfer, leading to Marangoni eruptions driven by surface tension gradients. When the concentration of the TC in the drop falls below a threshold, the eruptions stop.
Although the density of the TC is higher than that of water, there are two opposite directions of mass transfer (
Figure 12b). This behaviour is not caused by acoustic streaming; there is no superimposed turbulence visible in the spread of the TC. The acoustic field also creates two distinct barriers for the TC at two nodal planes, comparable to butyl acetate (
Figure 10c) with one nodal plane as a barrier. The TC slides along these curved planes and slowly descends to the bottom of the cuvette, as it continues to dissolve. Thus, for the RSD technique, the TC visually disappears in the continuous phase. The measurement shows that the acoustic field can influence the vertical direction of mass transfer and the propagation of an inhomogeneous dissolved TC.


