
Study on Wavelet Packet Energy Characteristics on Friction Signal of Lapping with the Fixed Abrasive Pad


Abstract
:1. Introduction
2. Basic Principles
3. Experimental Part
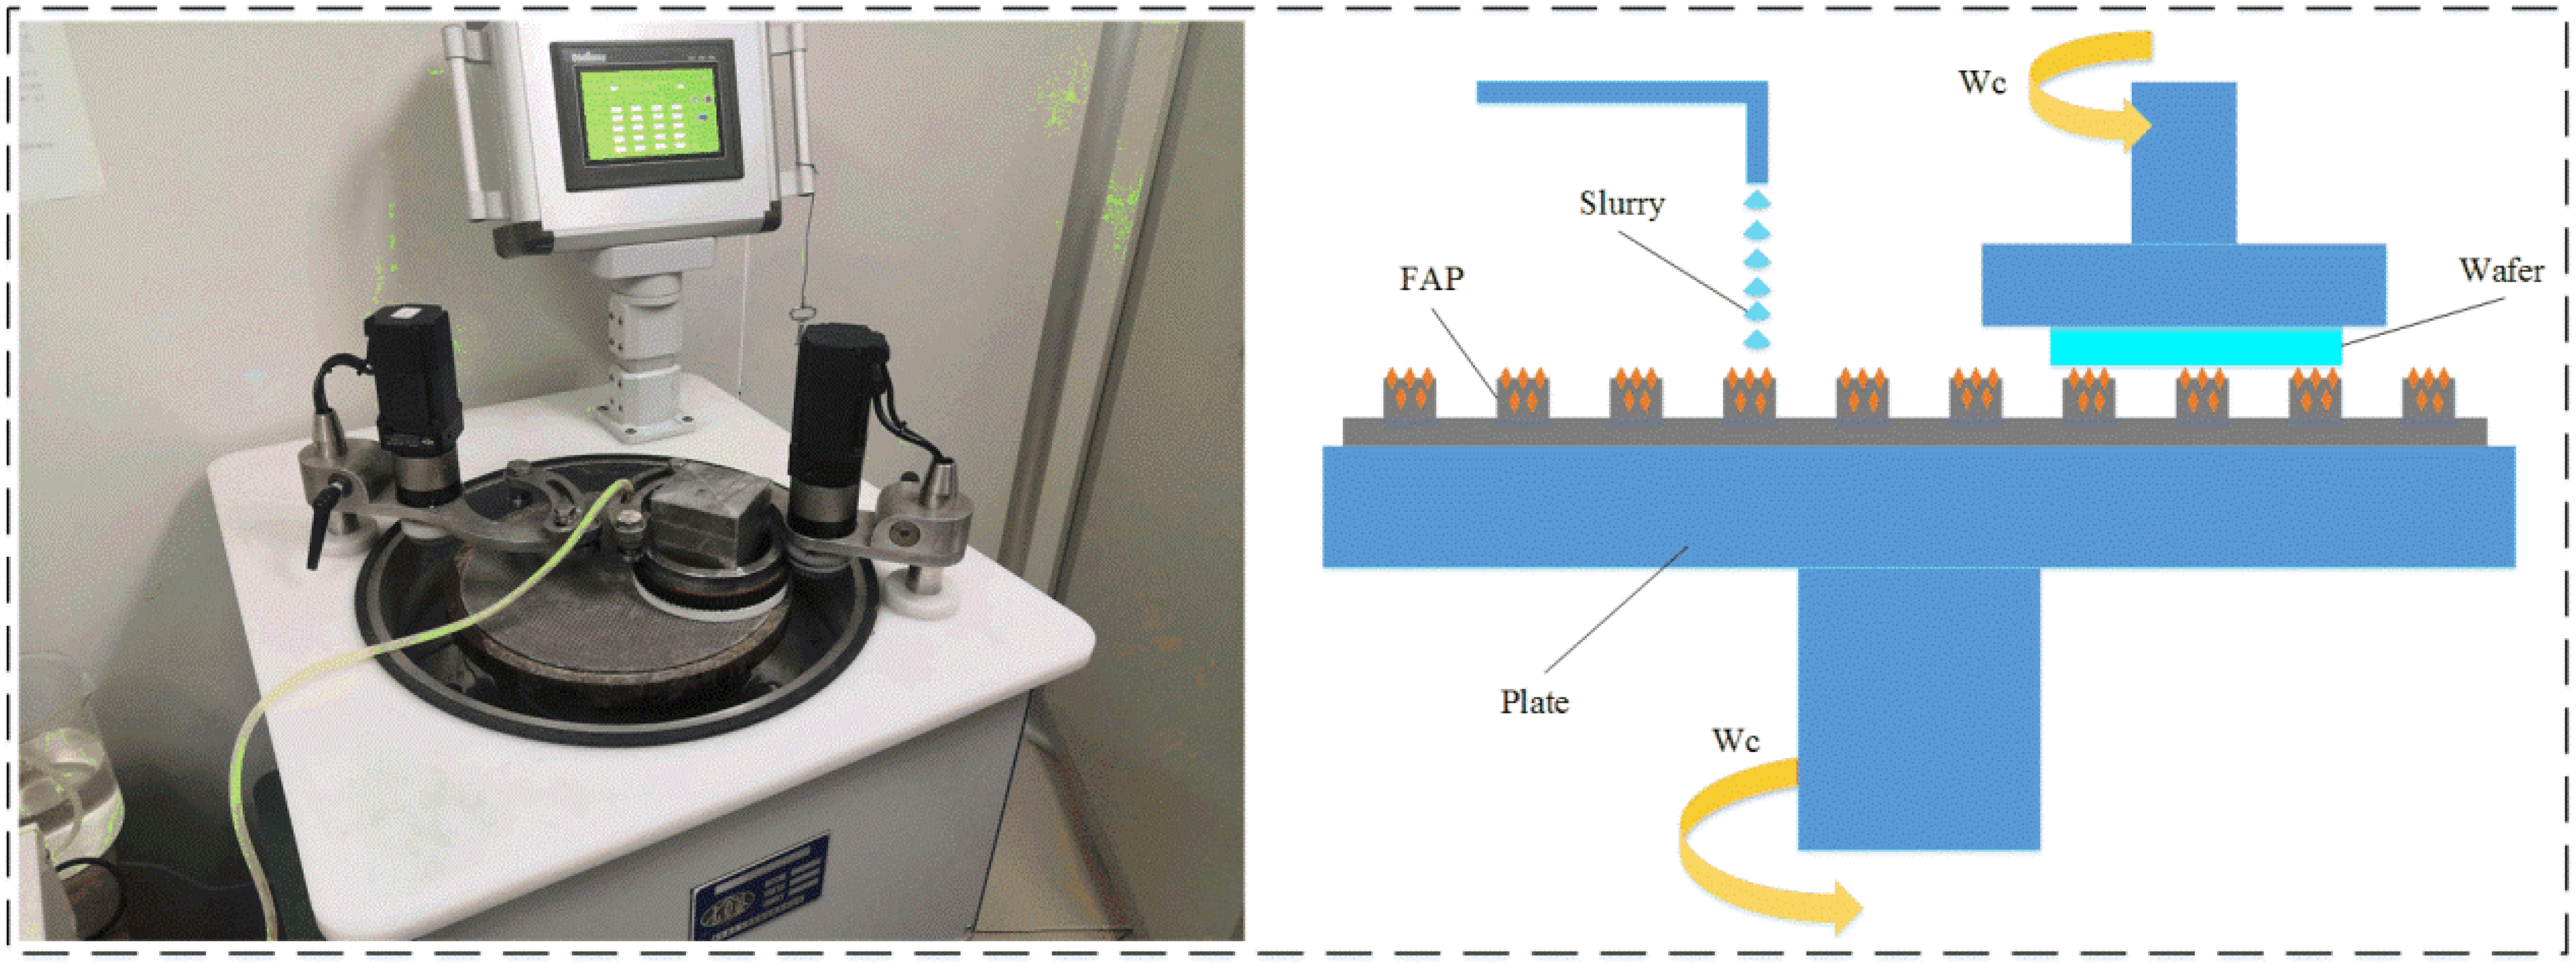
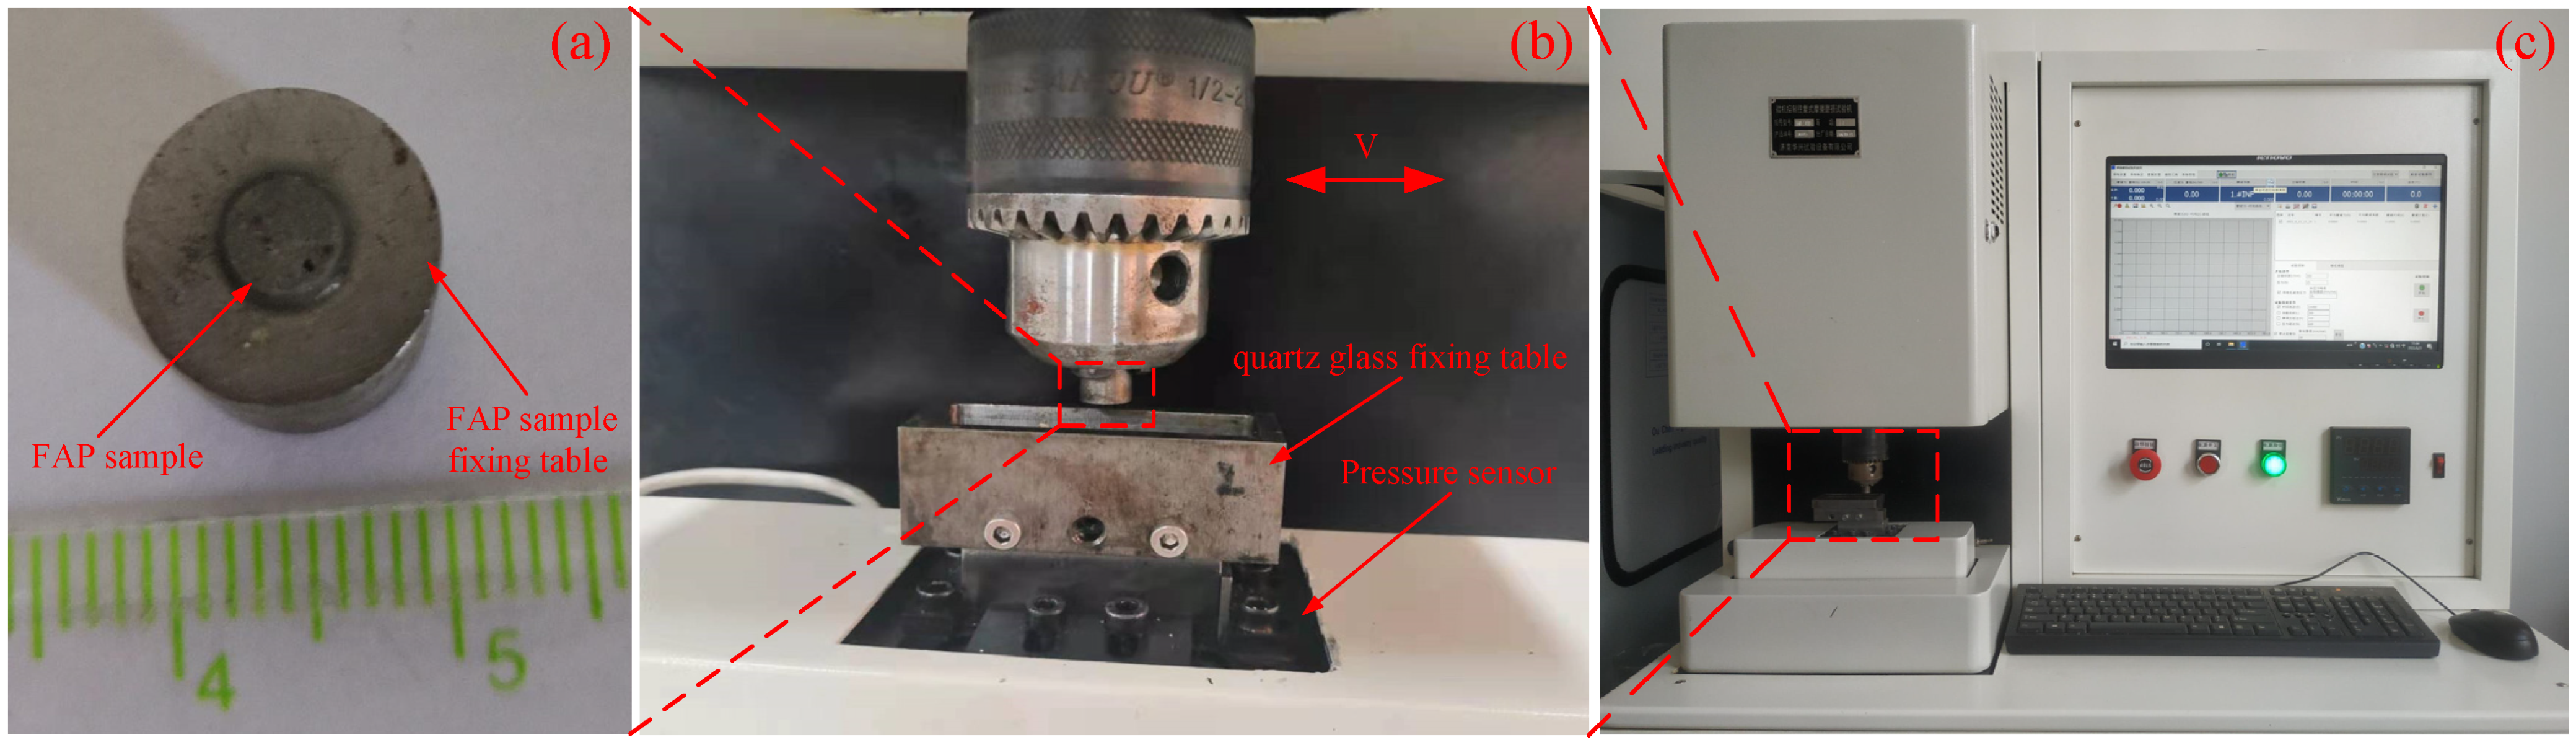
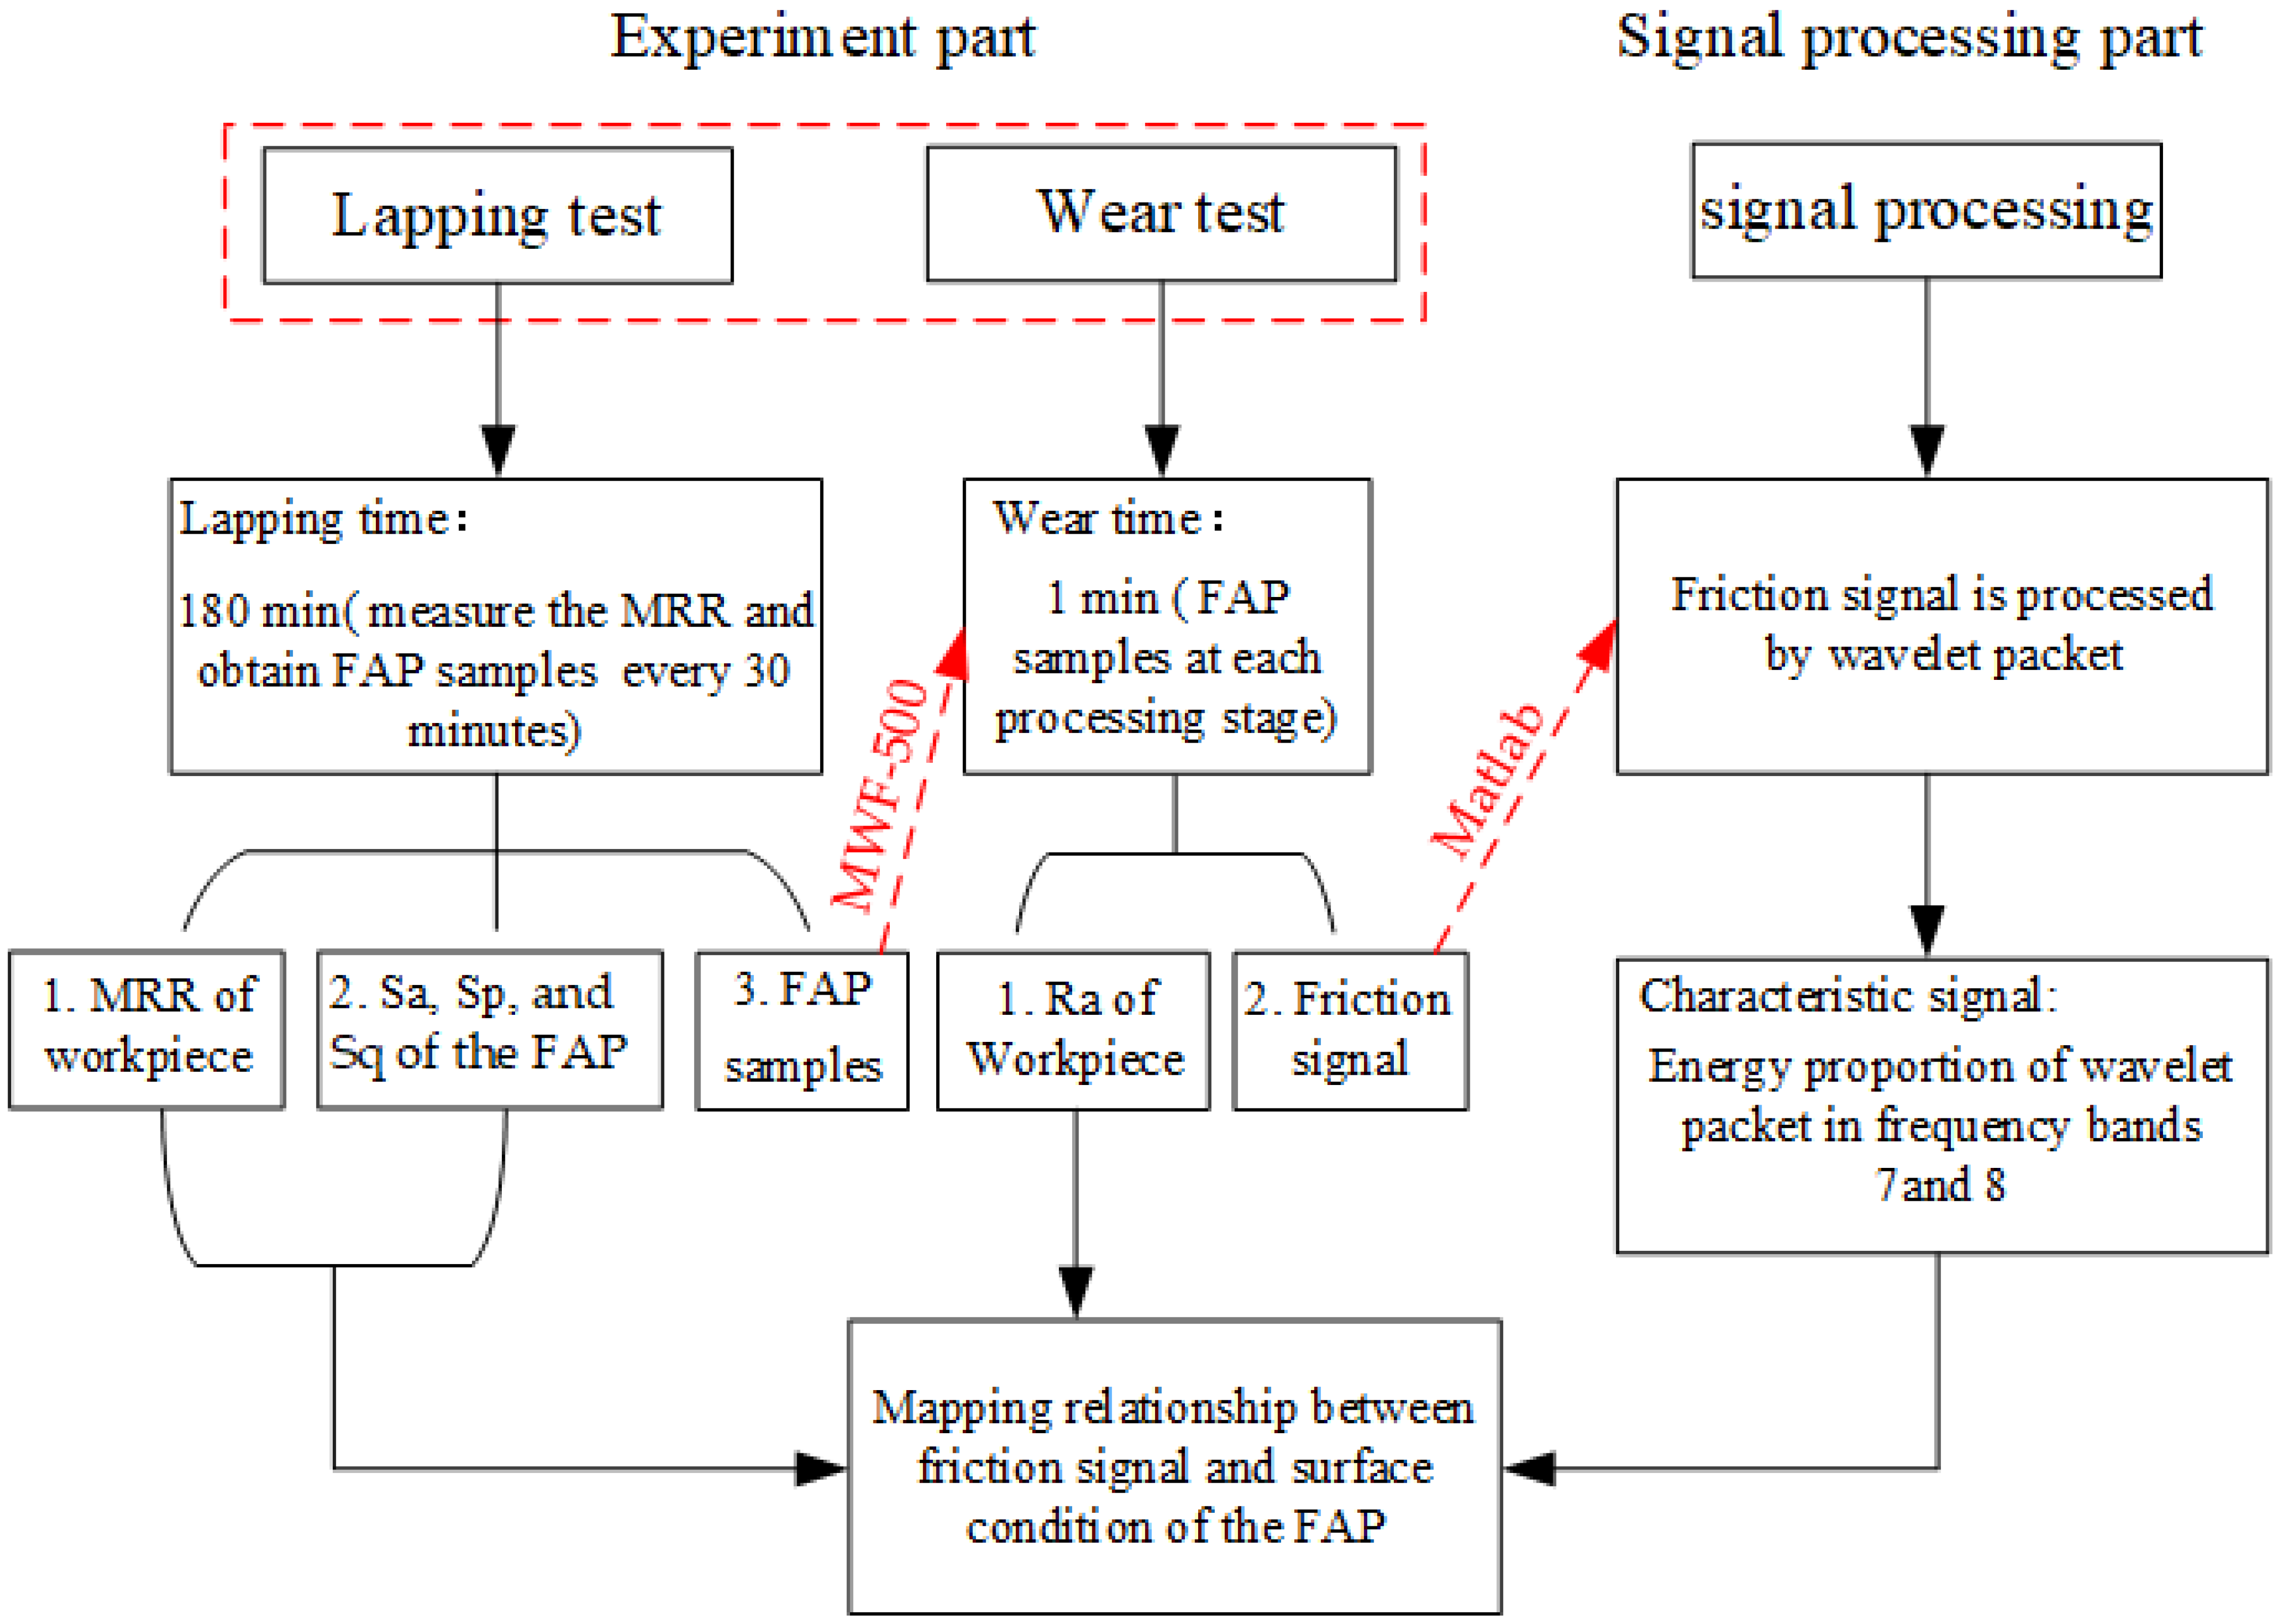
3.1. Experimental Design
3.2. Measurement and Characterization
3.2.1. Material Removal Rate
3.2.2. Observation of Surface Roughness and Three-Dimensional Morphology
4. Results and Discussion
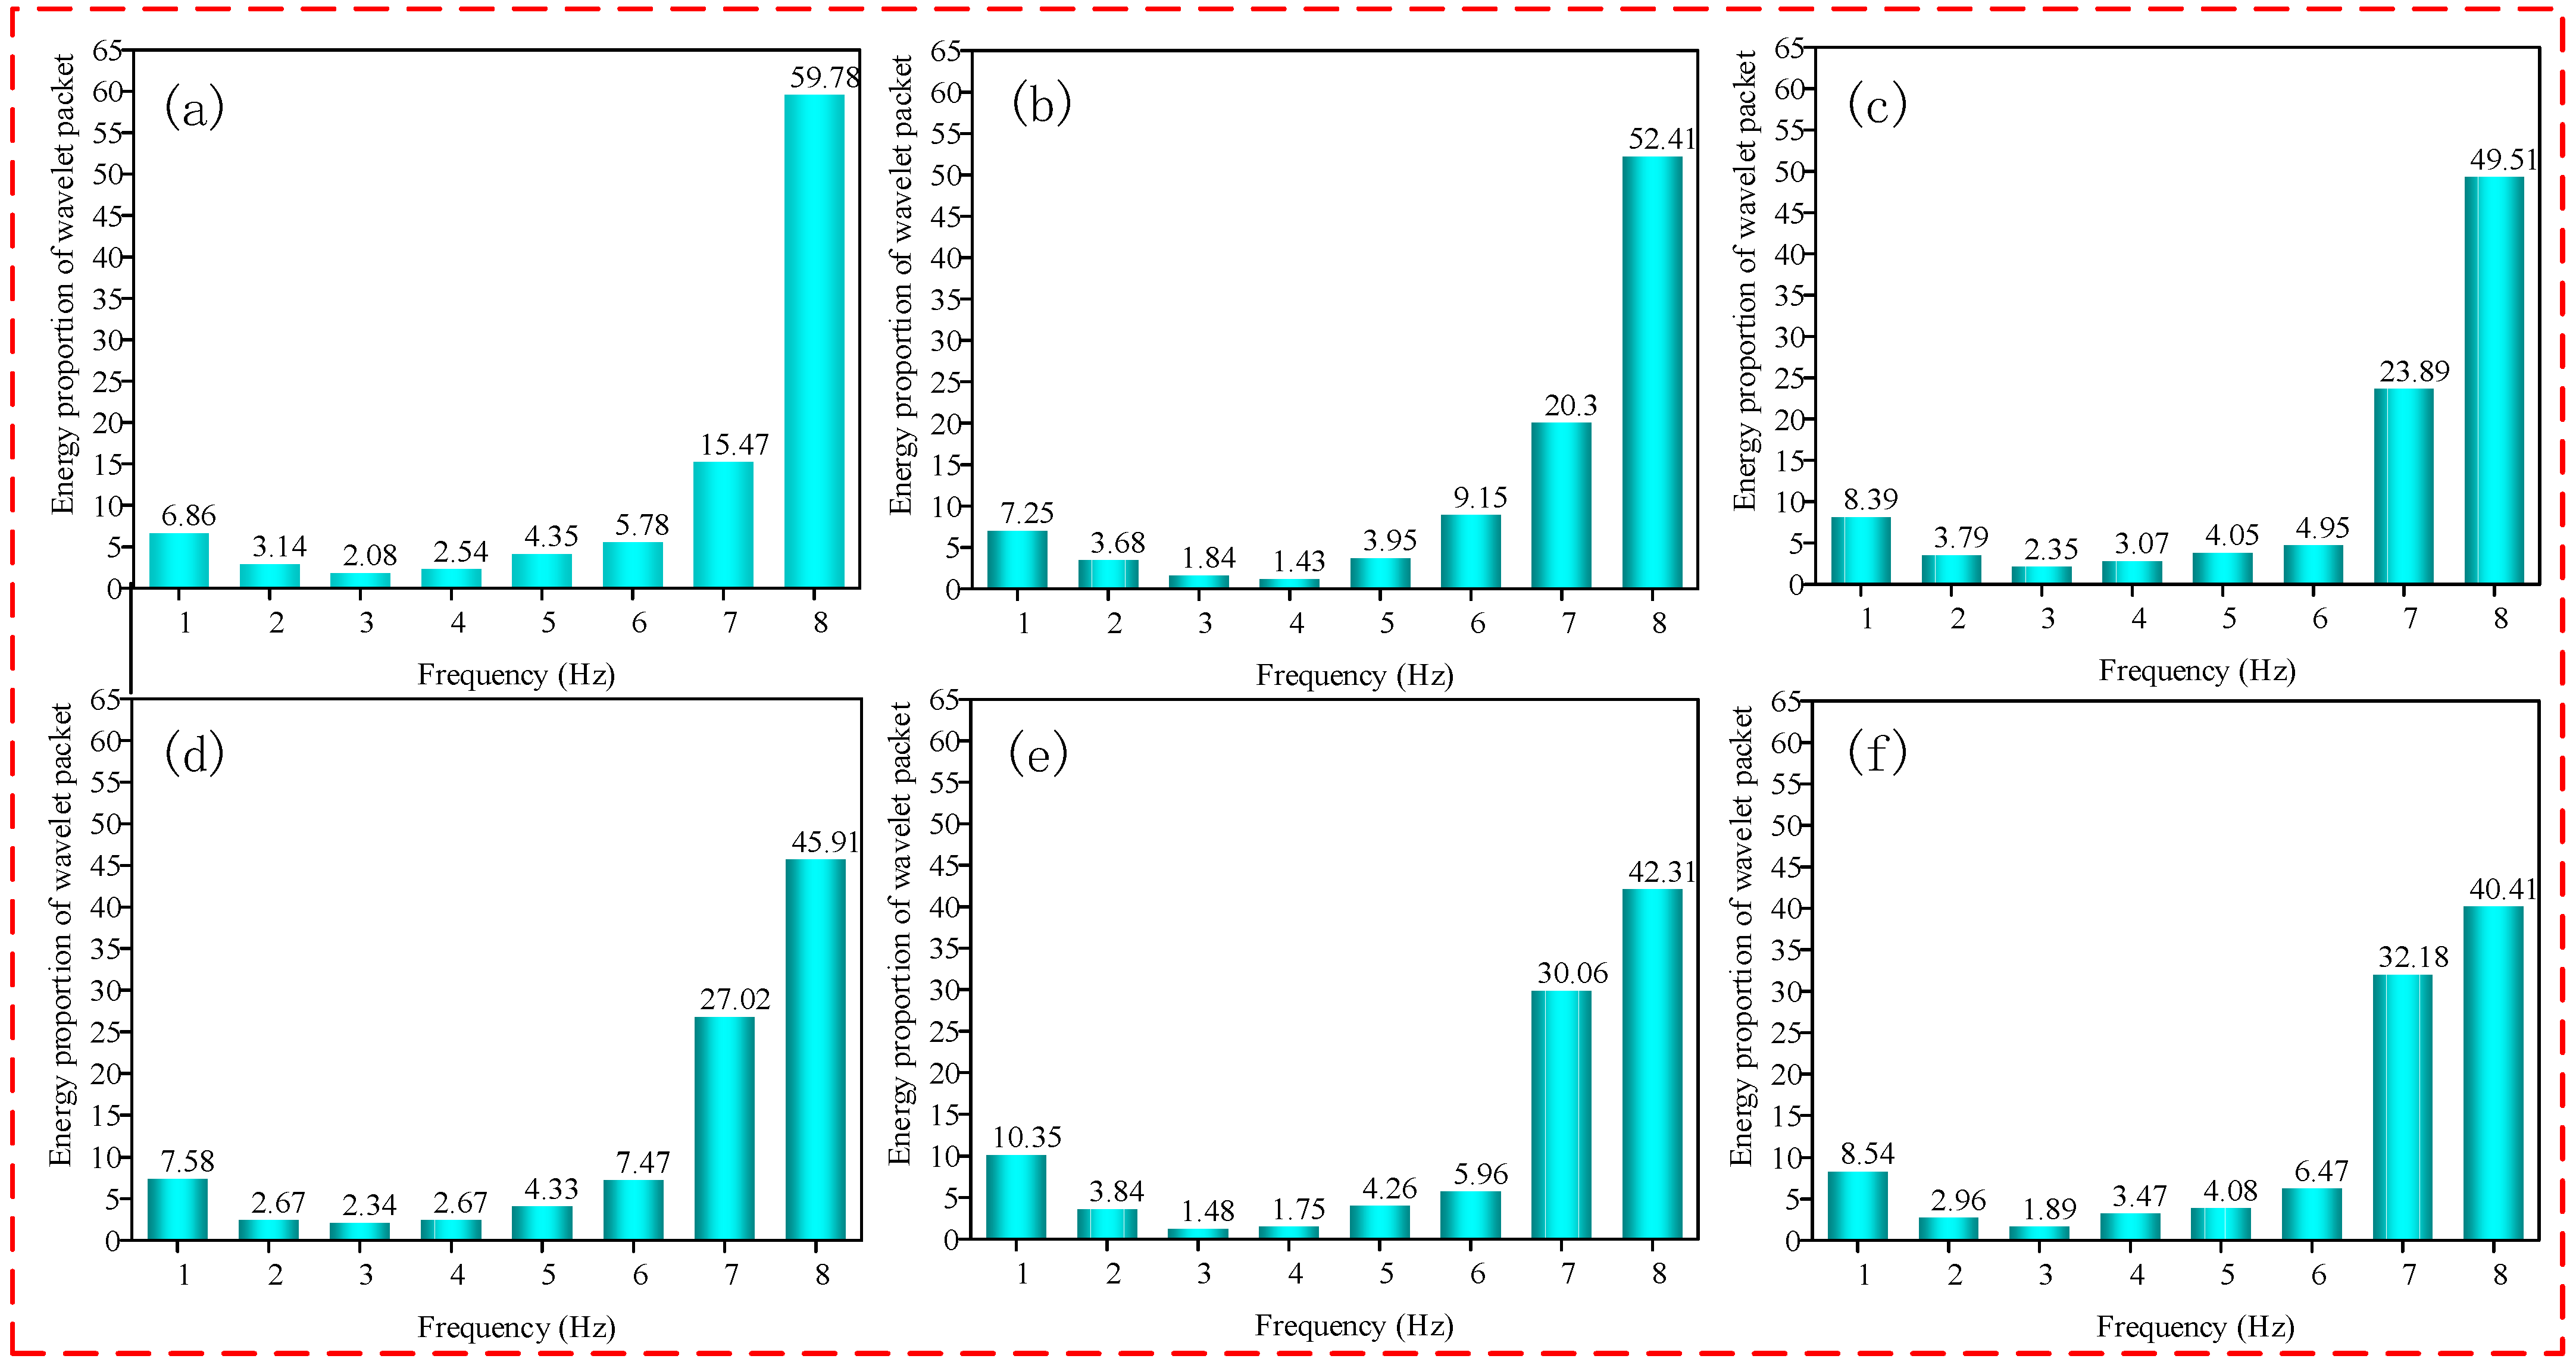
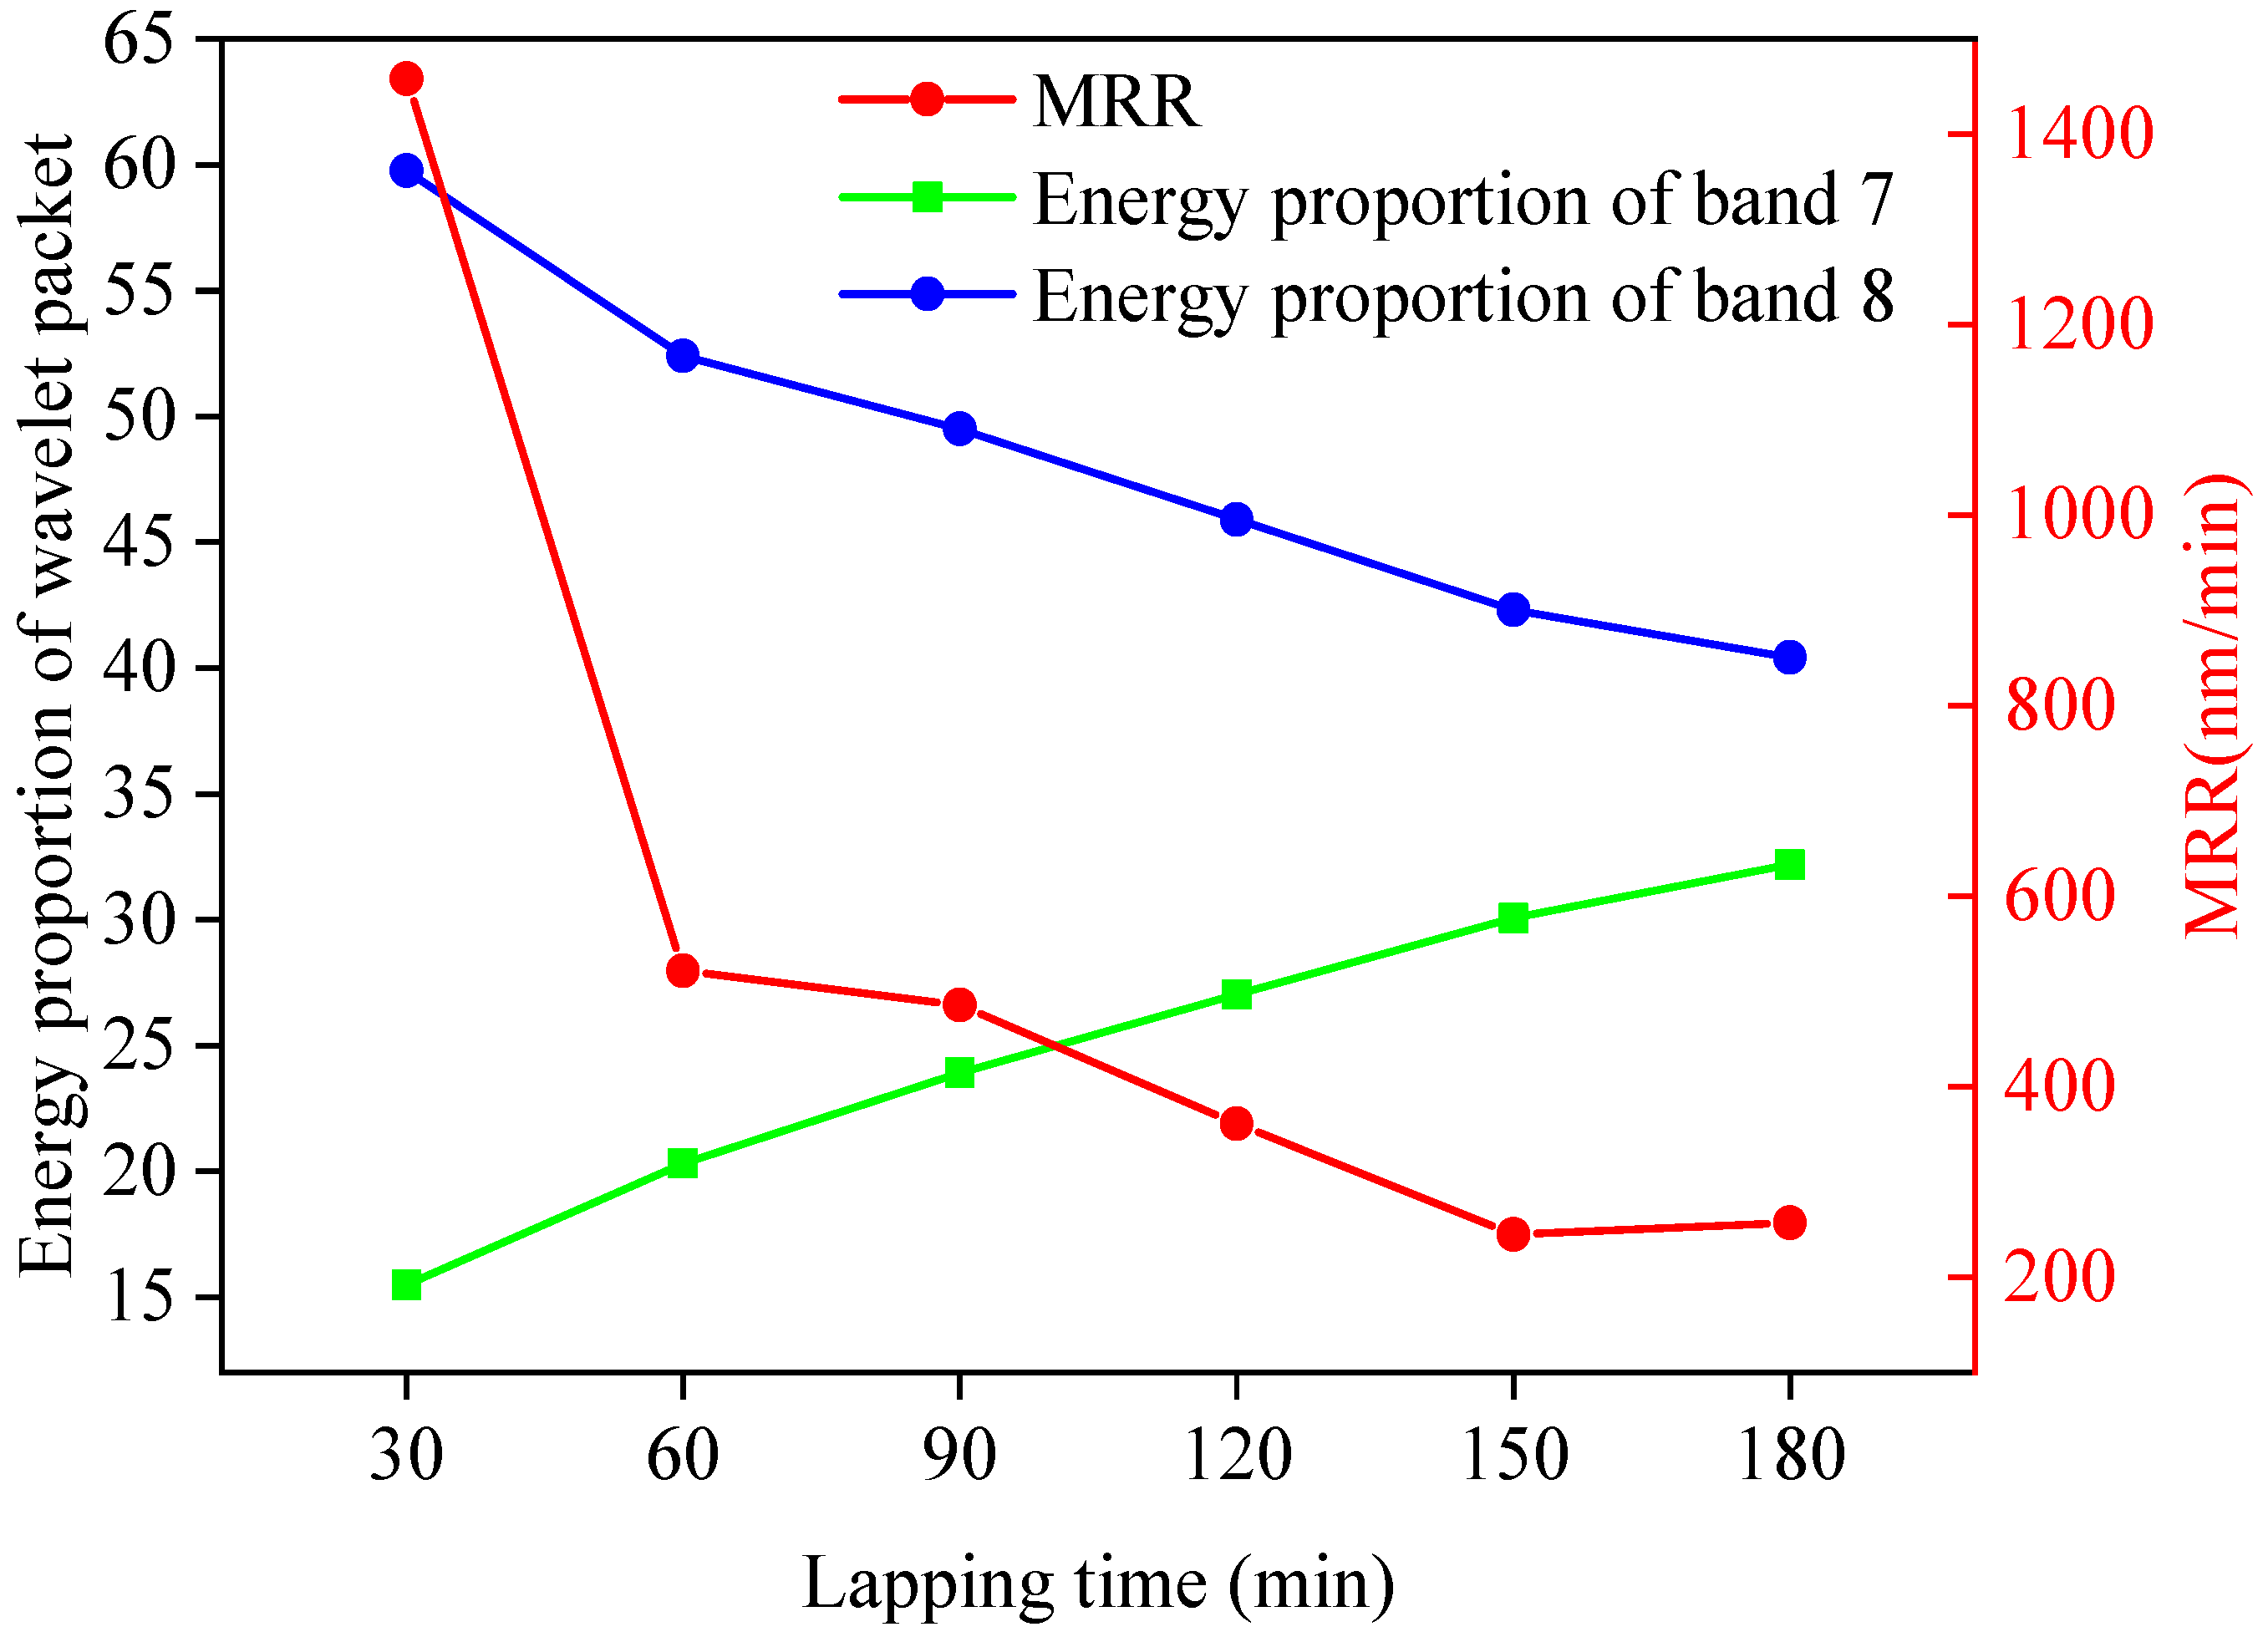
4.1. Relationship between the MRR and Energy Proportion of Wavelet Packet
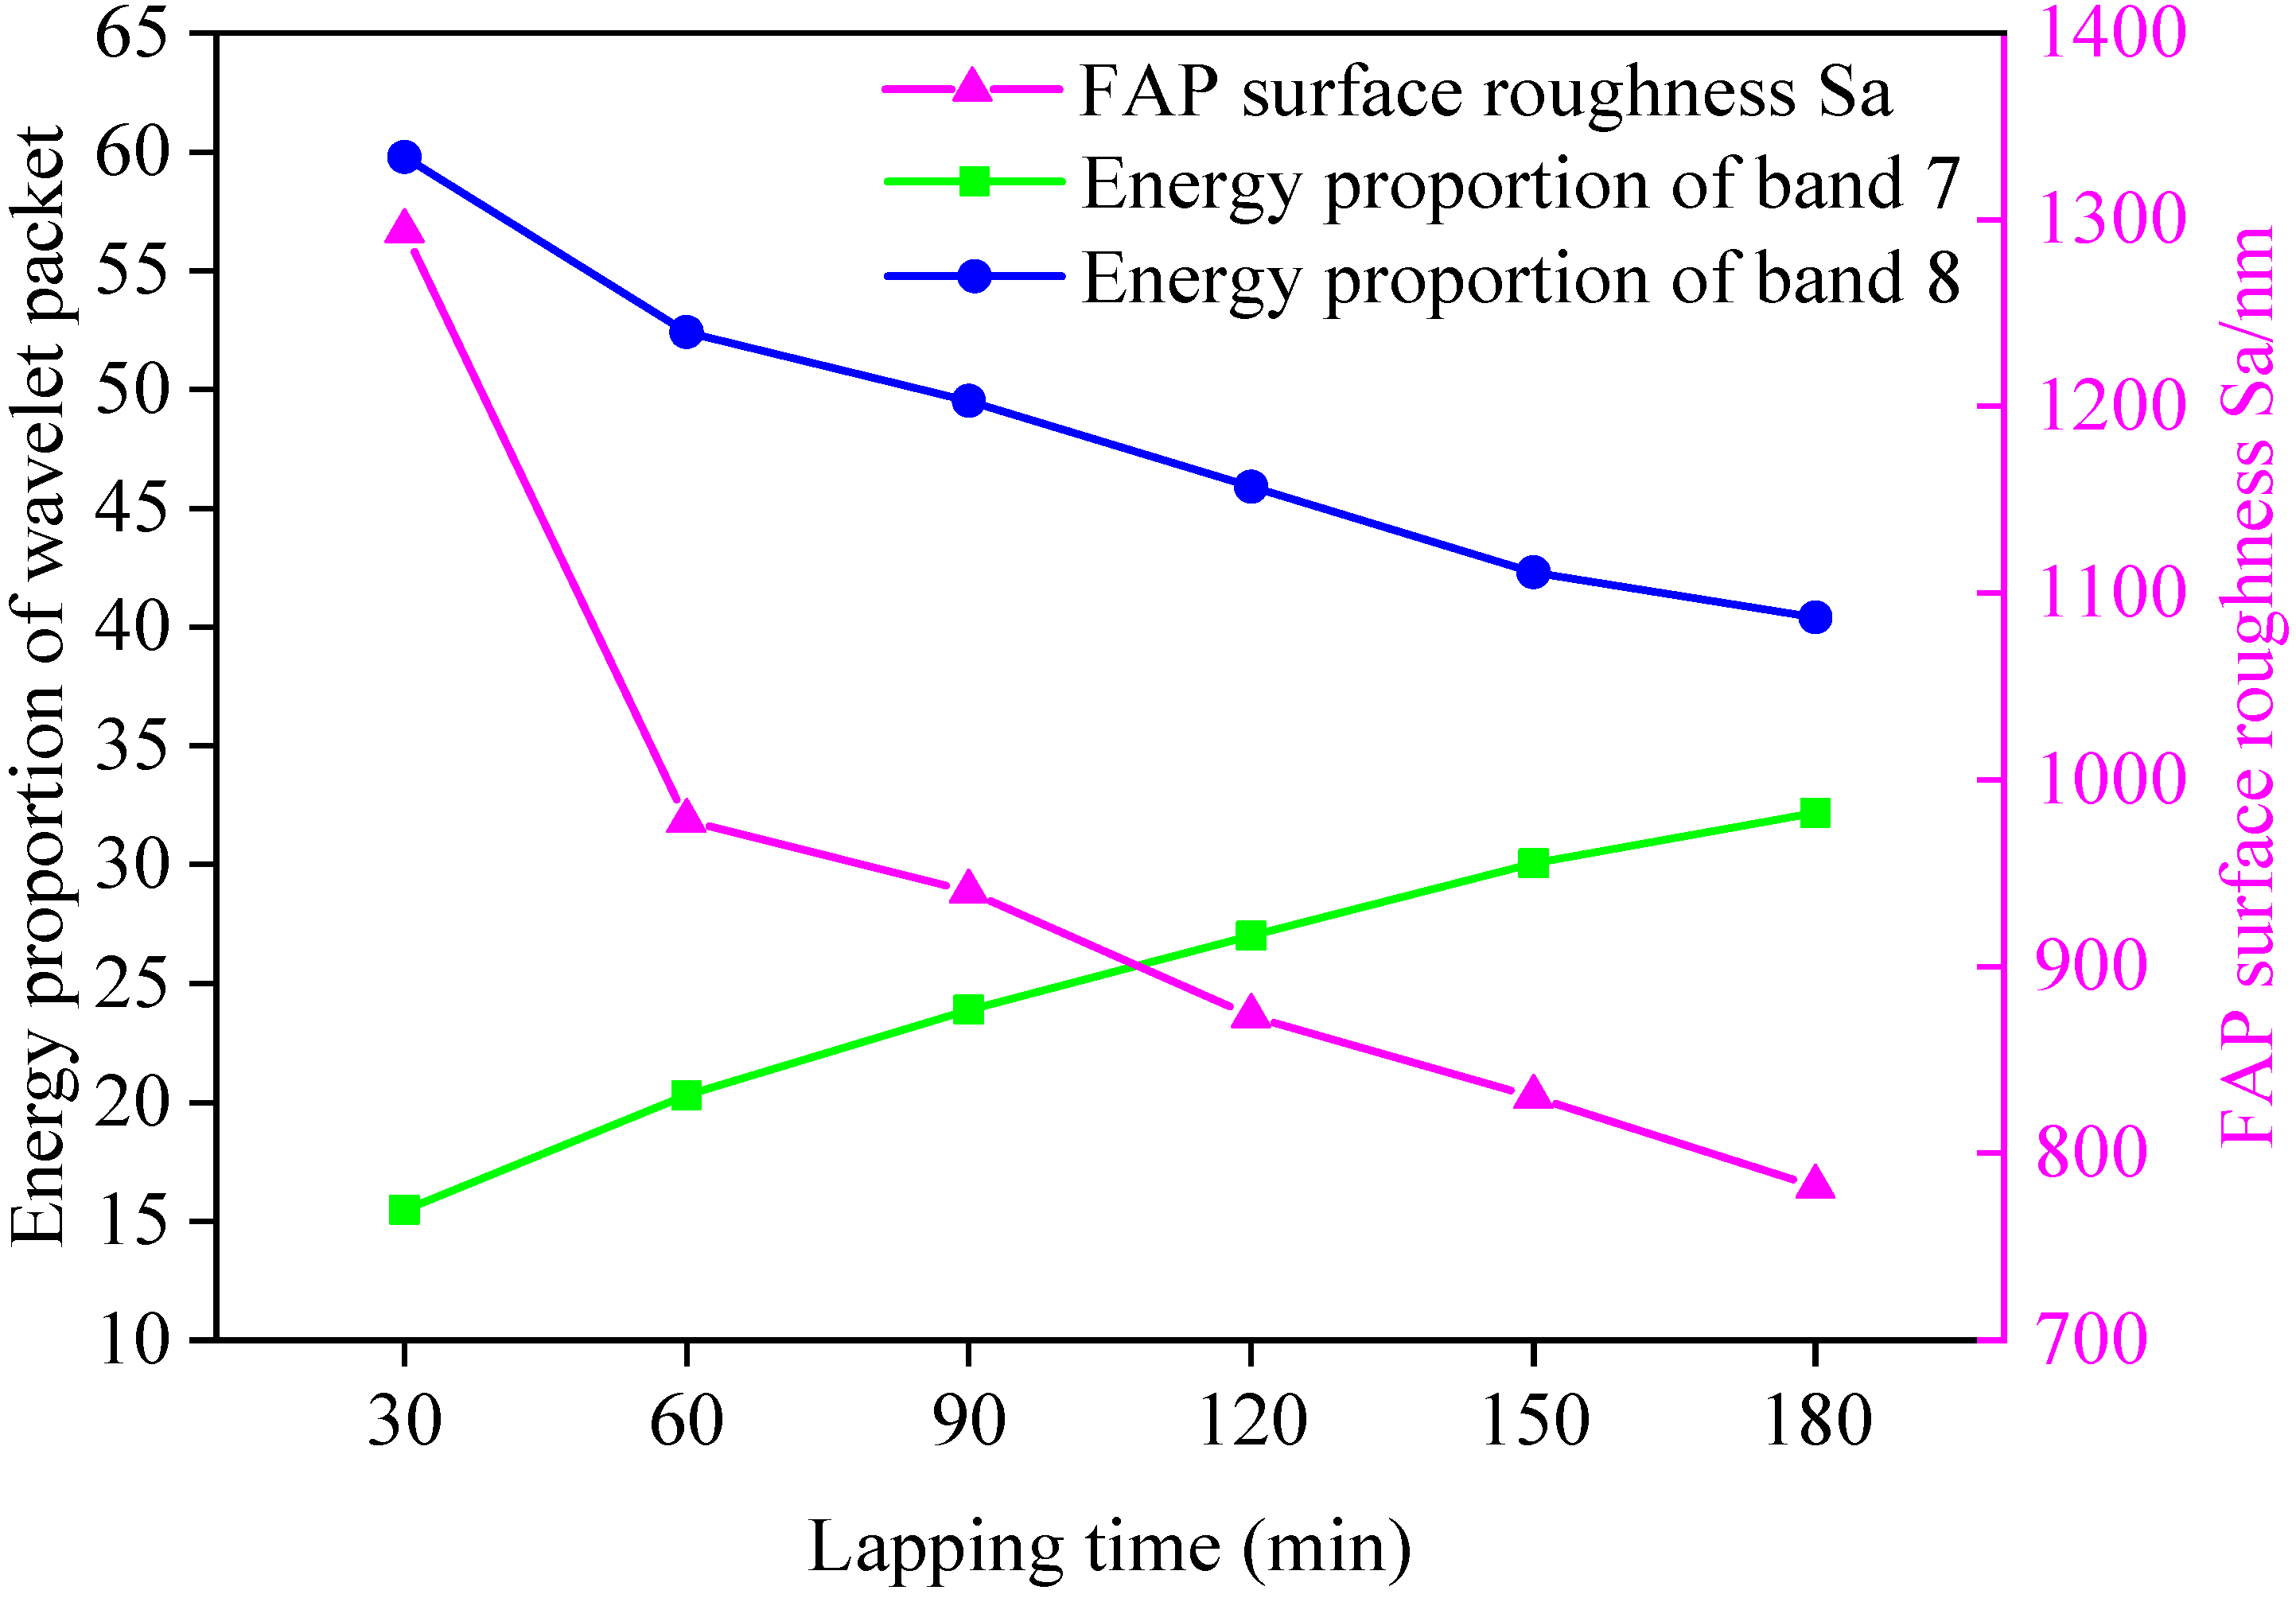
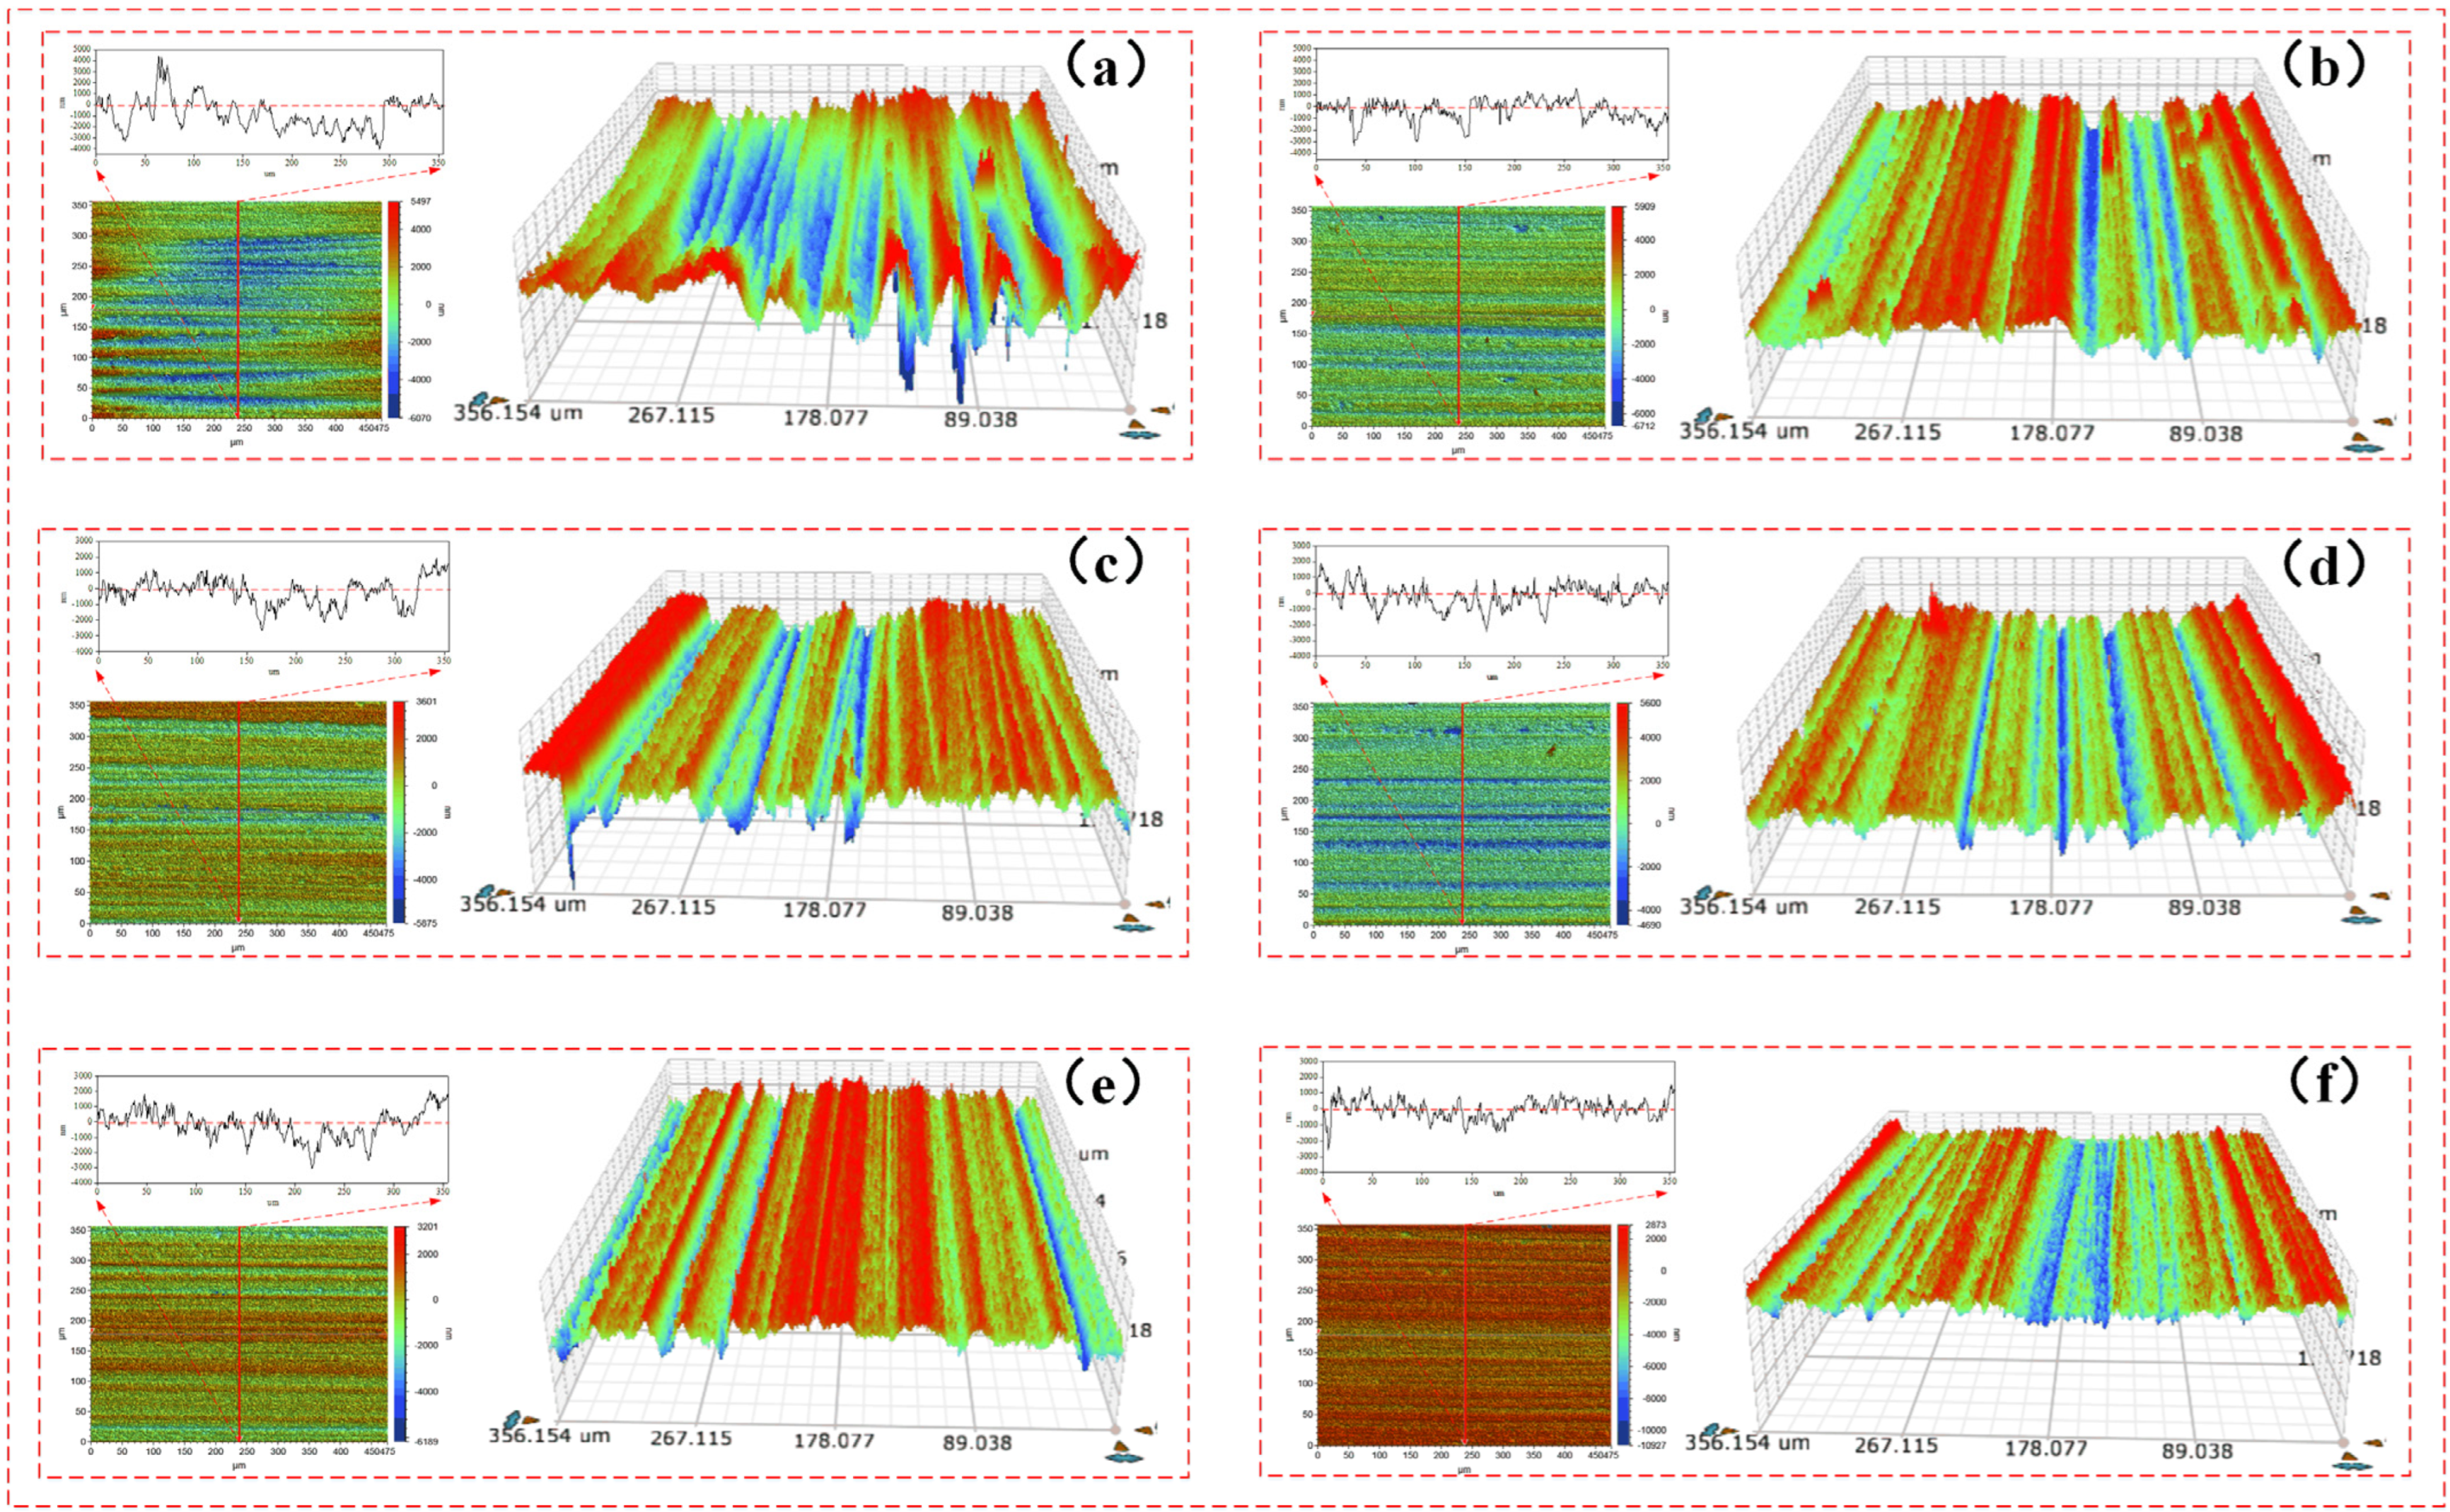
4.2. Relationship between Surface Roughness of the FAP and Energy Proportion of Wavelet Packet
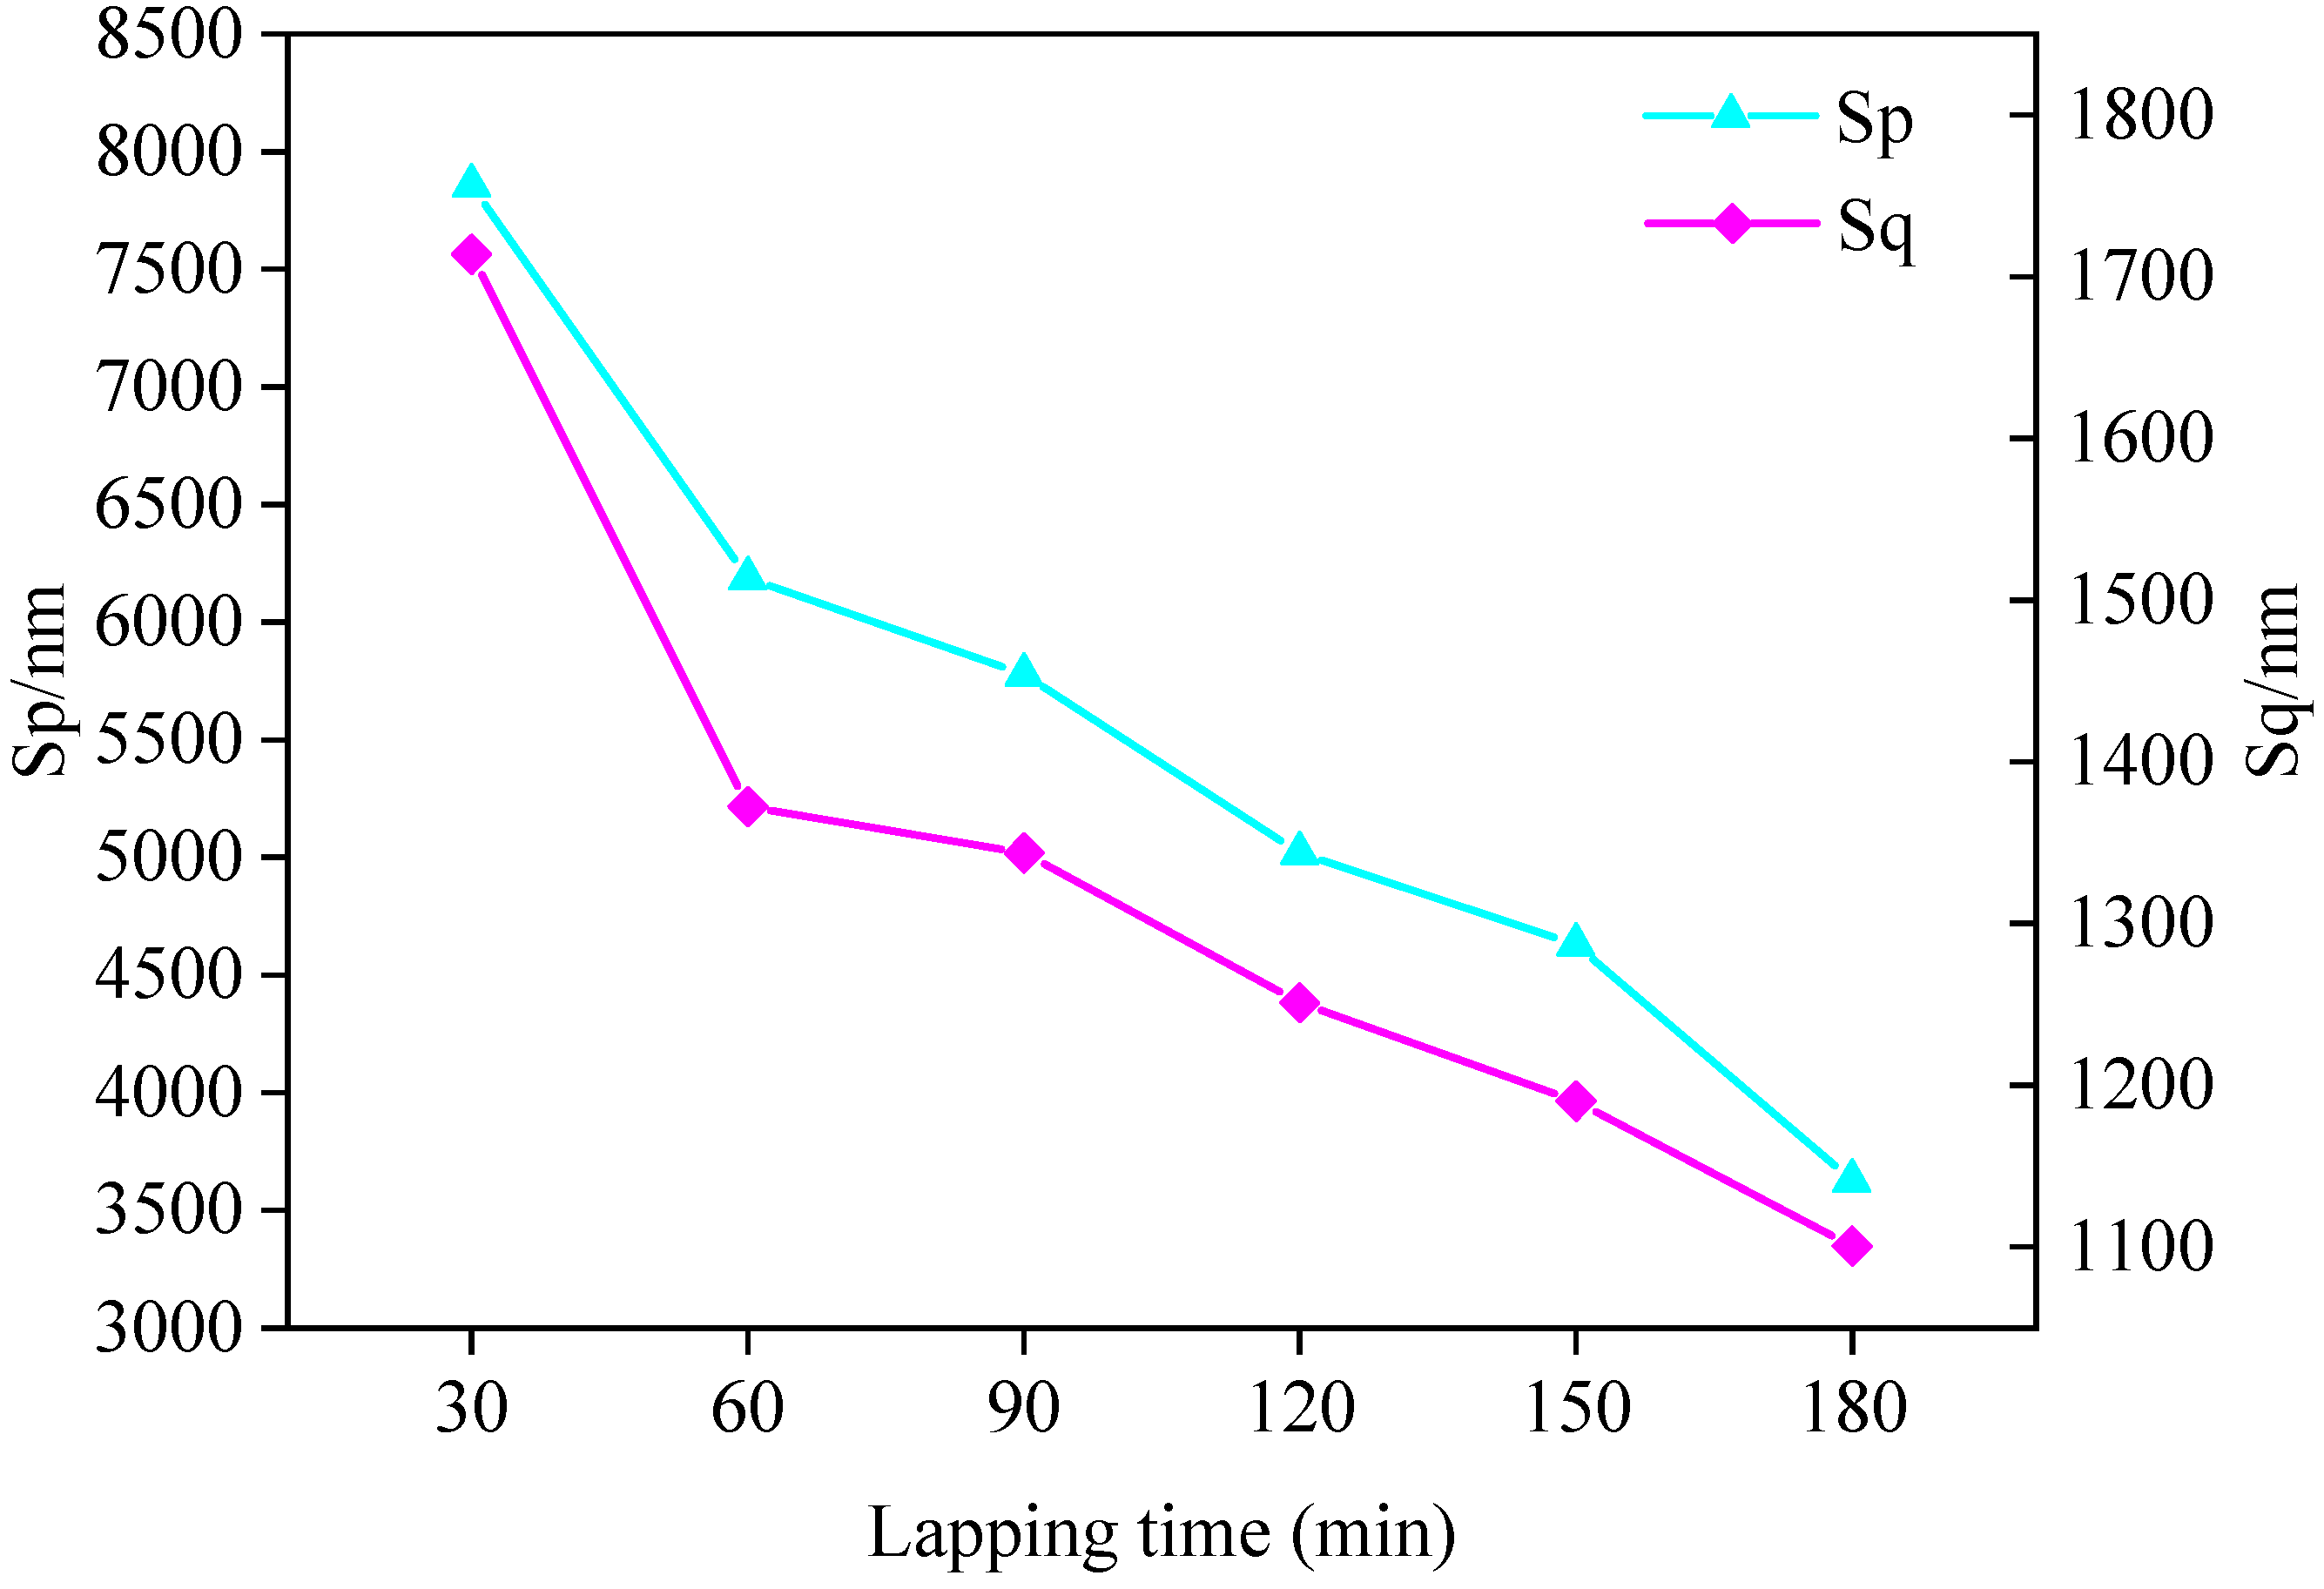
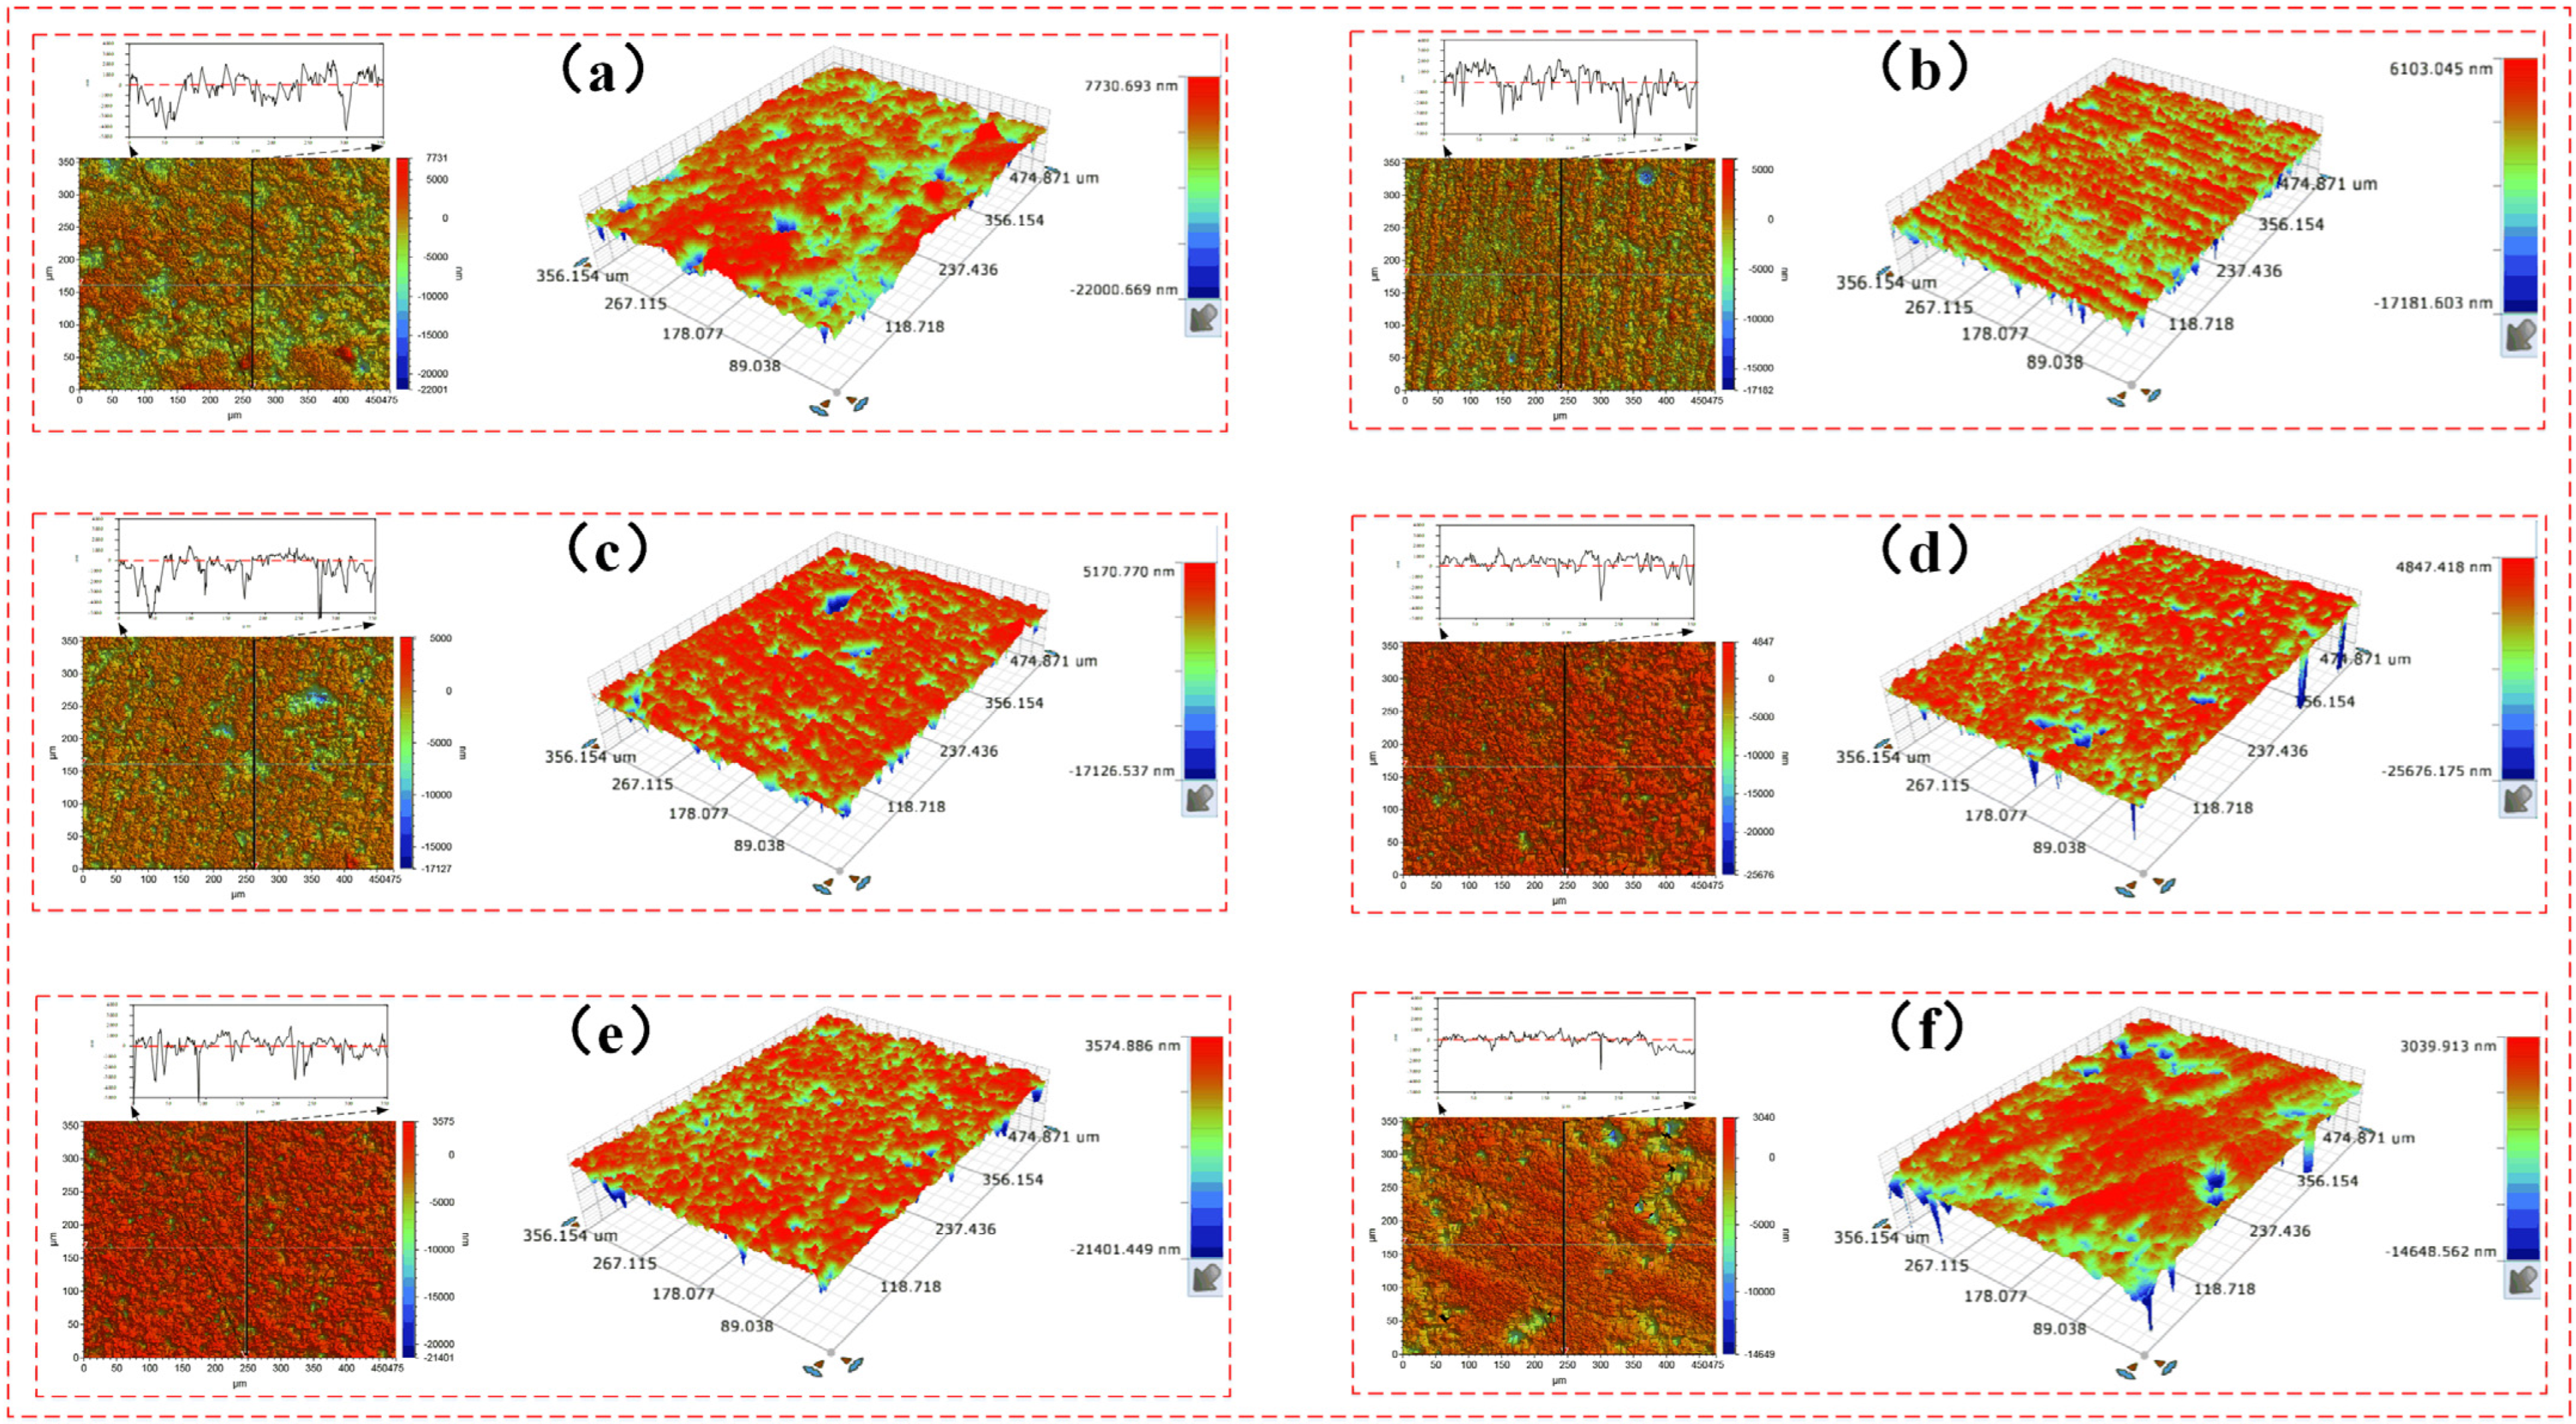
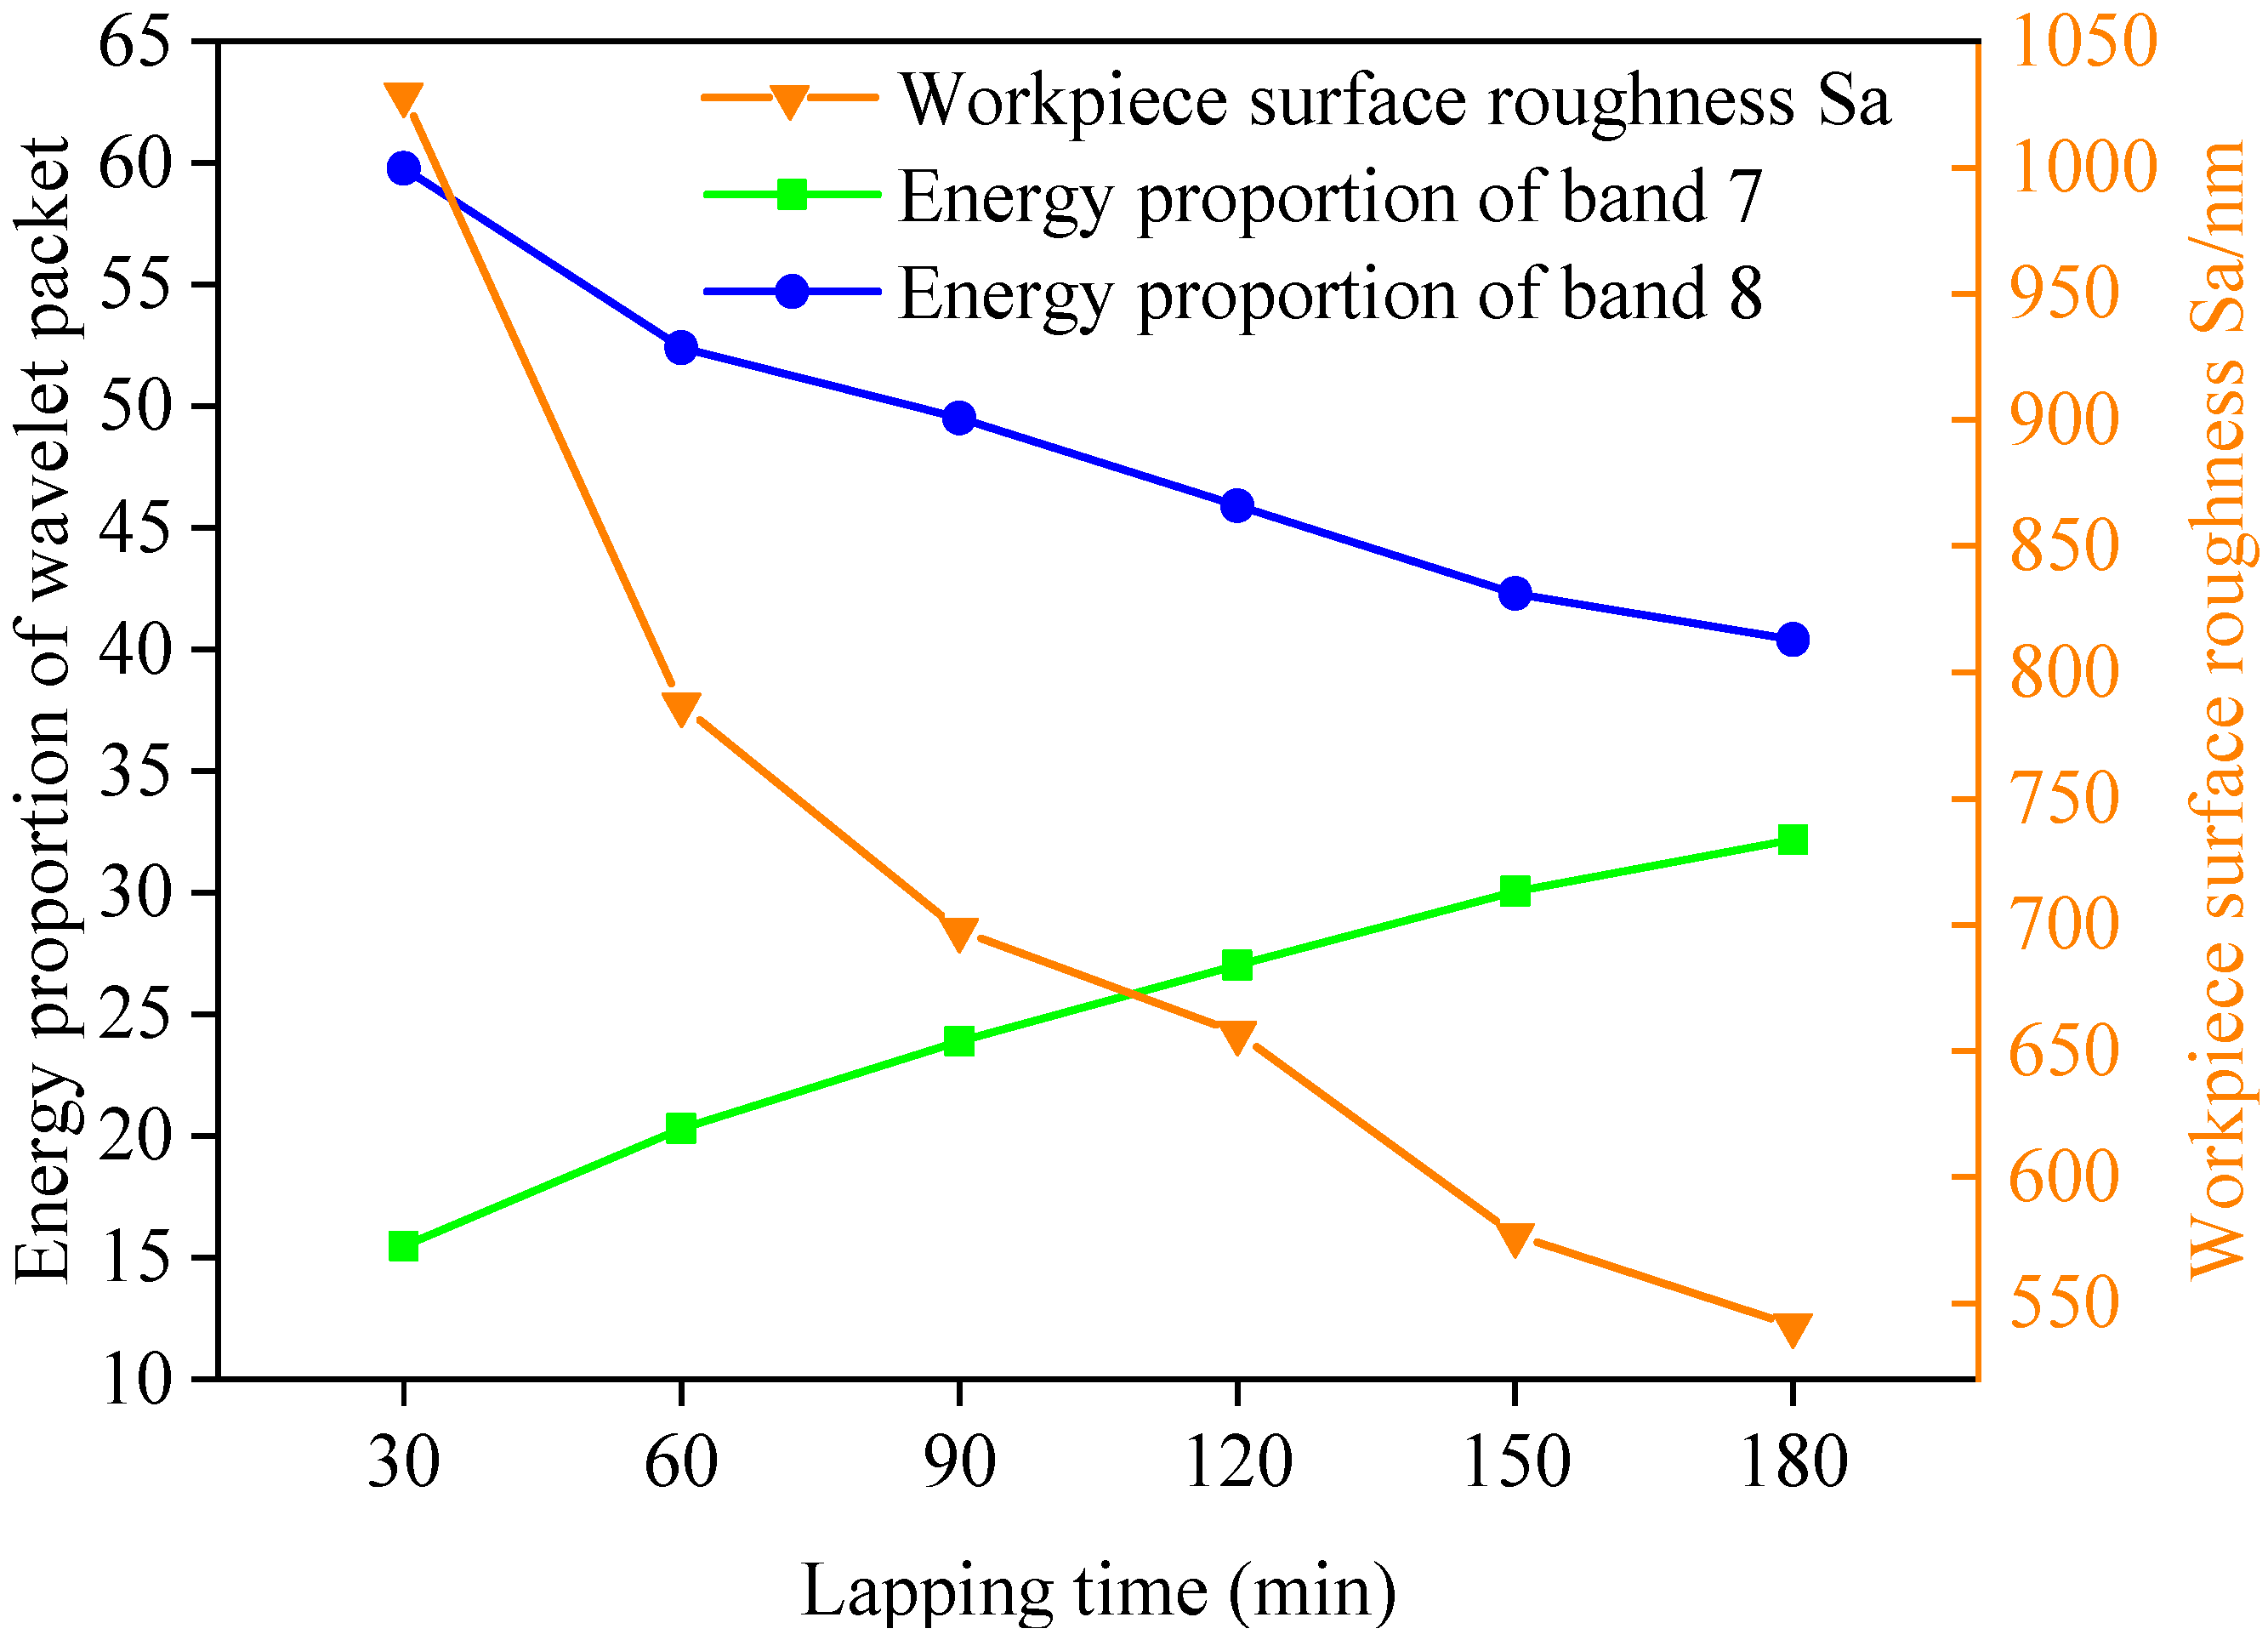
4.3. Relationship between Surface Roughness of Workpiece after Wear and the Energy Proportion of Wavelet Packet
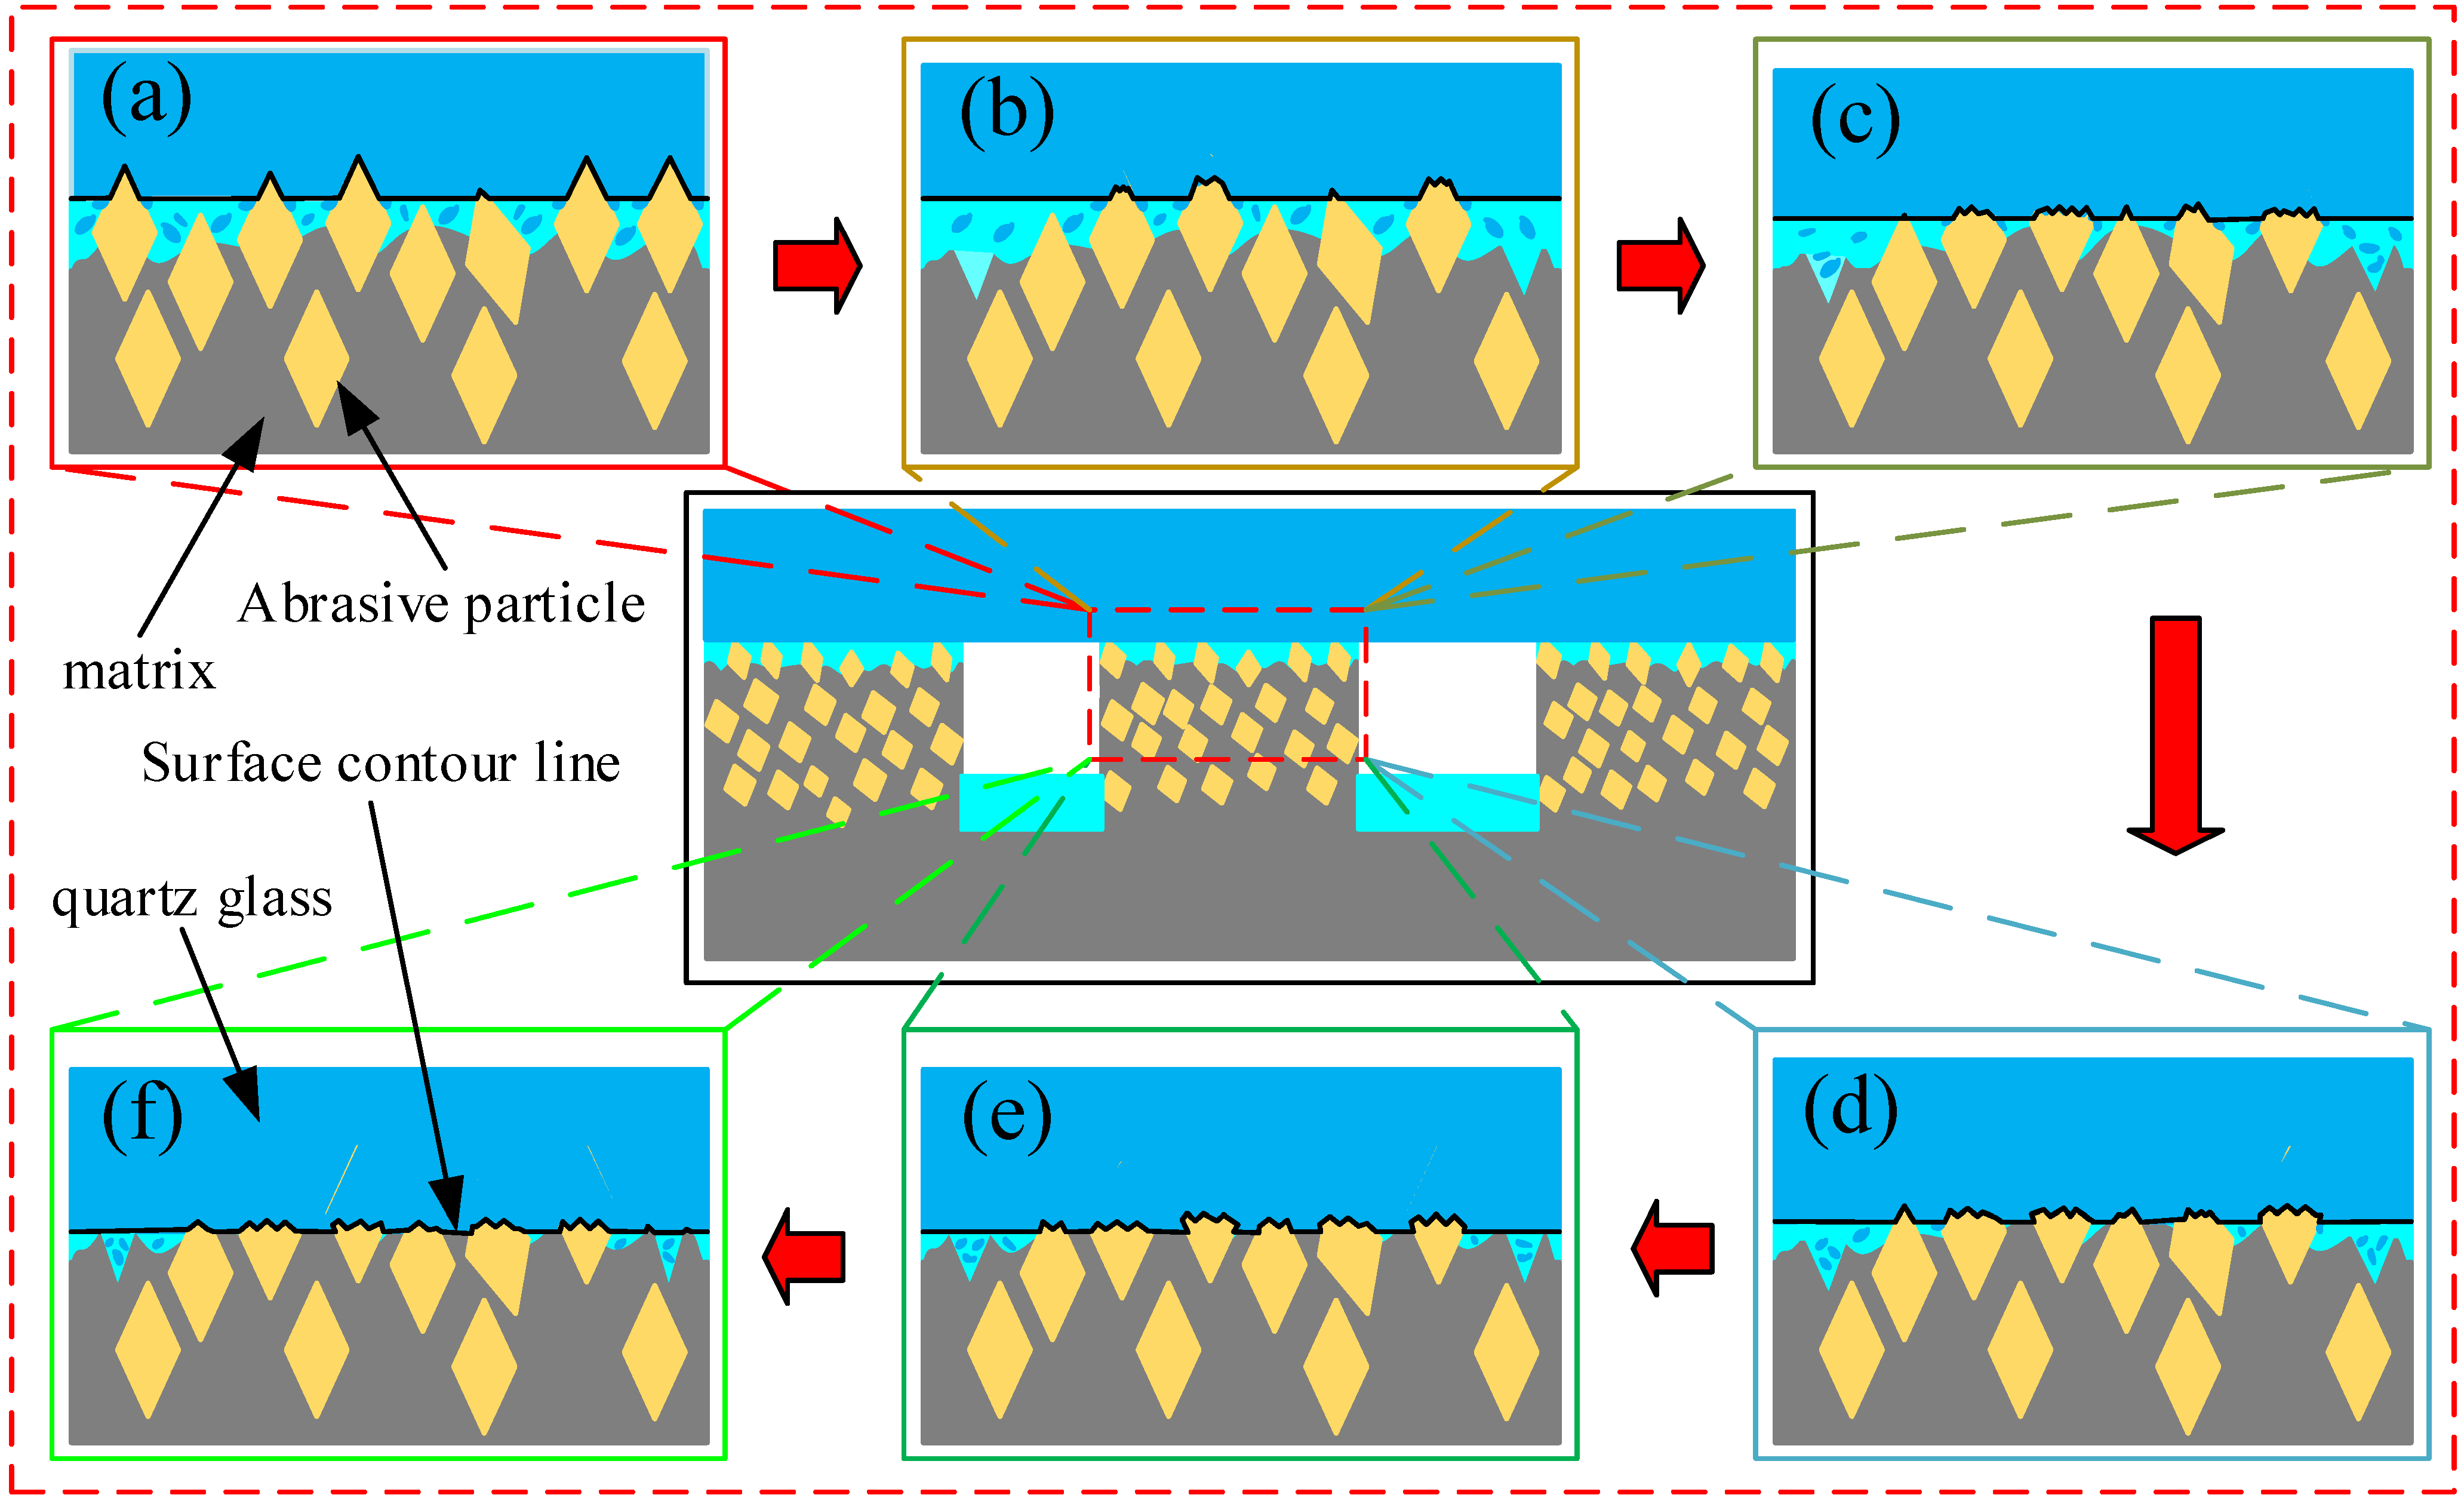
4.4. Discussion
5. Conclusions
Author Contributions
Funding
Acknowledgments
Conflicts of Interest
References
- Fang, T.; Chen, P.C.; Lee, M.H. A New Permanganate-Free Slurry for GaN-SiC CMP Applications. Mater. Sci. Forum 2020, 1004, 199–205. [Google Scholar]
- Jiang, W.; Zhou, H.; Ji, J.; Ren, X.; Zhu, Z. Semi-Consolidated Grinding Process of Easily Cleaved Gallium Oxide Wafer. Surf. Technol. 2022, 51, 178–185. [Google Scholar]
- Niu, F.; Wang, K.; Sun, T.; Zhou, P.; Hu, W.; Zhu, Y. Lapping performance of mixed-size agglomerated diamond abrasives in fixed abrasives pads. Diam. Relat. Mater. 2021, 118, 108499. [Google Scholar] [CrossRef]
- Wang, J.B.; Zhu, Y.W.; Xie, C.X.; Xu, J.; Ju, Z.L. Role of slurry in single crystal sapphire lapping with fixed abrasive pad. Opt. Precis. Eng. 2014, 22, 3004–3011. [Google Scholar] [CrossRef]
- Gagliardi, J.J.; Kim, D.; Sokol, J.J.; Zazzera, L.A.; Romero, V.D.; Atkinson, M.R.; Nabulsi, F.; Zhang, H. A case for 2-body material removal in prime LED sapphire substrate lapping and polishing. J. Manuf. Process. 2013, 15, 348–354. [Google Scholar] [CrossRef]
- Wang, Z.; Yang, Y.; Pang, M.; Li, Y.; Ma, L.; Yao, J.; Zhu, Y.; Su, J. Response surface model of processing parameters for lapping quartz glass with a fixed abrasive pad. Surf. Technol. 2021, 50, 376–385. [Google Scholar]
- Luo, X.; Yang, W.; Qian, Y. Fixed abrasive polishing: The effect of particle size on the workpiece roughness and sub-surface damage. Int. J. Adv. Manuf. Technol. 2021, 115, 3021–3035. [Google Scholar] [CrossRef]
- Lin, Z.; Yan, Z.; Xiao, M.; Zhu, X.; Cheng, D. Analysis of reciprocating friction signal based on Hilbert-Huang Transform. Lubr. Eng. 2015, 40, 92–96. [Google Scholar]
- Chen, Z.; Hu, Y.; Tian, S.; Lu, M.; Xu, L. Non-stationary signal combined analysis based fault diagnosis method. J. Commun. 2020, 41, 187–195. [Google Scholar]
- Zhang, H.; Yin, Y.; Yin, K. Non-Stationary Signals Analysis and Processing Based on Wavelet Transform. J. Nanjing Norm. Univ. 2014, 14, 63–69. [Google Scholar]
- Tang, F.; Liu, S. Research on fault feature extraction method of nonlinear non-stationary signal based on generalized local frequency. J. Mech. Eng. 2015, 51, 176. [Google Scholar]
- Xiong, S.; Zhou, H.; He, S.; Zhang, L.; Shi, T. Fault diagnosis of a rolling bearing based on the wavelet packet transform and a deep residual network with lightweight multi-branch structure. Meas. Sci. Technol. 2021, 32, 085106. [Google Scholar] [CrossRef]
- Habbouche, H.; Benkedjouh, T.; Zerhouni, N. Intelligent prognostics of bearings based on bidirectional long short-term memory and wavelet packet decomposition. Int. J. Adv. Manuf. Technol. 2021, 114, 145–157. [Google Scholar] [CrossRef]
- Han, J.; Zheng, P.; Wang, H. Structural modal parameter identification and damage diagnosis based on Hilbert-Huang transform. Earthq. Eng. Eng. Vib. 2014, 13, 101–111. [Google Scholar] [CrossRef]
- Lan, Z.; Zhao, Y.; Guo, J.; Zhou, Z.; Xing, J.; Bai, G.; Lu, H.; Li, H. The measurement and analysis of ice induced vibration of JZ9-3WHPB oil platform in Bohai Sea. Strateg. Study CAE 2011, 13, 79–87. [Google Scholar]
- Liu, Q.; Cao, X.; Xu, S. Research on fault diagnosis of rolling bearings based on wavelet packet transform and ELM. J. Saf. Environ. 2021, 21, 2466–2472. [Google Scholar]
- Xu, L. Study on Fault Detection of Rolling Element Bearing Based on Translation-Invariant Denoising and Hilbert-Huang Transform. J. Comput. 2012, 7, 1155–1162. [Google Scholar] [CrossRef]
- Li, G.B.; Ren, Z.Y.; Wang, H.Z.; Wei, H.J. Characteristics Extraction of Friction Vibration Signal Using Harmonic Wavelet Packet Transforms. J. Saf. Environ. 2011, 31, 452–456. [Google Scholar]
- Rabi, J.; Balusamy, T.; Jawahar, R.R. Analysis of vibration signal responses on pre induced tunnel defects in friction stir welding using wavelet transform and empirical mode decomposition. Def. Technol. 2019, 15, 885–896. [Google Scholar] [CrossRef]
- Guo, J.; Hang, D.; Zhu, X. Prediction of Crack Propagation in U-Rib Components Based on the Markov Chain. J. Bridge Eng. 2020, 25, 04020089. [Google Scholar] [CrossRef]
- Yang, Y.; Fu, P. Rolling-Element Bearing Fault Data Automatic Clustering Based on Wavelet and Deep Neural Network. Shock Vib. 2018, 2018, 3047830. [Google Scholar] [CrossRef]
- Guo, J.; Zhong, H. Vibration Analysis and Wavelet Packet Energy Ratio of Stay Cable Based on Measured Date. Bridge Constr. 2021, 51, 25–31. [Google Scholar]
- He, C.; Wu, T.; Gu, R.; Qu, H. Bearing fault diagnosis based on wavelet packet energy spectrum and SVM. J. Phys. Conf. Ser. 2020, 1684, 012135. [Google Scholar] [CrossRef]
- Zhang, Z.; Yao, P.; Zhang, Z.; Xue, D.; Wang, C.; Huang, C.; Zhu, H. A novel technique for dressing metal-bonded diamond grinding wheel with abrasive wateret and touch truing. Int. J. Adv. Manuf. 2017, 93, 3063–3073. [Google Scholar] [CrossRef]


| Parameter | Condition |
|---|---|
| Lapping fluid | Deionized water |
| Lapping pressure | 26.7 kPa |
| Slurry flow rate Speed | 50 mL/min 100 rpm |
| Parameter | Condition |
|---|---|
| Spindle speed | 150 r/min (100 rpm) |
| Pressure | 26.7 kPa |
| Wear time | 1 min |
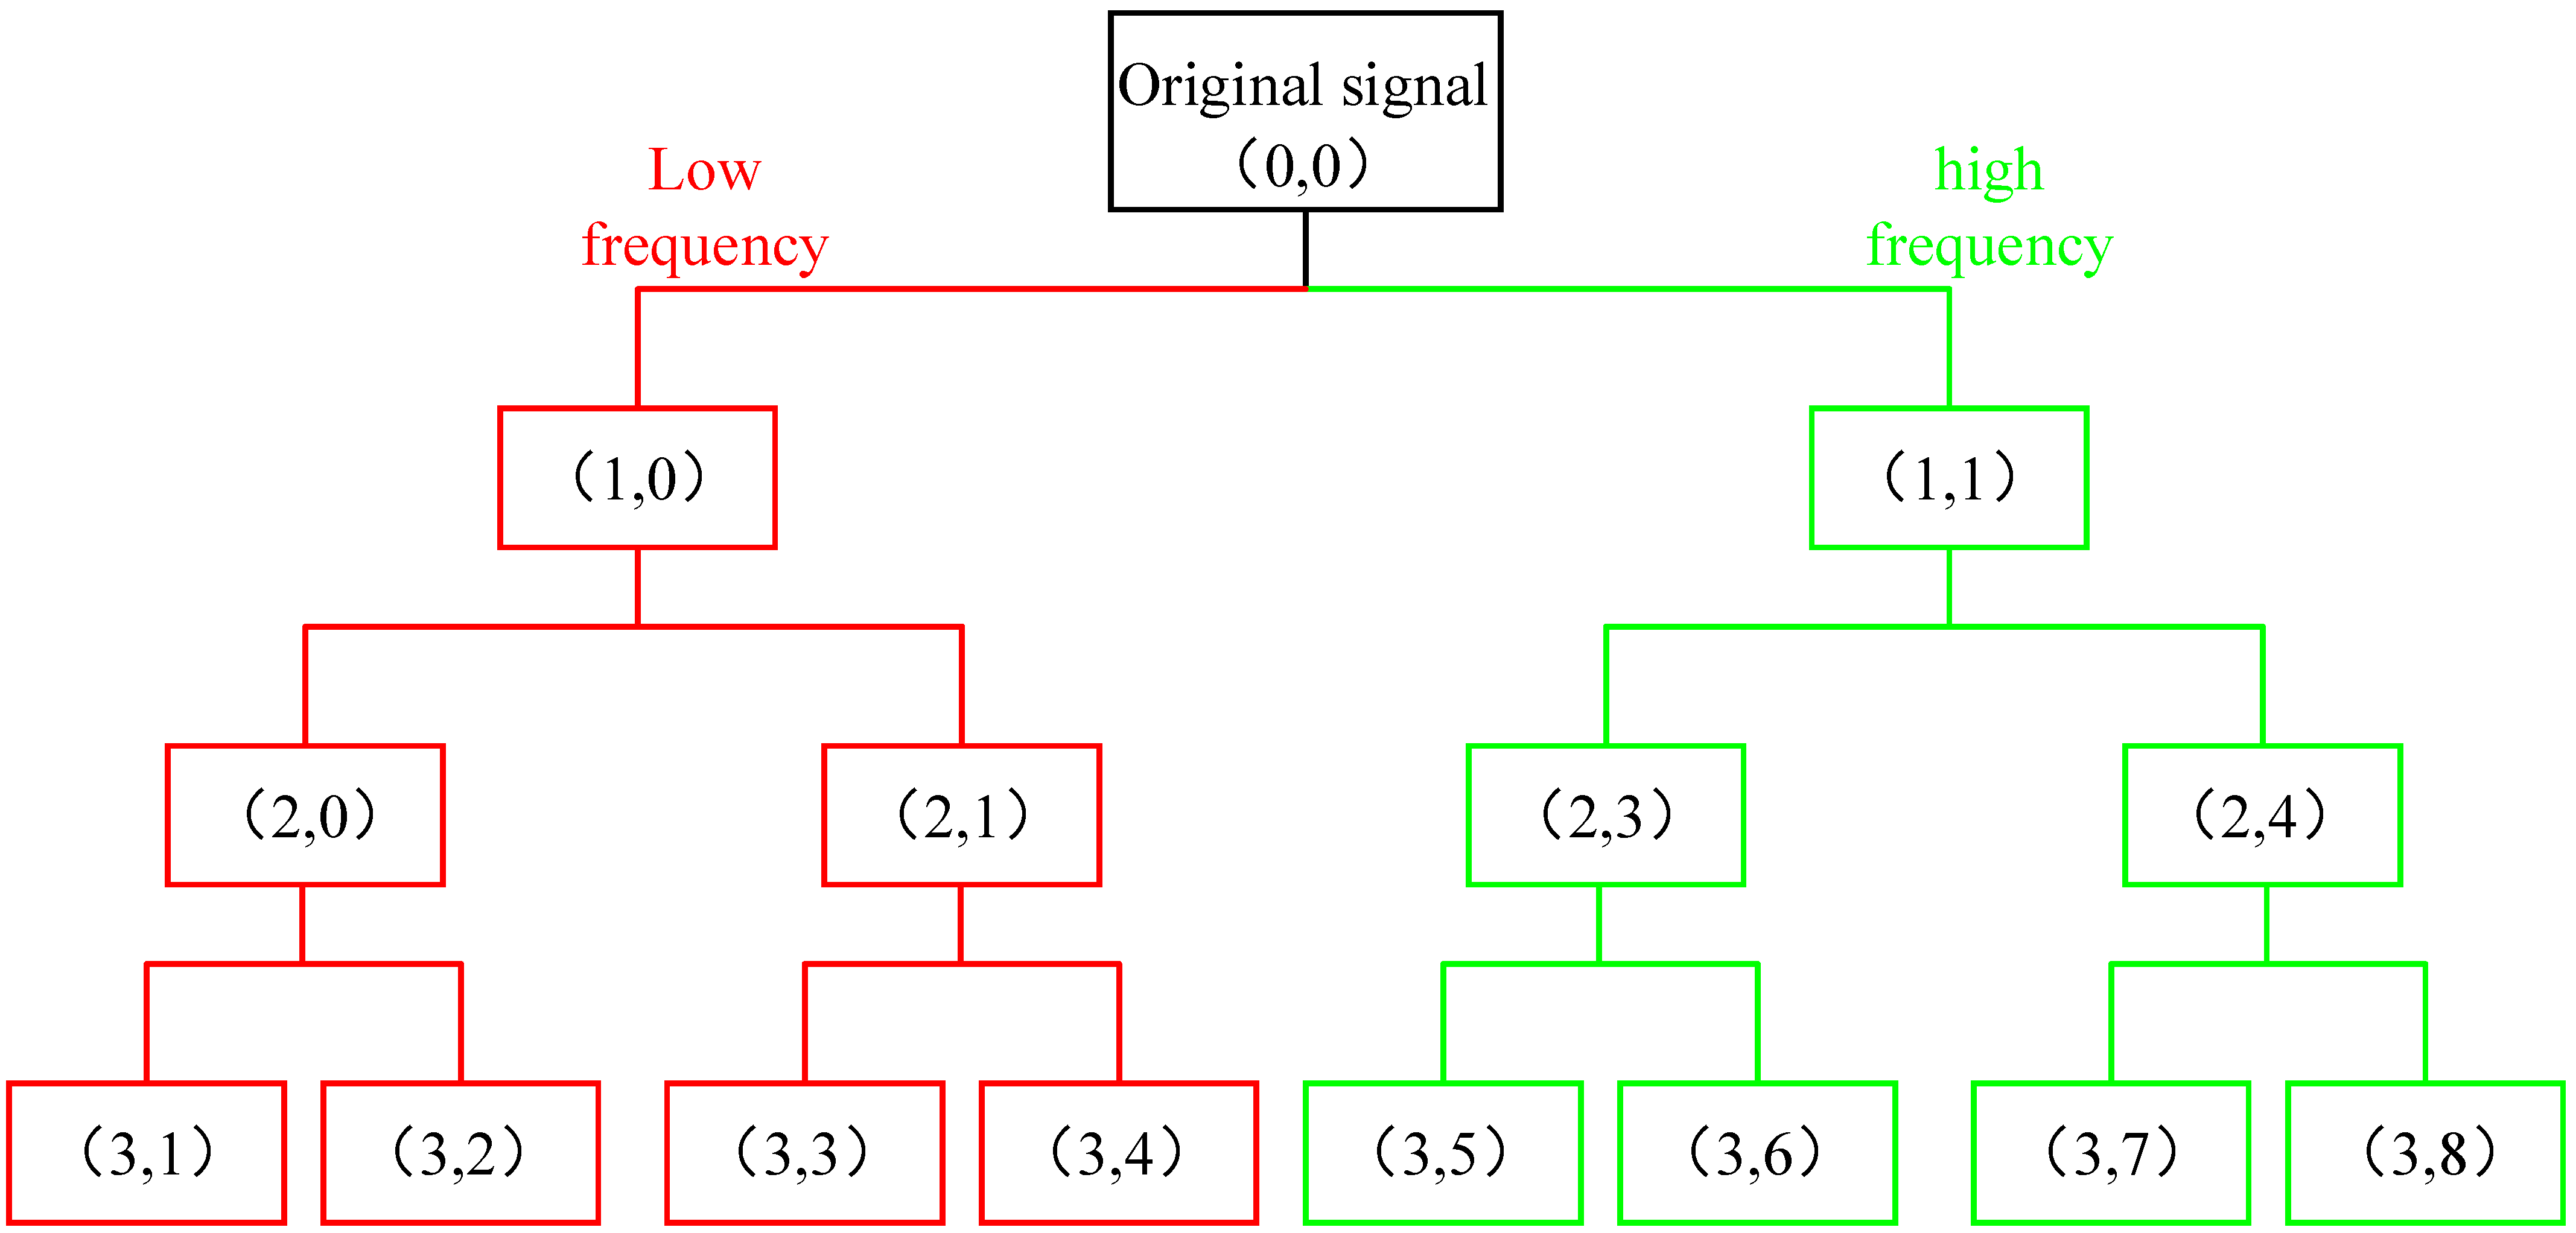
| Serial Number | 1 | 2 | 3 | 4 | 5 | 6 | 7 | 8 |
|---|---|---|---|---|---|---|---|---|
| Node | (3,1) | (3,2) | (3,3) | (3,4) | (3,5) | (3,6) | (3,7) | (3,8) |
| Frequency band (Hz) | 0–0.625 | 0.625–1.25 | 1.25–1.875 | 1.875–2.5 | 2.5–3.125 | 3.125–3.75 | 3.75–4.375 | 4.375–5 |
| Lapping Time | Sa/nm | Sp/nm | Sq/nm |
|---|---|---|---|
| 30 min | 1294.08 | 7855.92 | 1713.72 |
| 60 min | 966.01 | 6186.56 | 1372.41 |
| 90 min | 940.32 | 5778.66 | 1343.55 |
| 120 min | 873.51 | 5018.38 | 1251.19 |
| 150 min | 830.26 | 4629.98 | 1190.13 |
| 180 min | 782.09 | 3626.41 | 1100.47 |
| Lapping Time | Sa/nm |
|---|---|
| 30 min | 1028.838 |
| 60 min | 787.058 |
| 90 min | 697.936 |
| 120 min | 657.071 |
| 150 min | 577.03 |
| 180 min | 541.184 |
Publisher’s Note: MDPI stays neutral with regard to jurisdictional claims in published maps and institutional affiliations. |
© 2022 by the authors. Licensee MDPI, Basel, Switzerland. This article is an open access article distributed under the terms and conditions of the Creative Commons Attribution (CC BY) license (https://creativecommons.org/licenses/by/4.0/).
Share and Cite
Wang, Z.; Zhang, Z.; Wang, S.; Pang, M.; Ma, L.; Su, J. Study on Wavelet Packet Energy Characteristics on Friction Signal of Lapping with the Fixed Abrasive Pad. Micromachines 2022, 13, 981. https://doi.org/10.3390/mi13070981
Wang Z, Zhang Z, Wang S, Pang M, Ma L, Su J. Study on Wavelet Packet Energy Characteristics on Friction Signal of Lapping with the Fixed Abrasive Pad. Micromachines. 2022; 13(7):981. https://doi.org/10.3390/mi13070981
Chicago/Turabian StyleWang, Zhankui, Zhao Zhang, Shiwei Wang, Minghua Pang, Lijie Ma, and Jianxiu Su. 2022. "Study on Wavelet Packet Energy Characteristics on Friction Signal of Lapping with the Fixed Abrasive Pad" Micromachines 13, no. 7: 981. https://doi.org/10.3390/mi13070981