
The Effect of Dynamic, In Vivo-like Oxaliplatin on HCT116 Spheroids in a Cancer-on-Chip Model Is Representative of the Response in Xenografts

 and
and 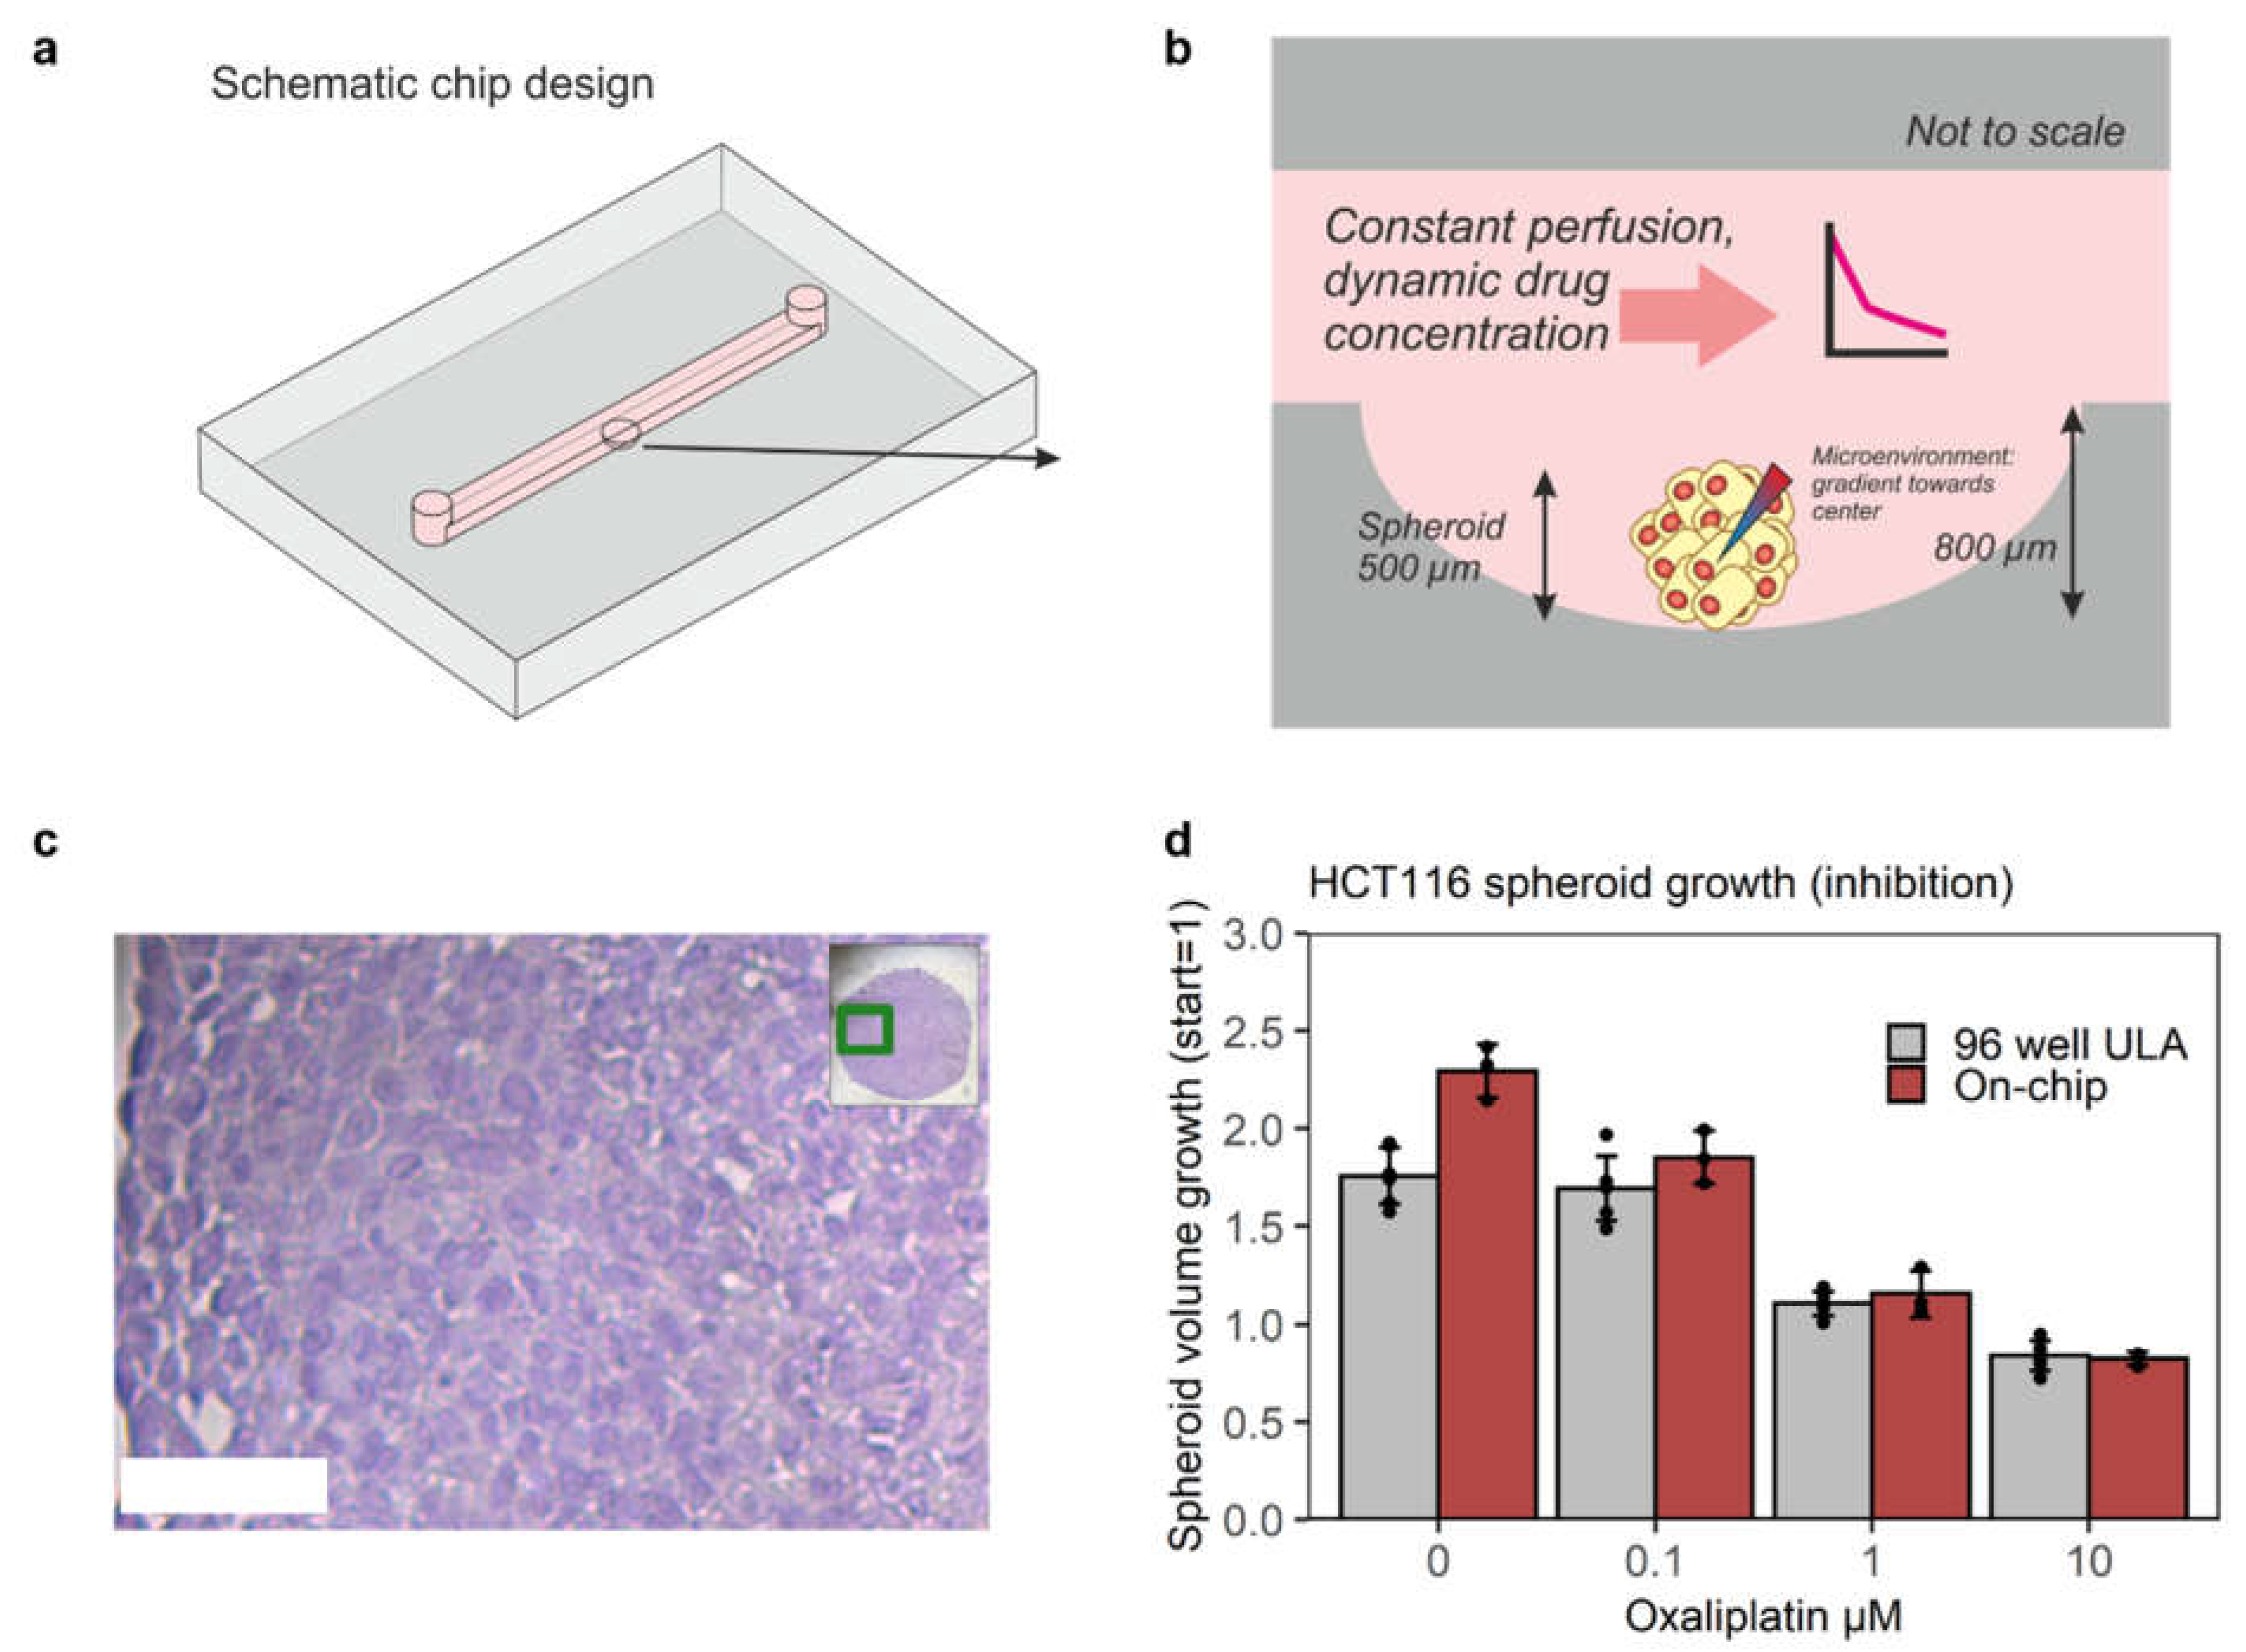
Abstract
:1. Introduction
2. Materials and Methods
2.1. Device Design and Fabrication
2.2. Cell and Spheroid Culture
2.3. Chip Experiments
2.4. Histopathology
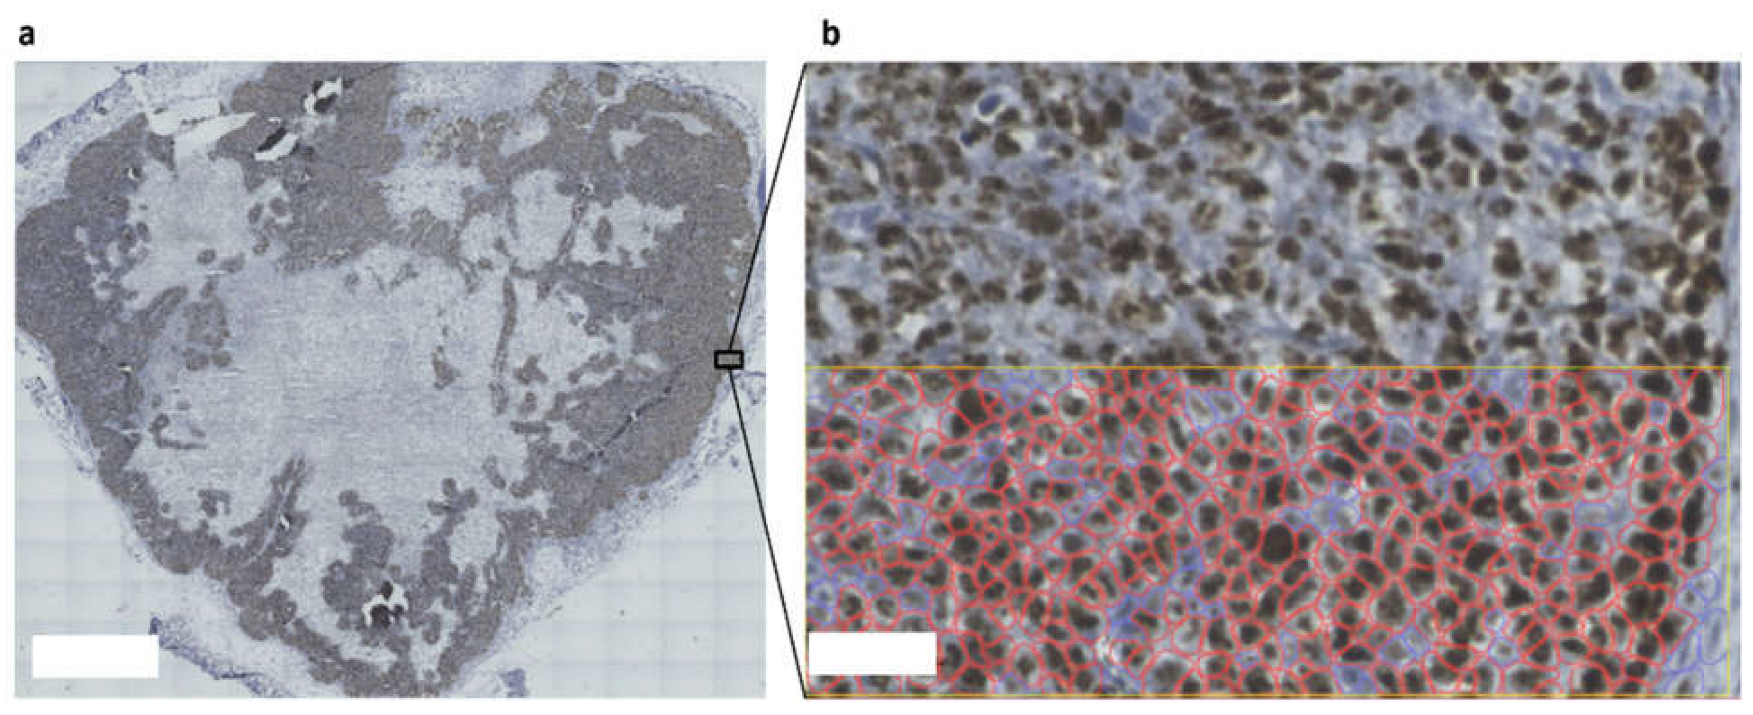
2.5. Imaging and Analyses
2.6. Xenograft Data
3. Results and Discussion
3.1. Chip Design and Validation for Mimicking Xenograft Drug Response On-Chip
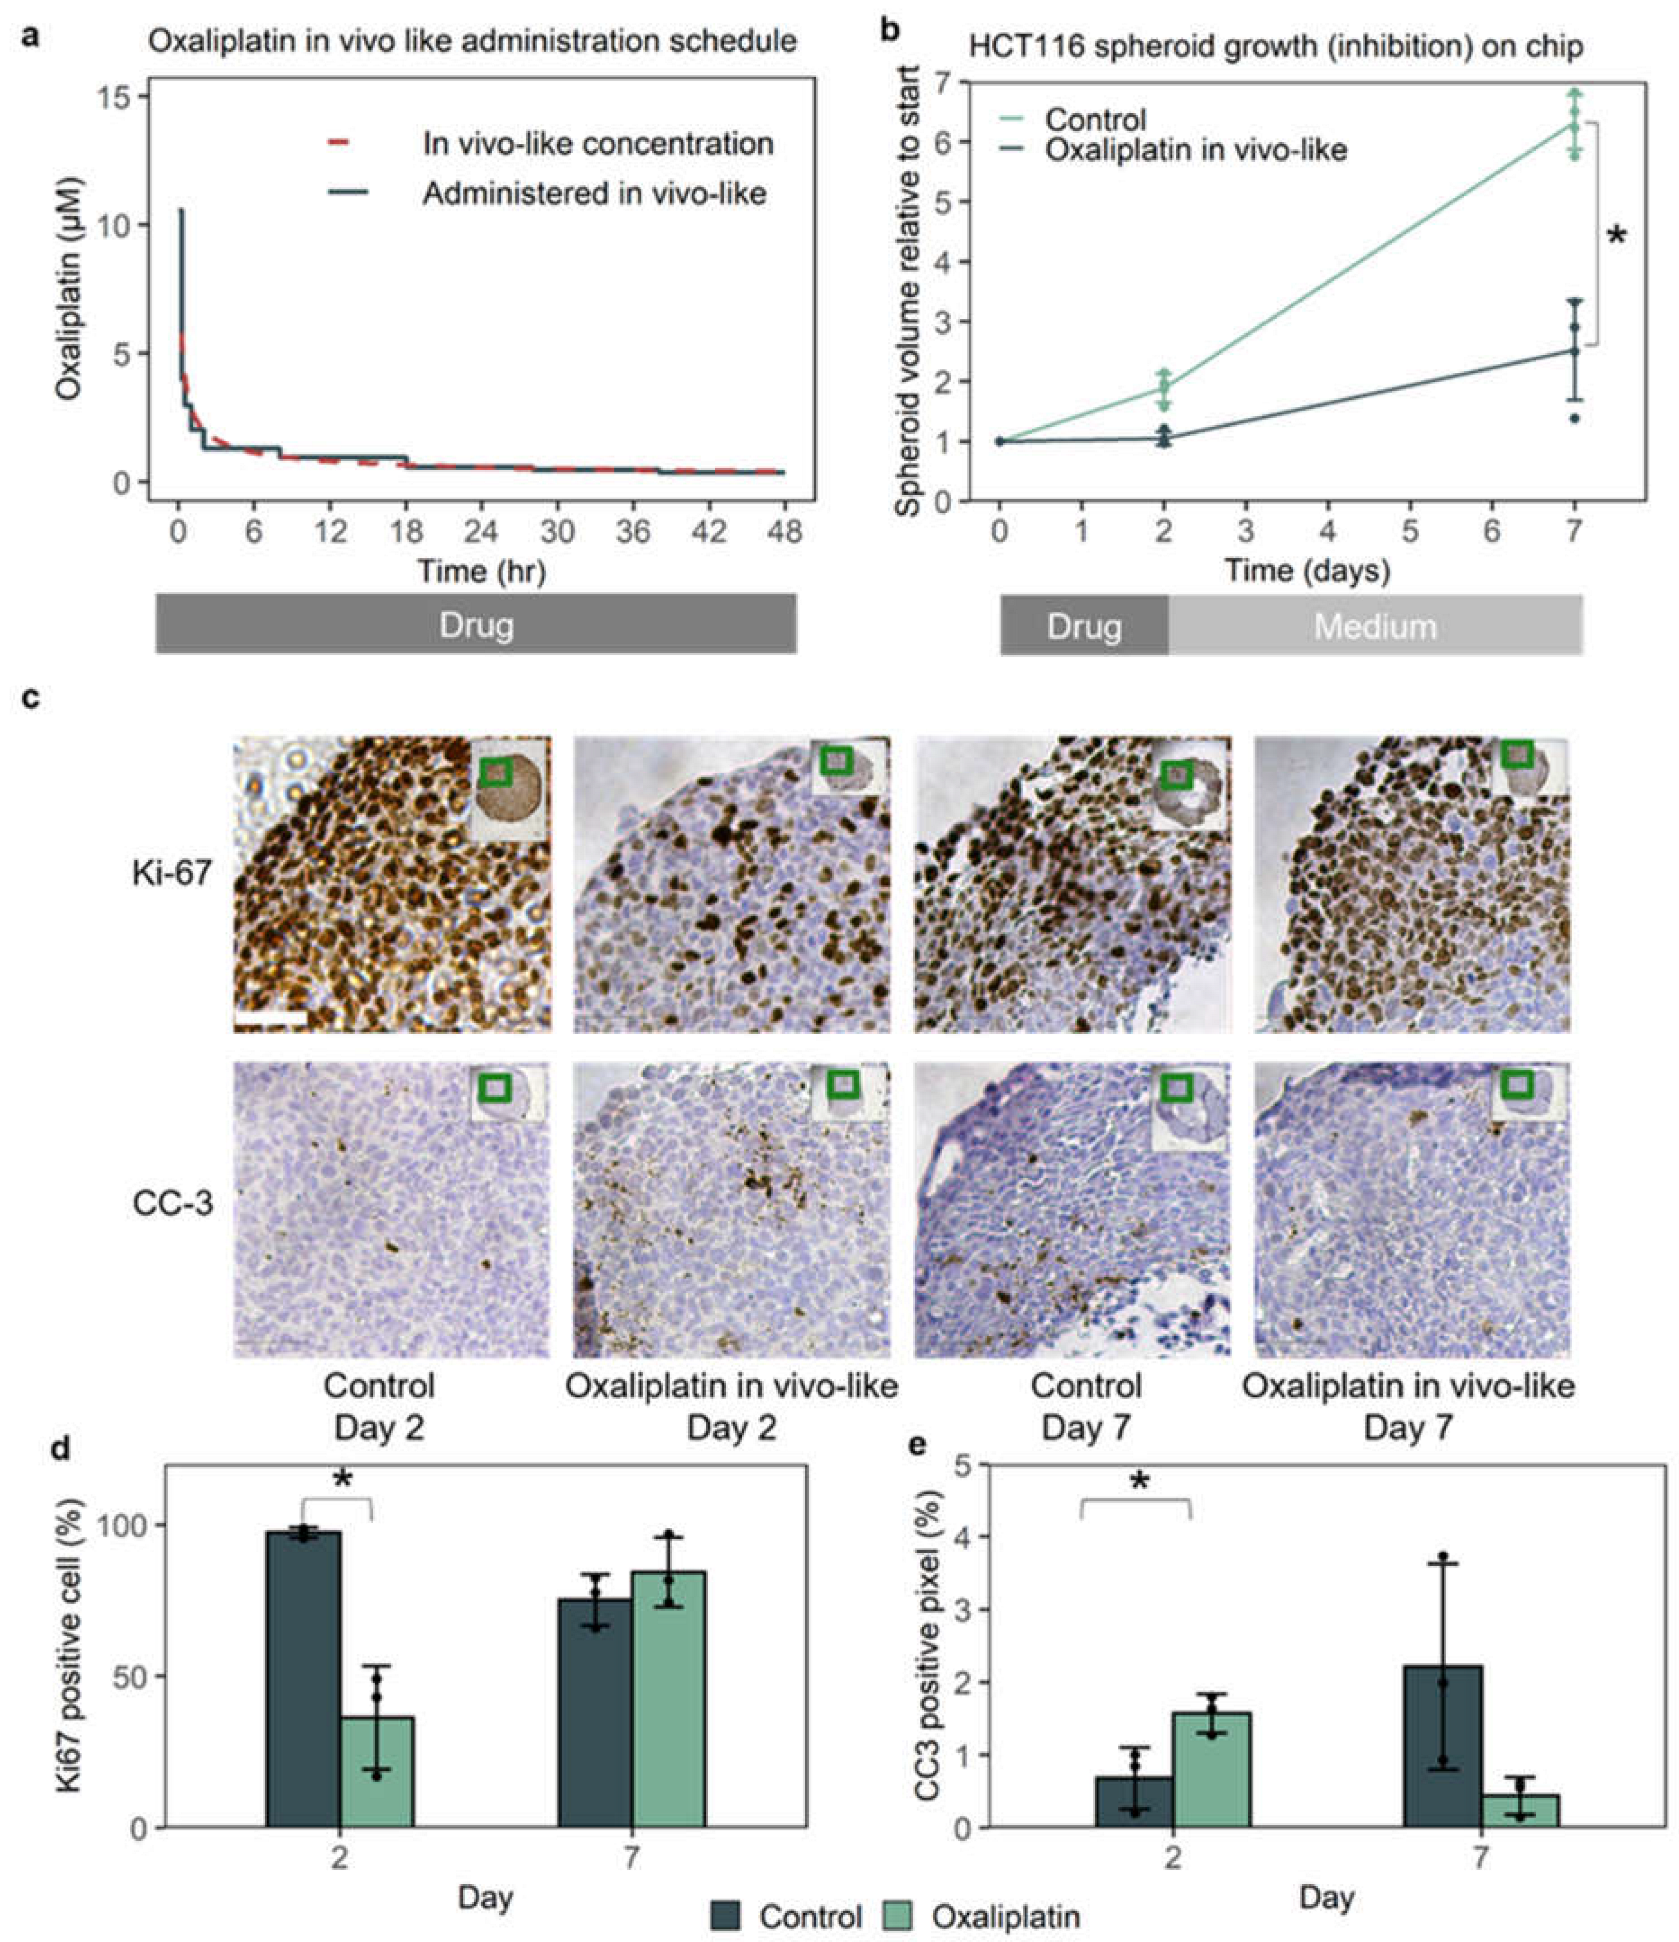
3.2. In Vivo-like Oxaliplatin Led to 70% Growth Inhibition On-Chip, with a Temporary Halt of Growth
3.3. The Cancer-On-Chip Model Recapitulates Drug Response as It Is Representative of Proliferating Cells in the HCT116 Xenograft
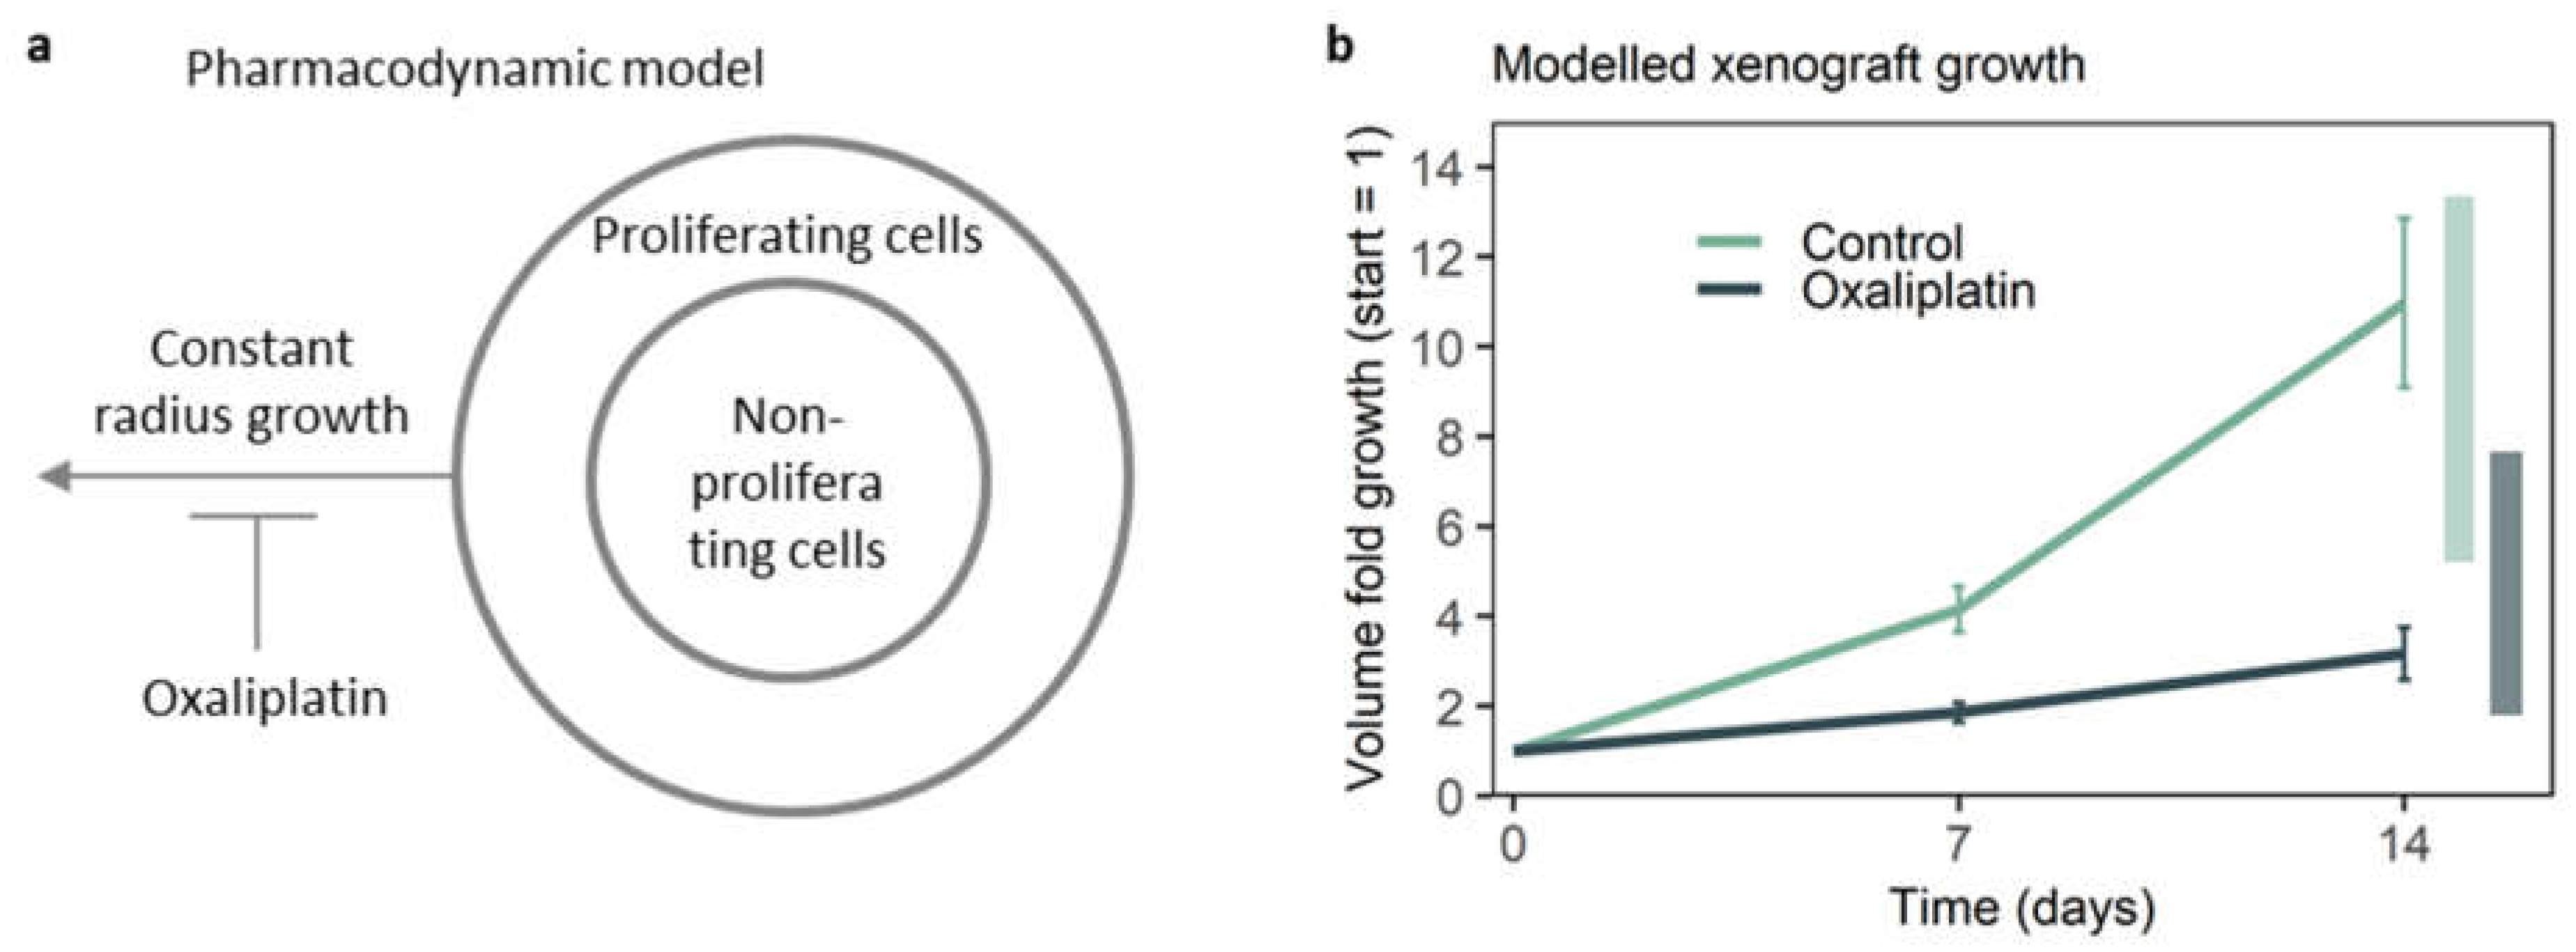
3.4. A Pharmacodynamic Model Further Validates the Representativeness of On-Chip Growth Inhibition
4. Conclusions
Supplementary Materials
Author Contributions
Funding
Data Availability Statement
Conflicts of Interest
References
- Dagenais, G.R.; Leong, D.P.; Rangarajan, S.; Lanas, F.; Lopez-Jaramillo, P.; Gupta, R.; Diaz, R.; Avezum, A.; Oliveira, G.B.F.; Wielgosz, A.; et al. Variations in common diseases, hospital admissions, and deaths in middle-aged adults in 21 countries from five continents (PURE): A prospective cohort study. Lancet 2020, 395, 785–794. [Google Scholar] [CrossRef]
- Abbema, D.V.; Vissers, P.; Vos-Geelen, J.; Lemmens, V.; Janssen-Heijnen, M.; Tjan-Heijnen, V. Trends in Overall Survival and Treatment Patterns in Two Large Population-Based Cohorts of Patients with Breast and Colorectal Cancer. Cancers 2019, 11, 1239. [Google Scholar] [CrossRef] [PubMed] [Green Version]
- Wong, C.H.; Siah, K.W.; Lo, A.W. Estimation of clinical trial success rates and related parameters. Biostatistics 2019, 20, 273–286. [Google Scholar] [CrossRef] [PubMed]
- McIntyre, R.E.; Buczacki, S.J.; Arends, M.J.; Adams, D.J. Mouse models of colorectal cancer as preclinical models. BioEssays News Rev. Mol. Cell. Dev. Biol. 2015, 37, 909–920. [Google Scholar] [CrossRef] [Green Version]
- Gengenbacher, N.; Singhal, M.; Augustin, H.G. Preclinical mouse solid tumour models: Status quo, challenges and perspectives. Nat. Rev. Cancer 2017, 17, 751–765. [Google Scholar] [CrossRef]
- Hutchinson, L.; Kirk, R. High drug attrition rates—Where are we going wrong? Nat. Rev. Clin. Oncol. 2011, 8, 189–190. [Google Scholar] [CrossRef]
- Hung, P.J.; Lee, P.J.; Sabounchi, P.; Lin, R.; Lee, L.P. Continuous perfusion microfluidic cell culture array for high-throughput cell-based assays. Biotechnol. Bioeng. 2005, 89, 1–8. [Google Scholar] [CrossRef]
- Jeong, S.Y.; Lee, J.H.; Shin, Y.; Chung, S.; Kuh, H.J. Co-Culture of Tumor Spheroids and Fibroblasts in a Collagen Matrix-Incorporated Microfluidic Chip Mimics Reciprocal Activation in Solid Tumor Microenvironment. PLoS ONE 2016, 11, e0159013. [Google Scholar] [CrossRef] [Green Version]
- Ayuso, J.M.; Virumbrales-Munoz, M.; Lacueva, A.; Lanuza, P.M.; Checa-Chavarria, E.; Botella, P.; Fernandez, E.; Doblare, M.; Allison, S.J.; Phillips, R.M.; et al. Development and characterization of a microfluidic model of the tumour microenvironment. Sci. Rep. 2016, 6, 36086. [Google Scholar] [CrossRef]
- Hassell, B.A.; Goyal, G.; Lee, E.; Sontheimer-Phelps, A.; Levy, O.; Chen, C.S.; Ingber, D.E. Human Organ Chip Models Recapitulate Orthotopic Lung Cancer Growth, Therapeutic Responses, and Tumor Dormancy In Vitro. Cell Rep. 2017, 21, 508–516. [Google Scholar] [CrossRef] [Green Version]
- Nashimoto, Y.; Okada, R.; Hanada, S.; Arima, Y.; Nishiyama, K.; Miura, T.; Yokokawa, R. Vascularized cancer on a chip: The effect of perfusion on growth and drug delivery of tumor spheroid. Biomaterials 2020, 229, 119547. [Google Scholar] [CrossRef]
- Sontheimer-Phelps, A.; Hassell, B.A.; Ingber, D.E. Modelling cancer in microfluidic human organs-on-chips. Nat. Rev. Cancer 2019, 19, 65–81. [Google Scholar] [CrossRef]
- Lohasz, C.; Frey, O.; Bonanini, F.; Renggli, K.; Hierlemann, A. Tubing-Free Microfluidic Microtissue Culture System Featuring Gradual, in vivo-Like Substance Exposure Profiles. Front. Bioeng. Biotechnol. 2019, 7, 72. [Google Scholar] [CrossRef]
- Komen, J.; Westerbeek, E.Y.; Kolkman, R.W.; Roesthuis, J.; Lievens, C.; van den Berg, A.; van der Meer, A.D. Controlled pharmacokinetic anti-cancer drug concentration profiles lead to growth inhibition of colorectal cancer cells in a microfluidic device. Lab A Chip 2020, 20, 3167–3178. [Google Scholar] [CrossRef]
- Komen, J.; van Neerven, S.M.; van den Berg, A.; Vermeulen, L.; van der Meer, A.D. Mimicking and surpassing the xenograft model with cancer-on-chip technology. EBioMedicine 2021, 66, 103303. [Google Scholar] [CrossRef]
- Ivanova, E.; Kuraguchi, M.; Xu, M.; Portell, A.J.; Taus, L.; Diala, I.; Lalani, A.S.; Choi, J.; Chambers, E.S.; Li, S.; et al. Use of Ex Vivo Patient-Derived Tumor Organotypic Spheroids to Identify Combination Therapies for HER2 Mutant Non-Small Cell Lung Cancer. Clin. Cancer Res. Off. J. Am. Assoc. Cancer Res. 2020, 26, 2393–2403. [Google Scholar] [CrossRef] [Green Version]
- Petreus, T.; Cadogan, E.; Hughes, G.; Smith, A.; Reddy, V.P.; Lau, A.; O’Connor, M.J.; Critchlow, S.; Ashford, M.; O’Connor, L.O. Tumour-on-chip microfluidic platform for assessment of drug pharmacokinetics and treatment response. Commun. Biol. 2021, 4, 1001. [Google Scholar] [CrossRef]
- Hachey, S.J.; Movsesyan, S.; Nguyen, Q.H.; Burton-Sojo, G.; Tankazyan, A.; Wu, J.; Hoang, T.; Zhao, D.; Wang, S.; Hatch, M.M.; et al. An in vitro vascularized micro-tumor model of human colorectal cancer recapitulates in vivo responses to standard-of-care therapy. Lab A Chip 2021, 21, 1333–1351. [Google Scholar] [CrossRef]
- Gioeli, D.; Snow, C.J.; Simmers, M.B.; Hoang, S.A.; Figler, R.A.; Allende, J.A.; Roller, D.G.; Parsons, J.T.; Wulfkuhle, J.D.; Petricoin, E.F.; et al. Development of a multicellular pancreatic tumor microenvironment system using patient-derived tumor cells. Lab A Chip 2019, 19, 1193–1204. [Google Scholar] [CrossRef] [Green Version]
- Nürnberg, E.; Vitacolonna, M.; Klicks, J.; von Molitor, E.; Cesetti, T.; Keller, F.; Bruch, R.; Ertongur-Fauth, T.; Riedel, K.; Scholz, P.; et al. Routine Optical Clearing of 3D-Cell Cultures: Simplicity Forward. Front. Mol. Biosci. 2020, 7, 20. [Google Scholar] [CrossRef]
- Liu, W.; Liu, D.; Hu, R.; Huang, Z.; Sun, M.; Han, K. An integrated microfluidic 3D tumor system for parallel and high-throughput chemotherapy evaluation. Analyst 2020, 145, 6447–6455. [Google Scholar] [CrossRef]
- Hecker, M.; Ting, M.S.H.; Malmström, J. Simple Coatings to Render Polystyrene Protein Resistant. Coatings 2018, 8, 55. [Google Scholar] [CrossRef]
- Liu, V.A.; Jastromb, W.E.; Bhatia, S.N. Engineering protein and cell adhesivity using PEO-terminated triblock polymers. J. Biomed. Mater. Res. 2002, 60, 126–134. [Google Scholar] [CrossRef]
- Wang, J.C.; Liu, W.; Tu, Q.; Ma, C.; Zhao, L.; Wang, Y.; Ouyang, J.; Pang, L.; Wang, J. High throughput and multiplex localization of proteins and cells for in situ micropatterning using pneumatic microfluidics. Analyst 2015, 140, 827–836. [Google Scholar] [CrossRef]
- Ivanov, D.P.; Parker, T.L.; Walker, D.A.; Alexander, C.; Ashford, M.B.; Gellert, P.R.; Garnett, M.C. Multiplexing spheroid volume, resazurin and acid phosphatase viability assays for high-throughput screening of tumour spheroids and stem cell neurospheres. PLoS ONE 2014, 9, e103817. [Google Scholar] [CrossRef] [Green Version]
- Zhang, R.; Song, X.Q.; Liu, R.P.; Ma, Z.Y.; Xu, J.Y. Fuplatin: An Efficient and Low-Toxic Dual-Prodrug. J. Med. Chem. 2019, 62, 4543–4554. [Google Scholar] [CrossRef]
- Bankhead, P.; Loughrey, M.B.; Fernández, J.A.; Dombrowski, Y.; McArt, D.G.; Dunne, P.D.; McQuaid, S.; Gray, R.T.; Murray, L.J.; Coleman, H.G.; et al. QuPath: Open source software for digital pathology image analysis. Sci. Rep. 2017, 7, 16878. [Google Scholar] [CrossRef] [Green Version]
- Robertson, S.; Acs, B.; Lippert, M.; Hartman, J. Prognostic potential of automated Ki67 evaluation in breast cancer: Different hot spot definitions versus true global score. Breast Cancer Res. Treat. 2020, 183, 161–175. [Google Scholar] [CrossRef]
- Nagaraju, G.P.; Alese, O.B.; Landry, J.; Diaz, R.; El-Rayes, B.F. HSP90 inhibition downregulates thymidylate synthase and sensitizes colorectal cancer cell lines to the effect of 5FU-based chemotherapy. Oncotarget 2014, 5, 9980–9991. [Google Scholar] [CrossRef] [Green Version]
- Threatt, S.D.; Synold, T.W.; Wu, J.; Barton, J.K. In vivo anticancer activity of a rhodium metalloinsertor in the HCT116 xenograft tumor model. Proc. Natl. Acad. Sci. USA 2020, 117, 17535–17542. [Google Scholar] [CrossRef]
- Liang, J.; Cheng, Q.; Huang, J.; Ma, M.; Zhang, D.; Lei, X.; Xiao, Z.; Zhang, D.; Shi, C.; Luo, L. Monitoring tumour microenvironment changes during anti-angiogenesis therapy using functional MRI. Angiogenesis 2019, 22, 457–470. [Google Scholar] [CrossRef] [PubMed]
- de Bruijn, M.T.; Raats, D.A.; Hoogwater, F.J.; van Houdt, W.J.; Cameron, K.; Medema, J.P.; Borel Rinkes, I.H.; Kranenburg, O. Oncogenic KRAS sensitises colorectal tumour cells to chemotherapy by p53-dependent induction of Noxa. Br. J. Cancer 2010, 102, 1254–1264. [Google Scholar] [CrossRef] [PubMed] [Green Version]
- Xu, K.; Chen, G.; Qiu, Y.; Yuan, Z.; Li, H.; Yuan, X.; Sun, J.; Xu, J.; Liang, X.; Yin, P. miR-503-5p confers drug resistance by targeting PUMA in colorectal carcinoma. Oncotarget 2017, 8, 21719–21732. [Google Scholar] [CrossRef] [Green Version]
- Shelton, J.W.; Waxweiler, T.V.; Landry, J.; Gao, H.; Xu, Y.; Wang, L.; El-Rayes, B.; Shu, H.K. In vitro and in vivo enhancement of chemoradiation using the oral PARP inhibitor ABT-888 in colorectal cancer cells. Int. J. Radiat. Oncol. Biol. Phys. 2013, 86, 469–476. [Google Scholar] [CrossRef] [PubMed]
- Linnekamp, J.F.; Hooff, S.R.V.; Prasetyanti, P.R.; Kandimalla, R.; Buikhuisen, J.Y.; Fessler, E.; Ramesh, P.; Lee, K.; Bochove, G.G.W.; de Jong, J.H.; et al. Consensus molecular subtypes of colorectal cancer are recapitulated in in vitro and in vivo models. Cell Death Differ. 2018, 25, 616–633. [Google Scholar] [CrossRef] [PubMed]
- Li, S.; Chen, Y.; Zhang, S.; More, S.S.; Huang, X.; Giacomini, K.M. Role of organic cation transporter 1, OCT1 in the pharmacokinetics and toxicity of cis-diammine(pyridine)chloroplatinum(II) and oxaliplatin in mice. Pharm. Res. 2011, 28, 610–625. [Google Scholar] [CrossRef] [Green Version]
- Boughattas, N.A.; Hecquet, B.; Fournier, C.; Bruguerolle, B.; Trabelsi, H.; Bouzouita, K.; Omrane, B.; Lévi, F. Comparative pharmacokinetics of oxaliplatin (L-OHP) and carboplatin (CBDCA) in mice with reference to circadian dosing time. Biopharm. Drug Dispos. 1994, 15, 761–773. [Google Scholar] [CrossRef]
- Casalini, T.; Salvalaglio, M.; Perale, G.; Masi, M.; Cavallotti, C. Diffusion and aggregation of sodium fluorescein in aqueous solutions. J. Phys. Chemistry. B 2011, 115, 12896–12904. [Google Scholar] [CrossRef] [Green Version]
- Modok, S.; Scott, R.; Alderden, R.A.; Hall, M.D.; Mellor, H.R.; Bohic, S.; Roose, T.; Hambley, T.W.; Callaghan, R. Transport kinetics of four- and six-coordinate platinum compounds in the multicell layer tumour model. Br. J. Cancer 2007, 97, 194–200. [Google Scholar] [CrossRef] [Green Version]
- Paguirigan, A.L.; Beebe, D.J. From the cellular perspective: Exploring differences in the cellular baseline in macroscale and microfluidic cultures. Integr. Biol. Quant. Biosci. Nano Macro 2009, 1, 182–195. [Google Scholar] [CrossRef] [Green Version]
- Hector, A.; Von Felten, S.; Schmid, B. Analysis of variance with unbalanced data: An update for ecology & evolution. J. Anim. Ecol. 2010, 79, 308–316. [Google Scholar] [CrossRef]
- NCI-60 Screening Methodology. Available online: https://dtp.cancer.gov/discovery_development/nci-60/methodology.htm (accessed on 10 March 2020).
- Heuberger, J.; Schmidt, S.; Derendorf, H. When is protein binding important? J. Pharm. Sci. 2013, 102, 3458–3467. [Google Scholar] [CrossRef]
- Sun, W.; Li, J.; Zhou, L.; Han, J.; Liu, R.; Zhang, H.; Ning, T.; Gao, Z.; Liu, B.; Chen, X.; et al. The c-Myc/miR-27b-3p/ATG10 regulatory axis regulates chemoresistance in colorectal cancer. Theranostics 2020, 10, 1981–1996. [Google Scholar] [CrossRef]
- Huxham, L.A.; Kyle, A.H.; Baker, J.H.; Nykilchuk, L.K.; Minchinton, A.I. Microregional effects of gemcitabine in HCT-116 xenografts. Cancer Res. 2004, 64, 6537–6541. [Google Scholar] [CrossRef] [Green Version]
- Bokemeyer, C.; Bondarenko, I.; Makhson, A.; Hartmann, J.T.; Aparicio, J.; Braud, F.d.; Donea, S.; Ludwig, H.; Schuch, G.; Stroh, C.; et al. Fluorouracil, Leucovorin, and Oxaliplatin with and Without Cetuximab in the First-Line Treatment of Metastatic Colorectal Cancer. J. Clin. Oncol. 2009, 27, 663–671. [Google Scholar] [CrossRef] [Green Version]
- Koopman, M.; Antonini, N.F.; Douma, J.; Wals, J.; Honkoop, A.H.; Erdkamp, F.L.; de Jong, R.S.; Rodenburg, C.J.; Vreugdenhil, G.; Loosveld, O.J.; et al. Sequential versus combination chemotherapy with capecitabine, irinotecan, and oxaliplatin in advanced colorectal cancer (CAIRO): A phase III randomised controlled trial. Lancet 2007, 370, 135–142. [Google Scholar] [CrossRef]
- Forster, J.C.; Harriss-Phillips, W.M.; Douglass, M.J.; Bezak, E. A review of the development of tumor vasculature and its effects on the tumor microenvironment. Hypoxia (Auckl. N.Z.) 2017, 5, 21–32. [Google Scholar] [CrossRef] [Green Version]
- Kyle, A.H.; Baker, J.H.; Gandolfo, M.J.; Reinsberg, S.A.; Minchinton, A.I. Tissue penetration and activity of camptothecins in solid tumor xenografts. Mol. Cancer Ther. 2014, 13, 2727–2737. [Google Scholar] [CrossRef] [Green Version]
- Lenos, K.J.; Miedema, D.M.; Lodestijn, S.C.; Nijman, L.E.; van den Bosch, T.; Romero Ros, X.; Lourenco, F.C.; Lecca, M.C.; van der Heijden, M.; van Neerven, S.M.; et al. Stem cell functionality is microenvironmentally defined during tumour expansion and therapy response in colon cancer. Nat. Cell Biol. 2018, 20, 1193–1202. [Google Scholar] [CrossRef]
- Elmore, S.A.; Dixon, D.; Hailey, J.R.; Harada, T.; Herbert, R.A.; Maronpot, R.R.; Nolte, T.; Rehg, J.E.; Rittinghausen, S.; Rosol, T.J.; et al. Recommendations from the INHAND Apoptosis/Necrosis Working Group. Toxicol. Pathol. 2016, 44, 173–188. [Google Scholar] [CrossRef] [Green Version]
- Jusko, W.J. A pharmacodynamic model for cell-cycle-specific chemotherapeutic agents. J. Pharmacokinet. Biopharm. 1973, 1, 175–200. [Google Scholar] [CrossRef]
- Lobo, E.D.; Balthasar, J.P. Pharmacodynamic modeling of chemotherapeutic effects: Application of a transit compartment model to characterize methotrexate effects in vitro. AAPS PharmSci 2002, 4, 212–222. [Google Scholar] [CrossRef] [Green Version]
- van der Heijden, M.; Miedema, D.M.; Waclaw, B.; Veenstra, V.L.; Lecca, M.C.; Nijman, L.E.; van Dijk, E.; van Neerven, S.M.; Lodestijn, S.C.; Lenos, K.J.; et al. Spatiotemporal regulation of clonogenicity in colorectal cancer xenografts. Proc. Natl. Acad. Sci. USA 2019, 116, 6140–6145. [Google Scholar] [CrossRef] [Green Version]
- Stylianopoulos, T.; Martin, J.D.; Chauhan, V.P.; Jain, S.R.; Diop-Frimpong, B.; Bardeesy, N.; Smith, B.L.; Ferrone, C.R.; Hornicek, F.J.; Boucher, Y.; et al. Causes, consequences, and remedies for growth-induced solid stress in murine and human tumors. Proc. Natl. Acad. Sci. USA 2012, 109, 15101–15108. [Google Scholar] [CrossRef] [PubMed] [Green Version]
- Ayers, G.D.; McKinley, E.T.; Zhao, P.; Fritz, J.M.; Metry, R.E.; Deal, B.C.; Adlerz, K.M.; Coffey, R.J.; Manning, H.C. Volume of preclinical xenograft tumors is more accurately assessed by ultrasound imaging than manual caliper measurements. J. Ultrasound Med. Off. J. Am. Inst. Ultrasound Med. 2010, 29, 891–901. [Google Scholar] [CrossRef] [PubMed]


Publisher’s Note: MDPI stays neutral with regard to jurisdictional claims in published maps and institutional affiliations. |
© 2022 by the authors. Licensee MDPI, Basel, Switzerland. This article is an open access article distributed under the terms and conditions of the Creative Commons Attribution (CC BY) license (https://creativecommons.org/licenses/by/4.0/).
Share and Cite
Komen, J.; van Neerven, S.M.; Bossink, E.G.B.M.; de Groot, N.E.; Nijman, L.E.; van den Berg, A.; Vermeulen, L.; van der Meer, A.D. The Effect of Dynamic, In Vivo-like Oxaliplatin on HCT116 Spheroids in a Cancer-on-Chip Model Is Representative of the Response in Xenografts. Micromachines 2022, 13, 739. https://doi.org/10.3390/mi13050739
Komen J, van Neerven SM, Bossink EGBM, de Groot NE, Nijman LE, van den Berg A, Vermeulen L, van der Meer AD. The Effect of Dynamic, In Vivo-like Oxaliplatin on HCT116 Spheroids in a Cancer-on-Chip Model Is Representative of the Response in Xenografts. Micromachines. 2022; 13(5):739. https://doi.org/10.3390/mi13050739
Chicago/Turabian StyleKomen, Job, Sanne M. van Neerven, Elsbeth G. B. M. Bossink, Nina E. de Groot, Lisanne E. Nijman, Albert van den Berg, Louis Vermeulen, and Andries D. van der Meer. 2022. "The Effect of Dynamic, In Vivo-like Oxaliplatin on HCT116 Spheroids in a Cancer-on-Chip Model Is Representative of the Response in Xenografts" Micromachines 13, no. 5: 739. https://doi.org/10.3390/mi13050739