
Optimization and Fabrication of Multi-Level Microchannels for Long-Term Imaging of Bacterial Growth and Expansion

 , , , and
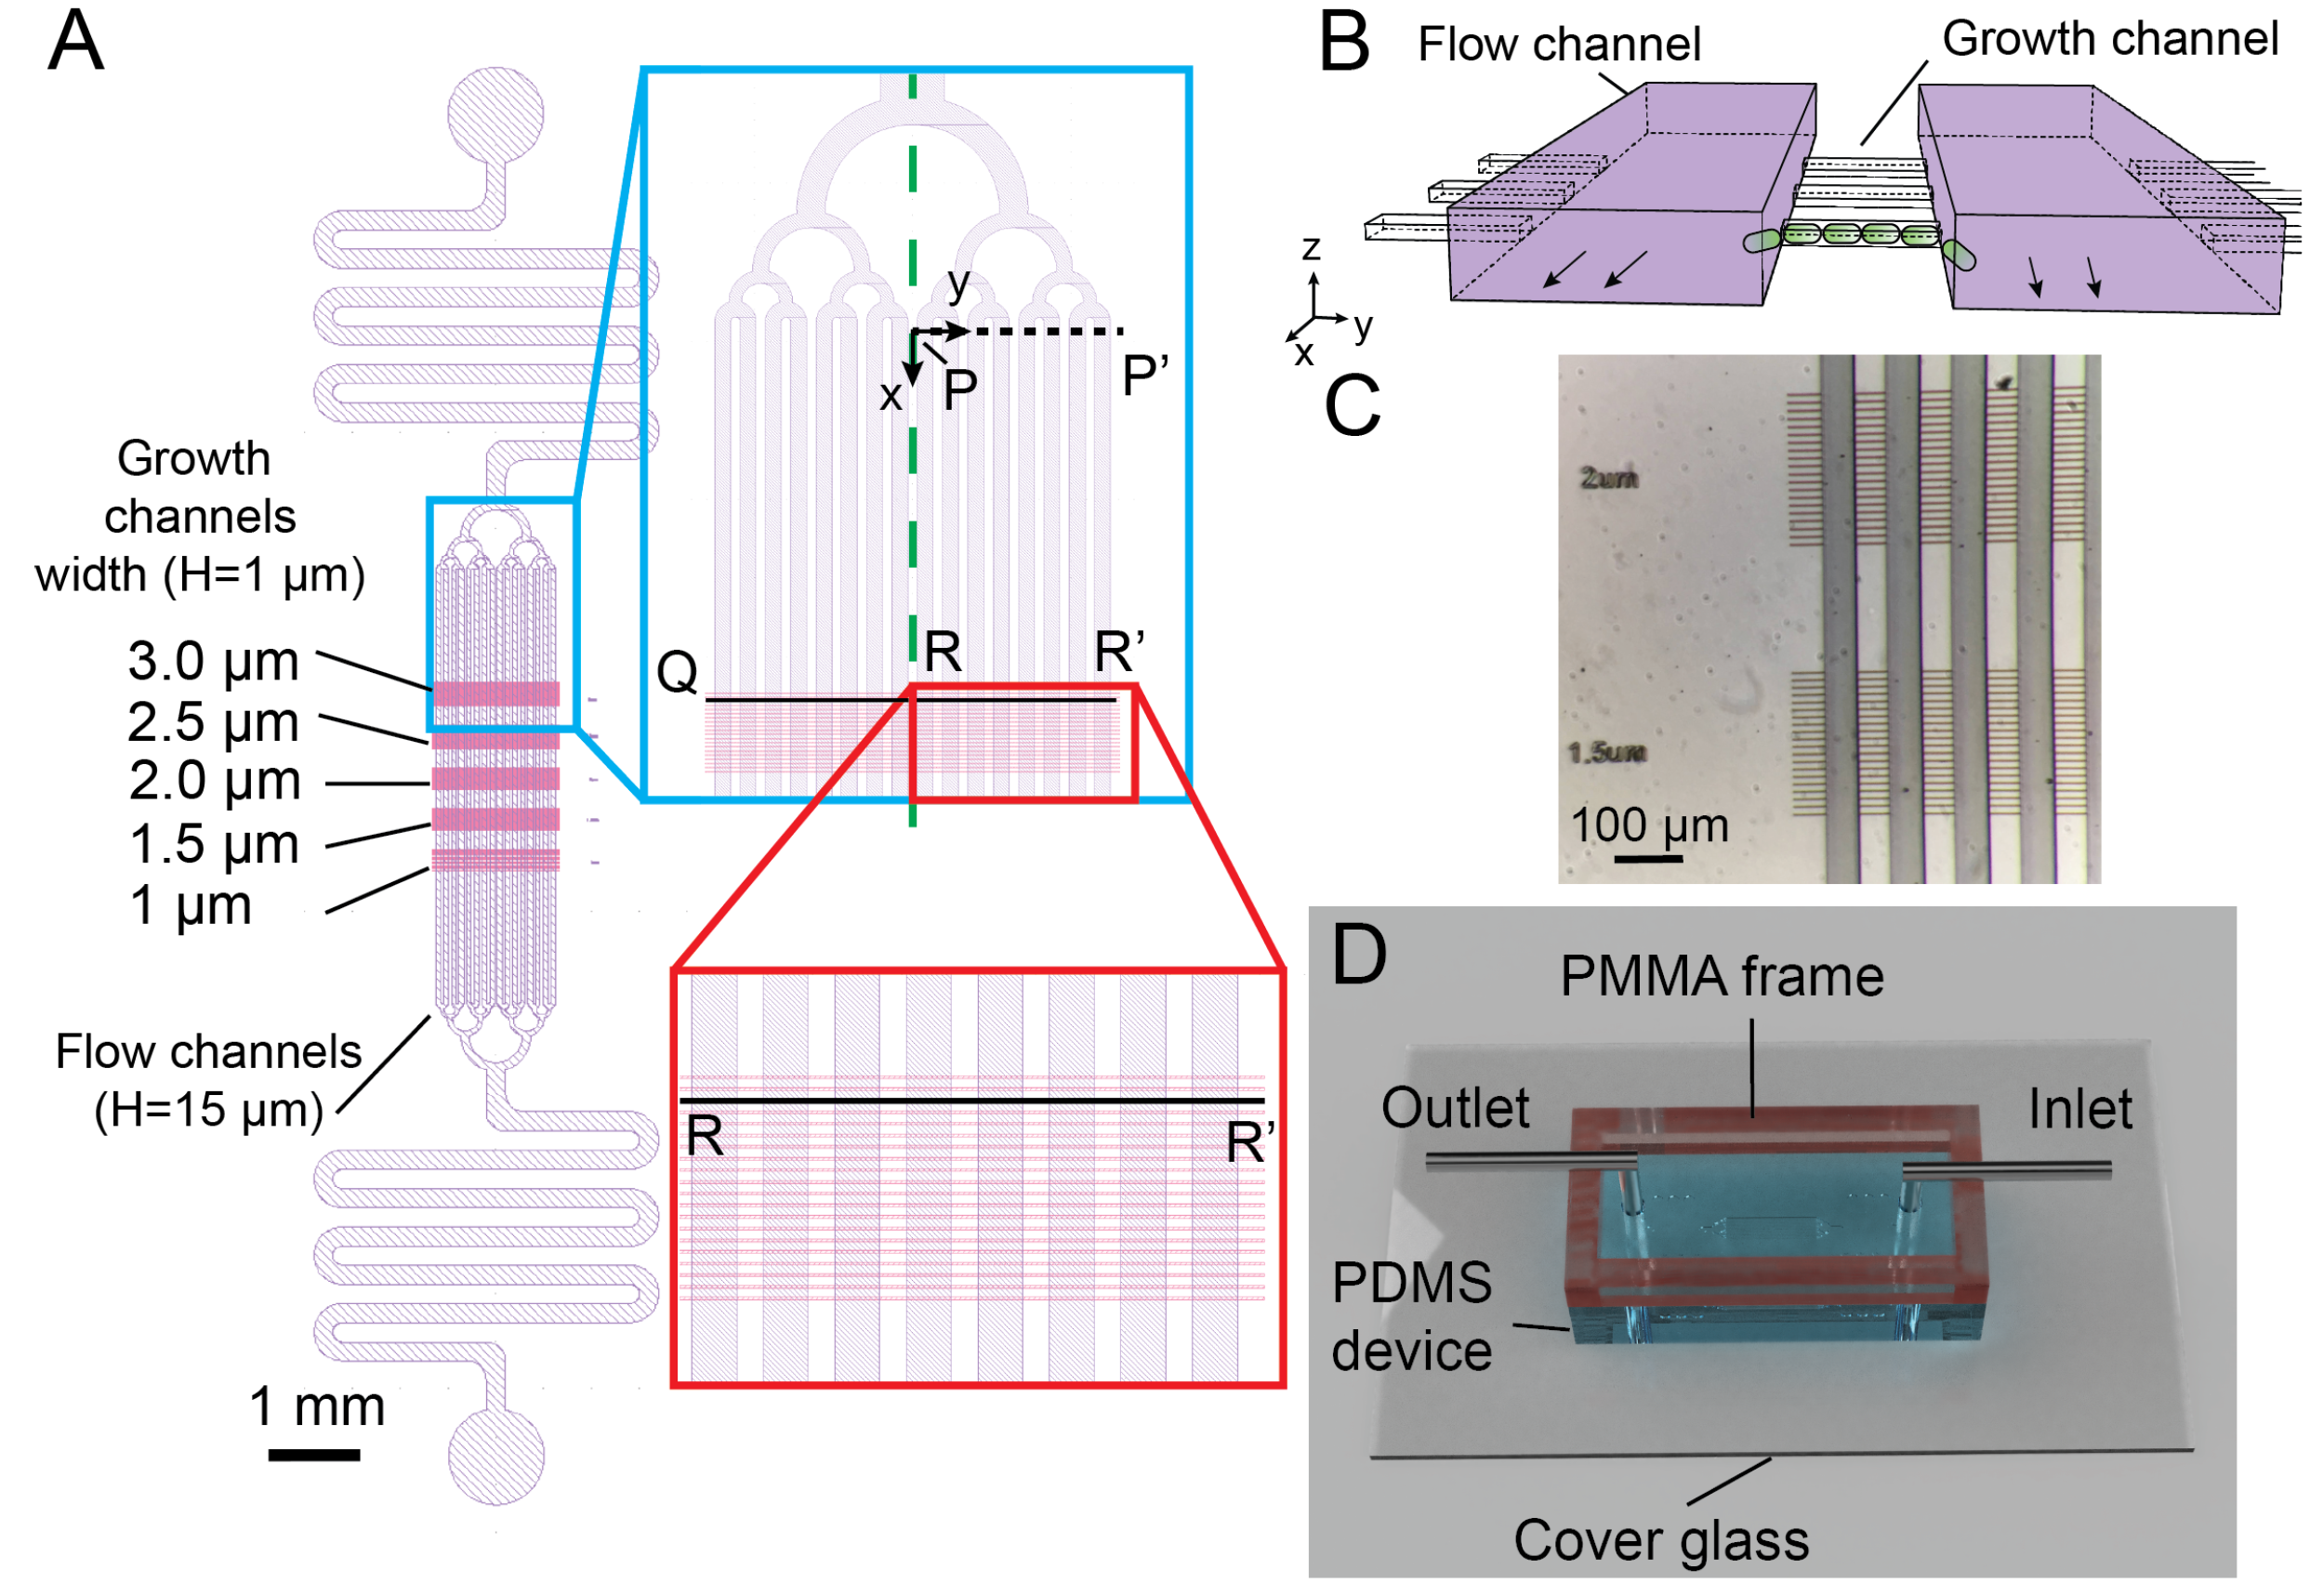
Abstract
:1. Introduction
2. Materials and Methods
2.1. Design and Fabrication of Multi-Level Microchannel in Silicon Mold
2.2. Fabrication and Assembly of the PDMS/PMMA Microdevice
2.3. Bacterial Cultivation and Maintenance
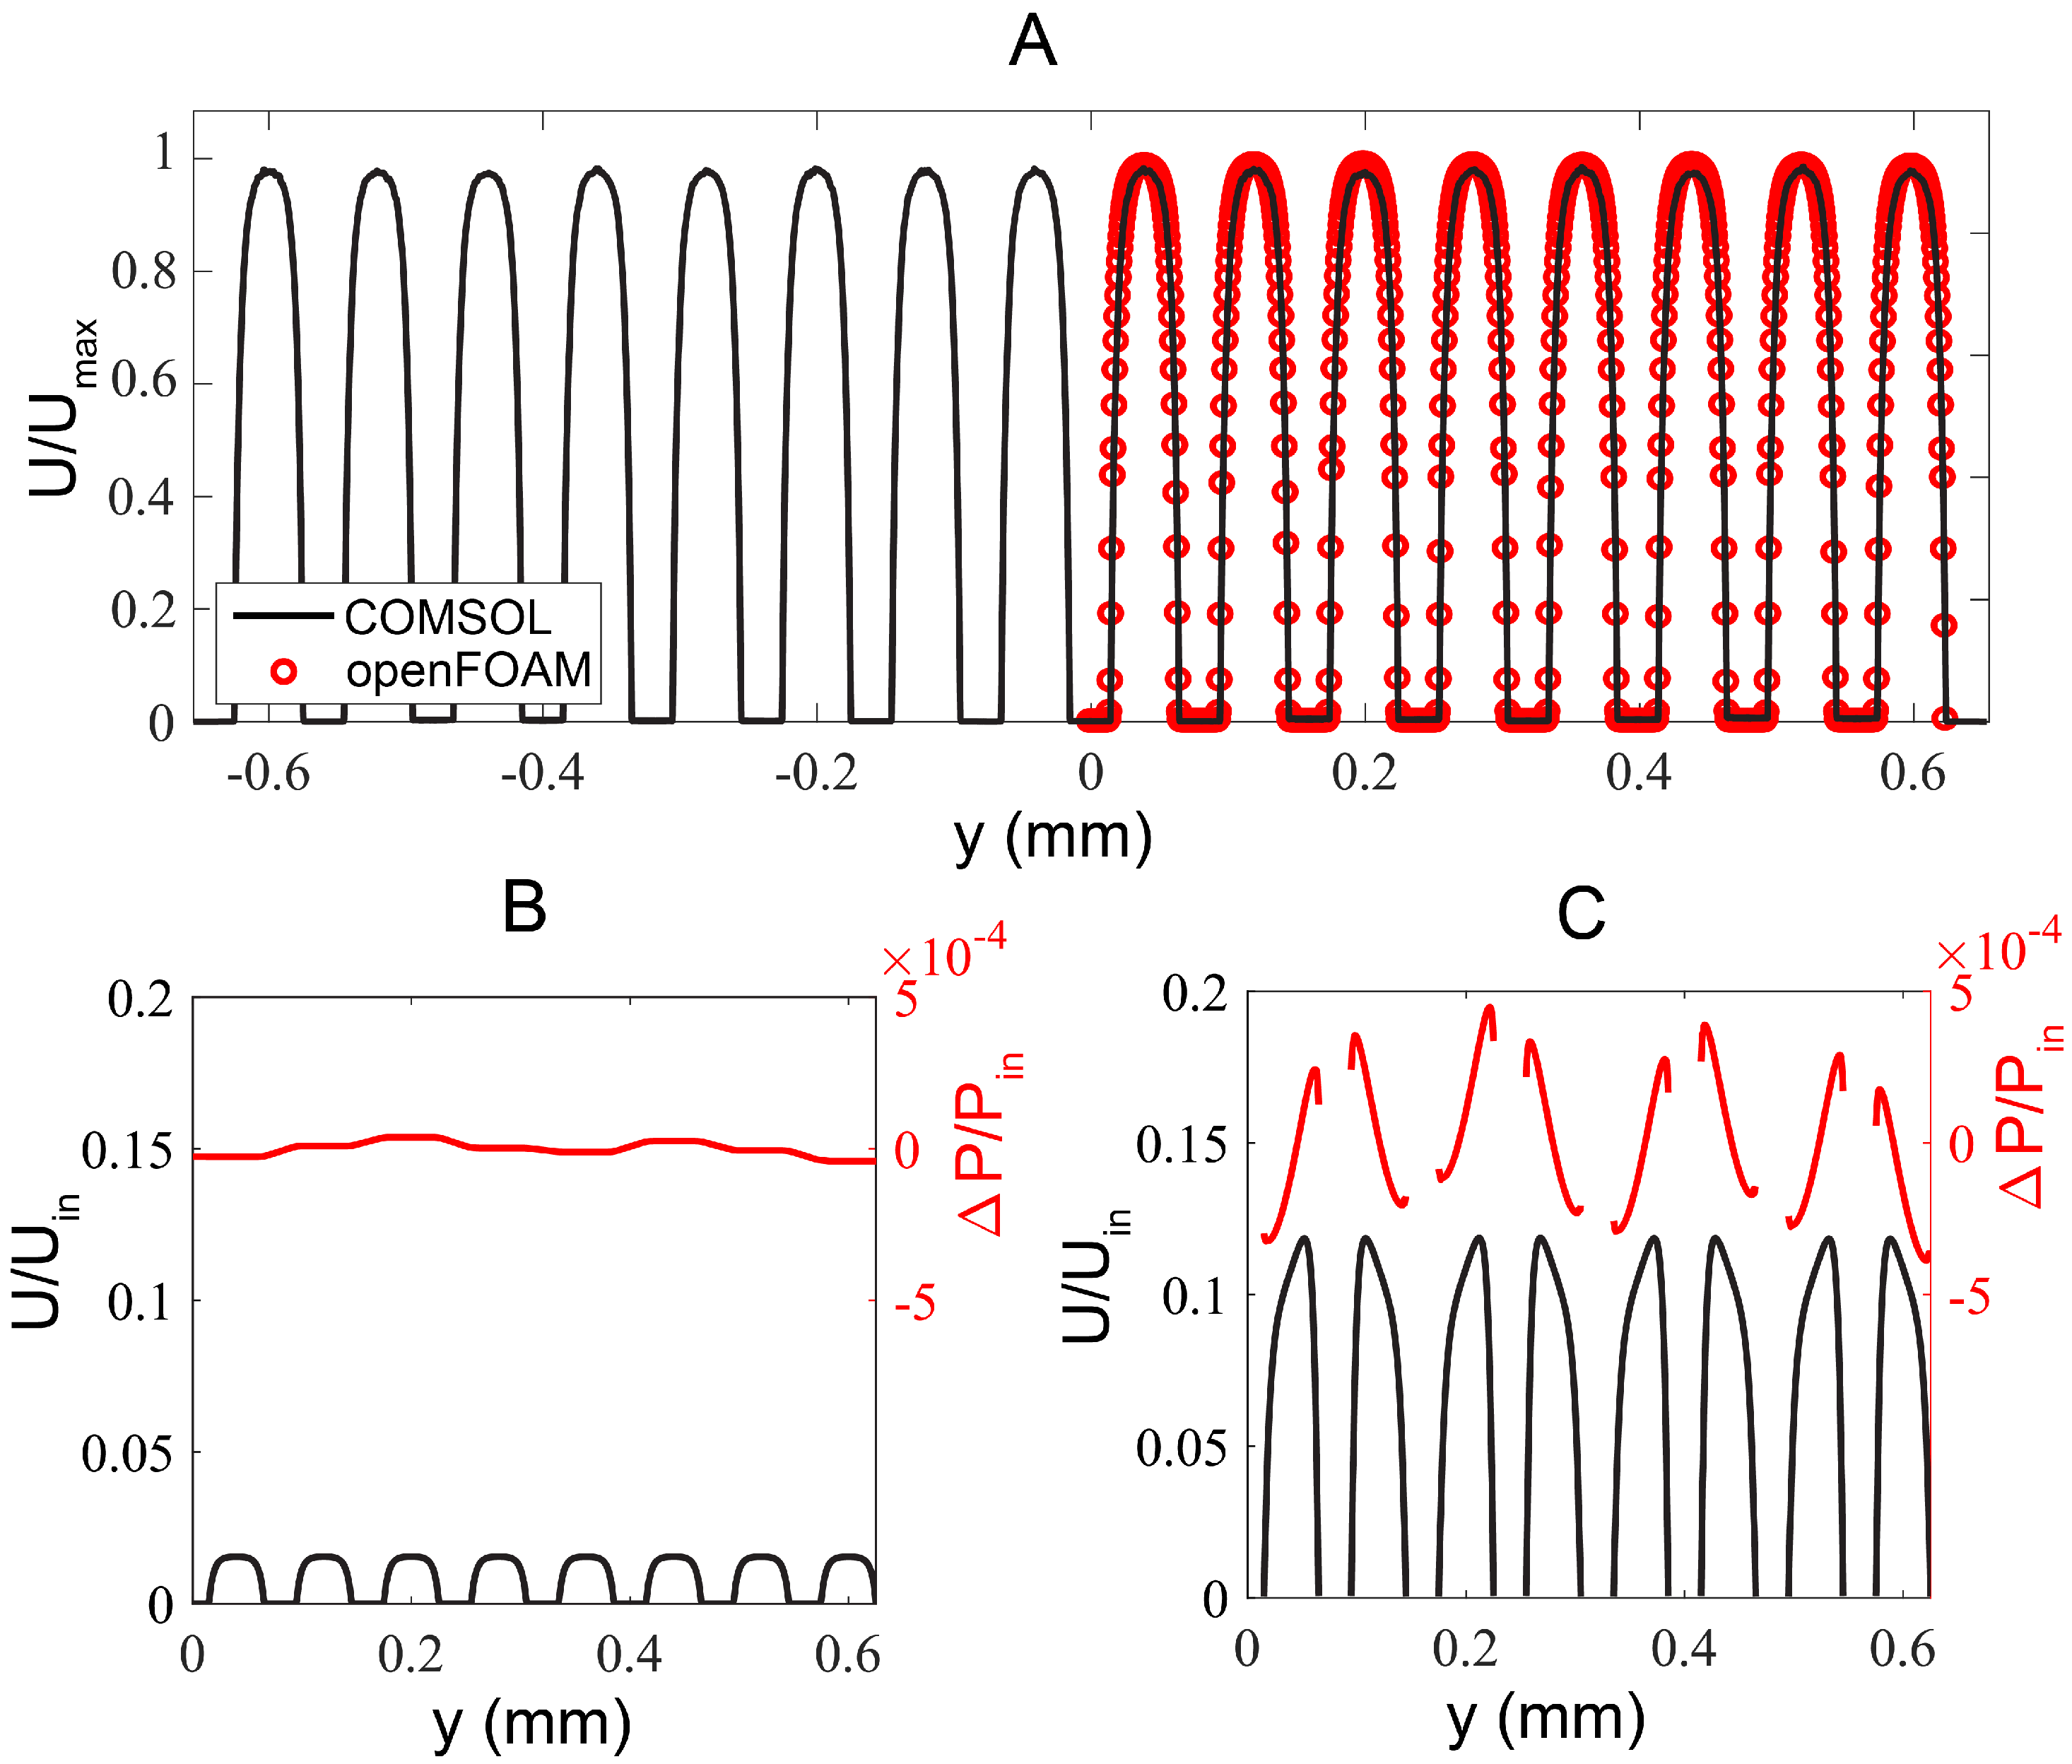
2.4. Numerical Simulation
2.5. Experimental Setup and Live Cell Microscopy
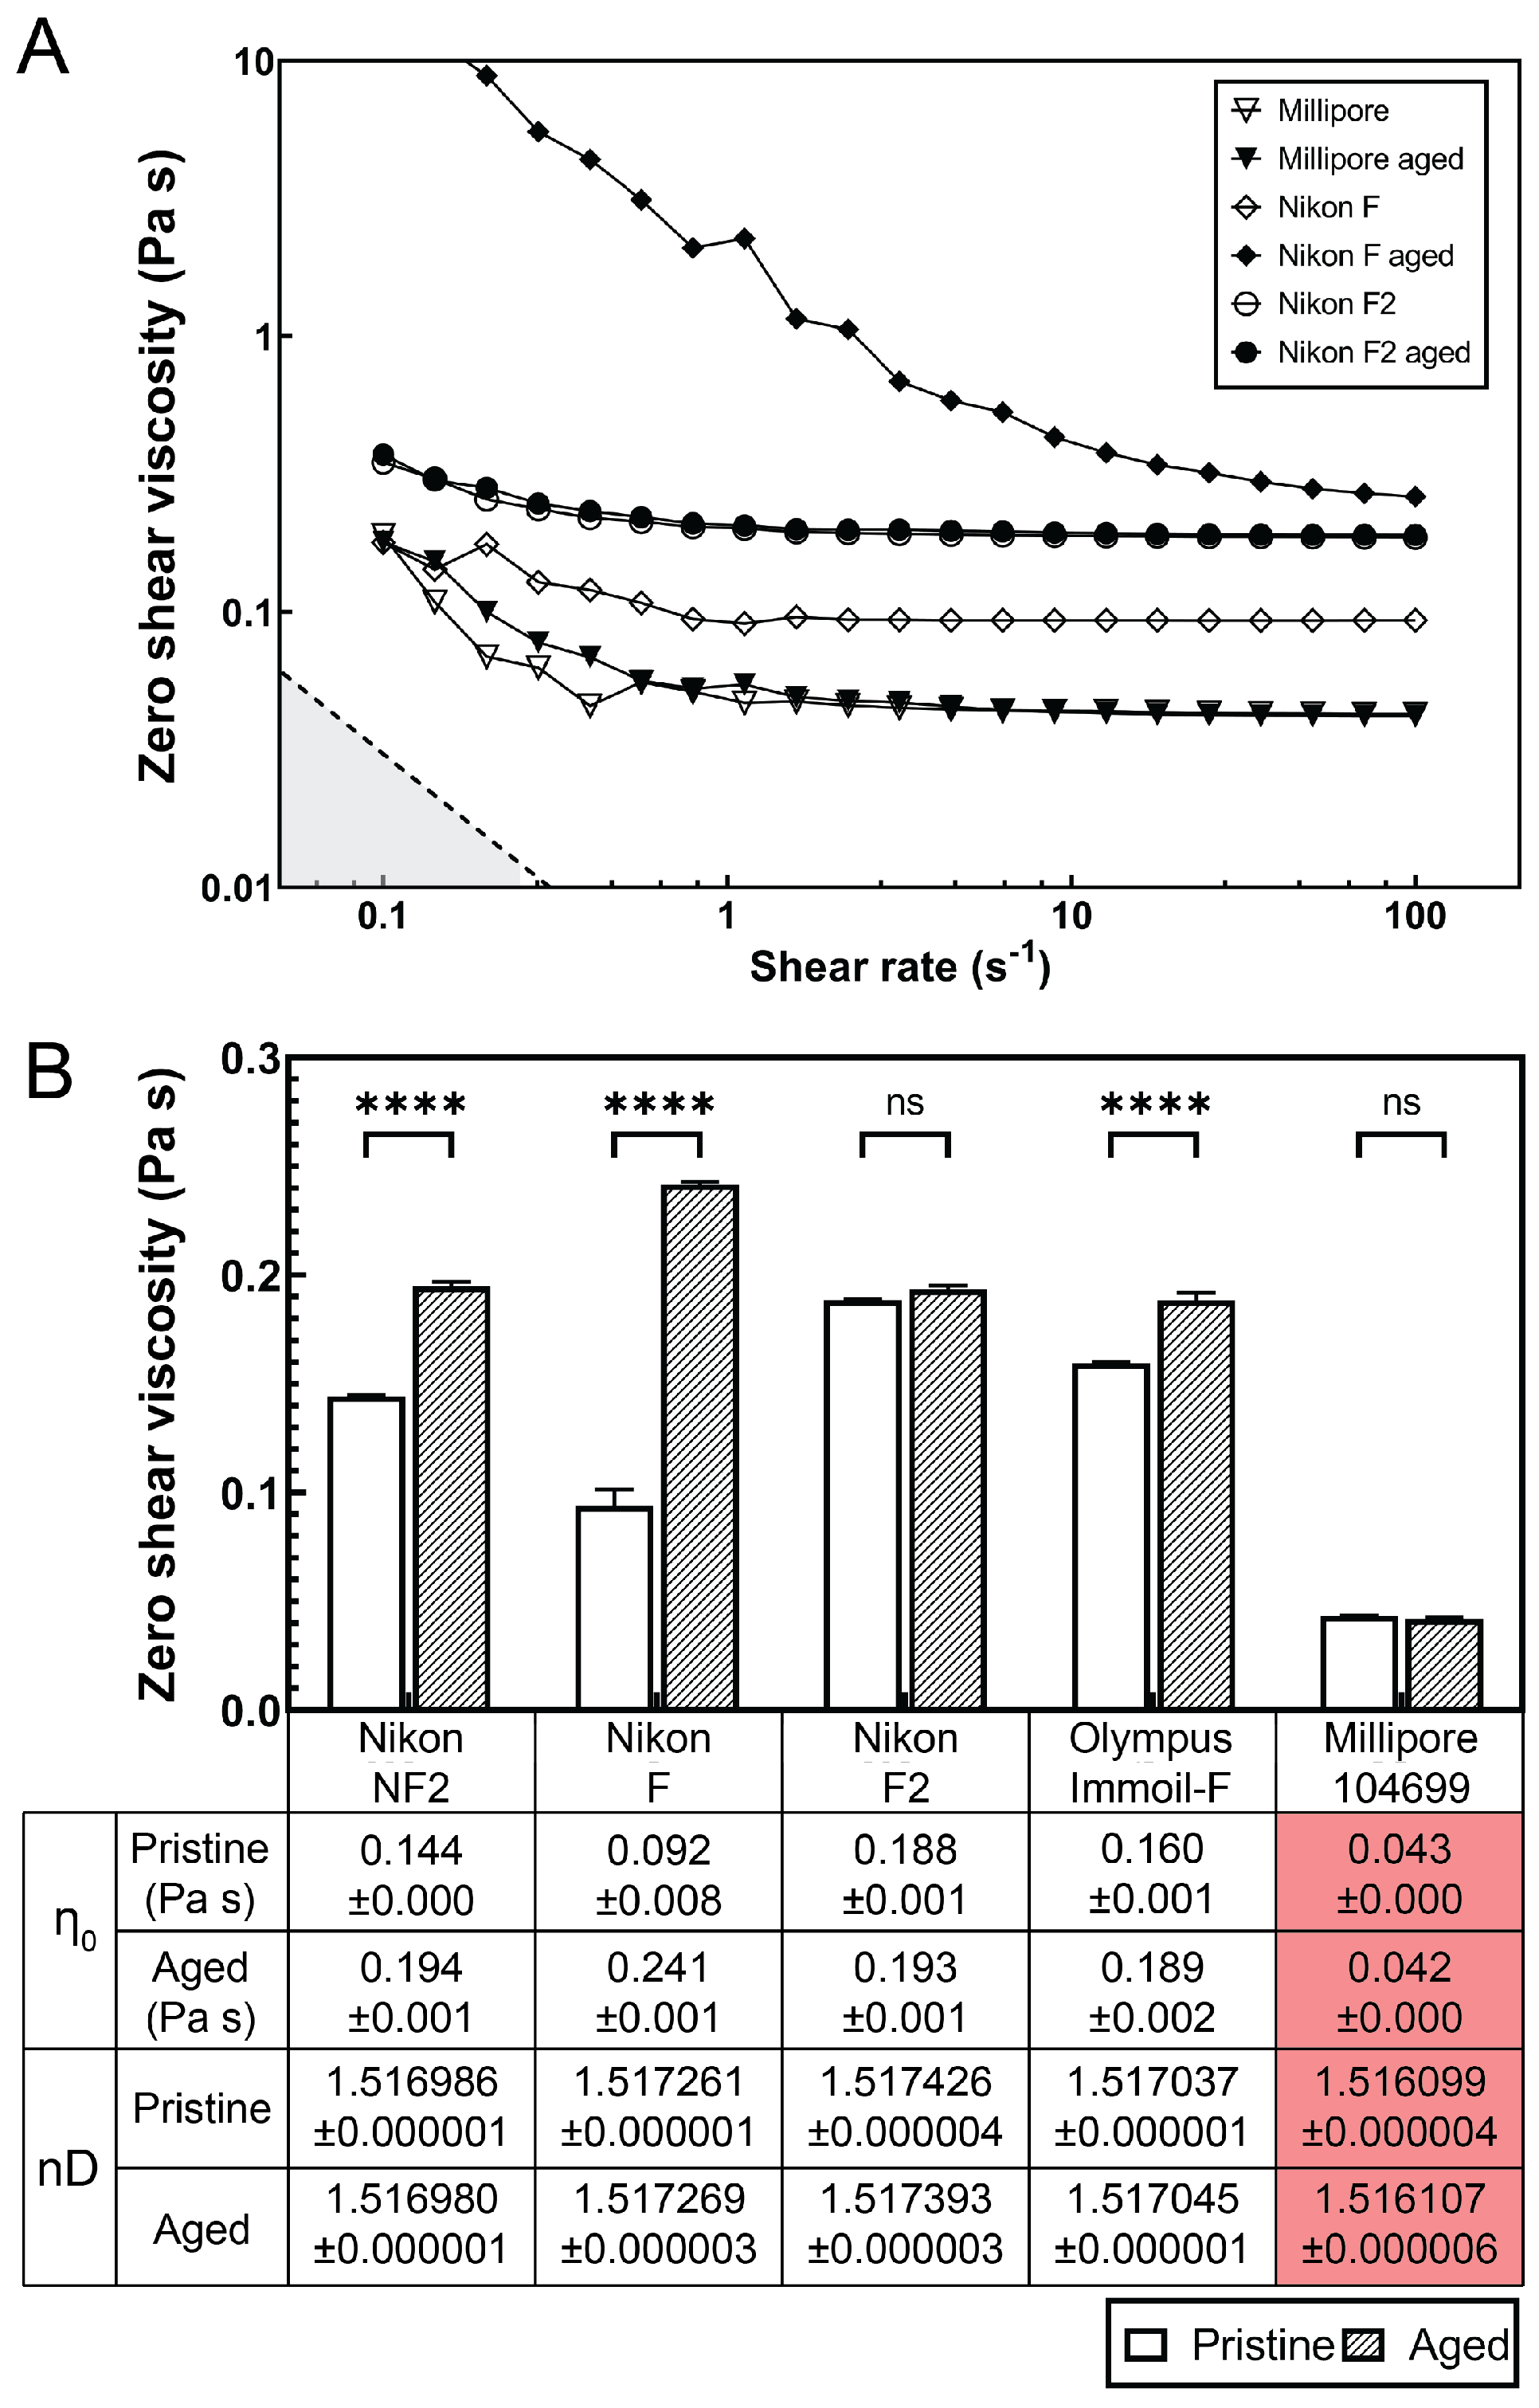
2.6. Viscosity and Refractive Index Measurements of Immersion Oils
3. Results
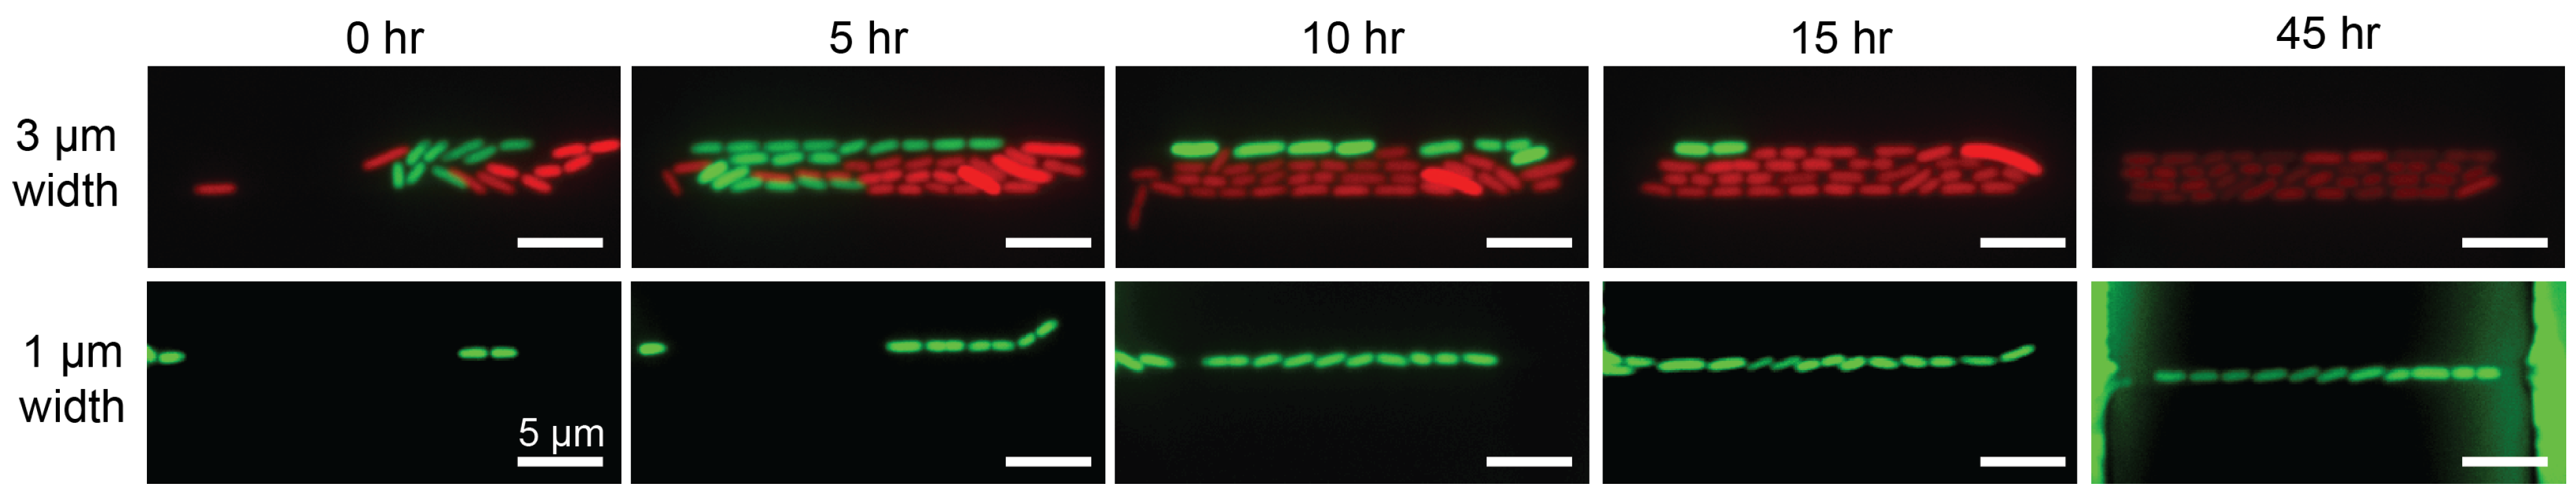
3.1. Simplified Multi-Level Microstructure Fabrication by Maskless Lithography
3.2. Optimal Loading and Stable Culture of Bacteria by Balancing Hydrostatic Pressure and Optimizing Flow Resistance in the Microdevice
3.3. Choice of Immersion Oil for Long-Term Imaging of Bacterial Expansion in the Microdevice
4. Discussion
5. Conclusions
Supplementary Materials
Author Contributions
Funding
Institutional Review Board Statement
Informed Consent Statement
Data Availability Statement
Acknowledgments
Conflicts of Interest
Abbreviations
| ANOVA | Analysis of variance |
| CFD | Computational fluid dynamics |
| FEM | Finite element method |
| FVM | Finite volume method |
| GFP | Green fluorescence protein |
| PDMS | Poly(dimethyl)siloxane |
| PMMA | Polymethylmethacrylate |
References
- Susman, L.; Kohram, M.; Vashistha, H.; Nechleba, J.T.; Salman, H.; Brenner, N. Individuality and slow dynamics in bacterial growth homeostasis. Proc. Natl. Acad. Sci. USA 2018, 115, E5679–E5687. [Google Scholar] [CrossRef] [PubMed] [Green Version]
- Hashimoto, M.; Nozoe, T.; Nakaoka, H.; Okura, R.; Akiyoshi, S.; Kaneko, K.; Kussell, E.; Wakamoto, Y. Noise-driven growth rate gain in clonal cellular populations. Proc. Natl. Acad. Sci. USA 2016, 113, 3251–3256. [Google Scholar] [CrossRef] [PubMed] [Green Version]
- Lin, J.; Amir, A. The effects of stochasticity at the single-cell level and cell size control on the population growth. Cell Syst. 2017, 5, 358–367. [Google Scholar] [CrossRef] [PubMed] [Green Version]
- Pigolotti, S. Generalized Euler-Lotka equation for correlated cell divisions. Phys. Rev. E 2021, 103, L060402. [Google Scholar] [CrossRef]
- Cho, H.; Jönsson, H.; Campbell, K.; Melke, P.; Williams, J.W.; Jedynak, B.; Stevens, A.M.; Groisman, A.; Levchenko, A. Self-Organization in High-Density Bacterial Colonies: Efficient Crowd Control. PLoS Biol. 2007, 5, e302. [Google Scholar] [CrossRef] [Green Version]
- Sheats, J.; Sclavi, B.; Cosentino Lagomarsino, M.; Cicuta, P.; Dorfman, K.D. Role of growth rate on the orientational alignment of Escherichia coli in a slit. R. Soc. Open sci. 2017, 4, 170463. [Google Scholar] [CrossRef] [Green Version]
- Koldaeva, A.; Tsai, H.F.; Shen, A.Q.; Pigolotti, S. Population genetics in microchannels. Proc. Natl. Acad. Sci. USA 2022, 119, e2120821119. [Google Scholar] [CrossRef]
- Wang, P.; Robert, L.; Pelletier, J.; Dang, W.L.; Taddei, F.; Wright, A.; Jun, S. Robust Growth of Escherichia coli. Curr. Biol. 2010, 20, 1099–1103. [Google Scholar] [CrossRef] [Green Version]
- Wessel, A.K.; Hmelo, L.; Parsek, M.R.; Whiteley, M. Going local: Technologies for exploring bacterial microenvironments. Nat. Rev. Microbiol. 2013, 11, 337–348. [Google Scholar] [CrossRef] [Green Version]
- Meyer, M.T.; Subramanian, S.; Kim, Y.W.; Ben-Yoav, H.; Gnerlich, M.; Gerasopoulos, K.; Bentley, W.E.; Ghodssi, R. Multi-depth valved microfluidics for biofilm segmentation. J. Micromech. Microeng. 2015, 25, 095003. [Google Scholar] [CrossRef]
- Zhang, X.Y.; Sun, K.; Abulimiti, A.; Xu, P.P.; Li, Z.Y. Microfluidic System for Observation of Bacterial Culture and Effects on Biofilm Formation at Microscale. Micromachines 2019, 10, 606. [Google Scholar] [CrossRef] [PubMed] [Green Version]
- Zhou, W.; Le, J.; Chen, Y.; Cai, Y.; Hong, Z.; Chai, Y. Recent advances in microfluidic devices for bacteria and fungus research. Trends Analyt. Chem. 2019, 112, 175–195. [Google Scholar] [CrossRef]
- Busche, J.F.; Möller, S.; Stehr, M.; Dietzel, A. Cross-Flow Filtration of Escherichia coli at a Nanofluidic Gap for Fast Immobilization and Antibiotic Susceptibility Testing. Micromachines 2019, 10, 691. [Google Scholar] [CrossRef] [PubMed] [Green Version]
- Morales Navarrete, P.; Yuan, J. A Single-Layer PDMS Chamber for On-Chip Bacteria Culture. Micromachines 2020, 11, 395. [Google Scholar] [CrossRef] [Green Version]
- Hardo, G.; Bakshi, S. Challenges of analysing stochastic gene expression in bacteria using single-cell time-lapse experiments. Essays Biochem. 2021, 65, 67–79. [Google Scholar] [CrossRef]
- Cai, P.; Sun, X.; Wu, Y.; Gao, C.; Mortimer, M.; Holden, P.A.; Redmile-Gordon, M.; Huang, Q. Soil biofilms: Microbial interactions, challenges, and advanced techniques for ex-situ characterization. Soil Ecol. Lett. 2019, 1, 85–93. [Google Scholar] [CrossRef] [Green Version]
- Kim, H.J.; Li, H.; Collins, J.J.; Ingber, D.E. Contributions of microbiome and mechanical deformation to intestinal bacterial overgrowth and inflammation in a human gut-on-a-chip. Proc. Natl. Acad. Sci. USA 2016, 113, E7–E15. [Google Scholar] [CrossRef] [Green Version]
- Polini, A.; del Mercato, L.L.; Barra, A.; Zhang, Y.S.; Calabi, F.; Gigli, G. Towards the development of human immune-system-on-a-chip platforms. Drug Discov. Today 2019, 24, 517–525. [Google Scholar] [CrossRef]
- Burmeister, A.; Hilgers, F.; Langner, A.; Westerwalbesloh, C.; Kerkhoff, Y.; Tenhaef, N.; Drepper, T.; Kohlheyer, D.; von Lieres, E.; Noack, S.; et al. A microfluidic co-cultivation platform to investigate microbial interactions at defined microenvironments. Lab Chip 2019, 19, 98–110. [Google Scholar] [CrossRef]
- Christ, K.V.; Turner, K.T. Design of hydrodynamically confined microfluidics: Controlling flow envelope and pressure. Lab Chip 2011, 11, 1491–1501. [Google Scholar] [CrossRef]
- Hol, F.J.H.; Dekker, C. Zooming in to see the bigger picture: Microfluidic and nanofabrication tools to study bacteria. Science 2014, 346, 1251821. [Google Scholar] [CrossRef] [PubMed]
- Qiu, X.; Huang, J.H.; Westerhof, T.M.; Lombardo, J.A.; Henrikson, K.M.; Pennell, M.; Pourfard, P.P.; Nelson, E.L.; Nath, P.; Haun, J.B. Microfluidic channel optimization to improve hydrodynamic dissociation of cell aggregates and tissue. Sci. Rep. 2018, 8, 2774. [Google Scholar] [CrossRef] [PubMed]
- Kao, Y.T.; Kaminski, T.S.; Postek, W.; Guzowski, J.; Makuch, K.; Ruszczak, A.; von Stetten, F.; Zengerle, R.; Garstecki, P. Gravity-driven microfluidic assay for digital enumeration of bacteria and for antibiotic susceptibility testing. Lab Chip 2020, 20, 54–63. [Google Scholar] [CrossRef] [PubMed] [Green Version]
- Van Teeffelen, S.; Shaevitz, J.W.; Gitai, Z. Image analysis in fluorescence microscopy: Bacterial dynamics as a case study. BioEssays 2012, 34, 427–436. [Google Scholar] [CrossRef] [PubMed] [Green Version]
- Skylaki, S.; Hilsenbeck, O.; Schroeder, T. Challenges in long-term imaging and quantification of single-cell dynamics. Nat. Biotechnol. 2016, 34, 1137–1144. [Google Scholar] [CrossRef] [PubMed]
- Bach, S.P.; Renehan, A.G.; Potten, C.S. Stem cells: The intestinal stem cell as a paradigm. Carcinogenesis 2000, 21, 469–476. [Google Scholar] [CrossRef] [Green Version]
- O’Donnell, A.G.; Young, I.M.; Rushton, S.P.; Shirley, M.D.; Crawford, J.W. Visualization, modelling and prediction in soil microbiology. Nat. Rev. Microbiol. 2007, 5, 689–699. [Google Scholar] [CrossRef]
- Coyte, K.; Tabuteau, H.; Gaffney, E.; Foster, K.; Durham, W. Microbial competition in porous environments can select against rapid biofilm growth. Proc. Natl. Acad. Sci. USA 2016, 114, 161–170. [Google Scholar] [CrossRef] [Green Version]
- Jahnke, J.P.; Smith, A.M.; Zander, N.E.; Wiedorn, V.; Strawhecker, K.E.; Terrell, J.L.; Stratis-Cullum, D.N.; Cheng, X. “Living” dynamics of filamentous bacteria on an adherent surface under hydrodynamic exposure. Biointerphases 2017, 12, 02C410. [Google Scholar] [CrossRef]
- Tsai, H.F.; IJspeert, C.; Shen, A.Q. Voltage-gated ion channels mediate the electrotaxis of glioblastoma cells in a hybrid PMMA/PDMS microdevice. APL Bioeng. 2020, 4, 036102. [Google Scholar] [CrossRef]
- Stirling, F.; Bitzan, L.; O’Keefe, S.; Redfield, E.; Oliver, J.W.K.; Way, J.; Silver, P.A. Rational Design of Evolutionarily Stable Microbial Kill Switches. Mol. Cell 2017, 68, 686–697. [Google Scholar] [CrossRef] [PubMed] [Green Version]
- Molina-Aiz, F.; Fatnassi, H.; Boulard, T.; Roy, J.C.; Valera, D. Comparison of finite element and finite volume methods for simulation of natural ventilation in greenhouses. Comput. Electron. Agric. 2010, 72, 69–86. [Google Scholar] [CrossRef]
- Lopes, D.; Agujetas, R.; Puga, H.; Teixeira, J.; Lima, R.; Alejo, J.; Ferrera, C. Analysis of finite element and finite volume methods for fluid-structure interaction simulation of blood flow in a real stenosed artery. Int. J. Mech. Sci. 2021, 207, 106650. [Google Scholar] [CrossRef]
- Jeong, W.; Seong, J. Comparison of effects on technical variances of computational fluid dynamics (CFD) software based on finite element and finite volume methods. Int. J. Mech. Sci. 2014, 78, 19–26. [Google Scholar] [CrossRef]
- Weller, H.G.; Tabor, G.; Jasak, H.; Fureby, C. A tensorial approach to computational continuum mechanics using object-oriented techniques. Comput. Phys. 1998, 12, 620–631. [Google Scholar] [CrossRef]
- Funari, R.; Bhalla, N.; Chu, K.Y.; Söderström, B.; Shen, A.Q. Nanoplasmonics for Real-Time and Label-Free Monitoring of Microbial Biofilm Formation. ACS Sens. 2018, 3, 1499–1509. [Google Scholar] [CrossRef] [PubMed] [Green Version]
- Kaiser, M.; Jug, F.; Julou, T.; Deshpande, S.; Pfohl, T.; Silander, O.; Nimwegen, E. Monitoring single-cell gene regulation under dynamically controllable conditions with integrated microfluidics and software. Nat. Commun. 2018, 9, 212. [Google Scholar] [CrossRef]
- Bellouard, Y.; Said, A.; Dugan, M.; Bado, P. Fabrication of high-aspect ratio, micro-fluidic channels and tunnels using femtosecond laser pulses and chemical etching. Opt. Express 2004, 12, 2120–2129. [Google Scholar] [CrossRef] [Green Version]
- Tao, S.; Desai, T. Microfabrication of Multilayer, Asymmetric, Polymeric Devices for Drug Delivery. Adv. Mater. 2005, 17, 1625–1630. [Google Scholar] [CrossRef]
- Li, H.; Torab, P.; Mach, K.E.; Surrette, C.; England, M.R.; Craft, D.W.; Thomas, N.J.; Liao, J.C.; Puleo, C.; Wong, P.K. Adaptable microfluidic system for single-cell pathogen classification and antimicrobial susceptibility testing. Proc. Natl. Acad. Sci. USA 2019, 116, 10270–10279. [Google Scholar] [CrossRef] [Green Version]
- Bian, Z.; Guo, C.; Jiang, S.; Zhu, J.; Wang, R.; Song, P.; Zhang, Z.; Hoshino, K.; Zheng, G. Autofocusing technologies for whole slide imaging and automated microscopy. J. Biophotonics 2020, 13, e202000227. [Google Scholar] [CrossRef] [PubMed]
- Schneider, F.; Draheim, J.; Kamberger, R.; Wallrabe, U. Process and material properties of polydimethylsiloxane (PDMS) for Optical MEMS. Sens. Actuator A Phys. 2009, 151, 95–99. [Google Scholar] [CrossRef]
- Koho, S.; Fazeli, E.; Eriksson, J.; Hänninen, P. Image Quality Ranking Method for Microscopy. Sci. Rep. 2016, 6, 28962. [Google Scholar] [CrossRef] [PubMed] [Green Version]
- Johnston, M.T.; Ewoldt, R.H. Precision rheometry: Surface tension effects on low-torque measurements in rotational rheometers. J. Rheol. 2013, 57, 1515–1532. [Google Scholar] [CrossRef] [Green Version]
- Ewoldt, R.H.; Johnston, M.T.; Caretta, L.M. Experimental Challenges of Shear Rheology: How to Avoid Bad Data. In Complex Fluids in Biological Systems: Experiment, Theory, and Computation; Springer: New York, NY, USA, 2015; pp. 207–241. [Google Scholar] [CrossRef]
- Guo, P.; Hall, E.W.; Schirhagl, R.; Mukaibo, H.; Martin, C.R.; Zare, R.N. Microfluidic capture and release of bacteria in a conical nanopore array. Lab Chip 2012, 12, 558–561. [Google Scholar] [CrossRef]
- Di Giacomo, R.; Krödel, S.; Maresca, B.; Benzoni, P.; Rusconi, R.; Stocker, R.; Daraio, C. Deployable micro-traps to sequester motile bacteria. Sci. Rep. 2017, 7, 45897. [Google Scholar] [CrossRef]
- Dichosa, A.E.K.; Daughton, A.R.; Reitenga, K.G.; Fitzsimons, M.S.; Han, C.S. Capturing and cultivating single bacterial cells in gel microdroplets to obtain near-complete genomes. Nat. Prot. 2014, 9, 608–621. [Google Scholar] [CrossRef]
- Sacher, R. Microscope Immersion Oil. Micros Today 2000, 8, 33–35. [Google Scholar] [CrossRef]
- Cooke, T.; Ltd., S. Microscope immersion oil with thixotropic properties. J. Sci. Instrum. 1958, 35, 476. [Google Scholar] [CrossRef]
- Si, F.; Le Treut, G.; Sauls, J.T.; Vadia, S.; Levin, P.A.; Jun, S. Mechanistic Origin of Cell-Size Control and Homeostasis in Bacteria. Curr. Biol. 2019, 29, 1760–1770.e7. [Google Scholar] [CrossRef]
- Kilbertus, G. Microhabitats in soil aggregates. Their relationship with bacterial biomass and the size of the procaryotes present. Rev. d’Ecol. Biol. Sol 1980, 17, 543–557. [Google Scholar]
- Gage, D.J. Analysis of infection thread development using Gfp-and DsRed-expressing Sinorhizobium meliloti. J. Bacteriol. 2002, 184, 7042–7046. [Google Scholar] [CrossRef] [PubMed] [Green Version]
- Blanpain, C.; Fuchs, E. Epidermal Stem Cells of the Skin. Annu. Rev. Cell Dev. Biol. 2006, 22, 339–373. [Google Scholar] [CrossRef] [PubMed] [Green Version]


Publisher’s Note: MDPI stays neutral with regard to jurisdictional claims in published maps and institutional affiliations. |
© 2022 by the authors. Licensee MDPI, Basel, Switzerland. This article is an open access article distributed under the terms and conditions of the Creative Commons Attribution (CC BY) license (https://creativecommons.org/licenses/by/4.0/).
Share and Cite
Tsai, H.-F.; Carlson, D.W.; Koldaeva, A.; Pigolotti, S.; Shen, A.Q. Optimization and Fabrication of Multi-Level Microchannels for Long-Term Imaging of Bacterial Growth and Expansion. Micromachines 2022, 13, 576. https://doi.org/10.3390/mi13040576
Tsai H-F, Carlson DW, Koldaeva A, Pigolotti S, Shen AQ. Optimization and Fabrication of Multi-Level Microchannels for Long-Term Imaging of Bacterial Growth and Expansion. Micromachines. 2022; 13(4):576. https://doi.org/10.3390/mi13040576
Chicago/Turabian StyleTsai, Hsieh-Fu, Daniel W. Carlson, Anzhelika Koldaeva, Simone Pigolotti, and Amy Q. Shen. 2022. "Optimization and Fabrication of Multi-Level Microchannels for Long-Term Imaging of Bacterial Growth and Expansion" Micromachines 13, no. 4: 576. https://doi.org/10.3390/mi13040576