Article

FEM Simulation of a High-Performance 128°Y–X LiNbO3/SiO2/Si Functional Substrate for Surface Acoustic Wave Gyroscopes

1
School of Microelectronics, Xidian University, Xi’an 710071, China
2
Shaanxi Province Key Laboratory of Thin Films Technology and Optical Test, School of Optoelectronic Engineering, Xi’an Technological University, Xi’an 710032, China
*
Author to whom correspondence should be addressed.
Micromachines 2022, 13(2), 202; https://doi.org/10.3390/mi13020202
Submission received: 17 December 2021 / Revised: 17 January 2022 / Accepted: 26 January 2022 / Published: 27 January 2022
(This article belongs to the Special Issue Advances in Piezoelectric Sensors, Transducers and Harvesters)

Abstract

:
To obtain a high-performance surface acoustic wave (SAW) gyroscope substrate, the propagation characteristics and gyroscopic effect of Rayleigh waves in a 128°Y–X LiNbO3/SiO2/Si (LNOI) functional substrate were investigated with a three-dimensional finite element method. The influence of LNOI structural parameters on Rayleigh wave characteristics, including the phase velocity (vp), electromechanical coupling coefficient (K2) and temperature coefficient of frequency (TCF), were analyzed. The results demonstrate that the SiO2 layer compensates for the negative TCF of 128°Y–X LiNbO3 and enhances the K2 of the LNOI substrate. The Rayleigh wave velocity change of the LNOI substrate after rotations in different directions was studied. The gyroscope gain factor (η) represents the strength of the gyroscopic effect in the differential traveling wave SAW gyroscope and is defined. The ηy and ηz of the LNOI substrate with different structural parameters were investigated. Finally, an LNOI substrate with an hLN/λ of 0.2 and an hSiO2/λ of 0.05 was obtained by balancing the characteristic parameters, with a K2 of 3.96%, TCF of −18.75 ppm/°C and ηy of 0.26. The LNOI substrate has a better gyroscopic effect and temperature stability than the 128°Y–X LiNbO3 crystal. The LNOI substrate meets device miniaturization and integration needs.

1. Introduction

The surface acoustic wave (SAW) gyroscope is a novel inertial sensor based on the SAW gyroscopic effect in which the Coriolis force causes the SAW velocity to change as the medium rotates [1]. The SAW gyroscope measures the angular velocity by detecting the frequency shift caused by a change in the wave velocity [2]. Compared with traditional mechanical rotor gyroscopes and vibratory gyroscopes, the SAW gyroscope is a single-layer planar structure with no moving parts and an elastic support structure with strong shock resistance and vibration resistance. In addition, SAW gyroscopes have the same advantages as SAW devices, such as small size, digital output, high sensitivity, and simple manufacturing [3,4,5]. The SAW gyroscopes that have been reported to date contain mainly standing wave and traveling wave modes. Research on standing wave SAW gyroscopes has been paused due to their too weak output signal, complex device structure and temperature compensation difficulty [6,7,8]. Traveling wave SAW gyroscopes have attracted widespread attention because their output signal is easy to detect and temperature compensation can be achieved with a differential scheme [9,10]. However, SAW gyroscopes are difficult to use in practical applications because of their low sensitivity due to the weak Coriolis force. Improving the gyroscopic effect to obtain a high-sensitivity SAW gyroscope is still an urgent problem that must be solved to overcome current application limitations. Many research groups have conducted intensive studies on designing interdigital transducers, placing metallic dot arrays on the surface of piezoelectric crystals, modulating amplitude using one-dimensional phononic crystal, and searching for high-performance piezoelectric substrate materials to further improve the performance of SAW gyroscopes [11,12,13,14,15].
High-performance substrate materials are an important foundation for manufacturing high-sensitivity SAW gyroscopes. A high-performance substrate material for an SAW gyroscope must have a high sensitivity to gyroscopic effects, a large electromechanical coupling coefficient (K2) and a temperature coefficient of frequency (TCF) that approaches zero. For different piezoelectric crystals, the strength of the gyroscopic effect is affected by their physical characteristics. For the same piezoelectric crystal, the SAW gyroscopic effect of different cut types differs because of their anisotropic characteristics [12,16]. Currently, most SAW gyroscopes are prepared on piezoelectric crystal wafers with clear gyroscopic effects, such as ST-quartz, 128°Y–X LiNbO3 and X–112°Y LiTaO3 [9,10,17,18]. A traveling wave SAW gyroscope achieves phase velocity changes by measuring the frequency shift caused by loading a rotation, so the substrate must have good temperature stability. Although ST-quartz with a TCF of zero can meet the above requirement, its K2 is only 0.14%, which has a considerable effect on the bandwidth of the device. X–112°Y LiTaO3 has a TCF of −20 ppm/°C and K2 is also of only 0.75%. The K2 of 128°Y–X LiNbO3 is 5.5%, but its TCF is −75 ppm/°C. To eliminate the temperature effect, a double delay line differential structure was designed on the 128°Y–X LiNbO3 wafer. The inherent characteristic parameters of the substrates mentioned above limit improvements in the SAW gyroscope performance. Recently, a piezoelectric multilayer structure that combines a piezoelectric film and a silicon substrate has attracted widespread attention. The angular velocity can be measured by using generalized Rayleigh waves in the layered structure [19]. The piezoelectric multilayer structure can be composed of materials with different characteristics and meets the requirements of SAW devices through its structural design, which is very flexible [20,21,22]. Additionally, this structure can efficiently reduce the volume and weight of the SAW sensor.
Among piezoelectric multilayer structures, a lithium niobate thin film on insulator (LNOI) substrate has been used in the preparation of SAW sensors due to its excellent piezoelectric properties [23,24,25,26]. As shown in Figure 1a, this substrate is composed of a LiNbO3 (LN) thin film, a SiO2 layer and a silicon (Si) substrate. In this structure, the Si substrate at the bottom is mainly used for mechanical support and subsequent circuit integration. The intermediate layer SiO2 is a common waveguide material with low noise loss and high mechanical and chemical properties [27]. The SiO2 layer not only acts as a bonding layer between the LN thin film and the Si substrate but also plays an important role in adjusting the TCF of the LNOI substrate because of its positive TCF. As the piezoelectric layer, the LN thin film at the top of the structure is the core of the LNOI substrate. The cut type, film quality and thickness of the LN thin film directly affect the performance of the LNOI substrate. Currently, there are two mature LNOI substrate preparation processes according to the thickness of the LN thin film [28]. As shown in Figure 1b, smart-cut technology is applied to prepare the LNOI substrate with a nanoscale LN film. First, He ions are injected into the LN wafer, and then a SiO2 thin film is deposited on the silicon substrate using plasma-enhanced chemical vapor deposition (PECVD). The implanted LN wafer is flipped and bonded to a silicon wafer by the SiO2 layer. After the annealing step, an LN thin film is split off from the original LN wafer, yielding an LNOI substrate. Finally, the surface roughness of the LN film can be polished to 0.5 nm by chemical mechanical polishing (CMP) [29,30]. An LNOI substrate with a special cut type and a high single-crystallinity LN thin film can be prepared by the above method. However, the thickness of the stripped LN film is determined by the He ion implantation energy, so this method is not suitable for preparing LN thin films thicker than a few microns. The preparation scheme for the LNOI substrate with an LN film thicker than a few microns is shown in Figure 1c. First, the LN wafer is bonded to the Si substrate through a SiO2 layer. Then, the LN wafer is removed by grinding to obtain the LN thin film. Finally, the surface of the LN film is polished by CMP. The mature preparation process establishes the groundwork for the widespread use of LNOI substrates. According to the literature, the optimized X-cut LNOI substrate has a K2 value of up to 35% and a TCF value of −0.2 ppm/°C for shear-horizontal (SH) waves [31]. It is a high-performance substrate for preparing SH-SAW and Lamb wave devices with a wide band and low loss [32,33]. This LNOI substrate can achieve a larger K2 and lower TCF by optimizing the structural parameters, providing a new possibility for obtaining a high-performance substrate for SAW gyroscopes. To date, there has been no discussion of the SAW gyroscopic effect in LNOI substrates.
In this paper, a three-dimensional finite element model was established to analyze the SAW propagation characteristics of a 128°Y–X LiNbO3/SiO2/Si substrate (in this paper, LN represents 128°Y–X LiNbO3). The influence of LNOI structural parameters on the phase velocity (vp), K2, TCF and gyroscopic gain factor (η) were investigated in detail. The thicknesses of various layers were optimized to obtain an LNOI substrate with a high K2 and η and a low TCF.

2. Gyroscopic Effect and Simulation Details

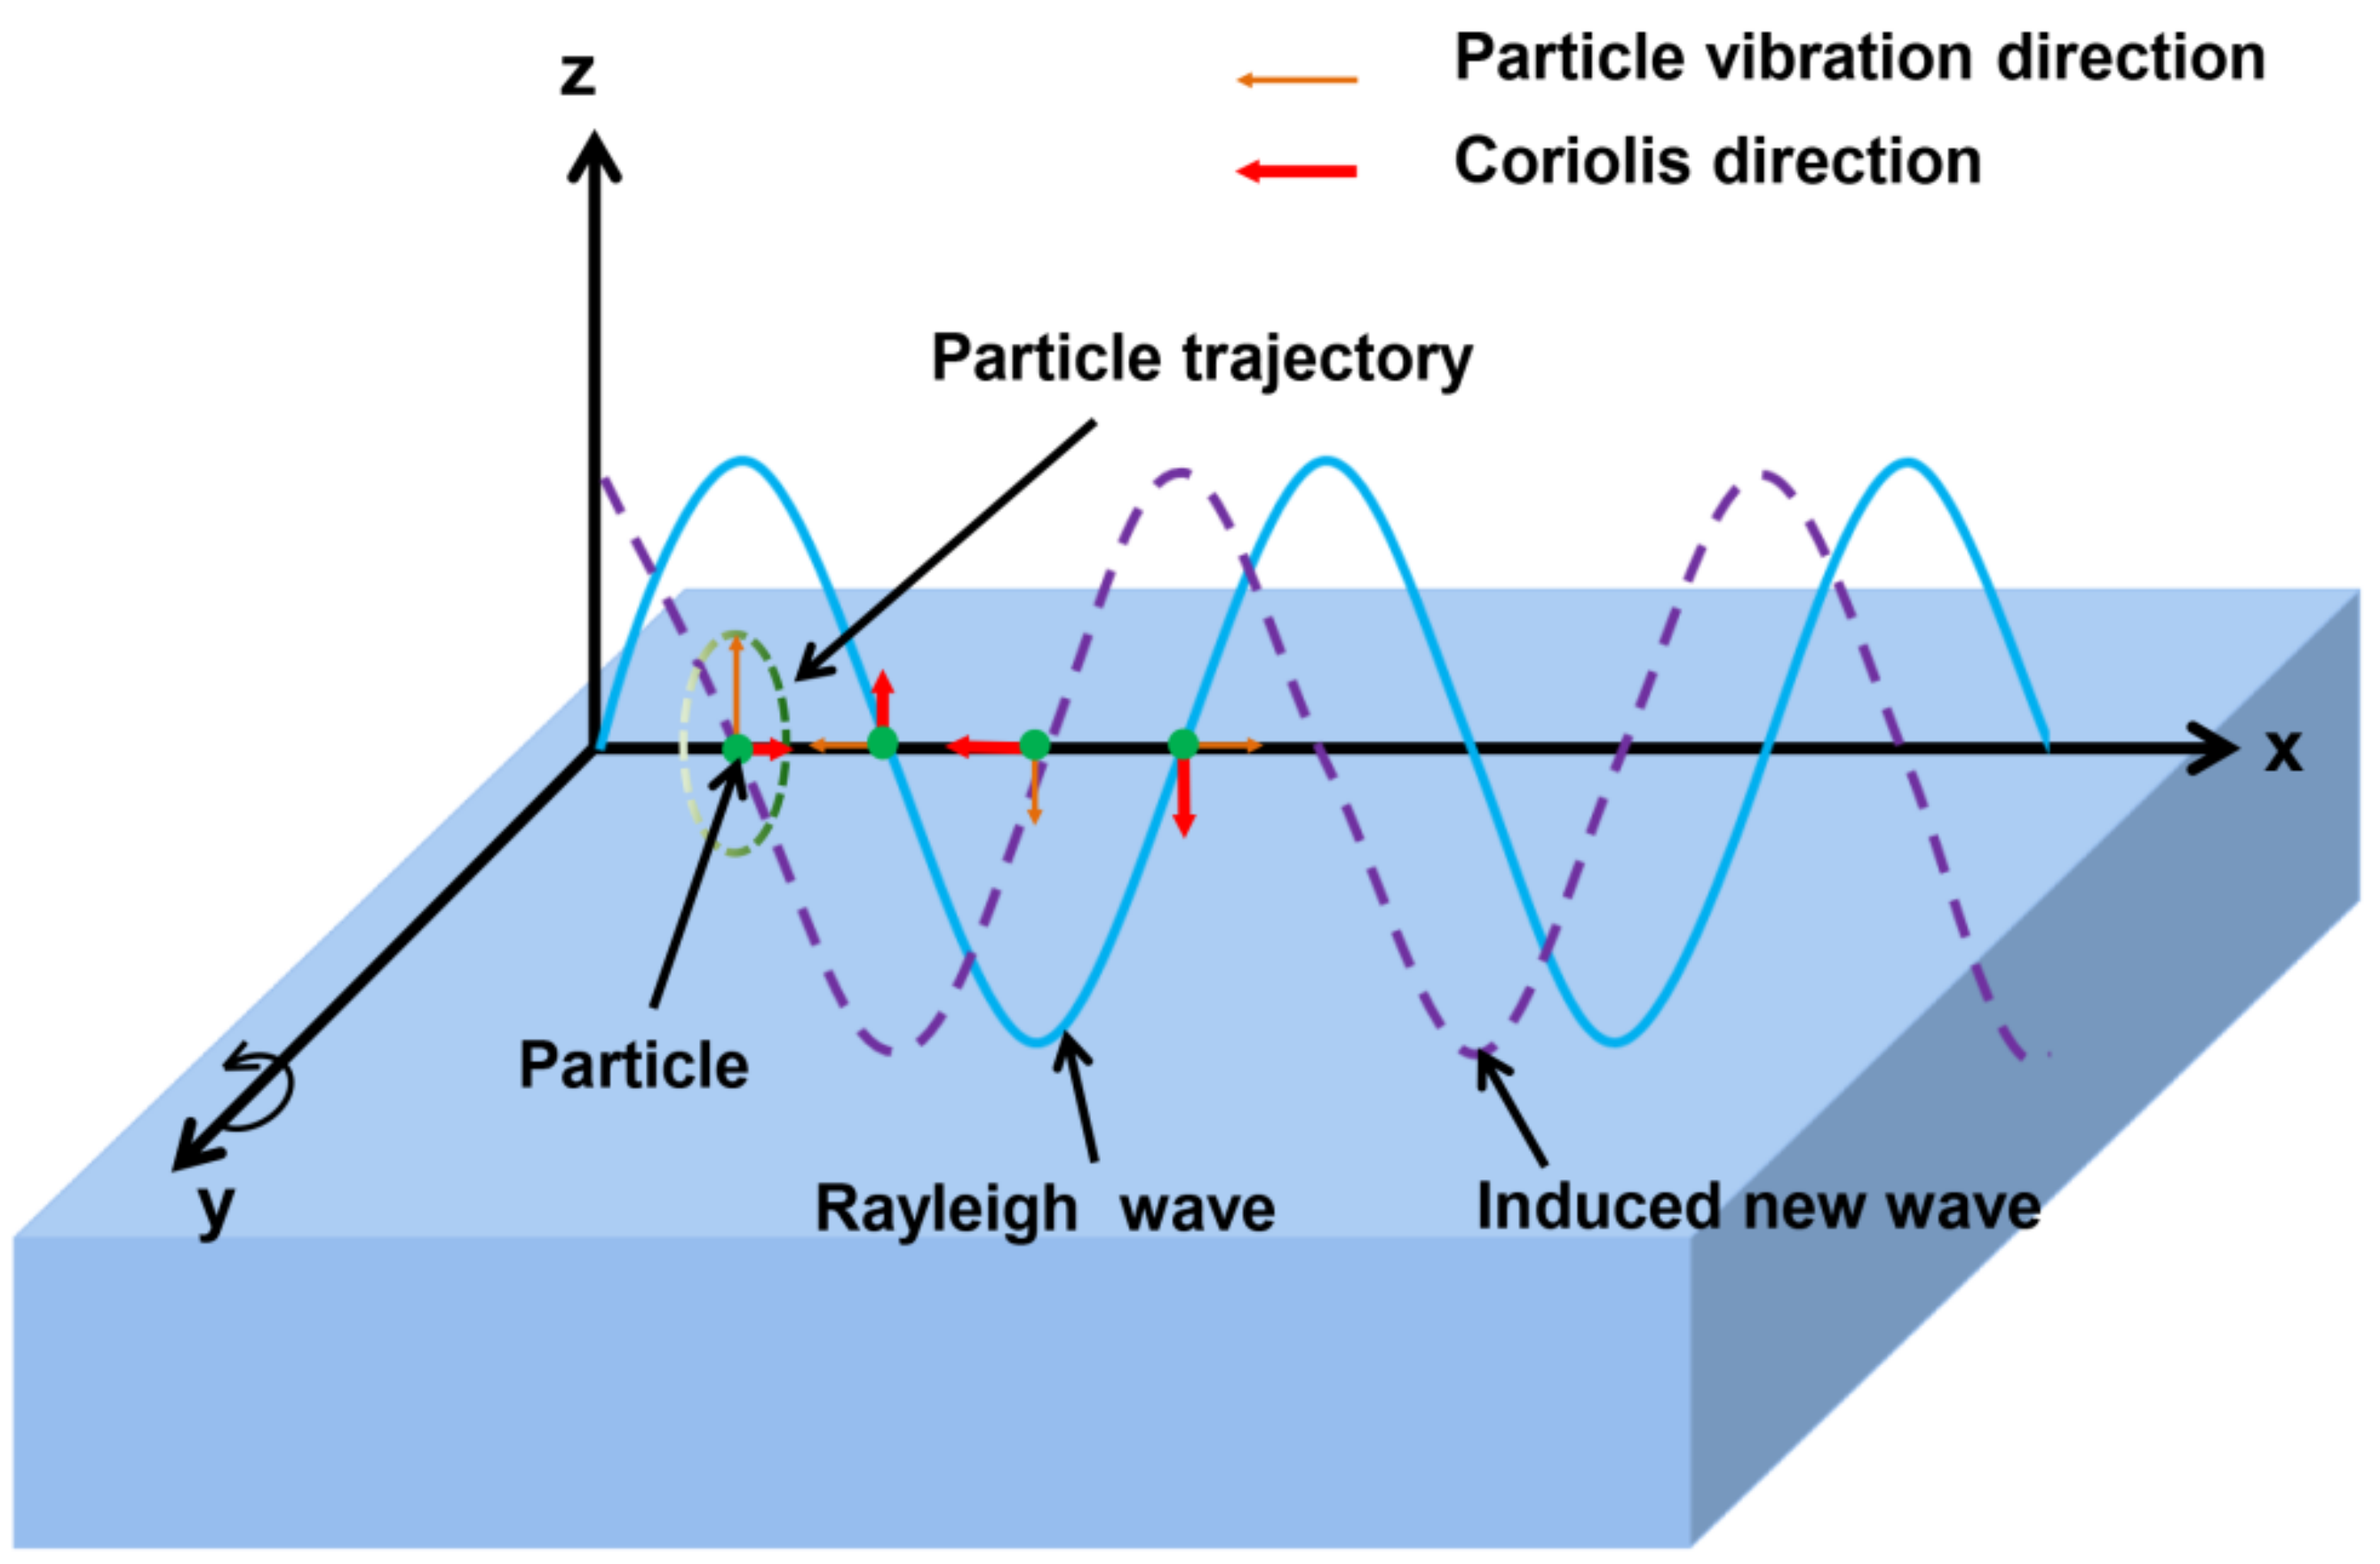
2.1. Gyroscopic Effect

A coordinate system is established on the surface of a semi-infinite elastic substrate, as shown in Figure 2. The Rayleigh wave propagates along the x-axis, and its amplitude decays exponentially along the z direction. The particle moves in the plane composed of the x-axis and the z-axis. Since the amplitude of the SAW attenuates with the depth of the substrate, the vibration displacement of the particle is greatest on the surface of the substrate. To clearly demonstrate the SAW gyroscopic effect, we take a vibrating particle on the surface of the medium as an example. Due to the characteristics of Rayleigh waves, the motion trajectory of the surface particle is actually a counterclockwise ellipse, and the motion direction is the normal direction of the ellipse. When the substrate rotates counterclockwise around the y-axis, the vibrating particles in the SAW are also affected by inertial forces such as the Coriolis force and centrifugal force. Both of these forces induce a new SAW with a phase shift from the original SAW. This new SAW is coupled with the initial Rayleigh wave propagating on the substrate surface, which causes the movement trajectory of the particle to change and the velocity of the SAW to shift [34]. This is known as the SAW gyroscopic effect.
By comparing the wave equations of the elastic medium before and after loading a rotation, the influence of the Coriolis force and other factors on the SAW phase velocity can be observed. When the medium is not rotating, the general wave equation of the elastic wave in the medium is:
ρ 2 u i t 2 = c i j k l 2 u k x j x l
where ρ and cijkl are the density and elastic coefficient of the medium, respectively, with i, j, k, l = 1, 2, 3. When the medium rotates at an angular velocity Ω relative to the fixed coordinate system, the wave equation becomes [35]:
ρ 2 u i t 2 = c i j k l 2 u k x j x l 2 ρ ε i j k Ω j u k t ρ Ω i Ω j u j Ω j 2 u i
In the above formula, the second term on the right side of the equal sign represents the Coriolis force, which depends linearly on the normalized rotation angle Ω/ω (Ω is the rotation vector, and ω is the angular frequency of the SAW device). The third term is the centrifugal force, which has a linear relationship with the square of Ω/ω. For piezoelectric materials, the wave velocity after loading a rotation can be calculated by jointly solving the wave equation and the electromagnetic wave equation with boundary conditions.

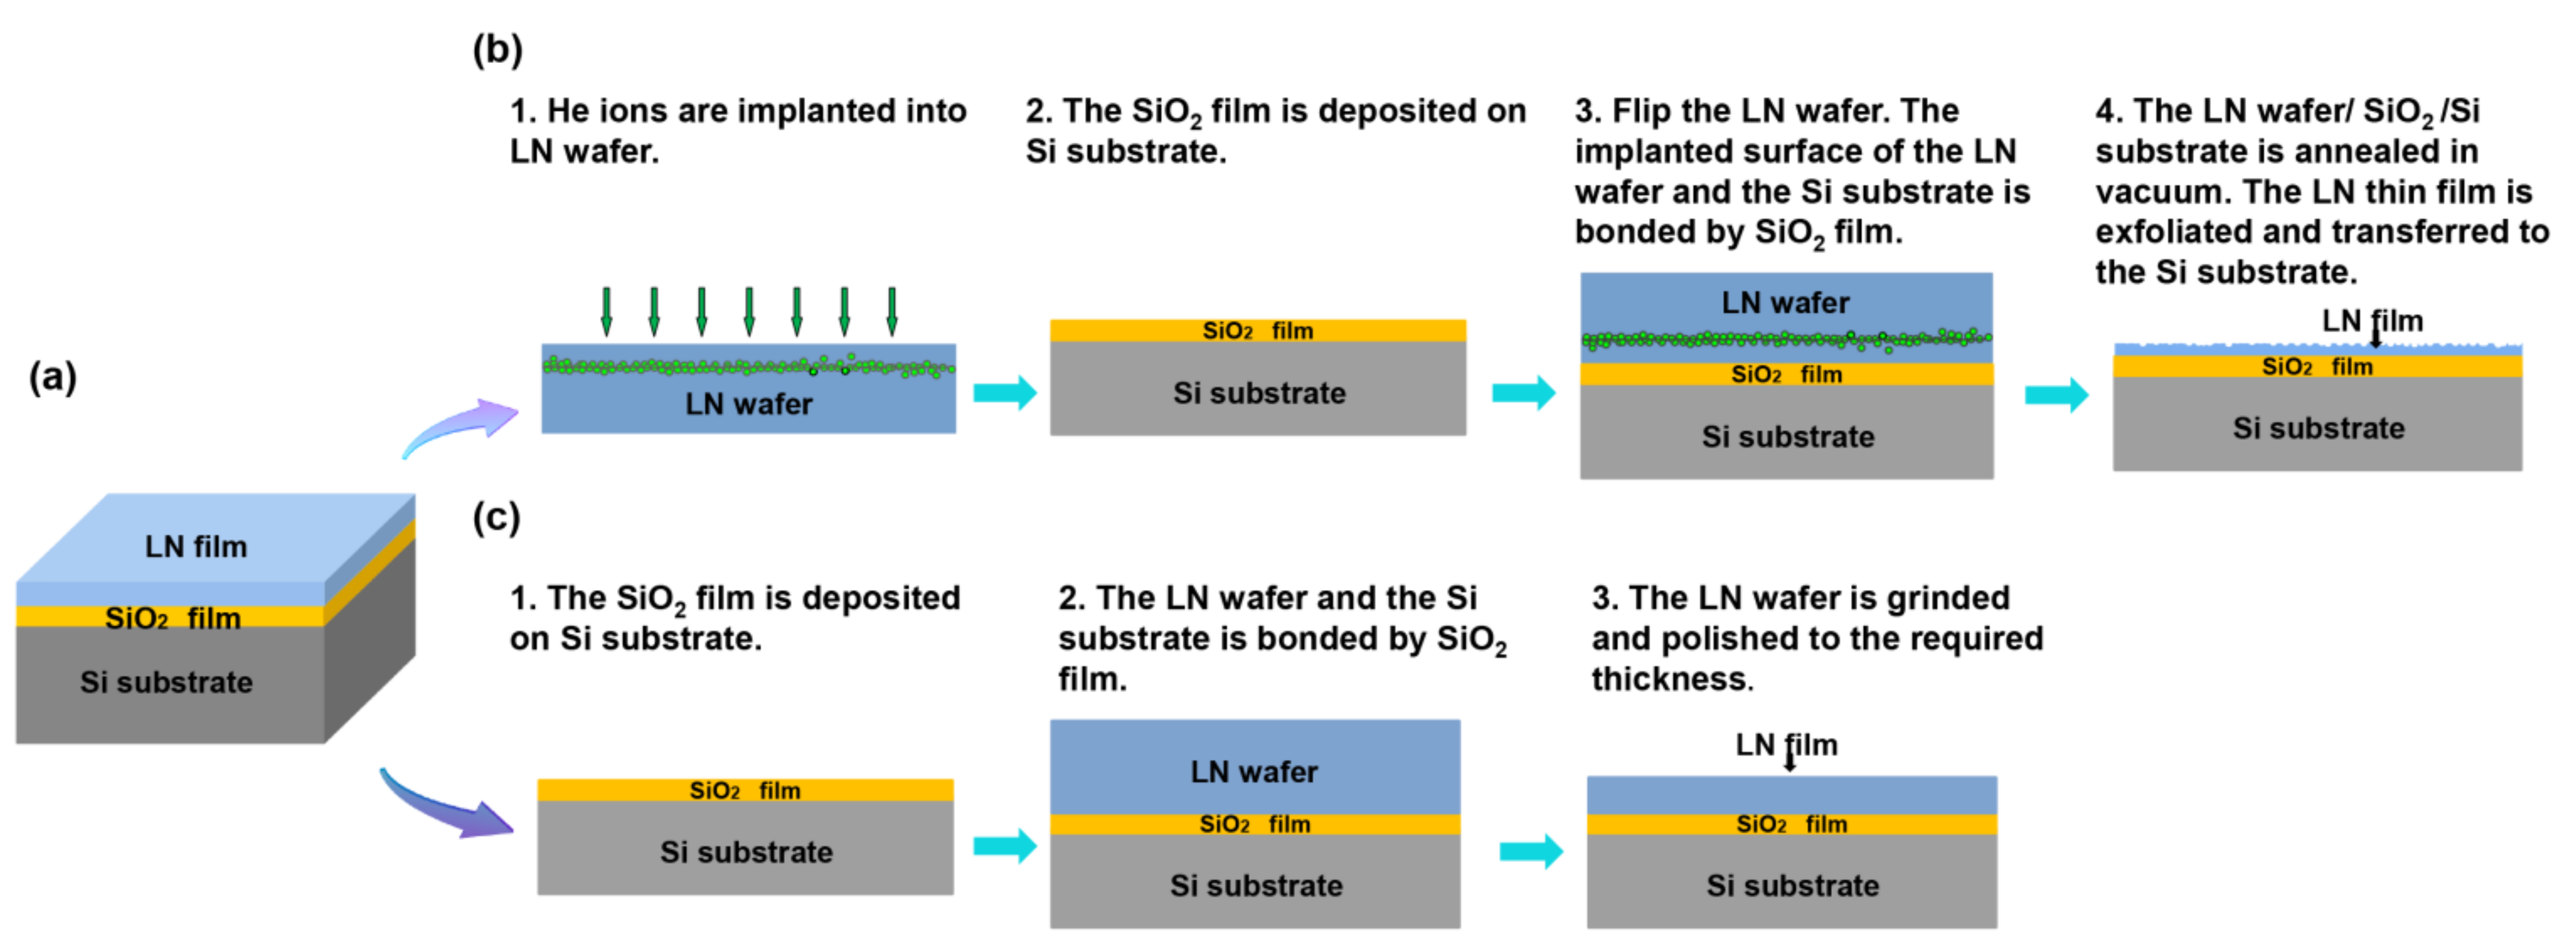
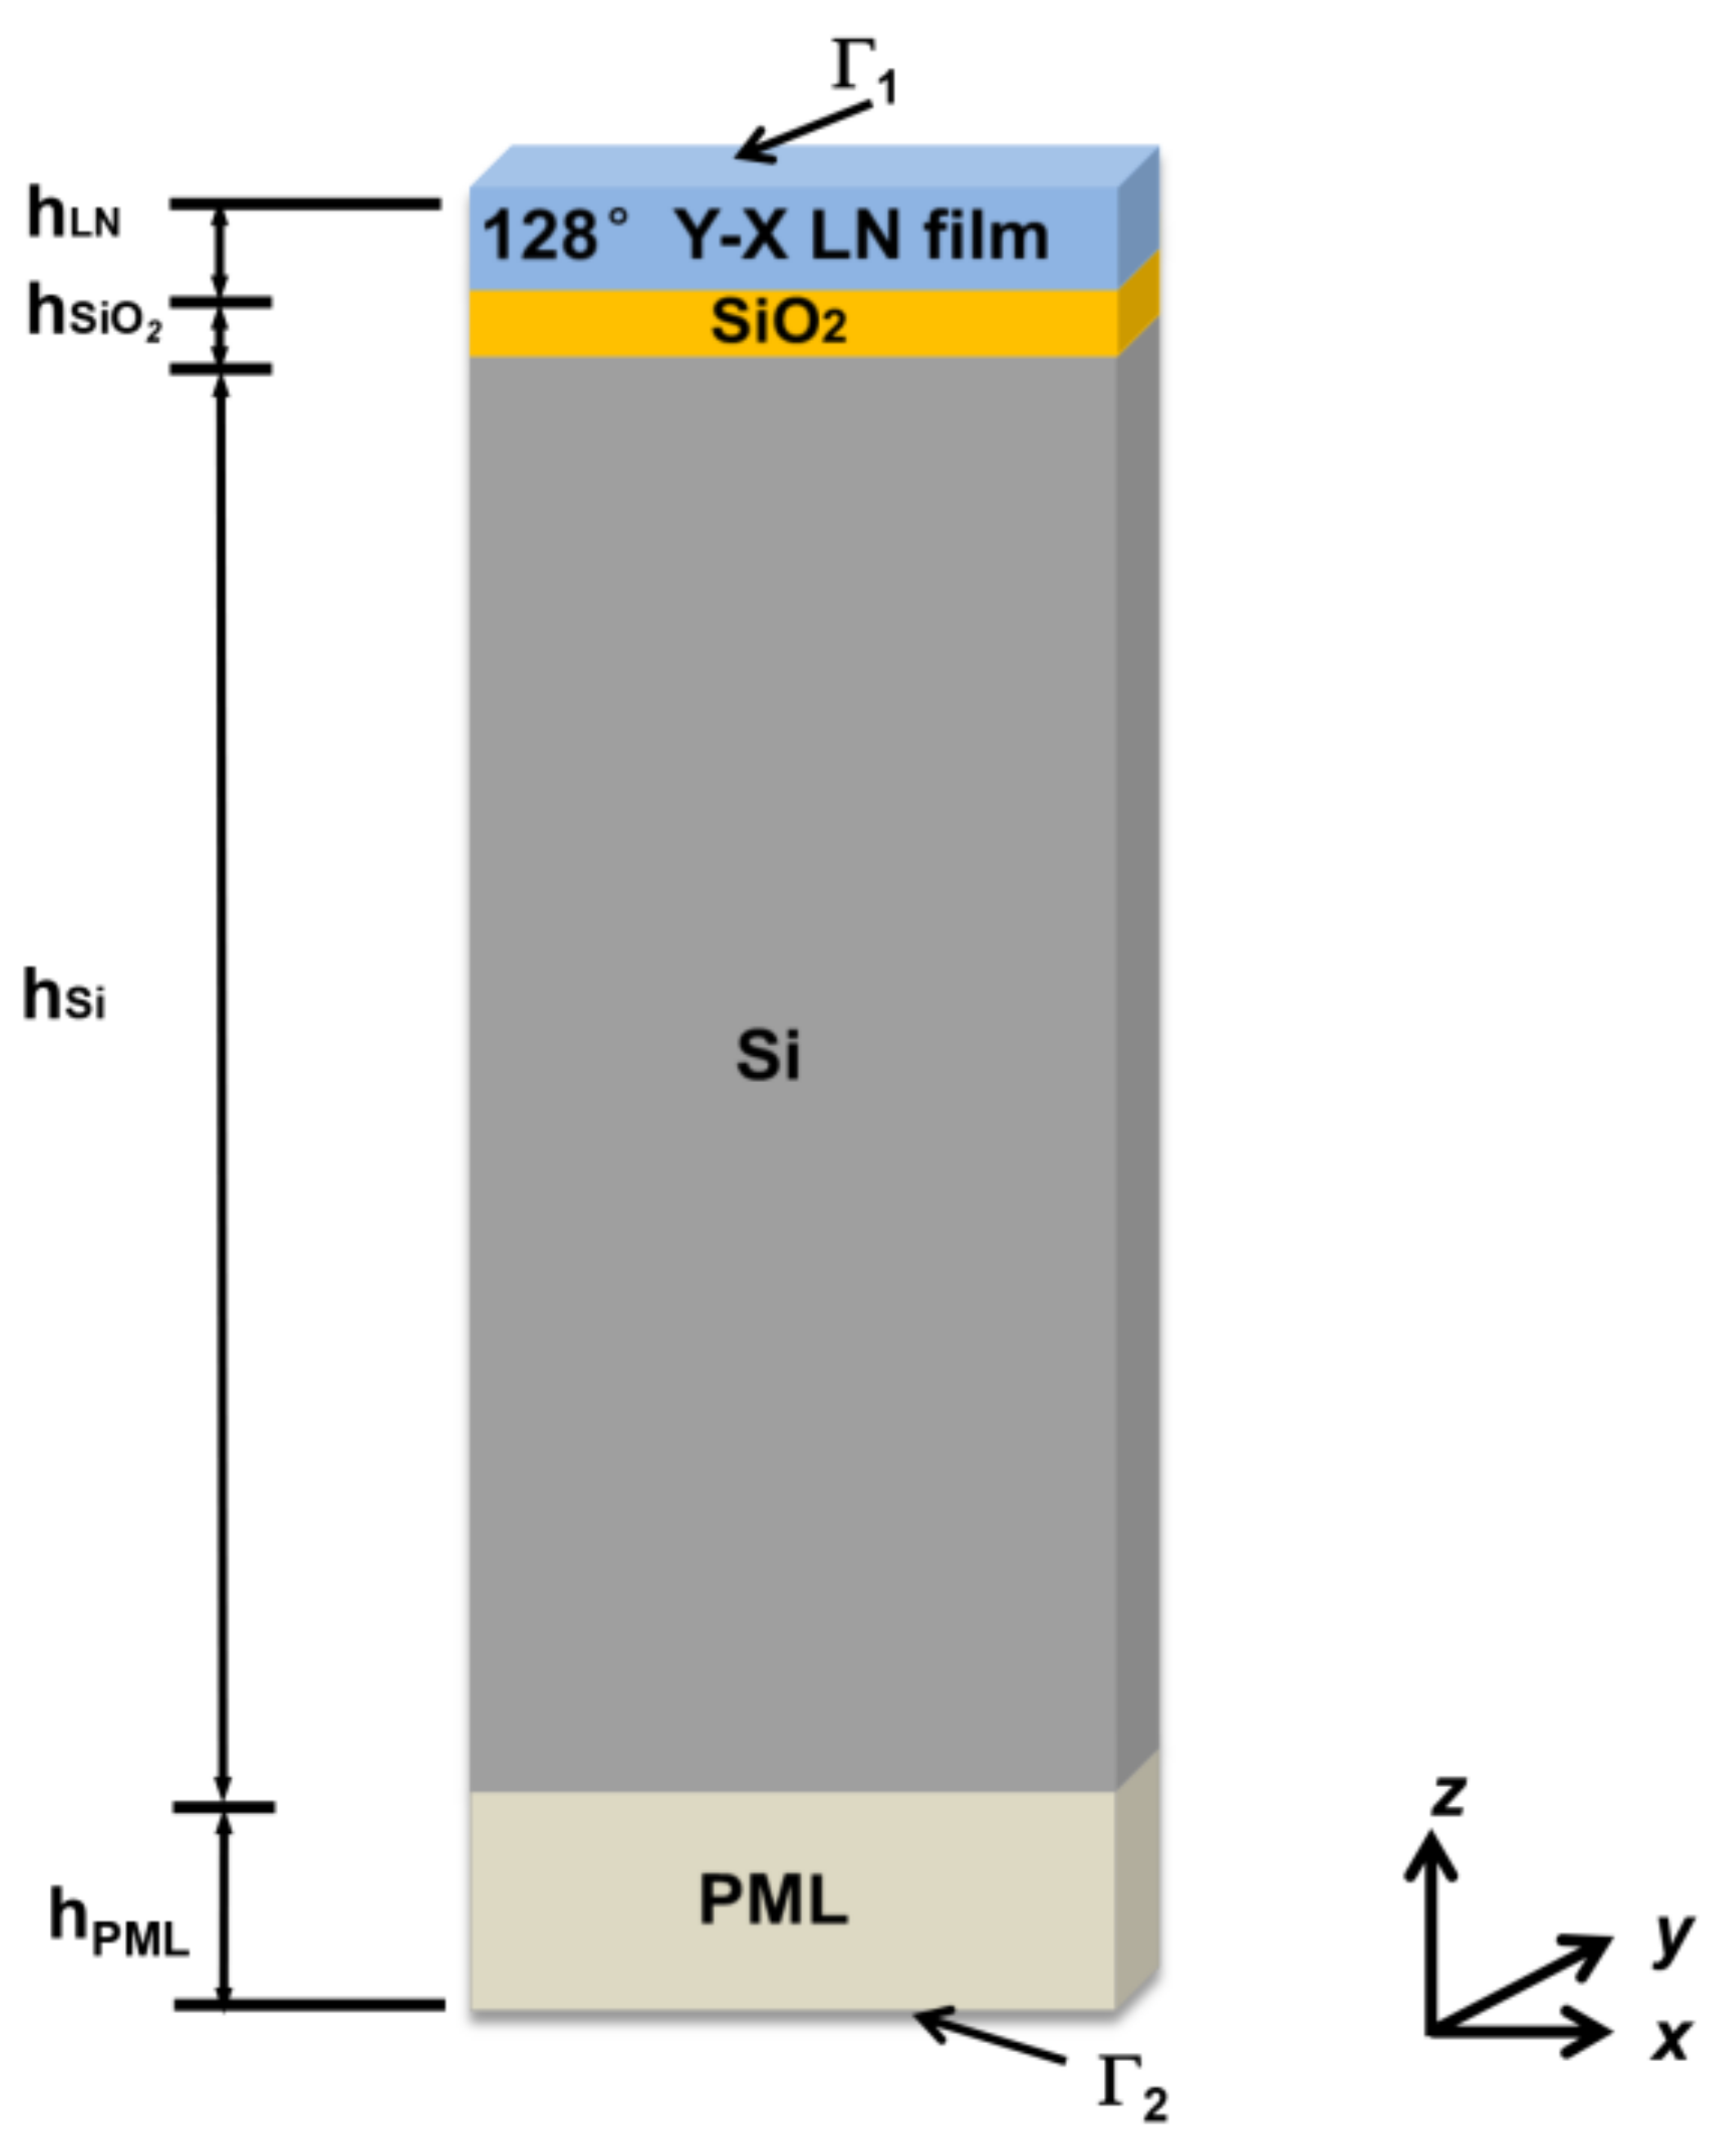
2.2. Simulation Details

The finite element method (FEM) is a common method for accurately simulating SAW devices, which is based on the piezoelectric constitutive equation and specific boundary conditions. The FEM is suitable for analyzing SAW characteristics in piezoelectric multilayer structures because it is highly flexible. The 3D model of the LNOI substrate was established in COMSOL, as shown in Figure 3. The model presents a periodic unit of the LNOI substrate. In this model, hLN is the LN thin film thickness, and hSiO2 is the SiO2 layer thickness. The thickness of the Si substrate is replaced by a finite depth of 5 wavelengths (λ) and a perfectly matched layer (PML) at the bottom with a thickness of 1 λ [31]. The PML gradually absorbs mechanical and electrical interference by segments before they reach the boundary, resulting in a smaller model size [36]. In addition, the spurious resonance introduced by reflections at the top and bottom can be suppressed. The boundary conditions of the LNOI substrate model are as follows: (1) mechanical boundary conditions: the upper surface Γ1 is free, and the lower surface Γ2 is fixed; (2) electrical boundary conditions: the upper surface Γ1 has zero charge or is grounded, and the lower surface Γ2 has zero electric charge; (3) the front and back sides and the left and right sides have periodic boundary conditions; and (4) the LN/SiO2 interface and the SiO2/Si interface have continuous mechanical boundary conditions.
The vibration modes of the SAW in the LNOI substrate can be obtained by characteristic frequency analysis. Each propagation mode has a resonance frequency and anti-resonance frequency, which can be obtained from the vibration displacement distribution. If the electrode reflection effect is ignored, the two resonant frequencies are equal. Changing the electrical boundary condition of Γ1 to zero charge or grounded, the frequency of the vibration mode under the free and metalized boundary conditions can be obtained. The corresponding free and metalized SAW velocities (vf and vm) can be calculated by multiplying the resonant frequency by the wavelength. K2 can be calculated by [37]:
K 2 = 2 ( v f v m ) v f
TCF is an important factor that characterizes the temperature stability of SAW devices and can be calculated by [23,24]:
T C F = v 35 v 15 20 v 25 β
where v35, v25 and v15 are the SAW phase velocities at 35 °C, 25 °C and 15 °C, respectively, and β is the coefficient of thermal expansion of the substrate.
The temperature dependence of the material constant is approximated by a second-order function and is expressed as follows [23]:
X = X 0 1 + α 1 T T 0 + α 2 T T 0 2
where X is the material constant at each temperature, X0 is the material constant at room temperature, T is the temperature, T0 is room temperature (25 °C in this paper), and α1 and α2 are the first- and second-order temperature coefficients of the material constants, respectively.
The gyroscopic effect can be simulated by loading a rotating frame with a given angular velocity into the LNOI model. For the LNOI model without rotation, the resonance and anti-resonance frequencies are equal. When the rotation angular velocity Ω is loaded, the resonant frequency splits into fr+ and fr−, where + and − represent the forward and reverse propagation directions of the SAW, respectively [38]. Hence, the SAW phase velocity vr± after loading a rotation is [14]:
v r ± = f r ± λ
The SAW velocity shift caused by the gyroscopic effect can be calculated by:
Δ v ± = v r ± v f
Details of the material constants and temperature coefficients are listed in Table 1.

3. Results and Discussion

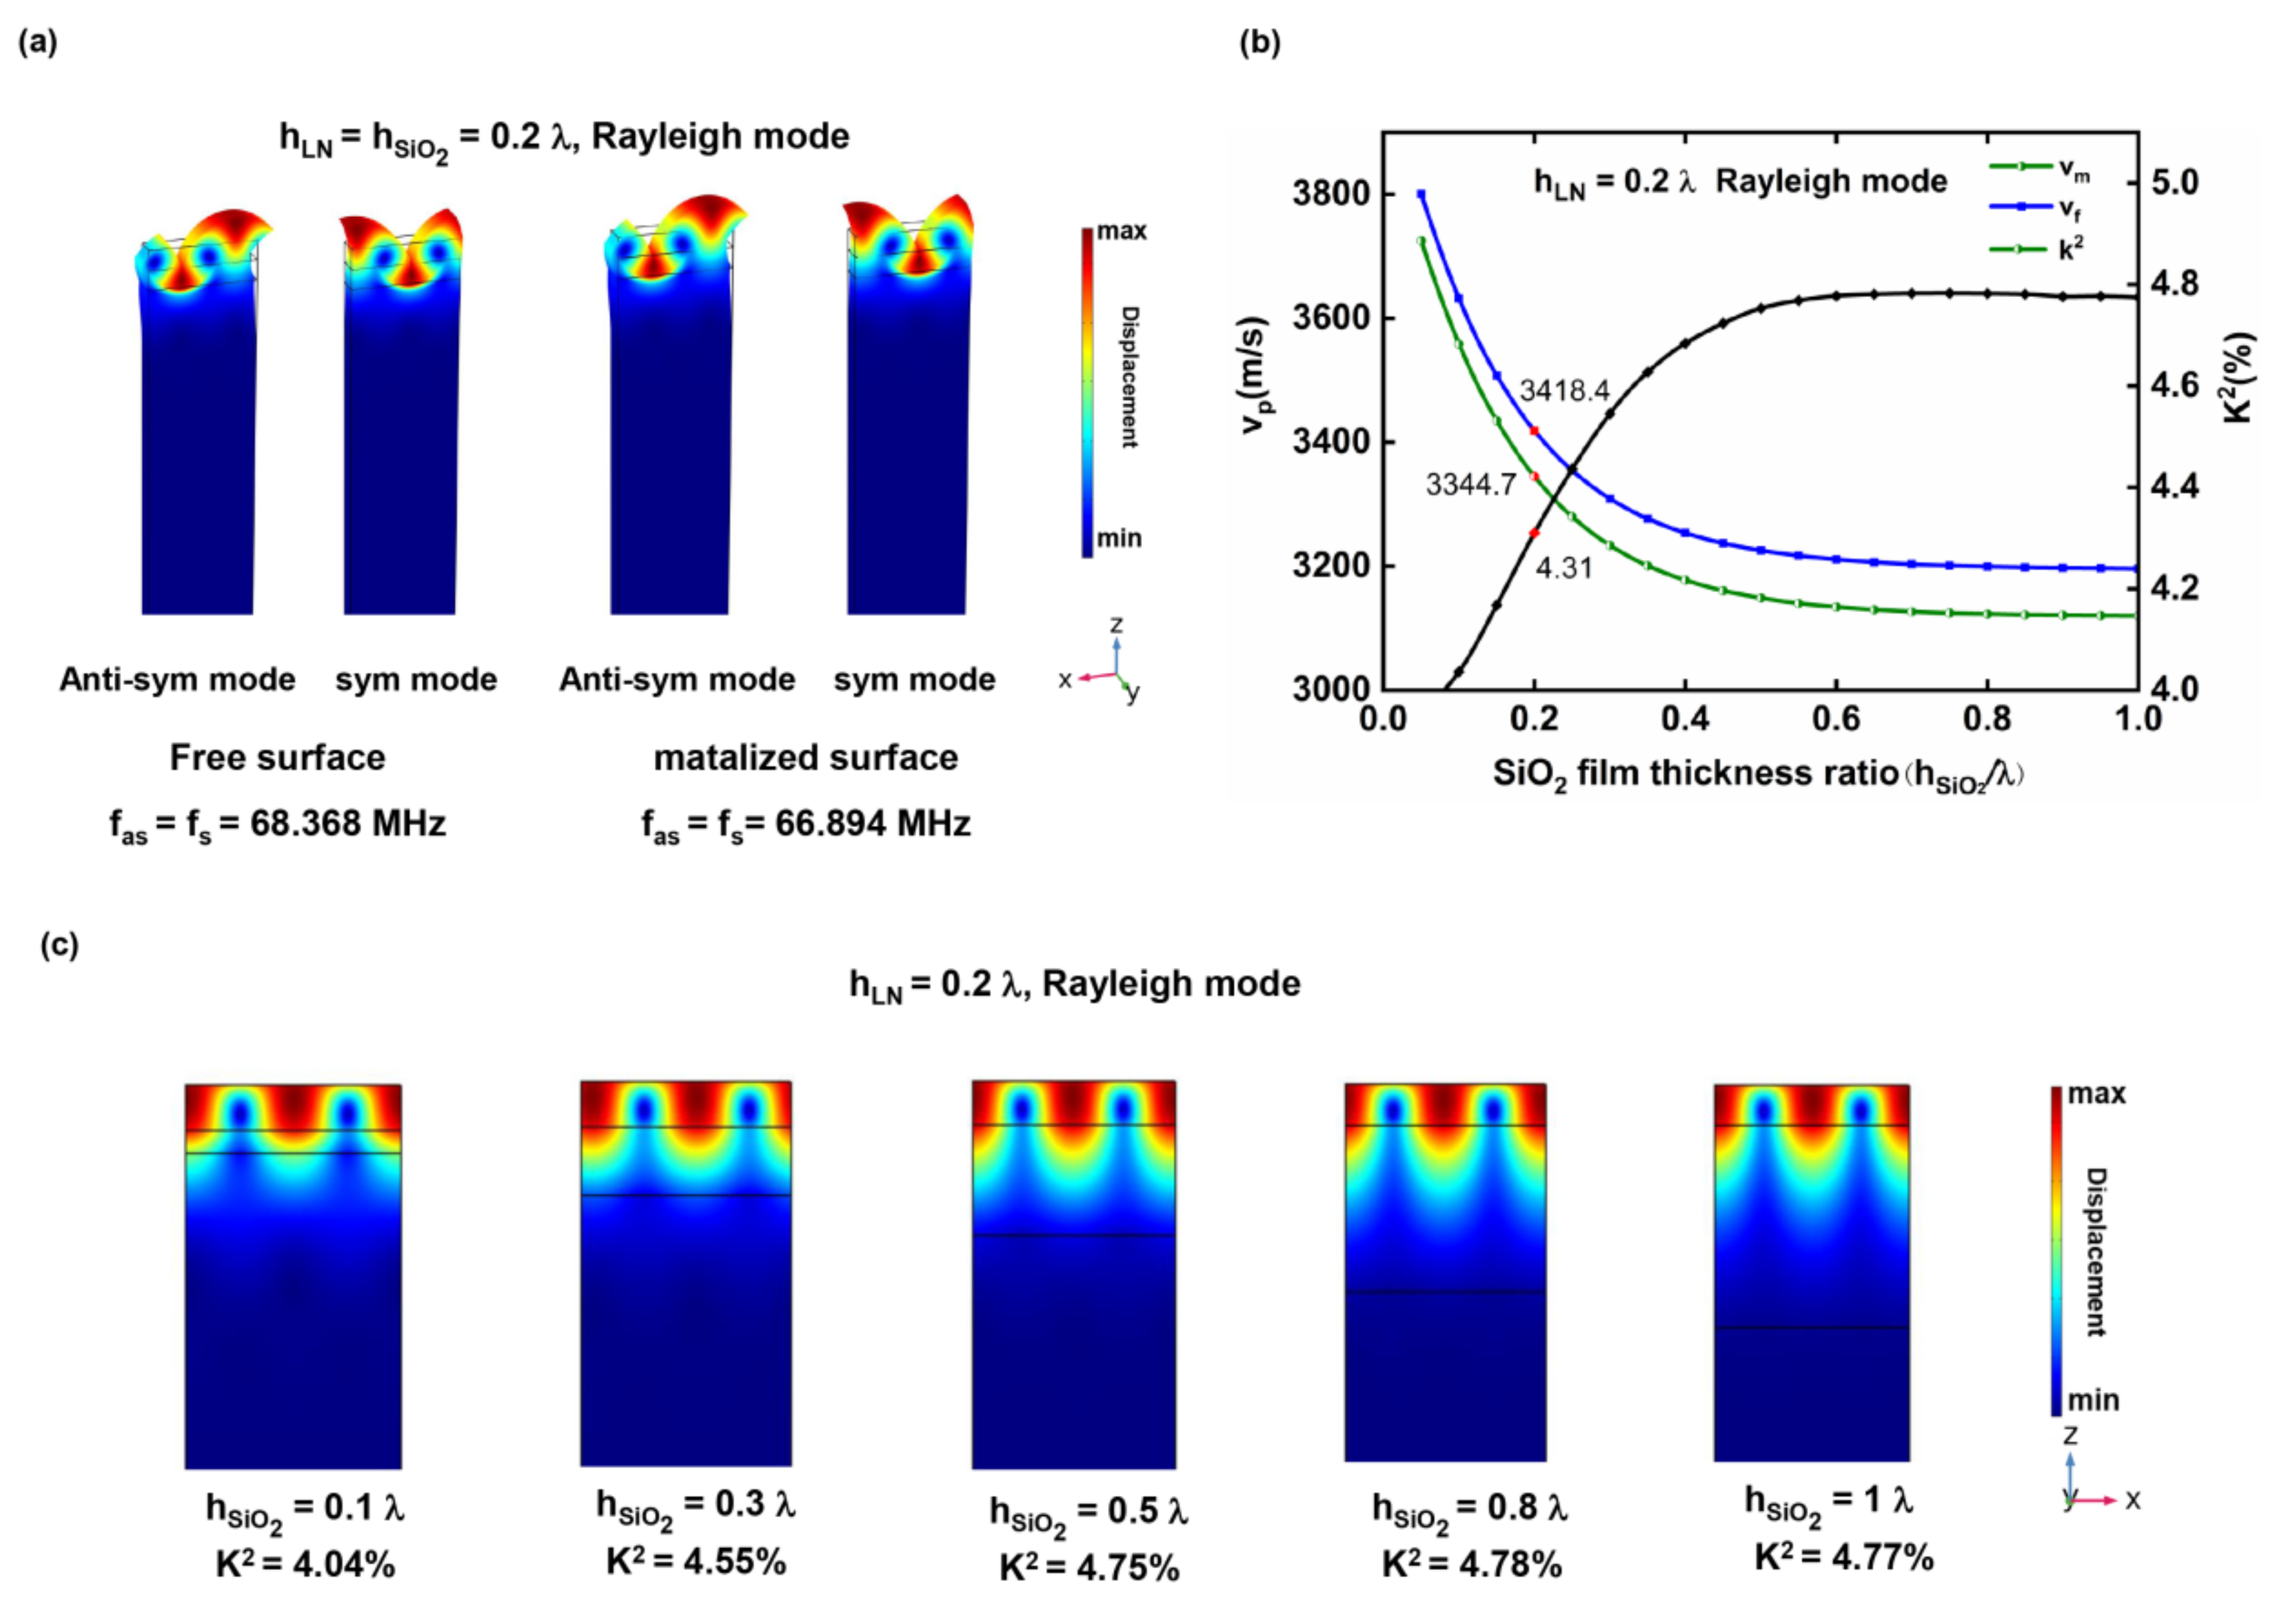
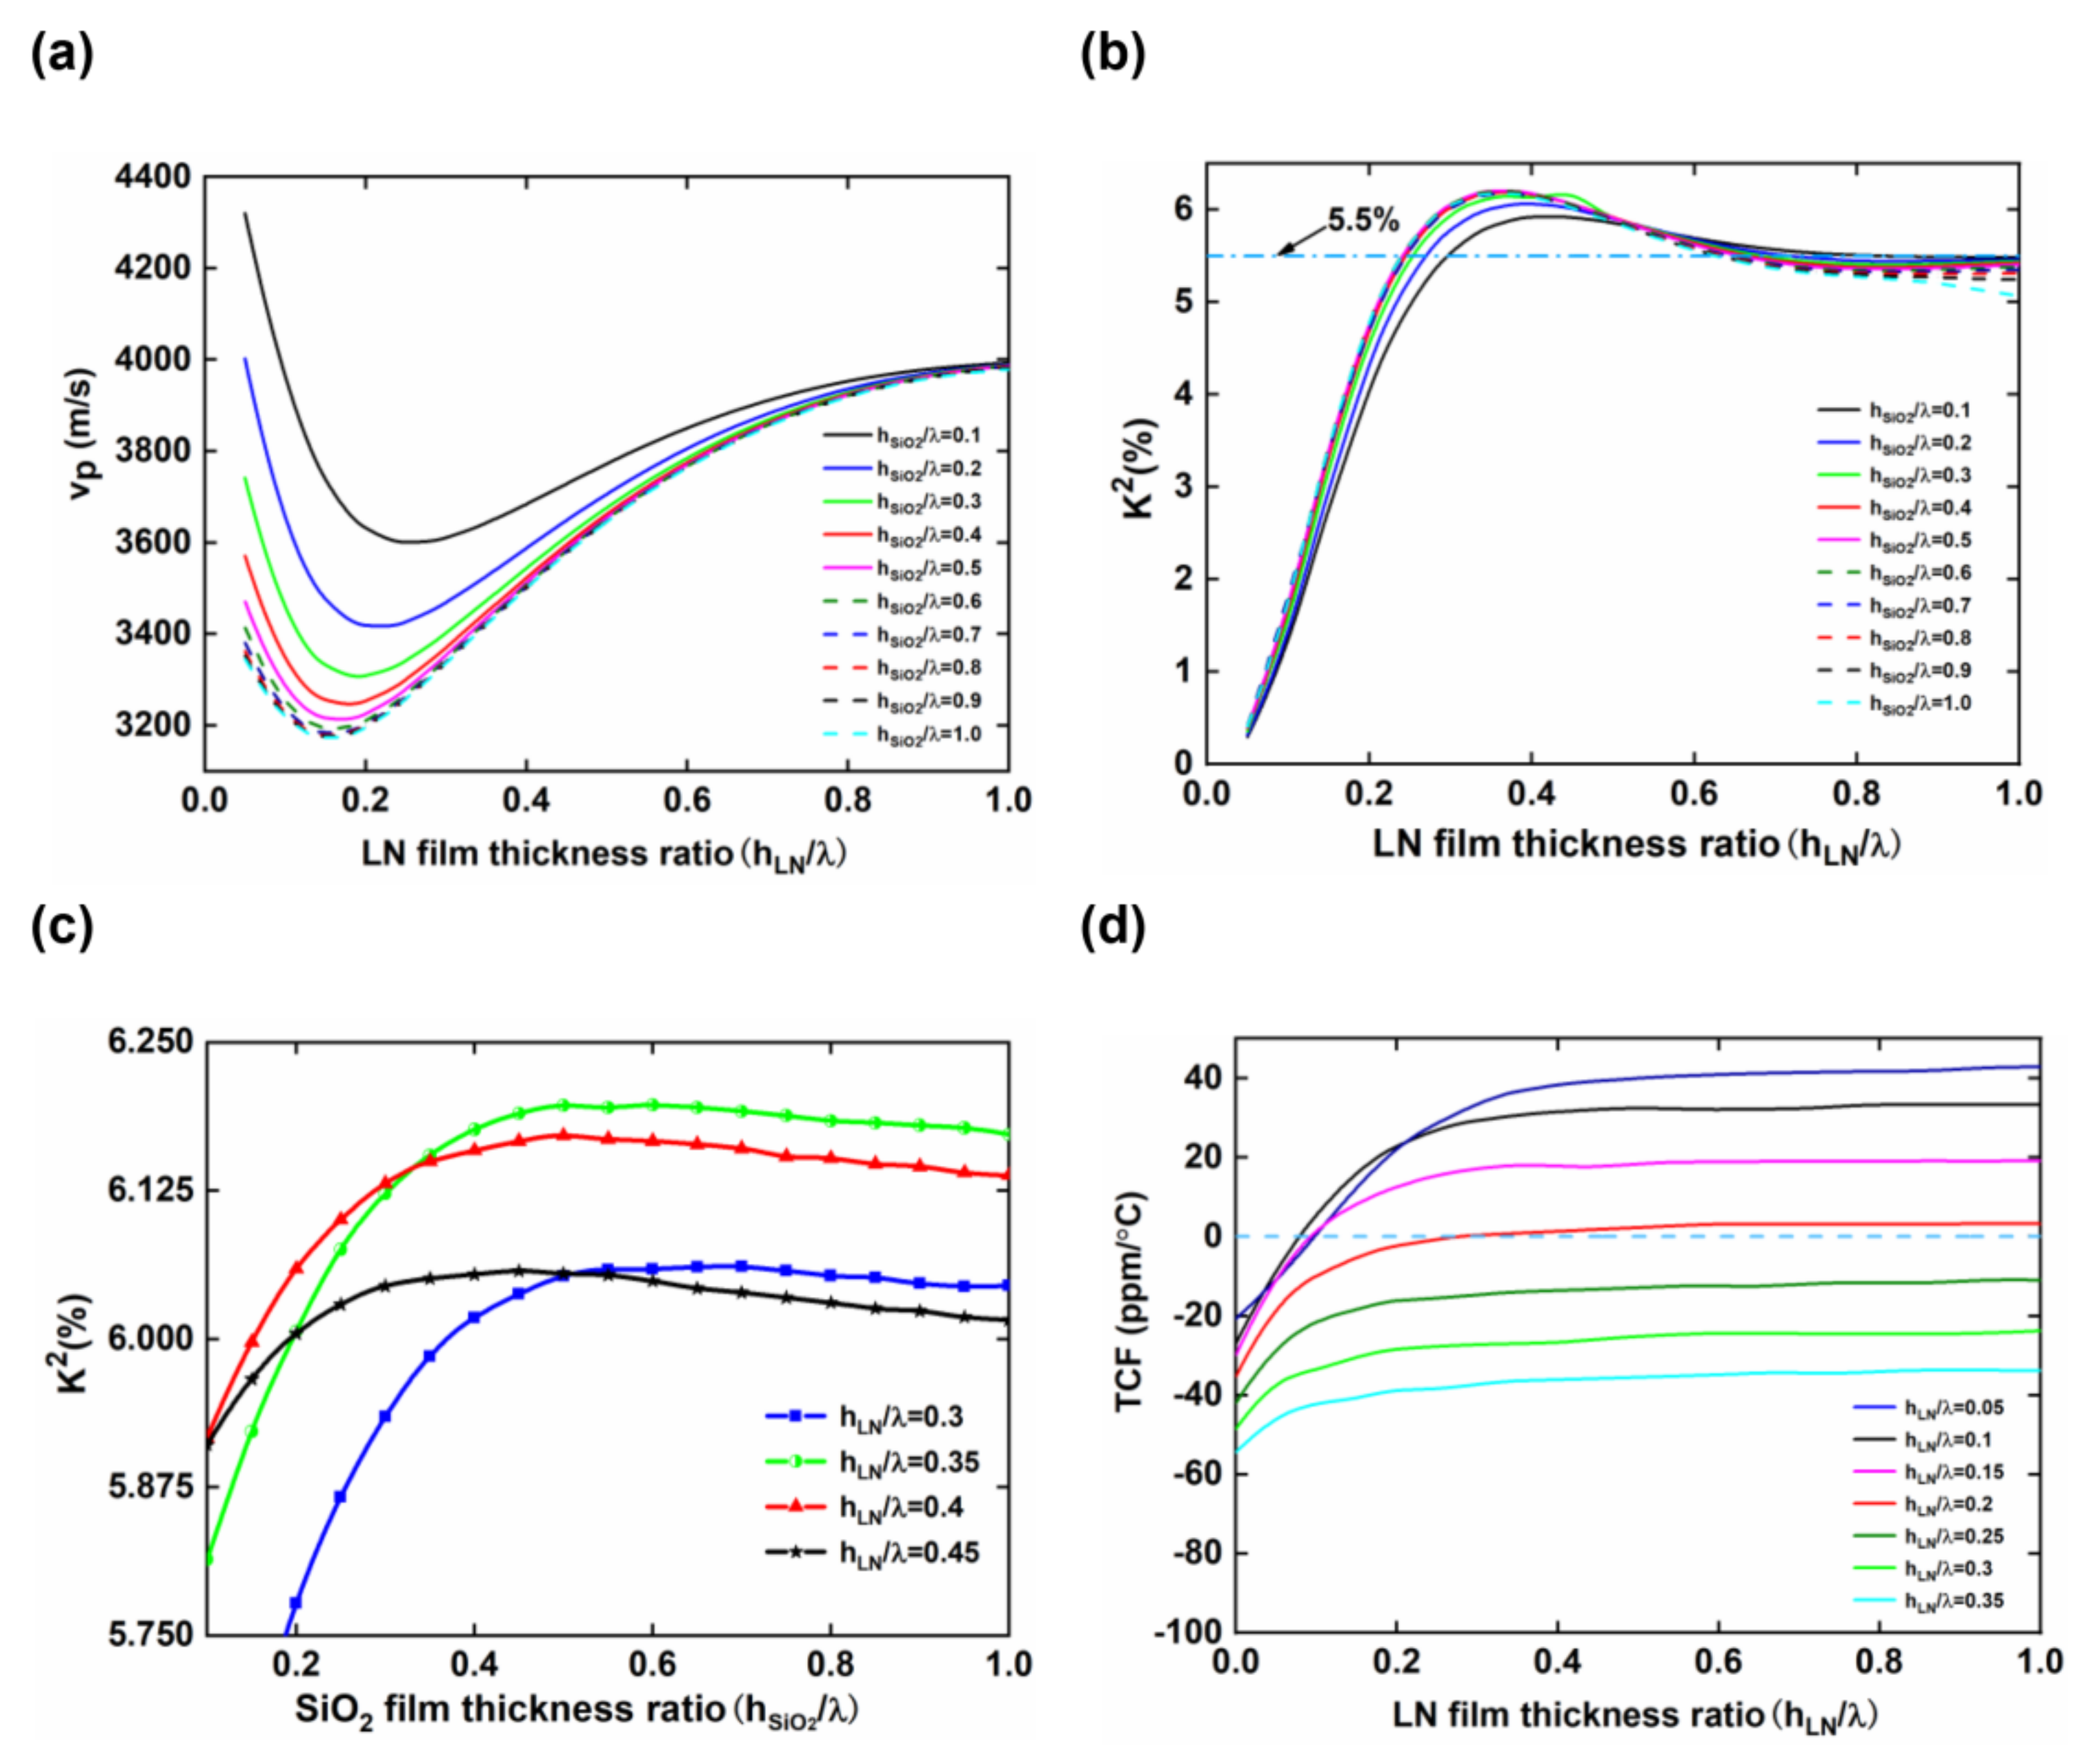
3.1. SAW Characteristics of the LNOI Substrate

There are multiple SAW modes in the LNOI substrate, such as Rayleigh and Love waves, which can be determined by the displacement distribution of the resonant modes. Rayleigh waves propagate on the surface of the medium, and their displacement components are mainly concentrated in the x and z directions, with almost no displacement components in the y direction. Figure 4a shows the anti-resonance and resonance modes of a Rayleigh wave on the LNOI substrate with an hLN of 0.2 λ and an hSiO2 of 0.2 λ. The resonant frequencies are 68.368 MHz and 66.894 MHz under free and metalized surface conditions, respectively. Furthermore, the vf and vm values of this structure are calculated to be 3418.4 m/s and 3344.7 m/s, respectively, and K2 is 4.31%.
Generally, the SAW characteristic parameters of piezoelectric crystals are fixed. In contrast, the propagation characteristics of SAWs in piezoelectric multilayer structures are dispersive [39]. This means that the vp, K2 and TCF of the SAW are all related to the normalized thicknesses of the LN film (hLN/λ) and the SiO2 layer (hSiO2/λ). Figure 4b exhibits the variations in the vf, vm and K2 of the Rayleigh wave with hSiO2/λ when hLN/λ is 0.2. vf and vm decrease sharply as hSiO2/λ increases from 0.05 to 0.5; vf and vm decrease slowly as hSiO2/λ increases further. In addition, when hSiO2/λ increases, the velocity difference between vf and vm gradually increases. When hSiO2/λ > 0.5, the difference between vf and vm gradually stabilizes. Therefore, the K2 of an LNOI substrate with an hLN/λ of 0.2 rises rapidly and then remains stable with increasing hSiO2/λ, as shown in Figure 4b. The variation trend of K2 can be illuminated more intuitively by comparing the vibration modes of LNOI substrates with different SiO2 layer thicknesses. Figure 4c shows the vibration mode of the LNOI substrate with an hLN/λ of 0.2 and an hSiO2/λ of 0.1, 0.3, 0.5, 0.8, and 1. Generally, the vibration of the Rayleigh wave is concentrated within a wavelength range under the surface of the medium. Therefore, the vibration of the Rayleigh wave in the LNOI substrate with an hLN/λ of 0.2 cannot be completely concentrated in the LN film. When hSiO2/λ is 0.1, the vibration is mainly concentrated in the LN film and SiO2 layer, and the Si substrate also has a partial vibration distribution. Since SiO2 and Si are not piezoelectric materials, the K2 of the LNOI substrate is only 4.04%, which is relatively small. When hSiO2/λ is increased to 0.3, the vibration is concentrated mostly in the LN film and SiO2 layer, with little leakage into the Si substrate. This is because the velocity of the Rayleigh wave in the SiO2 layer is smaller than that in the Si substrate and LN film, so the SiO2 layer functions similarly to a waveguide. Therefore, the K2 of the LNOI substrate increases to 4.55%. When hSiO2/λ is 0.5, the vibration is completely concentrated in the LN film and SiO2 layer, and K2 reaches 4.75%. As hSiO2/λ is increased to 0.8 and 1, the vibration distribution of Rayleigh waves is essentially the same as that when hSiO2/λ is 0.5 and K2 is 4.78% and 4.77%, respectively.
The center frequency of the SAW sensor is determined by the phase velocity. The variation trend of vp versus hLN/λ on the free surface of an LNOI substrate with different hSiO2/λ is presented in Figure 5a. When hSiO2/λ is constant, the curves show that the vp of the LNOI substrate rapidly decreases and then slowly increases with increasing hLN/λ. This is because the thickness of the LN film in the LNOI substrate directly affects the vibration distribution of Rayleigh waves. When hLN/λ is very small, most of the wave vibration in the LNOI substrate is concentrated in the SiO2 layer or Si substrate. At this time, the SiO2 layer only serves as an SAW propagation medium, so the vp of the LNOI substrate drops rapidly. When hLN/λ increases to a certain value, more vibration energy is concentrated in the LN film, and the SiO2 layer acts as a waveguide layer, coupling more vibrations into the LN thin film and increasing the phase velocity. Finally, vp approaches the LN crystal value of 3980 m/s. In addition, the change rates of the vp of the LNOI substrate for different hSiO2/λ are often significantly different. Taking hLN/λ in the 0.05~0.15 range as an example, when hSiO2/λ is 0.1, vp drops from 4320.9 m/s to 3739.05 m/s, and the velocity difference is as high as 581.85 m/s; when hSiO2/λ is 0.5, vp decreases from 3471.3 m/s to 3216.05 m/s, and the velocity difference is only 255.25 m/s. This indicates that the vp of an LNOI substrate with an hSiO2/λ of 0.1 is more sensitive to changes in the structural parameters.
K2, which is a parameter used to measure the conversion efficiency of piezoelectric materials between mechanical energy and electrical energy, affects the maximum design bandwidth and insertion loss of the device. A high K2 is an important criterion for high-performance SAW substrate materials. Figure 5b shows the dispersion curves of the calculated K2 of the LNOI substrate versus hLN/λ under different hSiO2/λ. The results demonstrate that the variation tendencies of the K2 curves are consistent when hSiO2/λ is a constant. The K2 of the LNOI substrate increases rapidly as hLN increases and then declines slowly. Finally, the K2 of the LNOI substrate becomes approximately 5.3%, close to the value of the LN crystal [23]. The result indicates that the K2 of the LNOI substrate is mainly determined by the thickness of the piezoelectric layer LN. The blue shaded area in Figure 5b marks the area where K2 is greater than 5.5%. When hLN/λ is between 0.3 and 0.6 and hSiO2/λ is chosen as any value greater than 0.1, the K2 of the LNOI substrate is greater than 5.5%. To obtain the structural parameters of the LNOI substrate with a high K2, the value of K2 for different hSiO2/λ when hLN/λ is 0.3~45 is calculated. As shown in Figure 5c, although hLN/λ is different, hSiO2/λ has basically the same influence on the K2 of LNOI, showing a trend of an initial rapid rise and then maintaining stability. When hLN/λ is between 0.3 and 0.45 and hSiO2/λ > 0.4, the K2 of the LNOI substrate is greater than 6%. In particular, the K2 of the LNOI substrate reaches 6.2% when hLN/λ is 0.35 and hSiO2/λ is between 0.5 and 0.65.
The TCF reflects the stability of the central frequency of an SAW device as the temperature changes. The LN crystal has a large negative TCF of −75 ppm/°C, whereas SiO2 has a positive TCF. Therefore, a reasonable SiO2 thickness in the LNOI substrate can offset the influence of LN, producing a substrate with good temperature stability. Based on the characteristics of Rayleigh waves, when hLN is larger, the energy of the SAW is basically concentrated in the LN film. The vp and K2 of the LNOI substrate approach those of the LN crystal, and the TCF behaves similarly. Figure 5d shows the variation trend of the TCF with hSiO2/λ when hLN/λ is between 0.05 and 0.35. The SiO2 layer achieves temperature compensation for the negative TCF of the LNOI substrate with increasing hSiO2/λ. In particular, the TCF of the LNOI substrate increases from −18.75 ppm/°C to 3.19 ppm/°C when hLN/λ = 0.2, and the overall TCF is very small. When hSiO2/λ is 0.3, the TCF of the LNOI substrate is 0.3 ppm/°C, which is almost zero. In addition, the TCF of the LNOI structure is also close to zero for the following hLN/λ and hSiO2/λ parameter combinations: 0.05 and 0.097, 0.1 and 0.078, and 0.15 and 0.095, respectively.

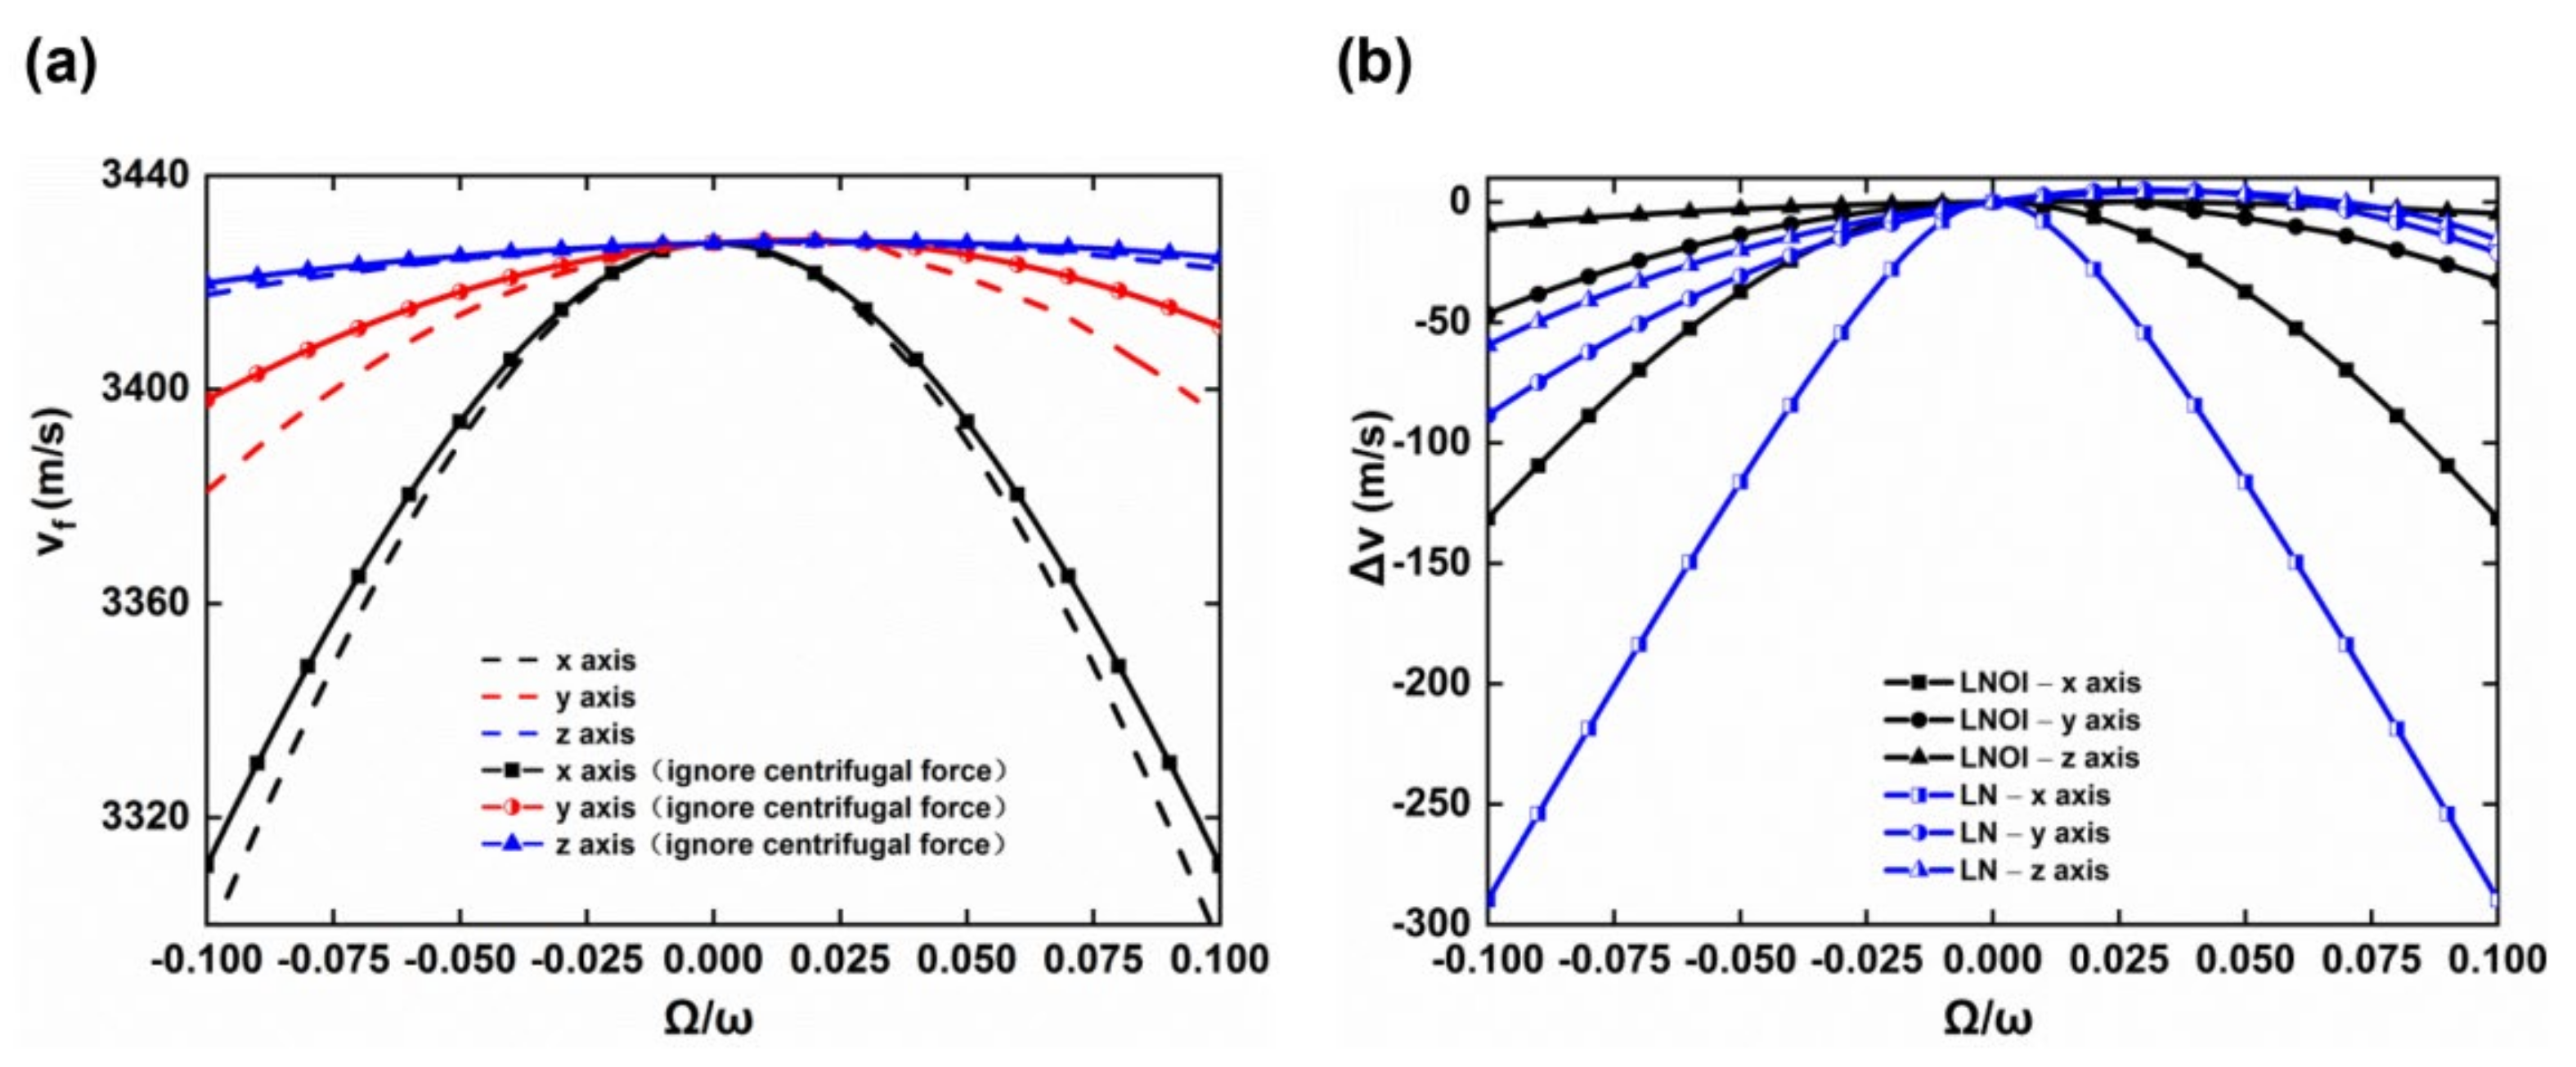
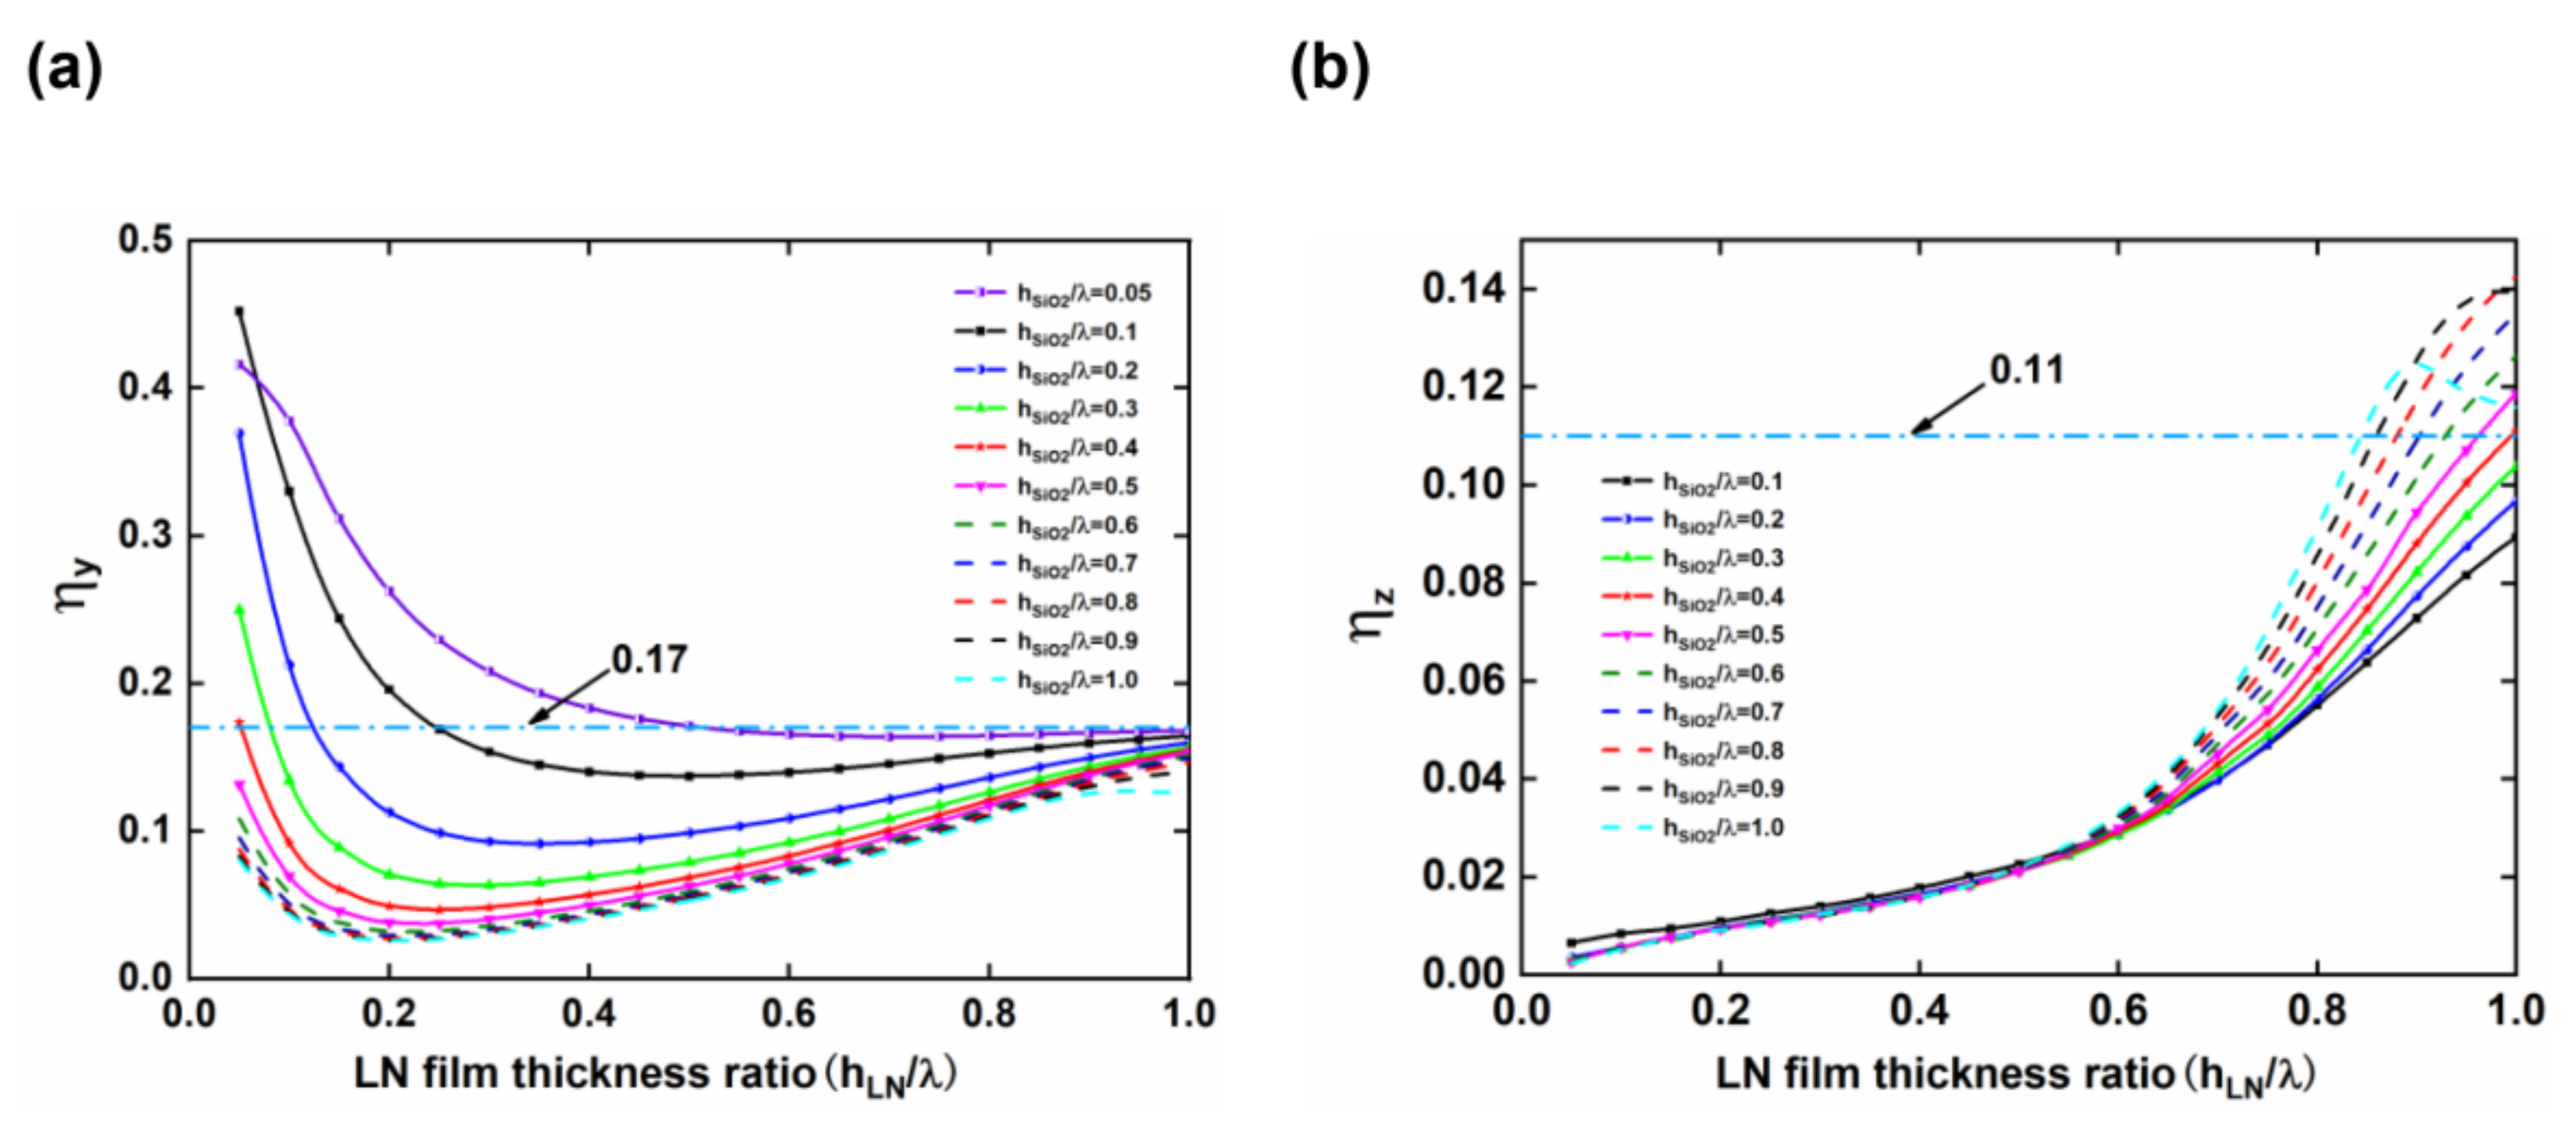
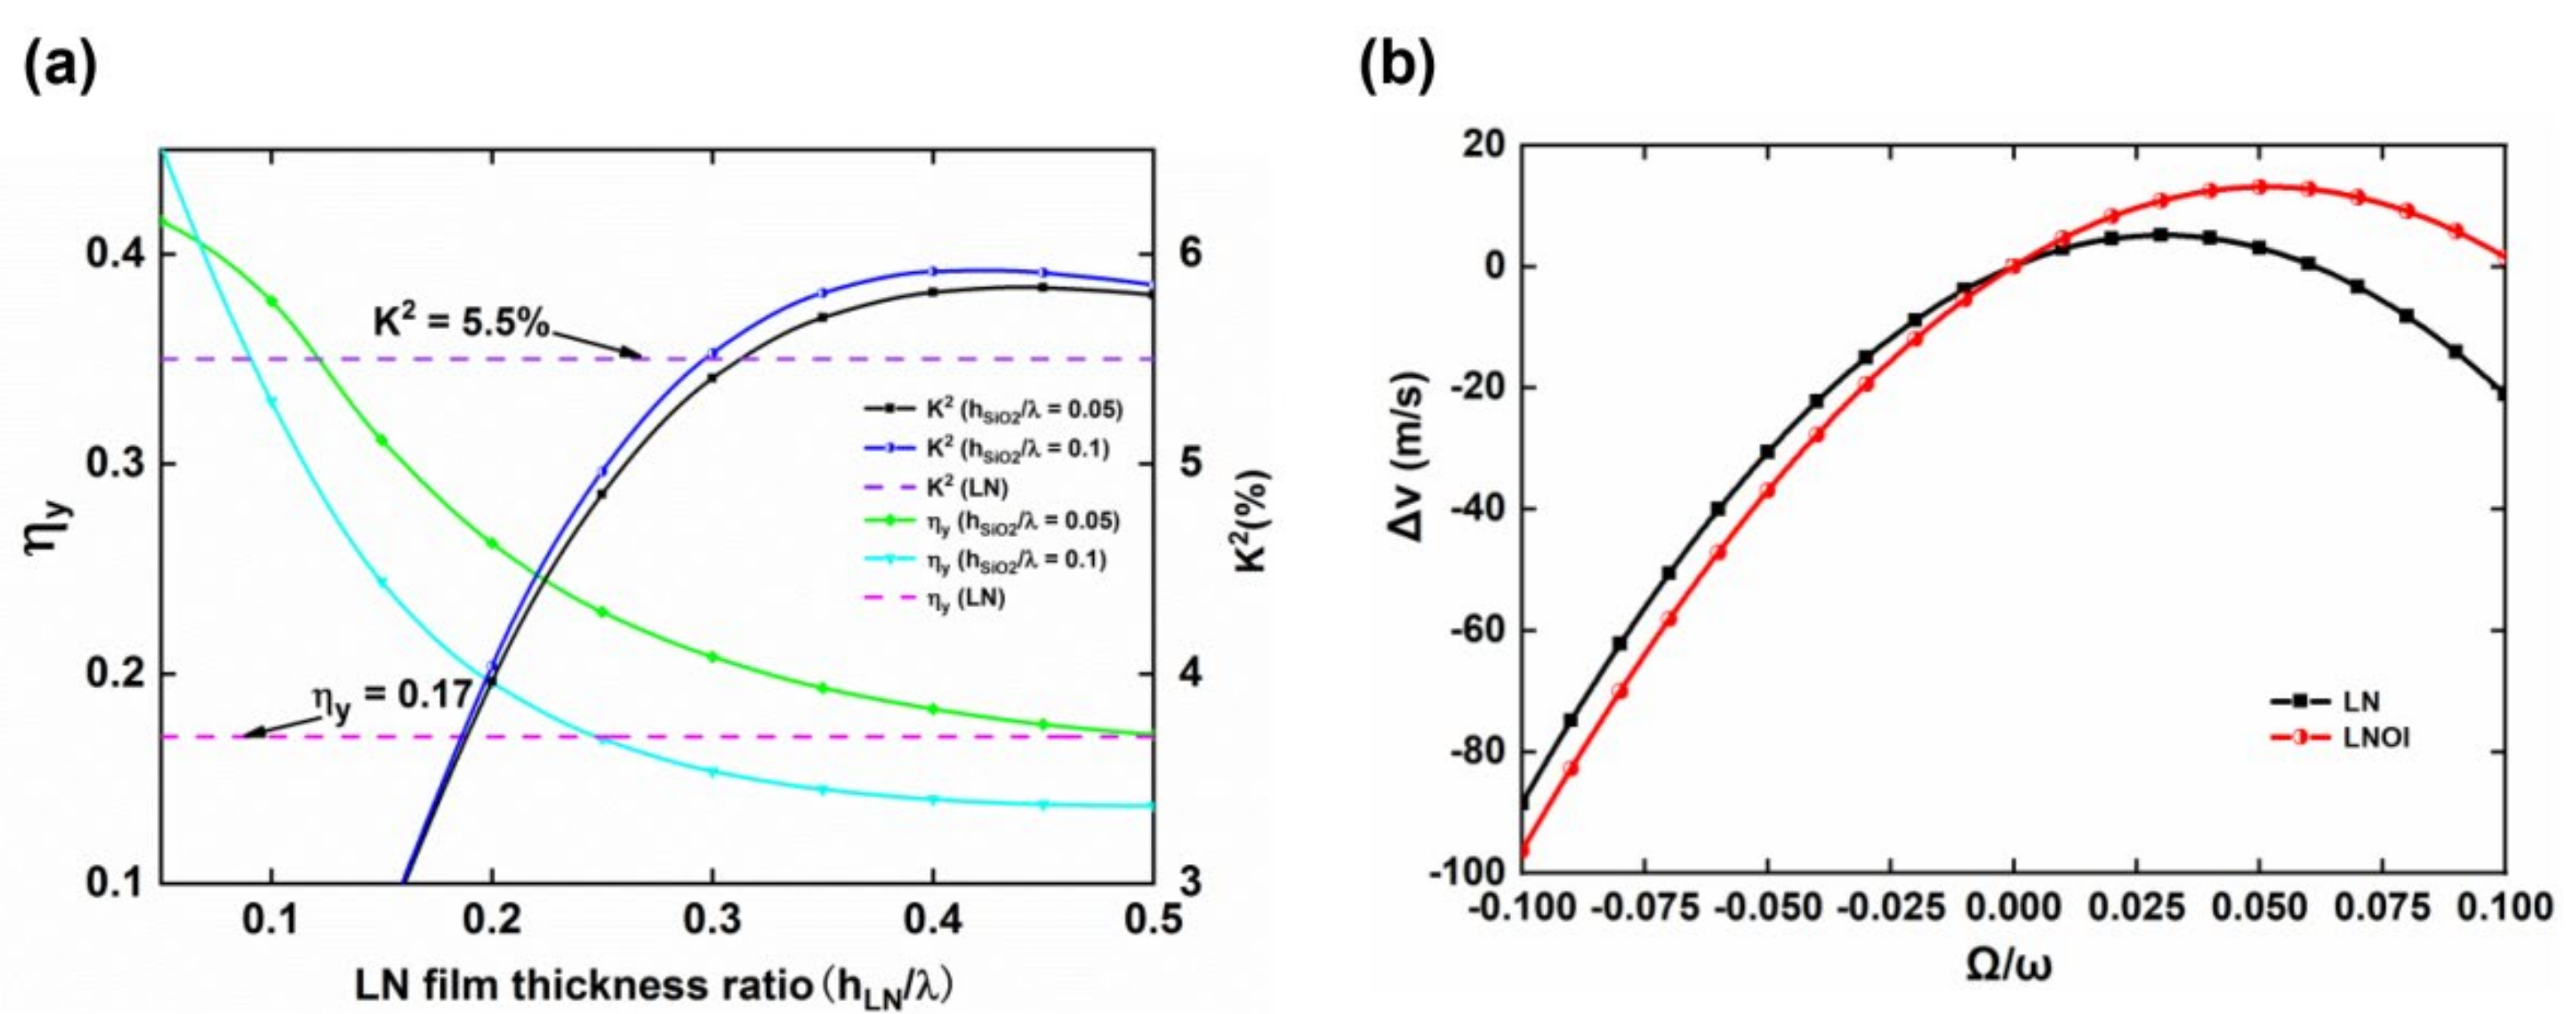
3.2. Gyroscopic Effect of the LNOI Substrate

Based on the above research, the K2 of the LNOI substrate with hLN/λ = 0.35 and hSiO2/λ = 0.6 is as high as 6.2%, and the Rayleigh wave velocity is 3427.35 m/s. This LNOI substrate was selected to further study the gyroscopic effect after loading a rotation. Figure 6a illustrates the velocity curves of this LNOI substrate after rotation about the x-, y- and z-axes. The ordinate represents the Rayleigh wave velocity after loading a rotation; the horizontal coordinate represents the normalized rotation angular rate Ω/ω, where + and − correspond to clockwise or counterclockwise rotations of the LNOI substrate about an axis; and the dotted and solid lines indicate whether the influence of the centrifugal force is considered. As seen from the figure, the velocity changes of Rayleigh waves propagating along the x-axis of the LNOI substrate differ after rotation about the x-, y- and z-axes. When rotating about the x-axis, the SAW velocities after clockwise and counterclockwise rotations are the same, so the velocity change after loading a rotation cannot be detected by the differential scheme. When rotating about the y- and z-axes, the SAW velocities after clockwise and counterclockwise rotations are different, so the velocity change can be detected by the differential scheme. However, compared with rotation about the y-axis, the wave velocity changes after rotation about the z-axis are very small, rendering them more difficult to detect. From wave equation (2), the centrifugal force has a linear relationship with the square of Ω/ω. Figure 6a demonstrates that the influence of the centrifugal force becomes more obvious with increasing Ω/ω. The centrifugal force has a more noticeable effect on the Rayleigh wave velocity propagating along the x-axis when rotating about the y-axis. However, since the frequency of SAW devices is generally above MHz and the angular velocity measured daily is not very large, the influence of the centrifugal force was ignored in the early development of SAW gyroscopes. From Figure 6a, the effect of the centrifugal force on the SAW velocity is very small when ∣Ω/ω∣0.025 and can almost be ignored.
For SAW gyroscopes, the gyroscopic effect strength of the LNOI substrate is very important. Taking the LN crystal as the reference substrate, we contrast the change trends of the velocity shift (Δv) caused by the gyroscopic effect between the LNOI substrate (hLN/λ = 0.35, hSiO2/λ = 0.6) and the LN crystal, which is presented in Figure 6b. The results demonstrate that the Δv values of the LNOI substrate and the LN crystal have similar change trends after rotating about the x-, y-, and z-axes. Furthermore, the Δv of the LNOI substrate is smaller than that of the LN crystal, which means that the gyroscopic effect of the LNOI substrate is weaker than that of the LN wafer.
According to the literature [10,16], the gyro gain factor g can characterize the strength of the gyroscopic effect produced by a rotating medium, and the formula is:
g = Δ v / v f Ω / ω
g+ and g, which represent propagation along the + and − directions of the rotation axis, can be calculated as:
g + = Δ v + / v f Ω / ω
g = Δ v / v f Ω / ω
Considering the advantages of a traveling wave SAW gyroscope with a differential scheme, a new gyroscope gain factor η is defined to characterize the strength of the gyroscopic effect in the differential scheme:
η = g + g = Δ v + Δ v / v f Ω / ω = 2 π ( f r + f r ) Ω
The η of the LNOI and LN substrates can be calculated according to the above formula. The performance parameters of the two substrates are compared in Table 2. The results demonstrate that the K2 and TCF of the LNOI substrate (hLN/λ = 0.35, hSiO2/λ = 0.6) are better than those of the LN substrate, but its η values about the y-axis and z-axis are smaller than those of the LN substrate. Therefore, the structural parameters must be optimized to obtain a high-performance LNOI substrate.
To compare the gyroscopic effect of LNOI substrates with different structural parameters, a large fixed rotational angular velocity of 3.0 × 10⁷ rad/s was applied to the LNOI substrate as it rotated about the y-axis and z-axis, and the ηy and ηz values were calculated for different structural parameters. Figure 7a shows the variation trend of ηy of an LNOI substrate with hLN/λ and hSiO2/λ after rotating about the y-axis. The blue dotted line indicates that the ηy of the LN crystal of 0.17. As shown in Figure 7a, the ηy of the LNOI substrate rapidly decreases and then slowly increases with increasing hLN/λ and finally approaches 0.17. The results indicate that the ηy of most LNOI substrates is less than 0.17. Only when hLN/λ is between 0.05 and 0.4 and hSiO2/λ is between 0.05 and 0.3 can an LNOI structure with an ηy greater than 0.17 be obtained. When hLN/λ is 0.05 and hSiO2/λ is 0.1, the ηy of the LNOI substrate can be as high as 0.45, which is much larger than that of the LN crystal. When hSiO2/λ is 0.05 and hLN/λ is any value, although the ηy of the LNOI substrate decreases from 0.42 to 0.16, the gyroscopic effect of the LNOI substrate is still stronger than or close to that of the LN crystal, which provides more space for hLN parameter design. Figure 7b shows the variation trend of the gyroscopic effect of the LNOI substrate as it rotates about the z-axis as a function of the structural parameters, with the blue dotted line representing an ηz value of 0.11 for the LN crystal. The figure shows that when the LNOI substrate rotates about the z-axis, ηz increases with increasing hLN/λ. However, when hLN/λ is greater than 0.8 and hSiO2/λ is between 0.5 and 1.0, ηz is greater than 0.11. ηz has a maximum value of 0.143 when hLN/λ is 1.0 and hSiO2/λ is 0.85. By comparing Figure 7a,b, it can be concluded that the structural parameters for which the LNOI substrate has higher ηy and ηz are not in the same interval. Therefore, the structural parameters cannot be adjusted to ensure that the LNOI substrate has a strong gyroscopic effect when it rotates about the y-axis and z-axis at the same time. When designing the SAW gyroscope, the rotation axis can be selected according to the needs to design the structural parameters of the LNOI substrate.
To obtain high-performance SAW gyroscope substrate materials, Table 3 summarizes the structural parameters of LNOI substrates with optimal ηy, ηz, K2, and TCF are optimal values.
Table 3 shows that the structural parameters of the LNOI substrate are not similar when the four parameters are optimal. Therefore, the relationship between various performance parameters must be comprehensively considered according to the device requirements when designing LNOI substrates to obtain the optimal structural parameters. Taking a traveling wave SAW gyroscope with a differential structure as an example, more attention must be given to ηy and K2 since the differential structure can eliminate the influence of temperature. Figure 8a shows the variation curves of ηy and K2 when hSiO2/λ is 0.05 and 0.1, and hLN/λ is between 0.05 and 0.5. The dashed lines in Figure 8a indicate the ηy of the LN crystal of 0.17 and the K2 of 5.5%, respectively. Figure 8a demonstrates that the ηy and K2 of the LNOI substrate are greater than those of the LN crystal when hSiO2/λ is 0.05 and hLN/λ is between 0.3 and 0.5. However, the difference in ηy between the LNOI substrate and LN crystal is very small in this interval, and there is no significant improvement. Considering the parameters comprehensively, hLN/λ was chosen as 0.2 and hSiO2/λ as 0.05, and the ηy and K2 of this LNOI substrate were 0.26 and 3.96%, respectively. From Figure 8b, the gyroscopic effect of this LNOI substrate rotating about the y-axis is clearly better than that of the LN crystal. Additionally, the TCF of the structure is −18.75 ppm/°C, greatly improving the temperature stability. Therefore, this LNOI substrate can be used as a high-performance SAW gyroscope substrate material. When the wavelength is 50 μm, the thickness of the LN thin film is 10 μm and the thickness of the SiO2 layer is 2.5 μm. This LNOI substrate can be prepared by the micron-level LNOI substrate preparation scheme described above.

4. Conclusions

In this paper, the SAW propagation characteristics and the gyroscopic effect of an LNOI substrate were studied with 3D-FEM simulations. The variations in the vp, K2, TCF, ηy and ηz values of LNOI substrates with different structural parameters were obtained. The results indicate that the above parameters can be optimized by adjusting the thicknesses of the LN thin film and SiO2 layer. Furthermore, a SiO2 thin film with a positive TCF not only compensates for the negative TCF of LN but also enhances the K2 value of the LNOI substrate. When hLN/λ is 0.35 and hSiO2/λ is 0.6, the maximum K2 of the LNOI substrate is 6%. When hLN/λ is 0.2 and hSiO2/λ is 0.3, the TCF of the LNOI substrate is close to zero. When hLN/λ is 0.05 and hSiO2/λ is 0.1, the ηy of the LNOI substrate is 0.45. When hLN/λ is 1 and hSiO2/λ is 0.85, the ηz of the LNOI substrate is 0.143. Through the characteristic parameter trade-off, an LNOI substrate with an hLN/λ of 0.2 and an hSiO2/λ of 0.05 was obtained. Although the K2 of the LNOI substrate was 3.96%, the TCF was −18.75 ppm/°C and the ηy was 0.26. Compared with the 128°Y–X LiNbO3 crystal, the gyroscopic effect and temperature stability of this LNOI substrate were significantly improved. In addition, the LNOI substrate was easy to manufacture. The LNOI substrate can be used as a high-performance substrate material to improve performance and promote device miniaturization and integration of SAW gyroscopes.

Author Contributions

Conceptualization, R.M.; software, X.S.; investigation, S.Z.; formal analysis R.M. and X.S.; resources, W.L.; writing—original draft preparation, R.M.; writing—review and editing, X.S., W.L. and D.L.; project administration, S.Z. All authors have read and agreed to the published version of the manuscript.

Funding

This research was supported by the Scientific Research Program of Shaanxi Provincial Education Department (No.21JY017).

Conflicts of Interest

The authors declare no conflict of interest.

References

  1. Oh, H.; Lee, K.J.; Lee, K.; Yang, S.S. Gyroscopes based on surface acoustic waves. Micro Nano Syst. Lett. 2015, 3, 1–10. [Google Scholar] [CrossRef] [Green Version]
  2. Lee, S.W.; Rhim, J.W.; Park, S.W.; Yang, S.S. A micro rate gyroscope based on the SAW gyroscopic effect. J. Micromech. Microeng. 2007, 17, 2272–2279. [Google Scholar] [CrossRef]
  3. Zhang, Y.; Wang, W. Enhanced Sensitivity of a Surface Acoustic Wave Gyroscope. Jpn. J. Appl. Phys. 2009, 48, 104502. [Google Scholar] [CrossRef]
  4. Wang, W.; Wang, W.; Liu, J.; Liu, M.; Yang, S. Wireless and Passive Gyroscope based on Surface Acoustic Wave Gyroscopic Effect. Appl. Phys. Express 2011, 4, 086601. [Google Scholar] [CrossRef]
  5. Fu, C.; Elmazria, O.; Sarry, F.; Mahalingam, T.; Yang, S.S.; Lee, K. Development of wireless, batteryfree gyroscope based on one-port SAW delay line and double resonant antenna. Sens. Actuators A Phys. 2014, 220, 270–280. [Google Scholar] [CrossRef]
  6. Kurosawa, M.; Fukuda, Y.; Takasaki, M.; Higuchi, T. A surface acoustic wave gyro sensor. In Proceedings of the International Solid State Sensors and Actuators Conference (Transducers '97), Chicago, IL, USA, 16–19 June 1997; pp. 863–866. [Google Scholar]
  7. Varadan, V.; Suh, W.; Xavier, P.; Jose, K.; Varadan, V. Design and development of a MEMS-IDT gyroscope. Smart Mater. Struct. 2000, 9, 898. [Google Scholar] [CrossRef]
  8. Woods, R.C.; Kalami, H.; Johnson, B. Evaluation of a novel surface acoustic wave gyroscope. IEEE Trans. Ultrason. Ferroelectr. Freq. Control 2002, 49, 136–141. [Google Scholar] [CrossRef]
  9. Oh, H.; Lee, K.; Yang, S.S.; Wang, W. Enhanced sensitivity of a surface acoustic wave gyroscope using a progressive wave. J. Micromech. Microeng. 2011, 21, 075015. [Google Scholar] [CrossRef]
  10. Wang, W.; Liu, J.; Xie, X.; Liu, M.; He, S. Development of a new surface acoustic wave based gyroscope on a X-112 degrees Y LiTaO3 substrate. Sensors 2011, 11, 10894–10906. [Google Scholar] [CrossRef] [Green Version]
  11. Wang, W.; Shao, X.; Liu, X.; Liu, J.; He, S. Enhanced sensitivity of surface acoustic wave-based rate sensors incorporating metallic dot arrays. Sensors 2014, 14, 3908–3920. [Google Scholar] [CrossRef] [Green Version]
  12. Xu, F.; Wen, W.; Shao, X.; Liu, X.; Yong, L. Optimization of Surface Acoustic Wave-Based Rate Sensors. Sensors 2015, 15, 25761–25773. [Google Scholar] [CrossRef] [PubMed] [Green Version]
  13. Lee, M.; Lee, K. Enhancing the sensitivity of three-axis detectable surface acoustic wave gyroscope by using a floating thin piezoelectric membrane. Jpn. J. Appl. Phys. 2017, 56, 06GN14. [Google Scholar] [CrossRef] [Green Version]
  14. Sun, X.; Liu, W.; Shao, X.; Zhou, S.; Wang, W.; Lin, D. Surface Acoustic Wave Gyroscopic Effect in an Interdigital Transducer. Sensors 2018, 19, 106. [Google Scholar] [CrossRef] [Green Version]
  15. Ge, F.; Zhao, L.; Zhang, Y. Design and Optimization of a Novel SAW Gyroscope Structure Based on Amplitude Modulation with 1-D Phononic Crystals. Micromachines 2021, 12, 1485. [Google Scholar] [CrossRef] [PubMed]
  16. Biryukov, S.V.; Schmidt, H.; Weihnacht, M. Gyroscopic effect for SAW in common piezoelectric crystals. In Proceedings of the 2009 IEEE International Ultrasonics Symposium, Roma, Italy, 20–23 September 2009; pp. 2133–2136. [Google Scholar]
  17. Wang, W.; Oh, H.; Lee, K.; Yoon, S.; Yang, S. Enhanced Sensitivity of Novel Surface Acoustic Wave Microelectromechanical System-Interdigital Transducer Gyroscope. Jpn. J. Appl. Phys. 2009, 48, 06FK09. [Google Scholar] [CrossRef] [Green Version]
  18. Wang, W.; Xu, F.; He, S.; Li, S.; Lee, K. A New Micro-rate Sensor Based on Shear Horizontal Surface Acoustic Wave Gyroscopic Effect. Jpn. J. Appl. Phys. 2010, 49, 096602. [Google Scholar] [CrossRef]
  19. Hu, S.M.; Hu, Y.F.; Cao, X.S.; Tian, S.M. Gyro effect on surface acoustic wave propagation in a piezoelectric layered structure. In Proceedings of the 14th Symposium on Piezoelectrcity, Acoustic Waves and Device Applications (SPAWDA), Shijiazhuang, China, 1–4 November 2019. [Google Scholar]
  20. Zhou, S.; Lin, D.; Su, Y.; Zhang, L.; Liu, W. Enhanced dielectric, ferroelectric, and optical properties in rare earth elements doped PMN-PT thin films. J. Adv. Ceram. 2020, 10, 98–107. [Google Scholar] [CrossRef]
  21. Meng, X.; Zhang, Z.; Lin, D.; Liu, W.; Zhang, L. Effects of particle size of dielectric fillers on the output performance of piezoelectric and triboelectric nanogenerators. J. Adv. Ceram. 2021, 10, 991–1000. [Google Scholar] [CrossRef]
  22. Cai, C.; Zhang, D.; Liu, W.; Wang, J.; Zhou, S.; Su, Y.; Sun, X.; Lin, D. Synthesis, Giant Dielectric, and Pyroelectric Response of [001]-Oriented Pr3+ Doped Pb(Mg1/3Nb2/3)O3-PbTiO3 Ferroelectric Nano-Films Grown on Si Substrates. Materials 2018, 11, 2392. [Google Scholar] [CrossRef] [Green Version]
  23. Tomar, M.; Gupta, V.; Mansingh, A.; Sreenivas, K. Temperature stability of c-axis oriented LiNbO3/SiO2/Si thin film layered structures. J. Phys. D Appl. Phys. 2001, 34, 2267. [Google Scholar] [CrossRef]
  24. Tian, X.-G.; Liu, H.; Tao, L.-Q.; Yang, Y.; Jiang, H.; Ren, T.-L. High-resolution, high-linearity temperature sensor using surface acoustic wave device based on LiNbO3/SiO2/Si substrate. Aip Adv. 2016, 6, 095317. [Google Scholar] [CrossRef] [Green Version]
  25. Ballandras, S.; Courjon, E.; Bernard, F.; Laroche, T.; Butaud, E. New generation of SAW devices on advanced engineered substrates combining piezoelectric single crystals and Silicon. In Proceedings of the Joint Conference of the IEEE International Frequency Control Symposium anEuropean Frequency and Time Forum (EFTF/IFC), Orlando, FL, USA, 14–18 April 2019. [Google Scholar]
  26. Hsu, T.-H.; Su, F.-C.; Tseng, K.-J.; Li, M.-H. Low loss and wideband surface acoustic wave devices in thin film lithium niobate on insulator (LNOI) platform. In Proceedings of the IEEE 34th International Conference on Micro Electro Mechanical Systems (MEMS), Virtual Conference, 25–29 January 2021; pp. 474–477. [Google Scholar]
  27. Yan, W.; LIU, X.-q.; SHANG, S.-l.; Xun, X. Fem Modeling Rayleigh Wave Sensors Based on GO/SiO2/128° YX-LiNbO3 Structures. In Proceedings of the 2019 14th Symposium on Piezoelectrcity, Acoustic Waves and Device Applications (SPAWDA), Shijiazhuang, China, 1–4 November 2019; pp. 1–5. [Google Scholar]
  28. Ma, R.; Liu, W.; Sun, X.; Zhou, S. In-situ Process and simulation of high performance Piezoelectric-on-Silicon substrate for SAW sensor. Front. Mater. 2021, 8, 177. [Google Scholar] [CrossRef]
  29. Poberaj, G.; Hu, H.; Sohler, W.; Günter, P. Lithium niobate on insulator (LNOI) for micro-photonic devices. Laser Photonics Rev. 2012, 6, 488–503. [Google Scholar] [CrossRef]
  30. Shuai, Y.; Gong, C.; Bai, X.; Wu, C.; Luo, W.; Böttger, R.; Zhou, S.; Tian, B.; Zhang, W. Fabrication of Y128- and Y36-cut lithium niobate single-crystalline thin films by crystal-ion-slicing technique. Jpn. J. Appl. Phys. 2018, 57, 04FK05. [Google Scholar] [CrossRef]
  31. Hsu, T.-H.; Tseng, K.-J.; Li, M.-H. Large Coupling Acoustic Wave Resonators Based on LiNbO3/SiO2/Si Functional Substrate. IEEE Electr. Device L 2020, 41, 1825–1828. [Google Scholar] [CrossRef]
  32. Lu, R.; Yang, Y.; Link, S.; Gong, S. Low-Loss 5-GHz First-Order Antisymmetric Mode Acoustic Delay Lines in Thin-Film Lithium Niobate. IEEE T Microw. Theory 2020, 69, 541–550. [Google Scholar] [CrossRef]
  33. Tseng, K.-J.; Li, M.-H. Frequency and coupling factor scaling of shear horizontal SAW resonators in LNOI platform. In Proceedings of the 2020 Joint Conference of the IEEE International Frequency Control Symposium and International Symposium on Applications of Ferroelectrics (IFCS-ISAF), Keystone, CO, USA, 19–23 July 2020; pp. 1–3. [Google Scholar]
  34. Zhou, Y.H.; Jiang, Q. Efiects of Coriolis force and centrifugal force on acoustic waves propagating along the surface of a piezoelectric half-space. Z. Angew. Math. Phys. 2001, 52, 950–965. [Google Scholar] [CrossRef]
  35. Yan, Q.; Wei, Y.; Shen, M.; Zhu, J.; Li, Y. Theoretical and Experimental Study of Surface Acoustic Wave Gyroscopic Effect. In Proceedings of the International Conference on Mechatronics & Automation, Harbin, China, 5–9 August 2007. [Google Scholar]
  36. Sun, X.; Liu, W.; Ge, S.; Zhou, S.; Li, X.; Lin, D. Achieving both high electromechanical response and stable temperature behavior in Si/SiO2/Al/LiTaO3 sandwich structure. AIP Adv. 2019, 9, 035145. [Google Scholar] [CrossRef] [Green Version]
  37. Luo, J.; Quan, A.; Chen, F.; Li, H. Shear-horizontal surface acoustic wave characteristics of a (110) ZnO/SiO2/Si multilayer structure. J. Alloy. Compd. 2017, 693, 558–564. [Google Scholar] [CrossRef]
  38. Sarapulov, S.A.; Kisilenko, S.P. Gyroscopic effect in surface acoustic waves. Mekhanika Giroskopicheskikh Sist. 1989, 8, 62–65. [Google Scholar]
  39. Ro, R.; Lee, R.; Lin, Z.-X.; Sung, C.-C.; Chiang, Y.-F.; Wu, S. Surface acoustic wave characteristics of a (100) ZnO/(100) AlN/diamond structure. Thin Solid Film. 2013, 529, 470–474. [Google Scholar] [CrossRef]
Figure 1. (a) Schematic diagram of the LNOI substrate structure; (b) preparation flow chart of the LNOI substrate with a nanoscale LN film; (c) preparation flow chart of the LNOI substrate with a micron-order LN film.
Micromachines 13 00202 g001
Figure 2. Schematic of the gyroscopic effect on the Rayleigh wave.
Micromachines 13 00202 g002
Figure 3. Three-dimensional (3D) periodic model of the LNOI substrate used in the finite element method (FEM).
Micromachines 13 00202 g003
Figure 4. (a) Vibration mode of the LNOI substrate with hLN/λ = hSiO2/λ = 0.2; (b) vf, vm and K2 dispersion curves of the LNOI substrate with hLN/λ = 0.2; (c) vibration mode of the LNOI substrate (hLN/λ = 0.2) with different hSiO2/λ.
Micromachines 13 00202 g004
Figure 5. Variation in (a) vp and (b) K2 with normalized thickness of the LN thin film (hLN/λ) in the LNOI substrate; (c) variation in K2 with normalized thickness of the SiO2 layer (hSiO2/λ) in the LNOI substrate when hLN/λ is between 0.3 and 0.45; (d) variation in TCF with normalized thickness of the SiO2 layer in the LNOI substrate when hLN/λ is between 0.05 and 0.35.
Micromachines 13 00202 g005
Figure 6. (a) Rayleigh wave phase velocity of the LNOI substrate (hLN/λ = 0.35, hSiO2/λ = 0.6) with rotation; (b) comparison of the phase velocity shift (Δv) depending on Ω/ω between the LNOI substrate (hLN/λ = 0.35, hSiO2/λ = 0.6) and LN crystal.
Micromachines 13 00202 g006
Figure 7. Variation in the gyroscope gain factors (a) ηy and (b) ηz with normalized thickness of the LN thin film in the LNOI substrate.
Micromachines 13 00202 g007
Figure 8. (a) Values of ηy and K2 for different structural parameters of the LNOI substrate and the LN wafer; (b) comparison of gyroscopic effects between the optimized LNOI substrate (hLN/λ = 0.2, hSiO2/λ = 0.05) and the LN wafer.
Micromachines 13 00202 g008
Table 1. Material constants and temperature coefficients used in the FEM simulation [23].
Materials (T0 = 25 °C)Temperature Coefficient
α1 (10−4/°C)
Material Constants LiNbO3SiO2SiLiNbO3SiO2Si
Elastic constant (1011 N/m2)
C112.030.7851.66−1.742.390.68
C120.530.1610.639−2.525.84−1
C130.750.1610.639−1.595.84−1
C140.0900−2.1400
C332.430.7851.66−1.532.39−068
C440.60.3120.796−2.041.51−0.44
C660.750.3120.796−1.431.51−0.44
Piezoelectric constant (C/m2)
e310.19 2.21
e153.7 1.47
e331.31 8.87
e222.54 0.79
Dielectric constant (10−11 F/m)
ε1138.93.210.363.230.2630.68
ε3325.73.210.366.27−0.016−1
Density (103 kg/m3)
ρ4.72.22.33
Thermal expansion coefficient (ppm/°C)
β114.80.554.68
β34.10.554.68
Table 2. Characteristic parameters of the LNOI substrate and LN crystal.
SubstrateK2
(%)
TCF
(ppm/°C)
vp
(m/s)
Rotation
Axis
Ω/ωΔv+
(m/s)
Δv
(m/s)
η
128°Y–X LN5.5−753980x0.1−289.75289.750
y0.1−21.5−88.50.168
z0.1−15.6−59.40.11
LNOI
(hLN/λ = 0.35, hSiO2/λ = 0.6)
6.2−34.73427.35x0.1−131.3−131.30
y0.1−32.65−46.40.04
z0.1−4.85−9.70.014
Table 3. Structural parameter values of the LNOI substrate when ηy, ηz, K2 and TCF are optimal.
Substratevp
(m/s)
ηyηzK2
(%)
TCF
(ppm/°C)
hLNhSiO2
1-LNOI4320.90.450.00650.291.40.050.1
2-LNOI3983.50.140.1435.28−84.510.85
3-LNOI3427.450.040.0146.2−14.80.350.6
4-LNOI3308.90.070.00944.550.310.20.3
Publisher’s Note: MDPI stays neutral with regard to jurisdictional claims in published maps and institutional affiliations.

