
Microstructure Transformation in Laser Additive Manufactured NiTi Alloy with Quasi-In-Situ Compression
Abstract
:1. Introduction
2. Materials and Methods
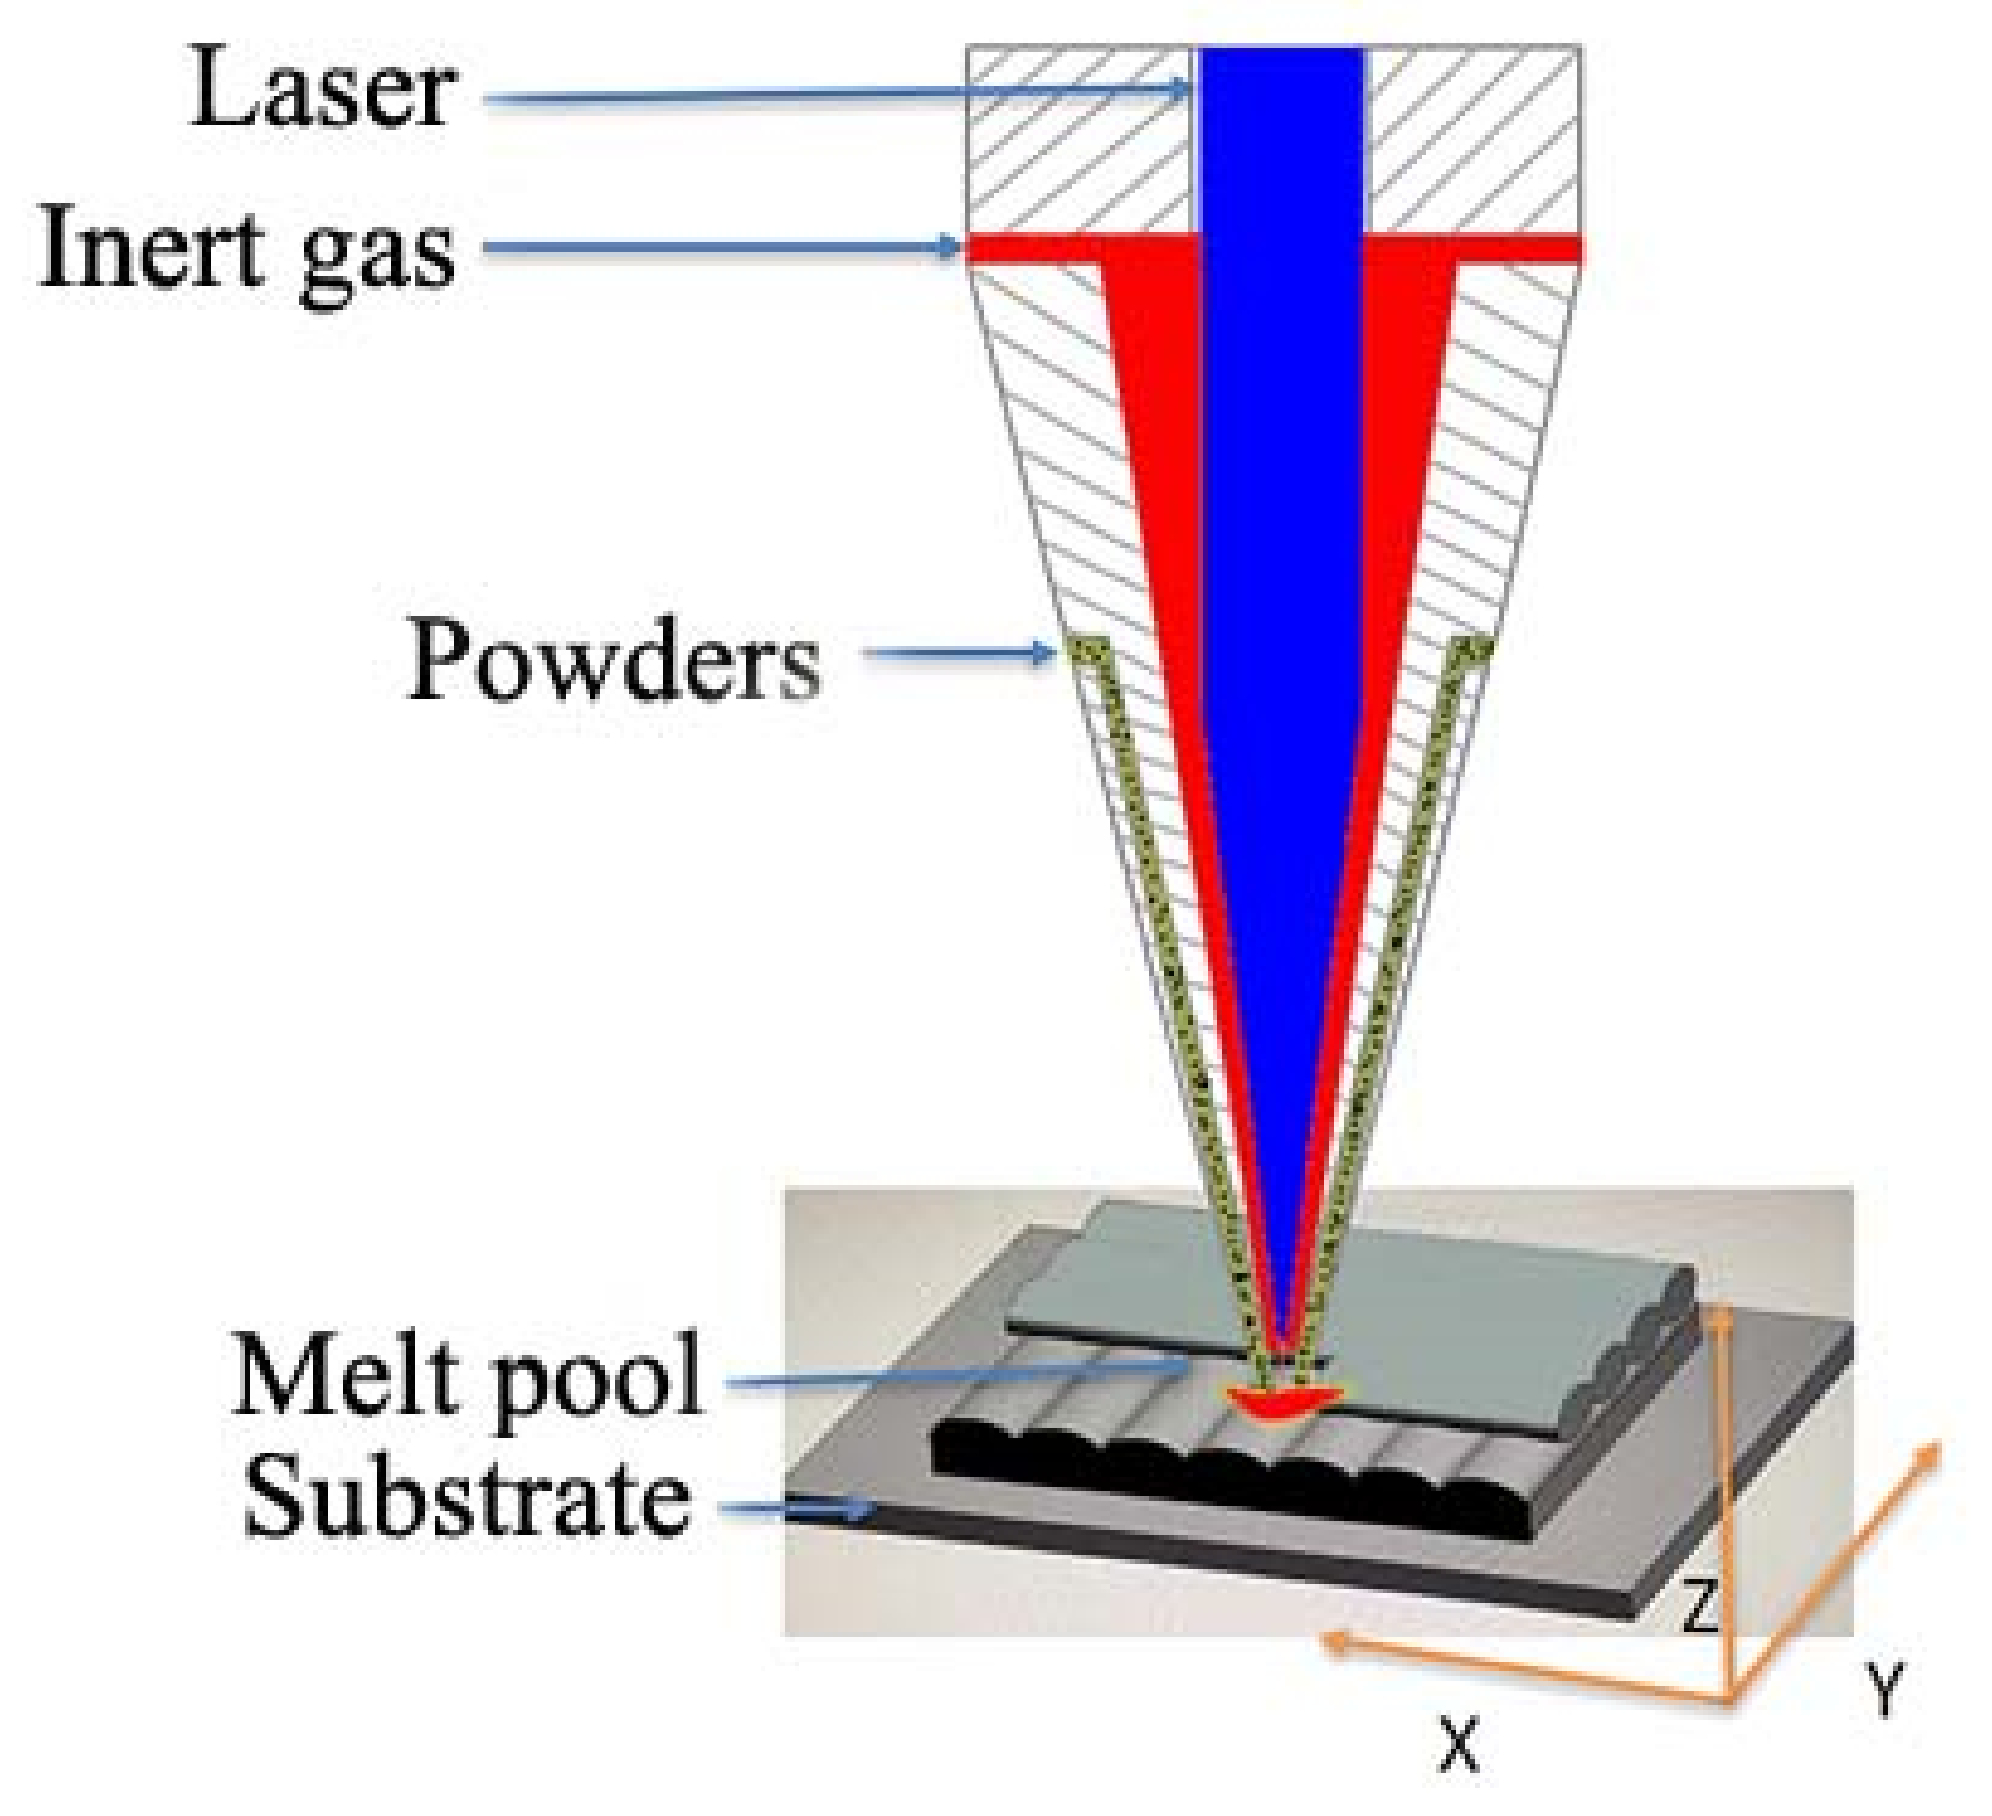
2.1. Material Preparation Process
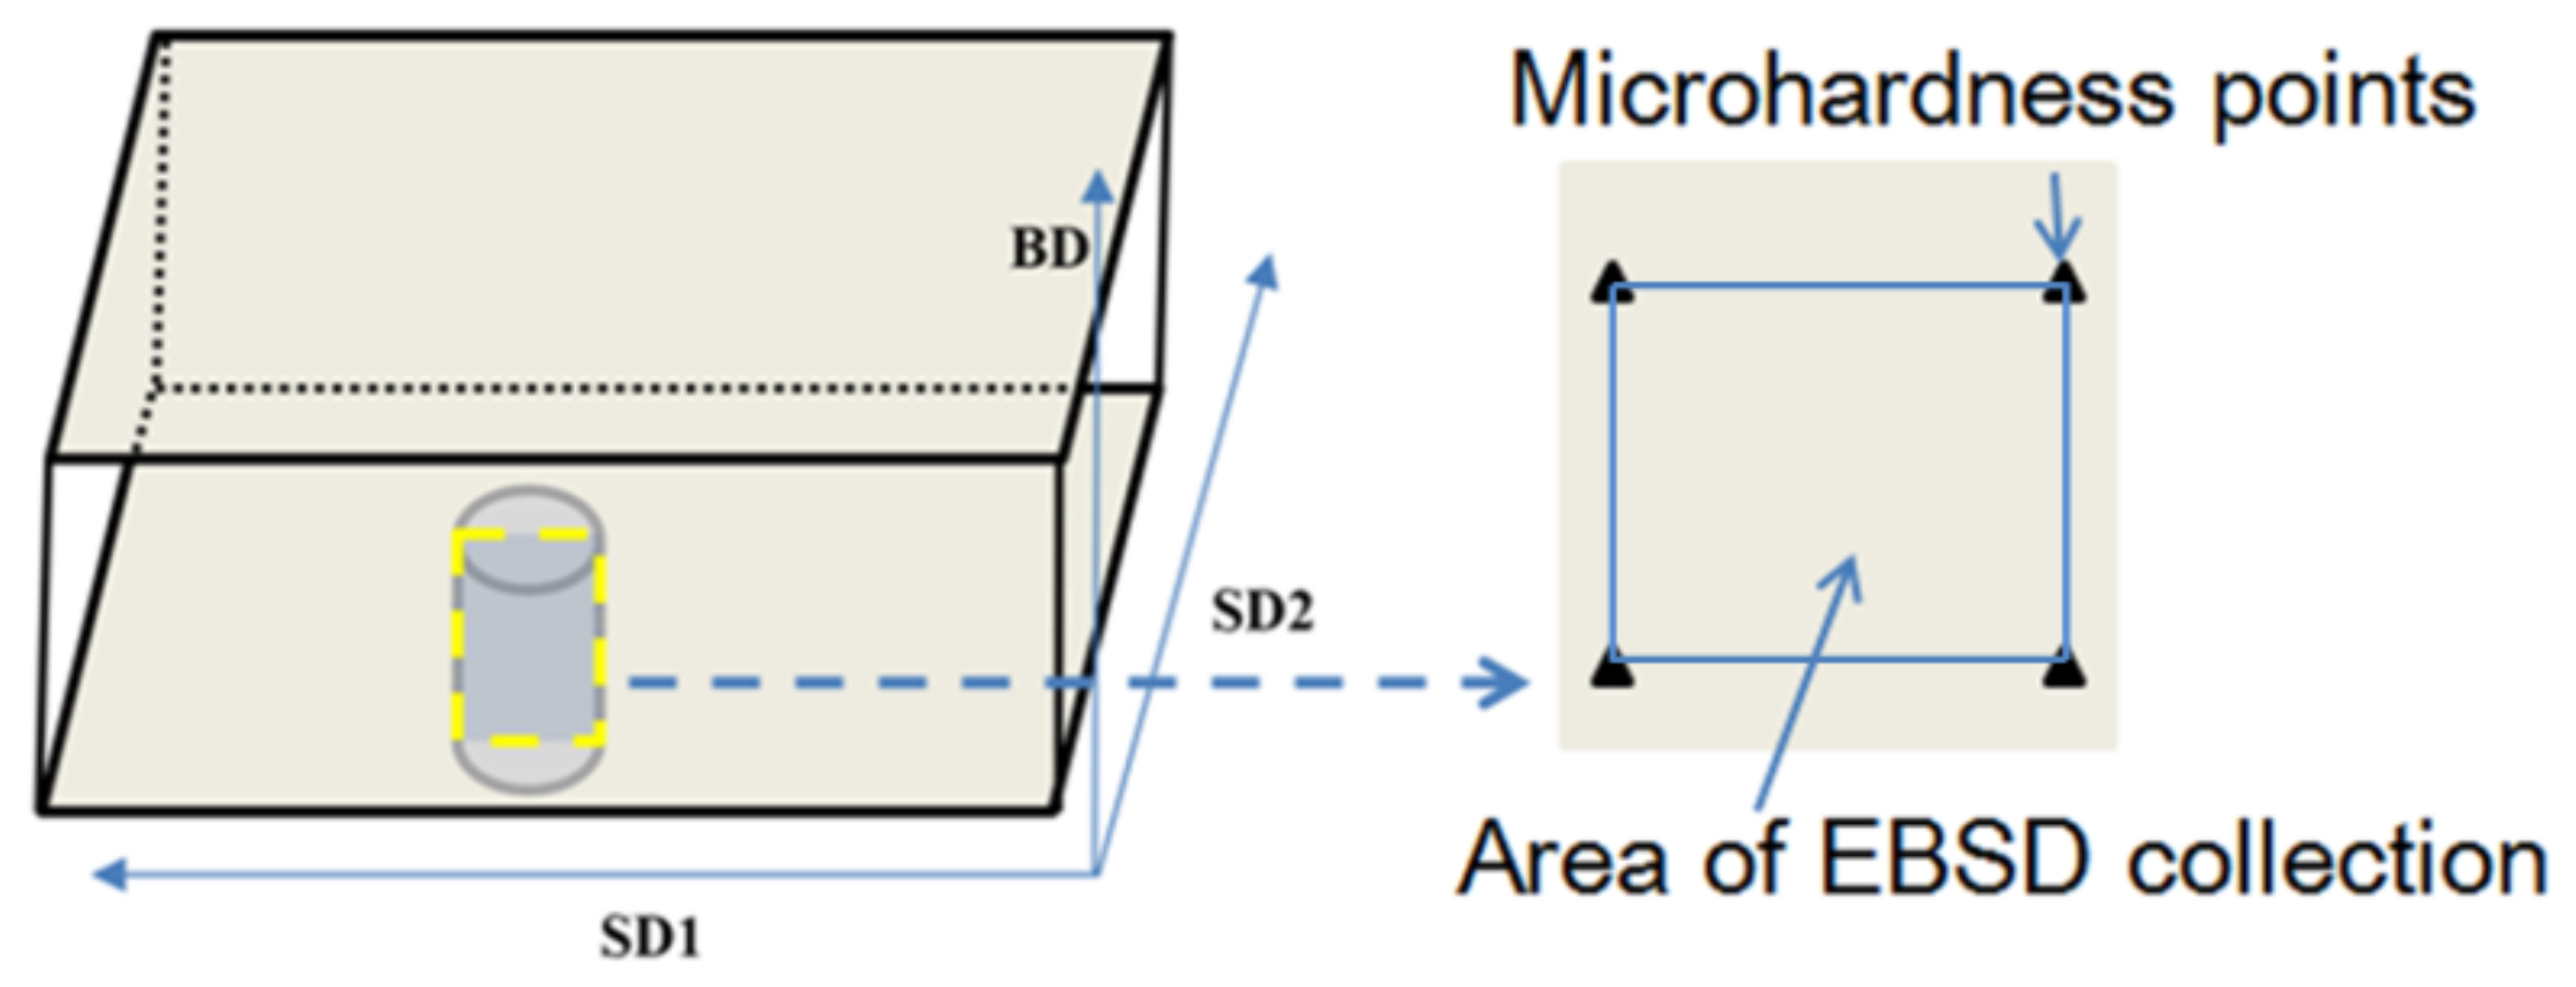
2.2. Samples and Test Preparation
3. Results and Discussion
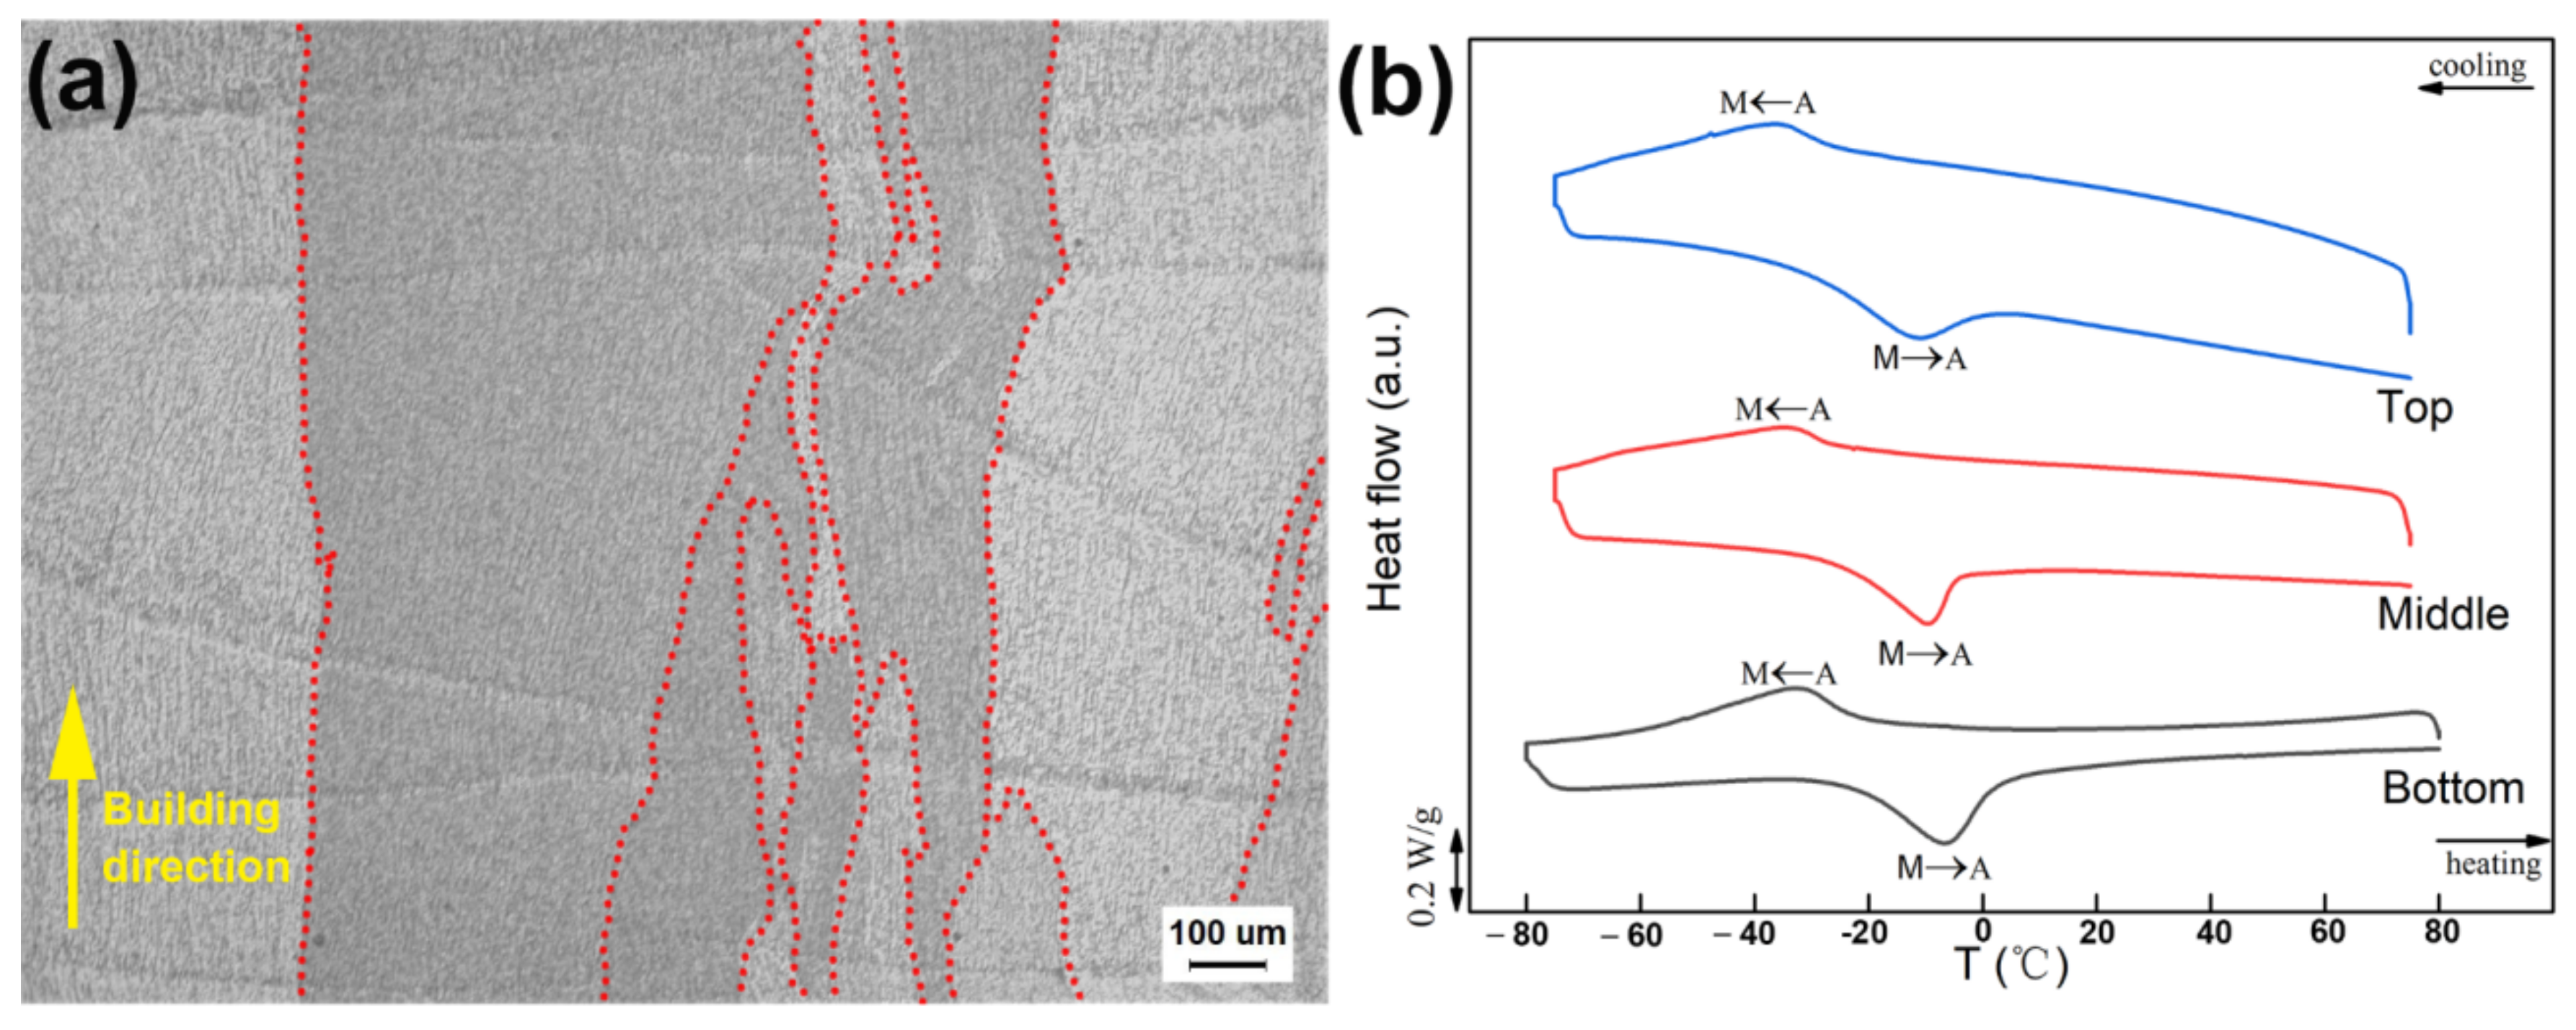
3.1. Material Microstructure and Thermal Analysis
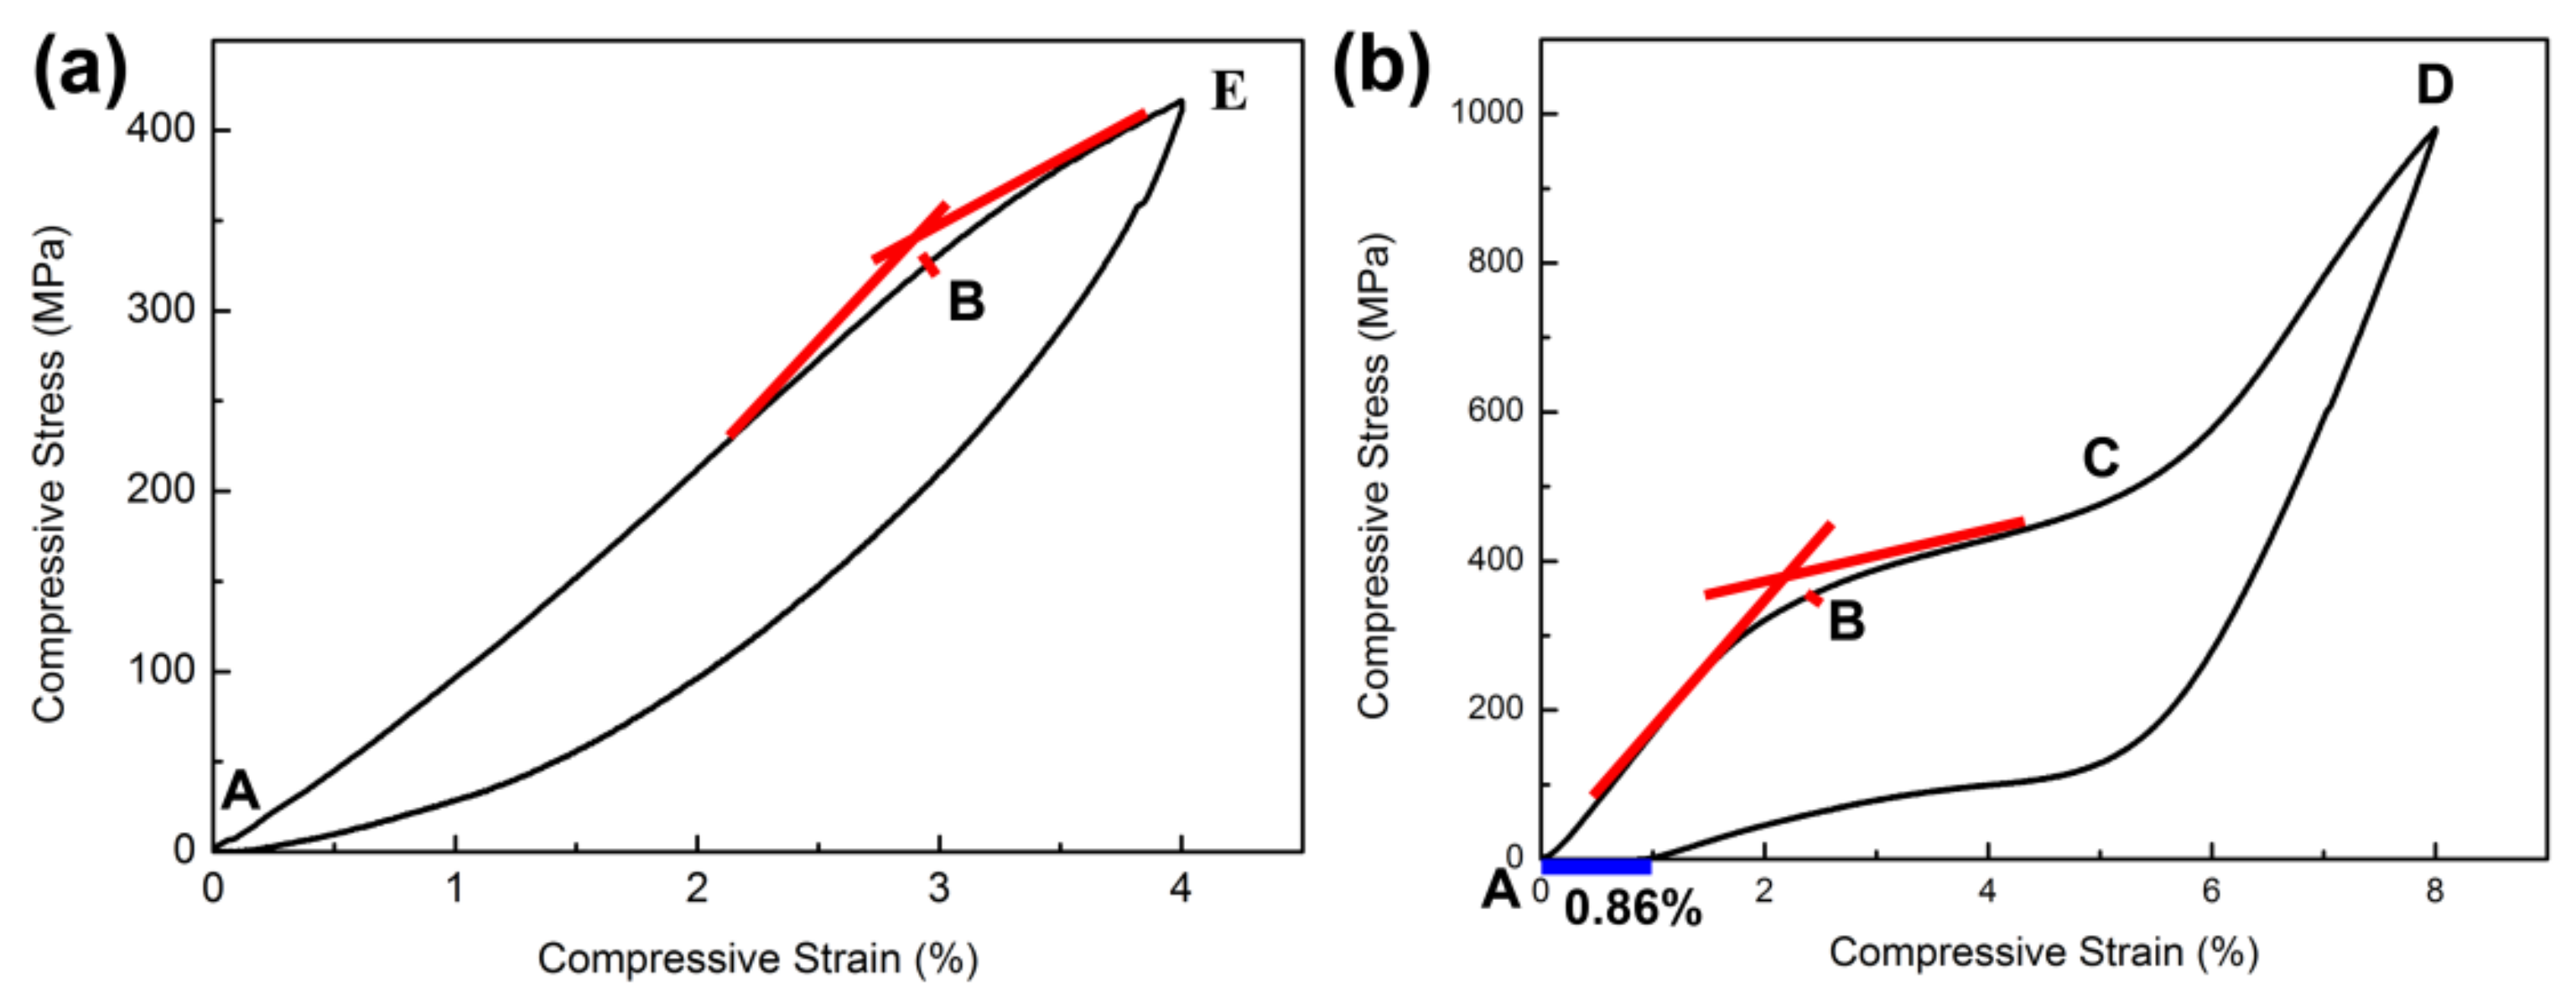
3.2. Phase Transition Behavior under Compressive Strain
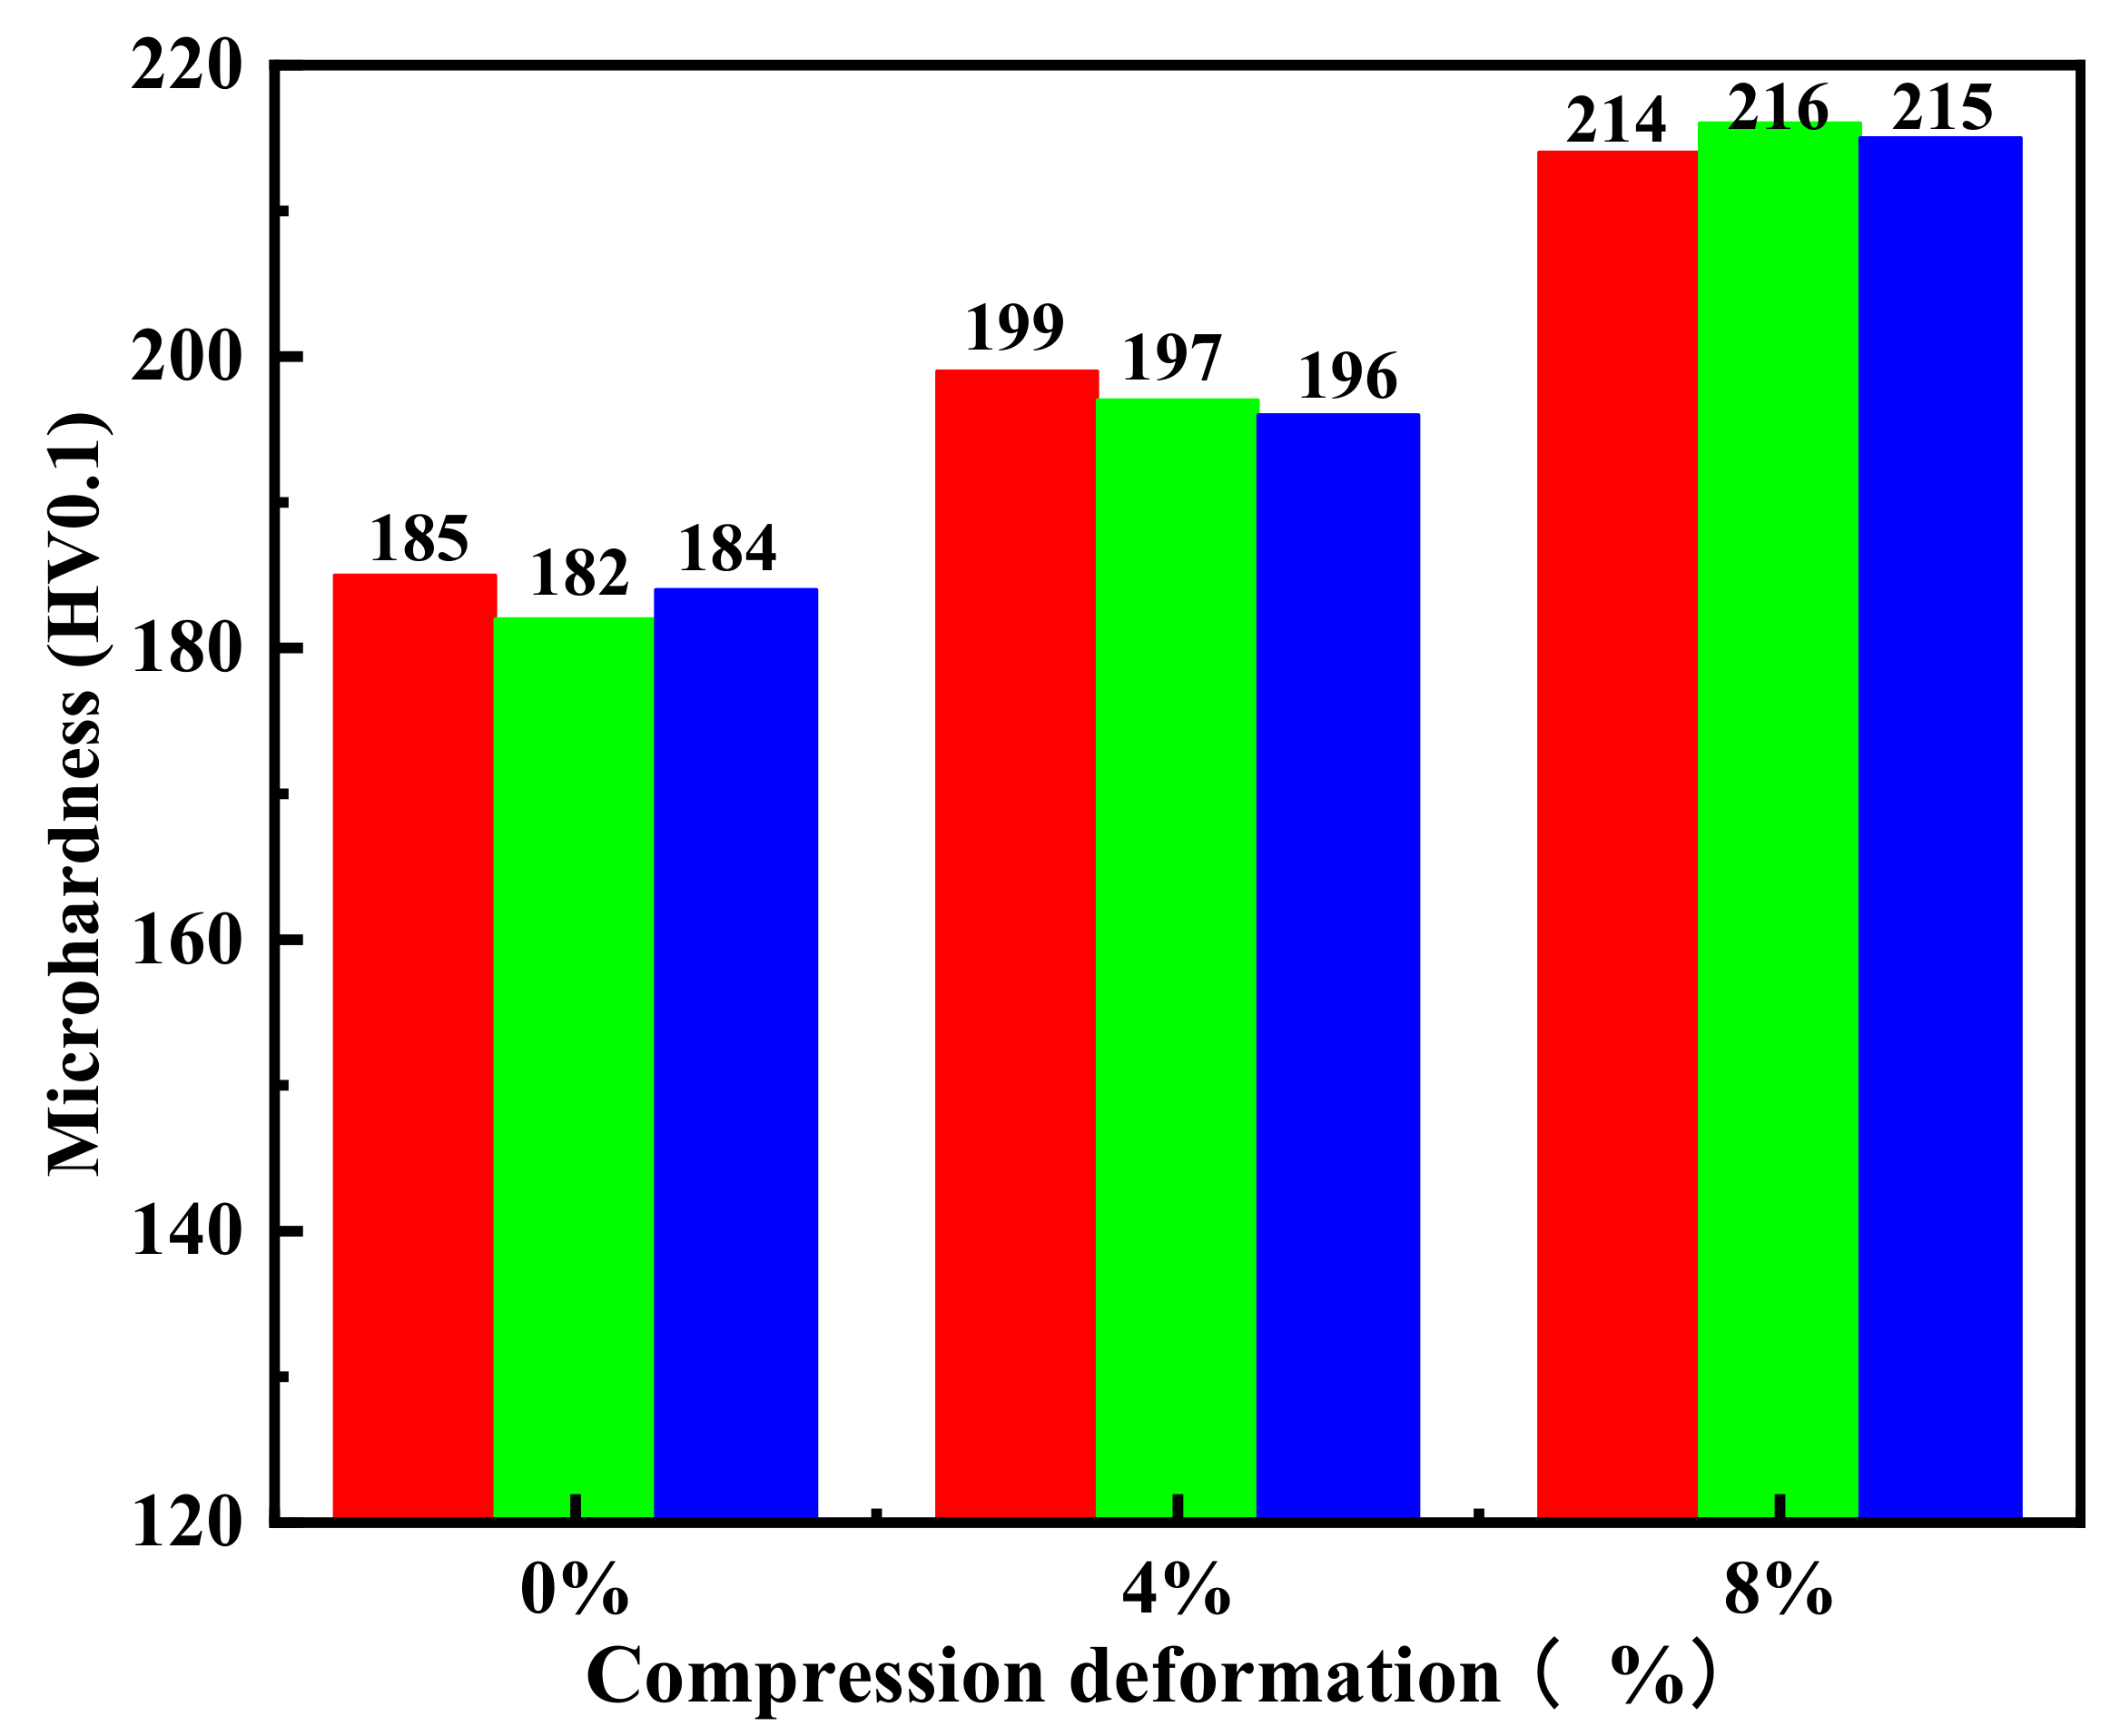
3.3. Hardness Analysis after Different Compression
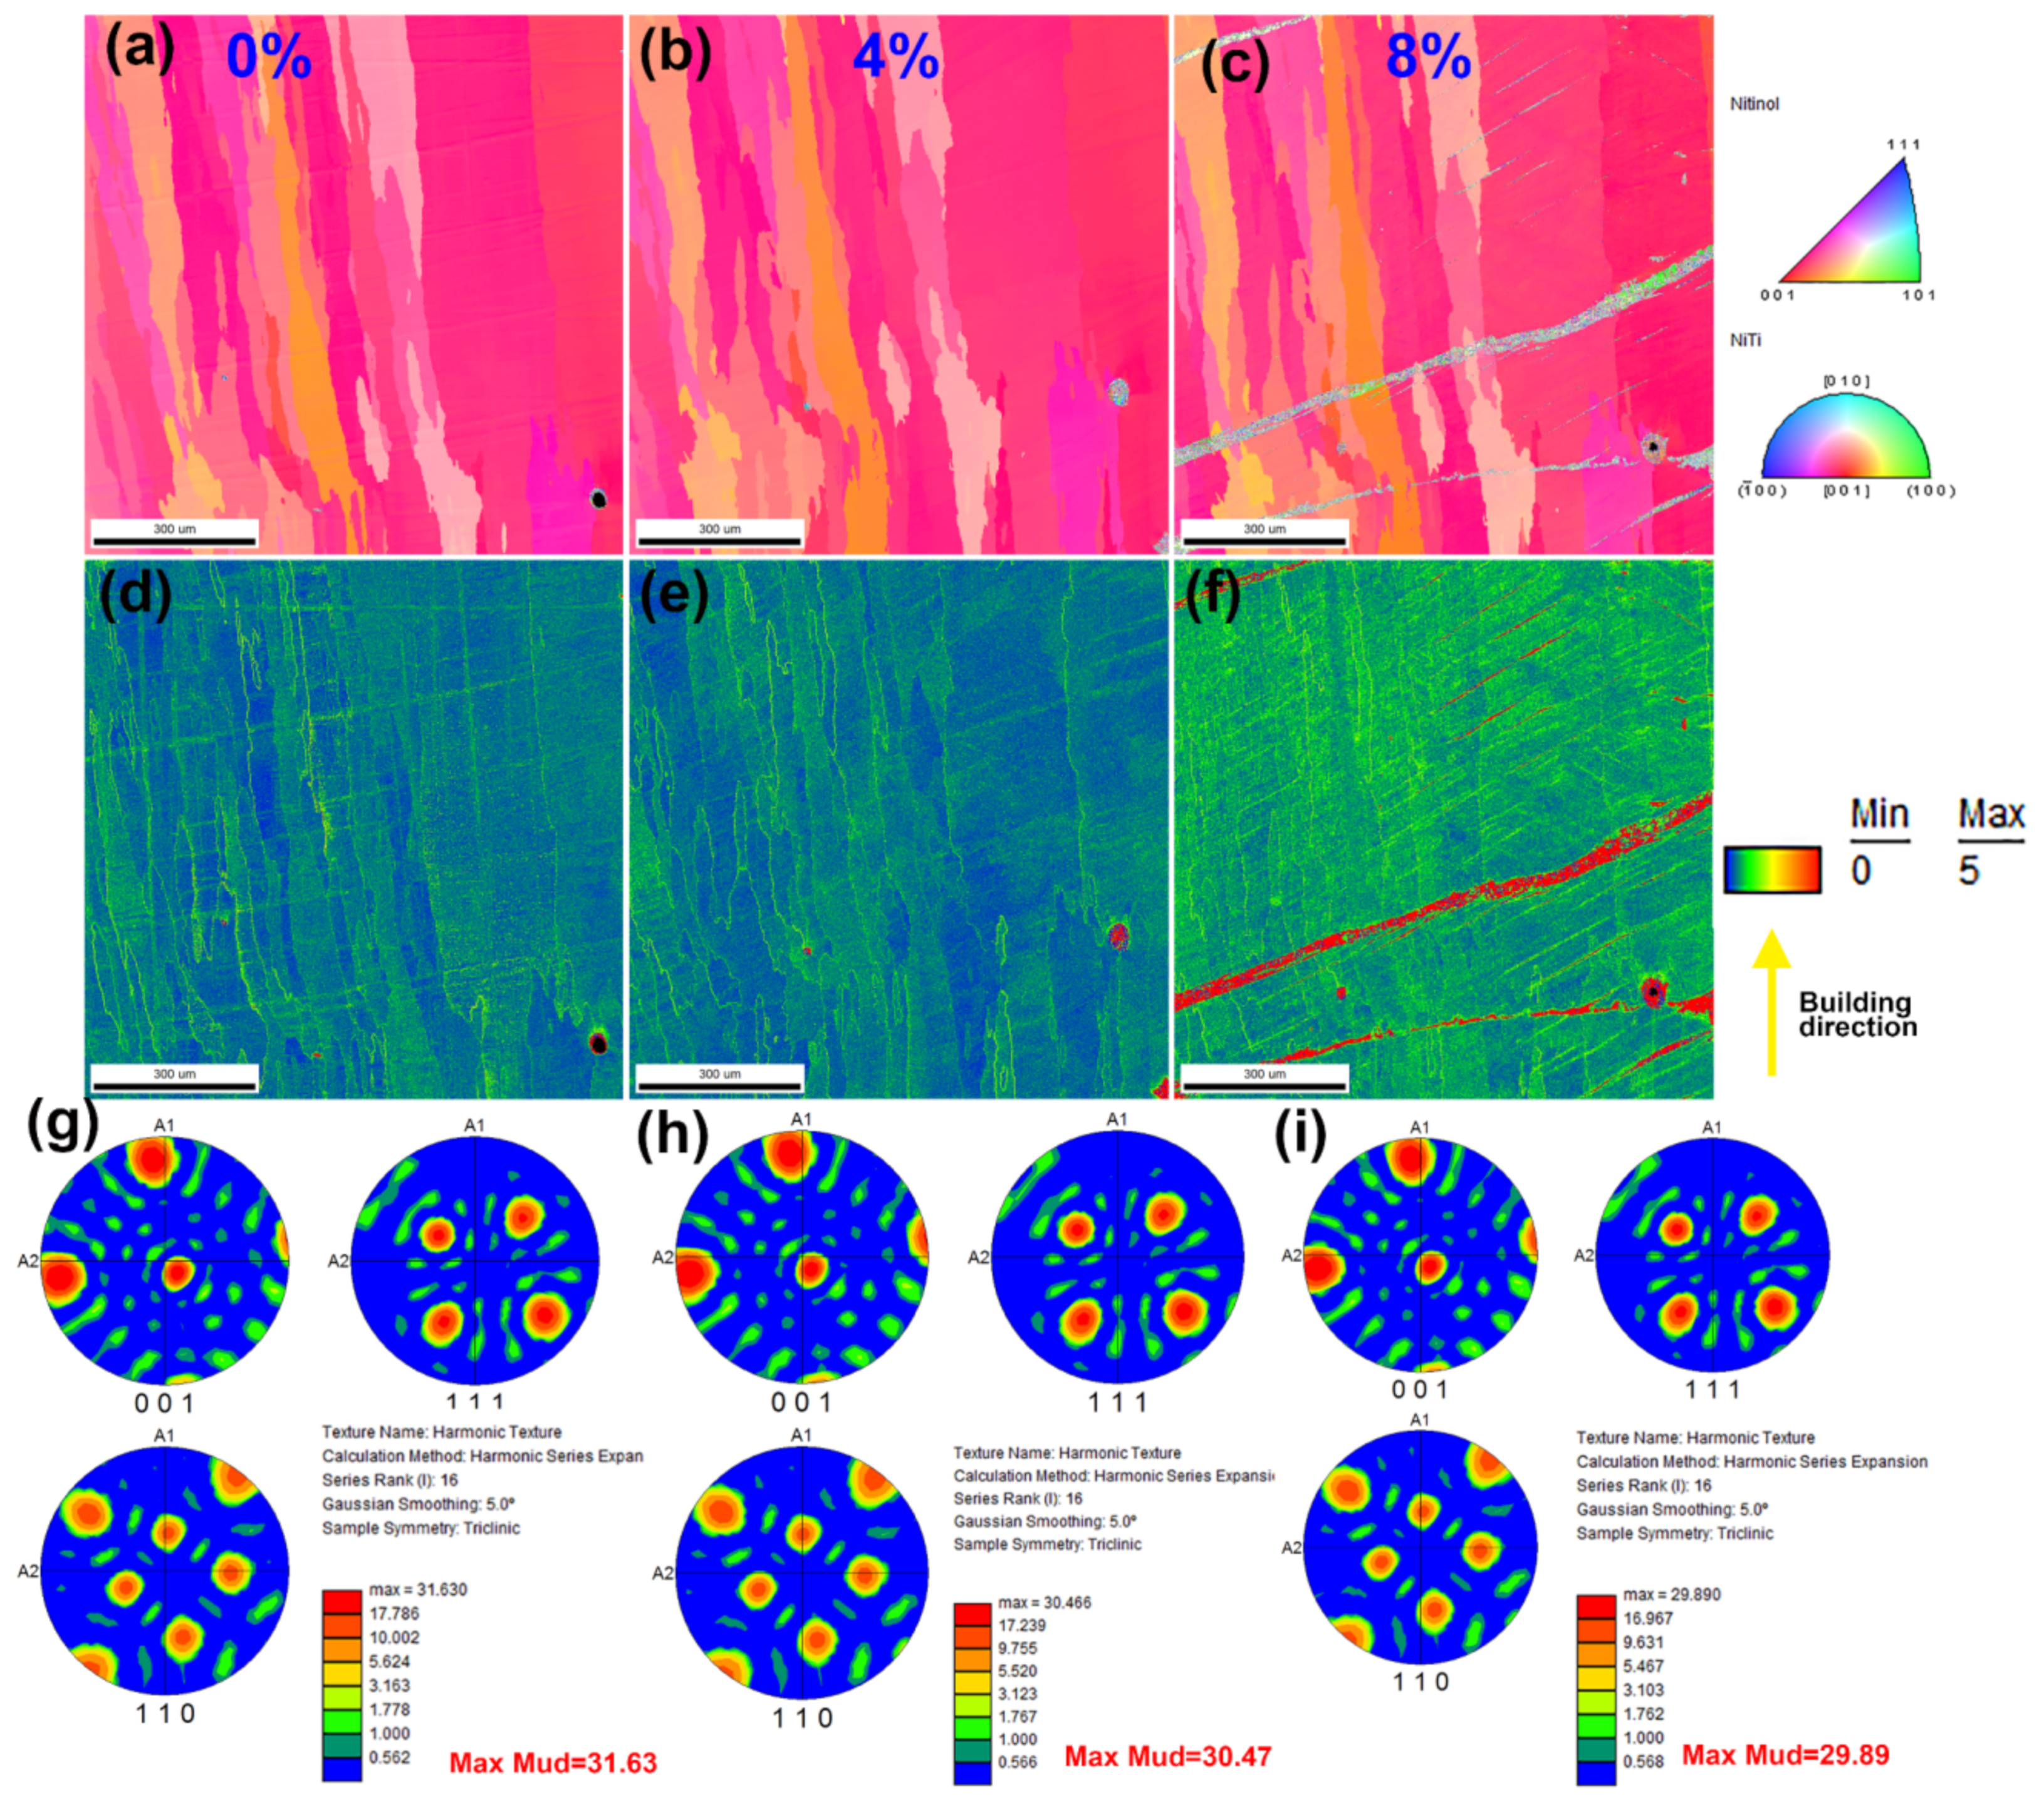
3.4. EBSD Analysis
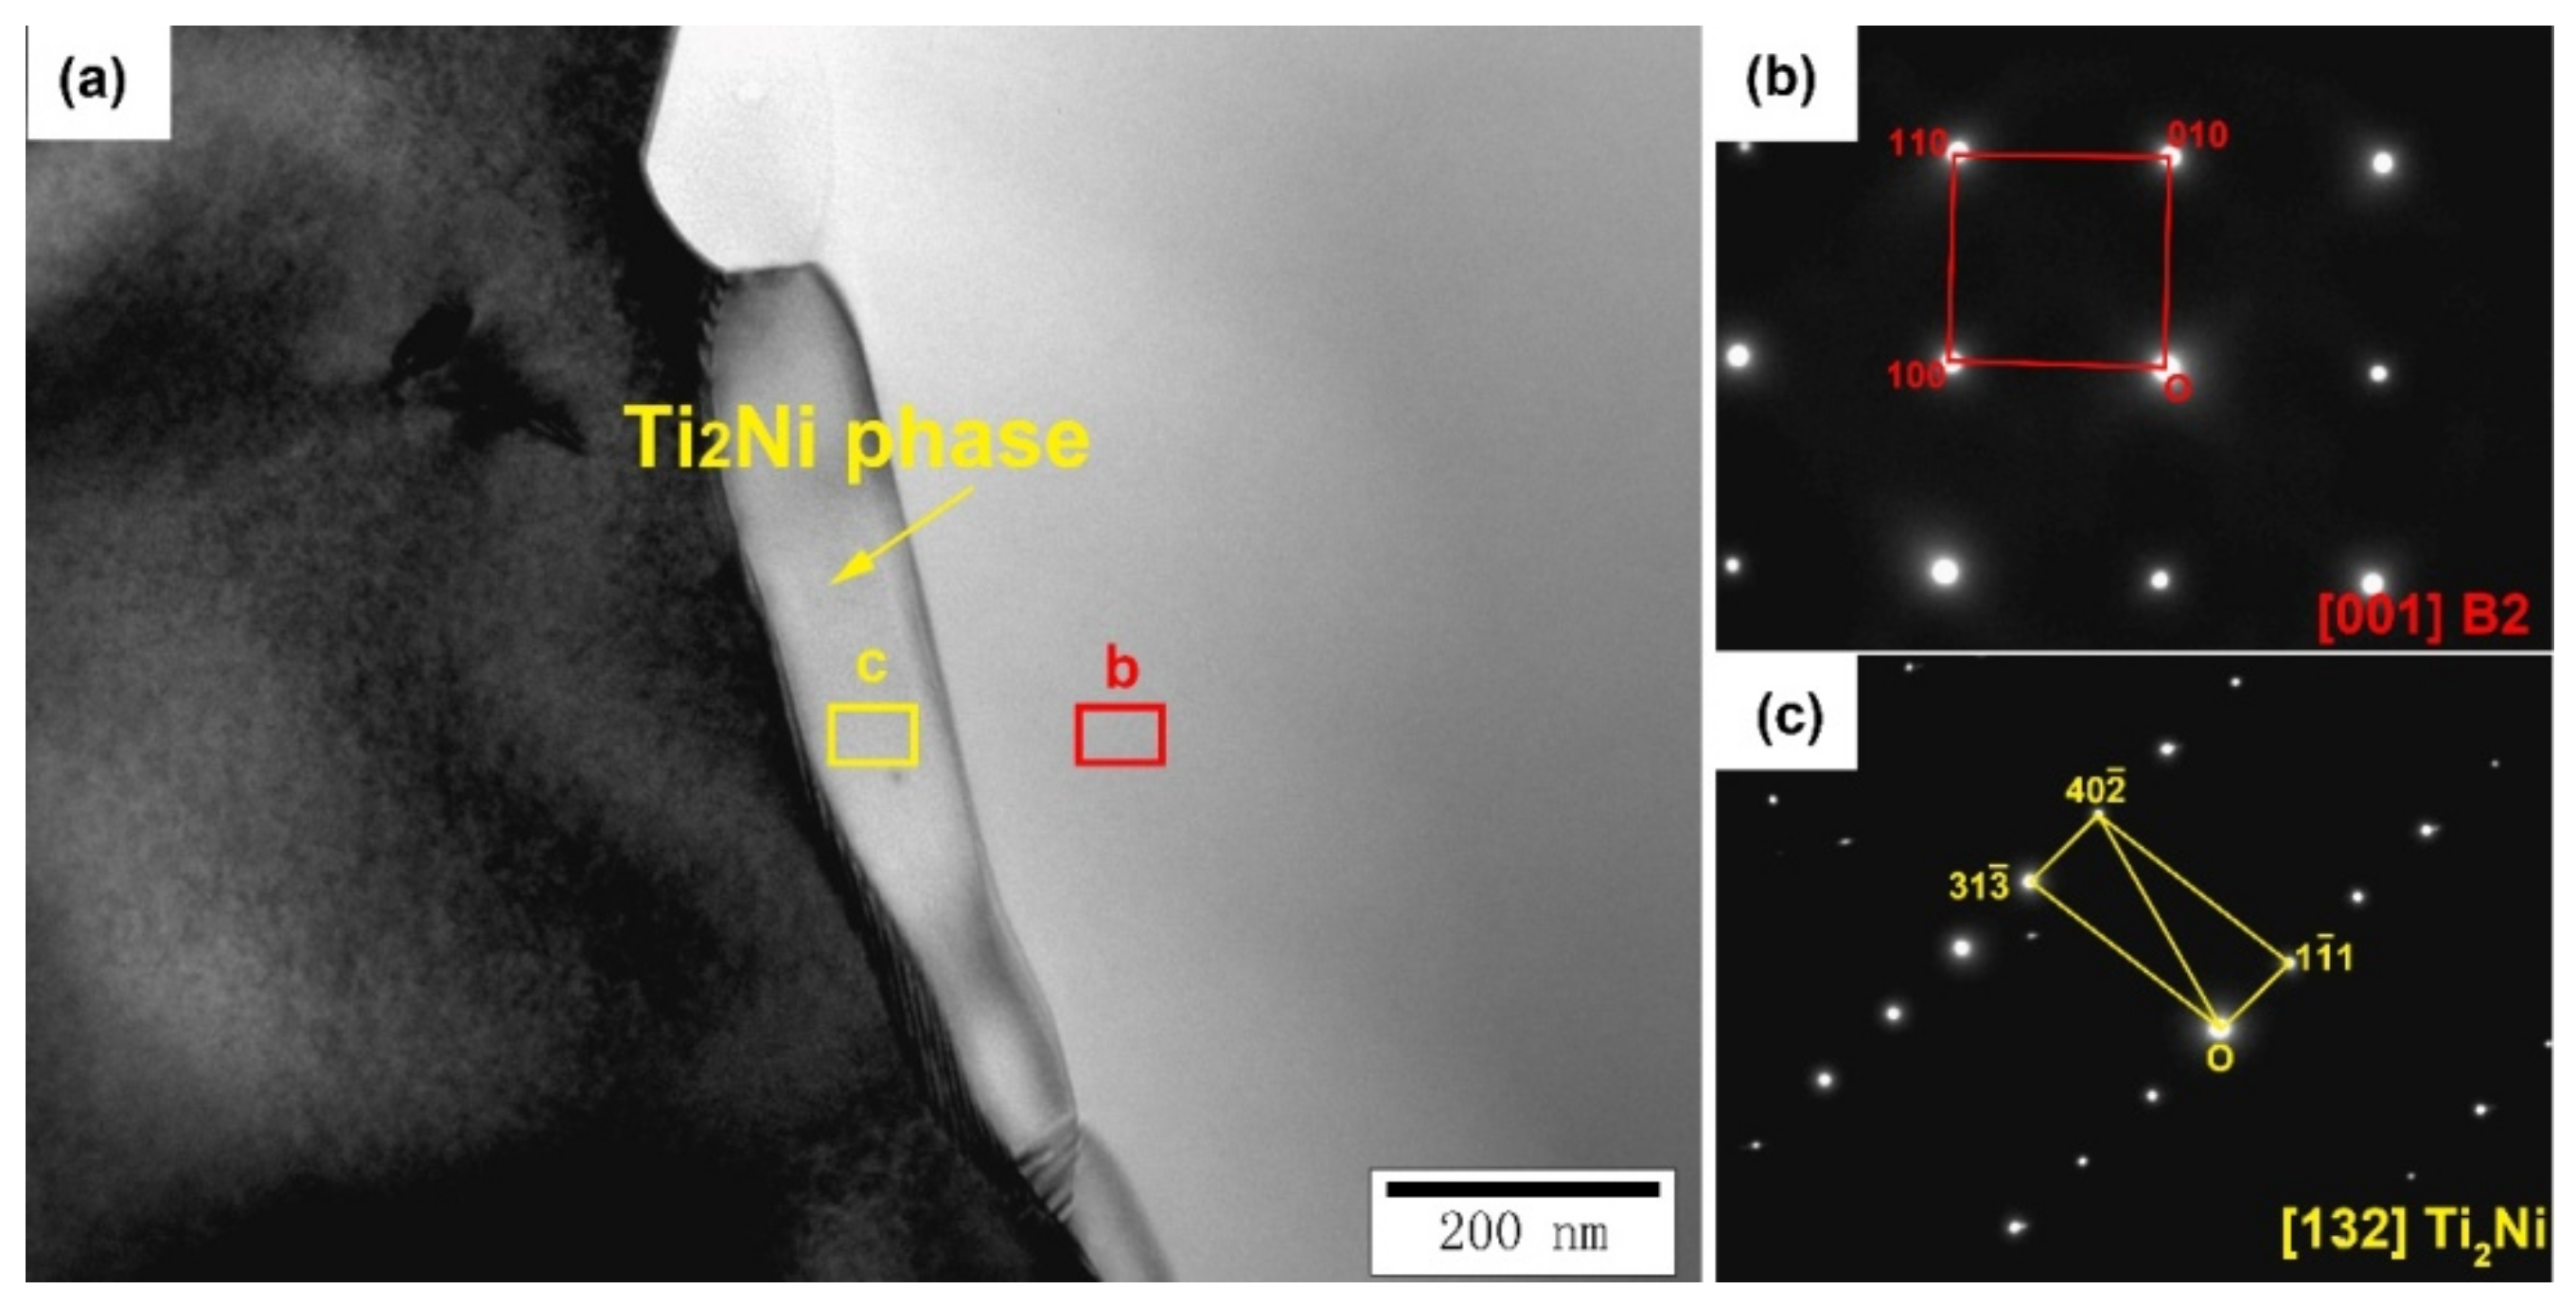
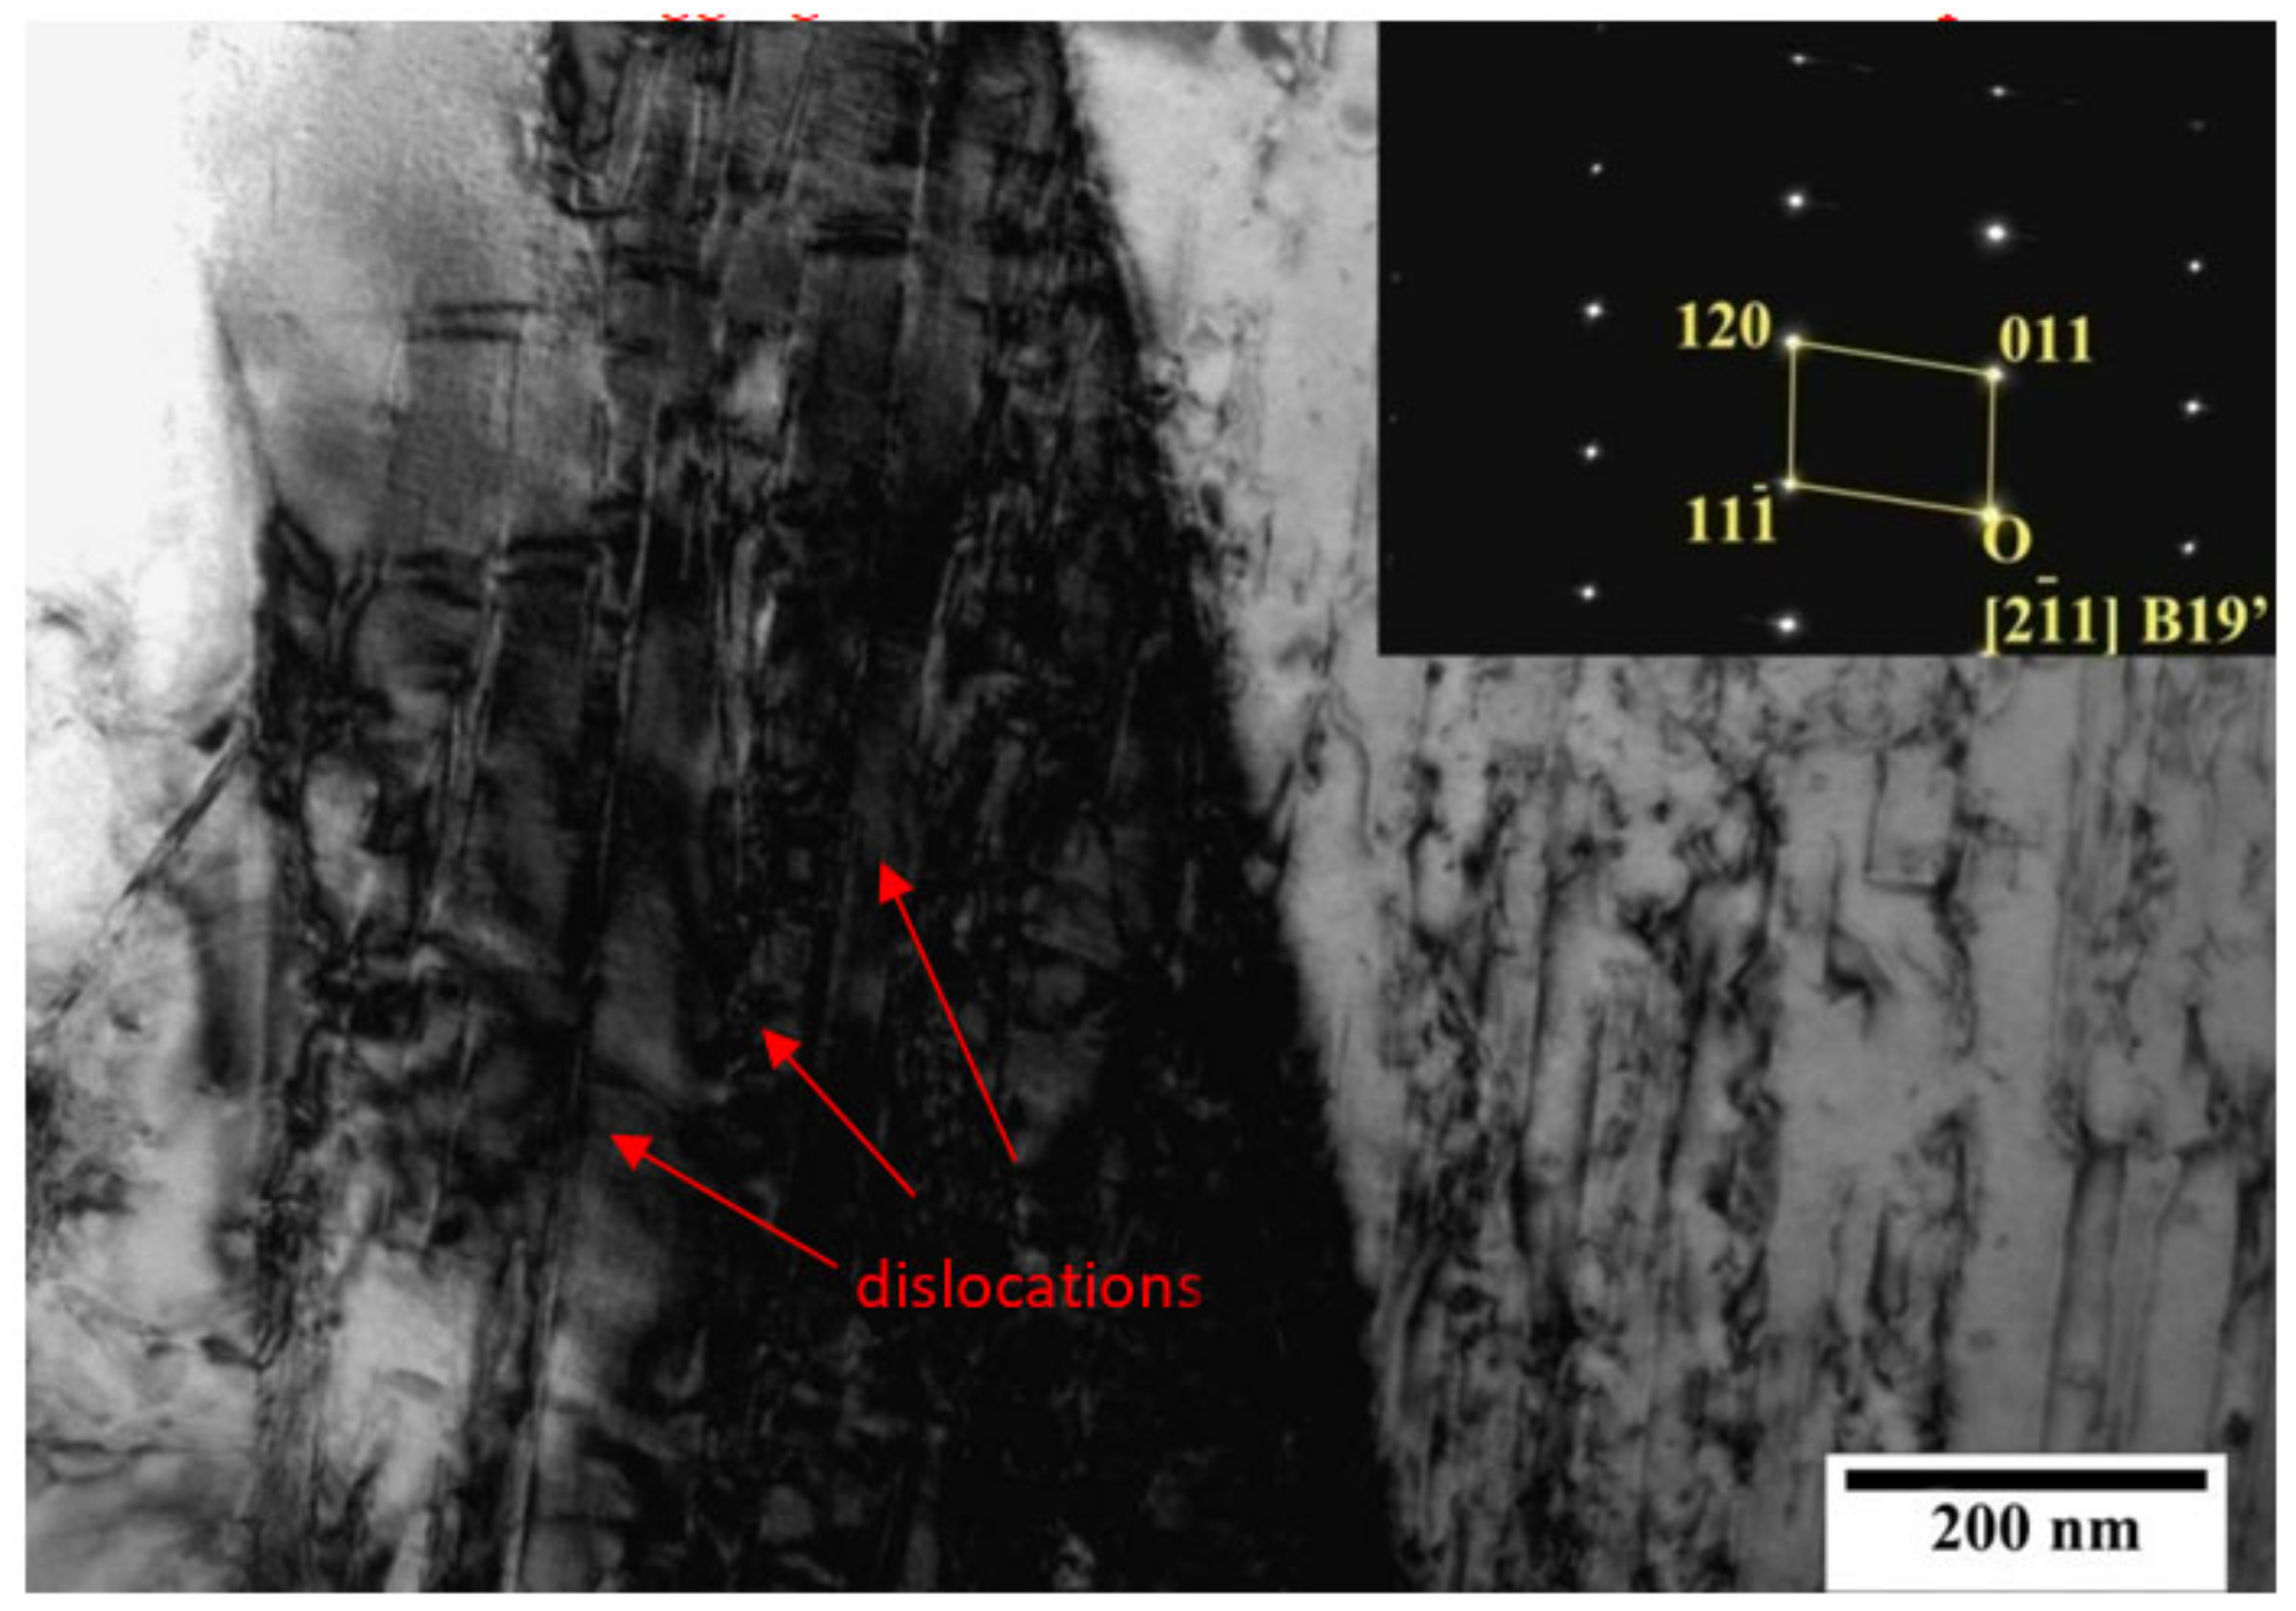
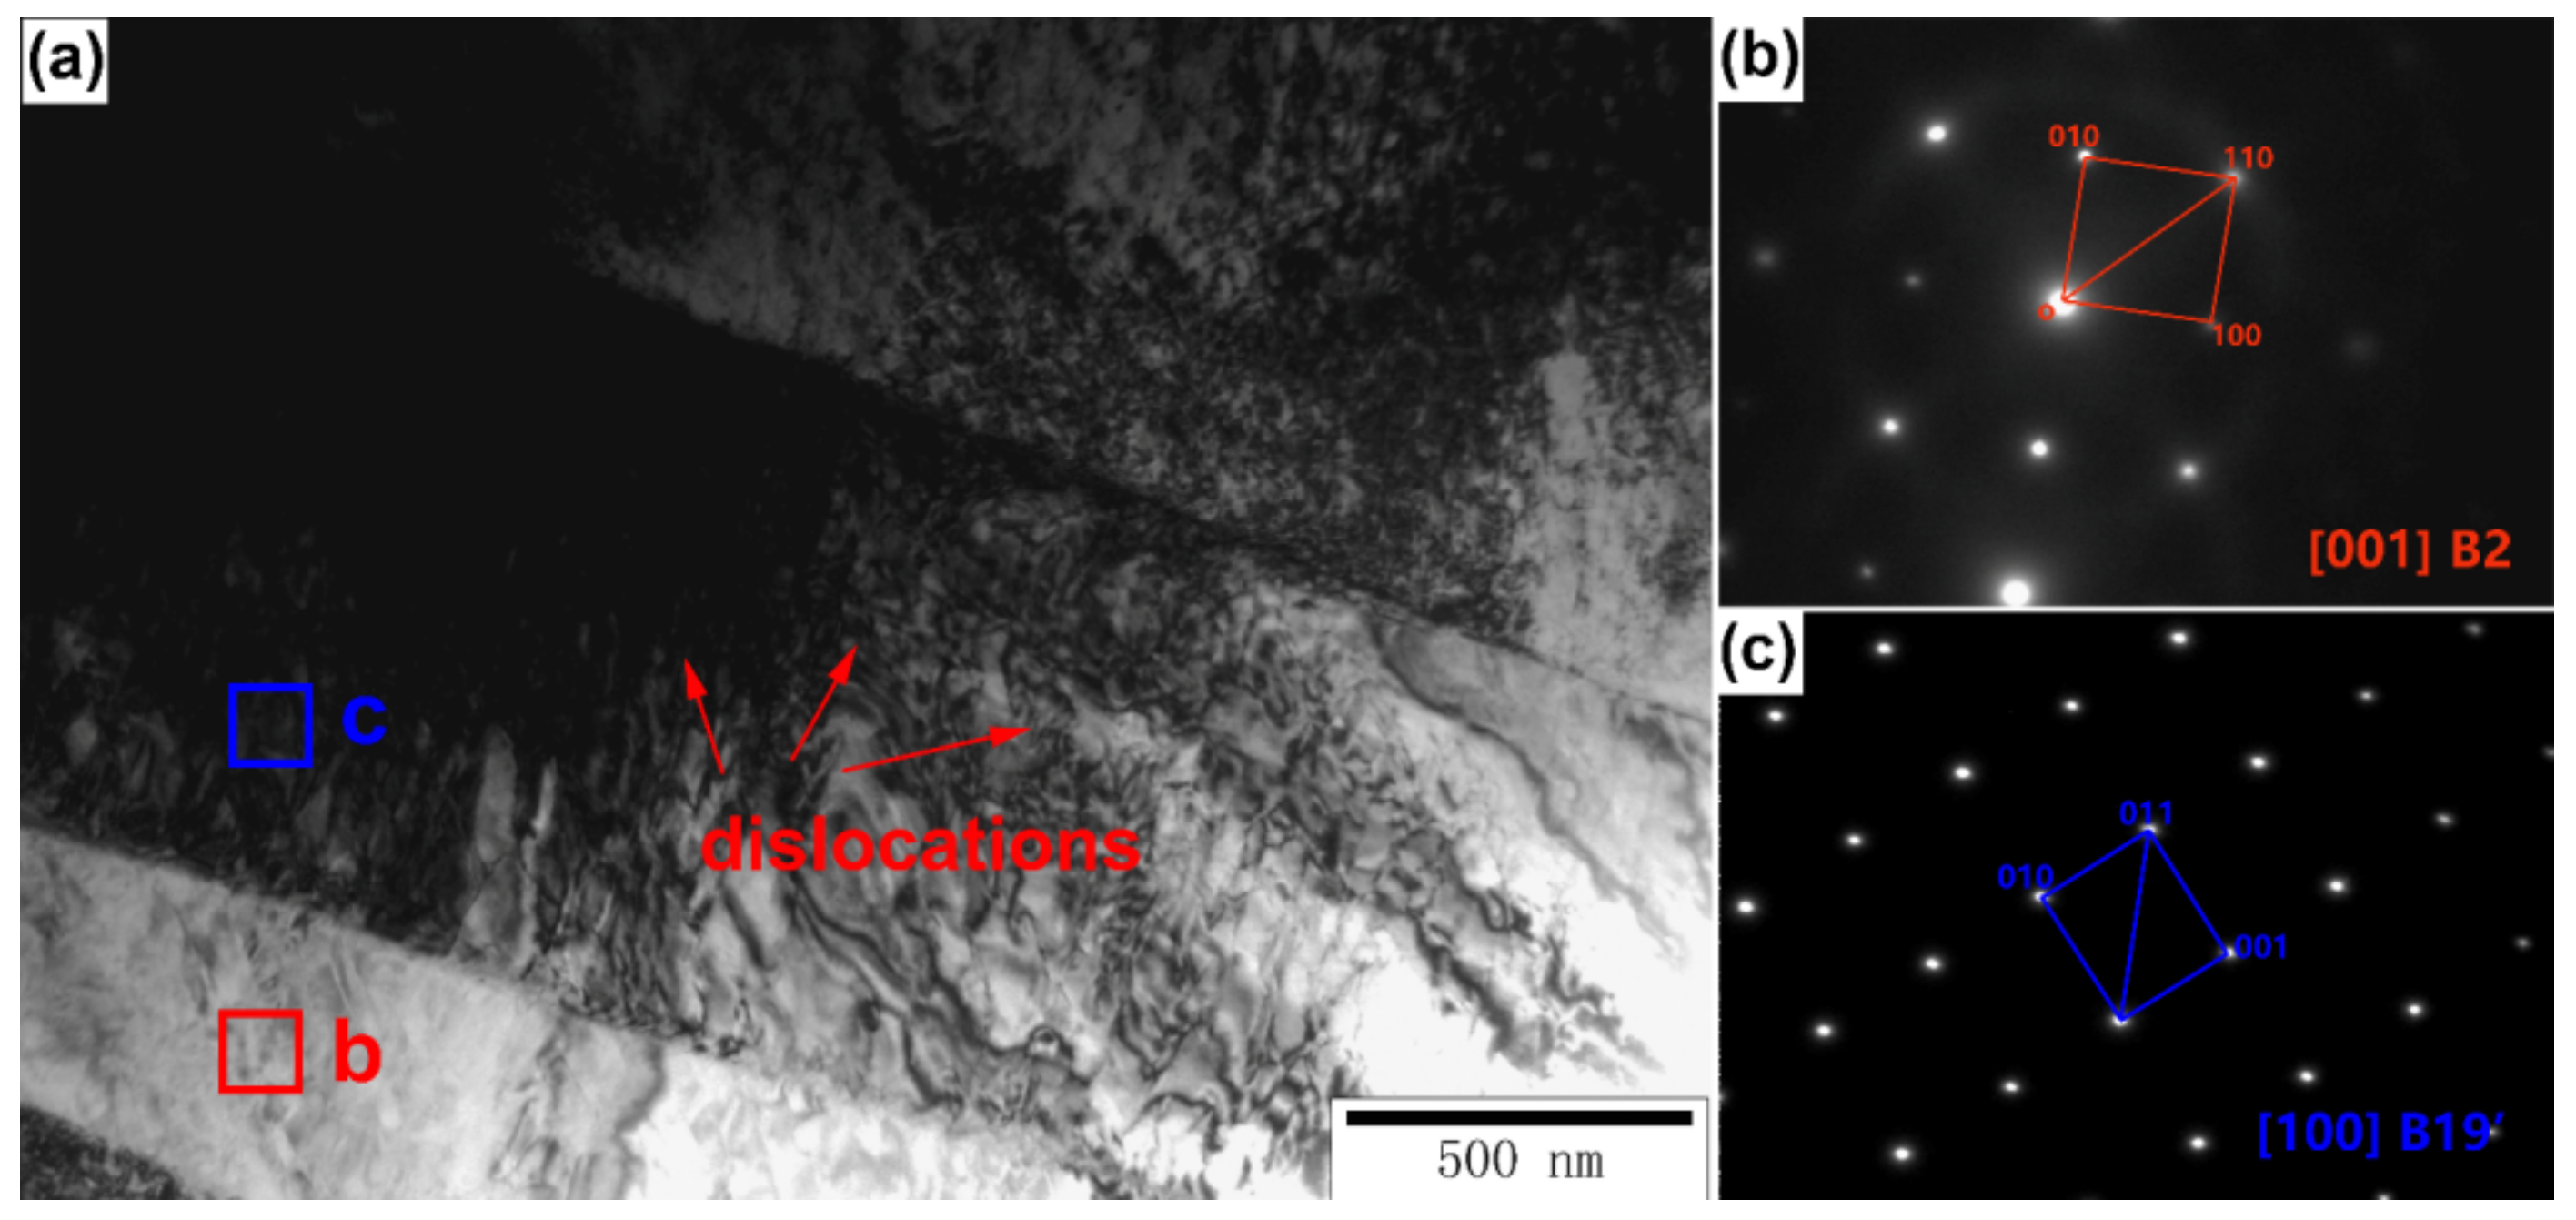
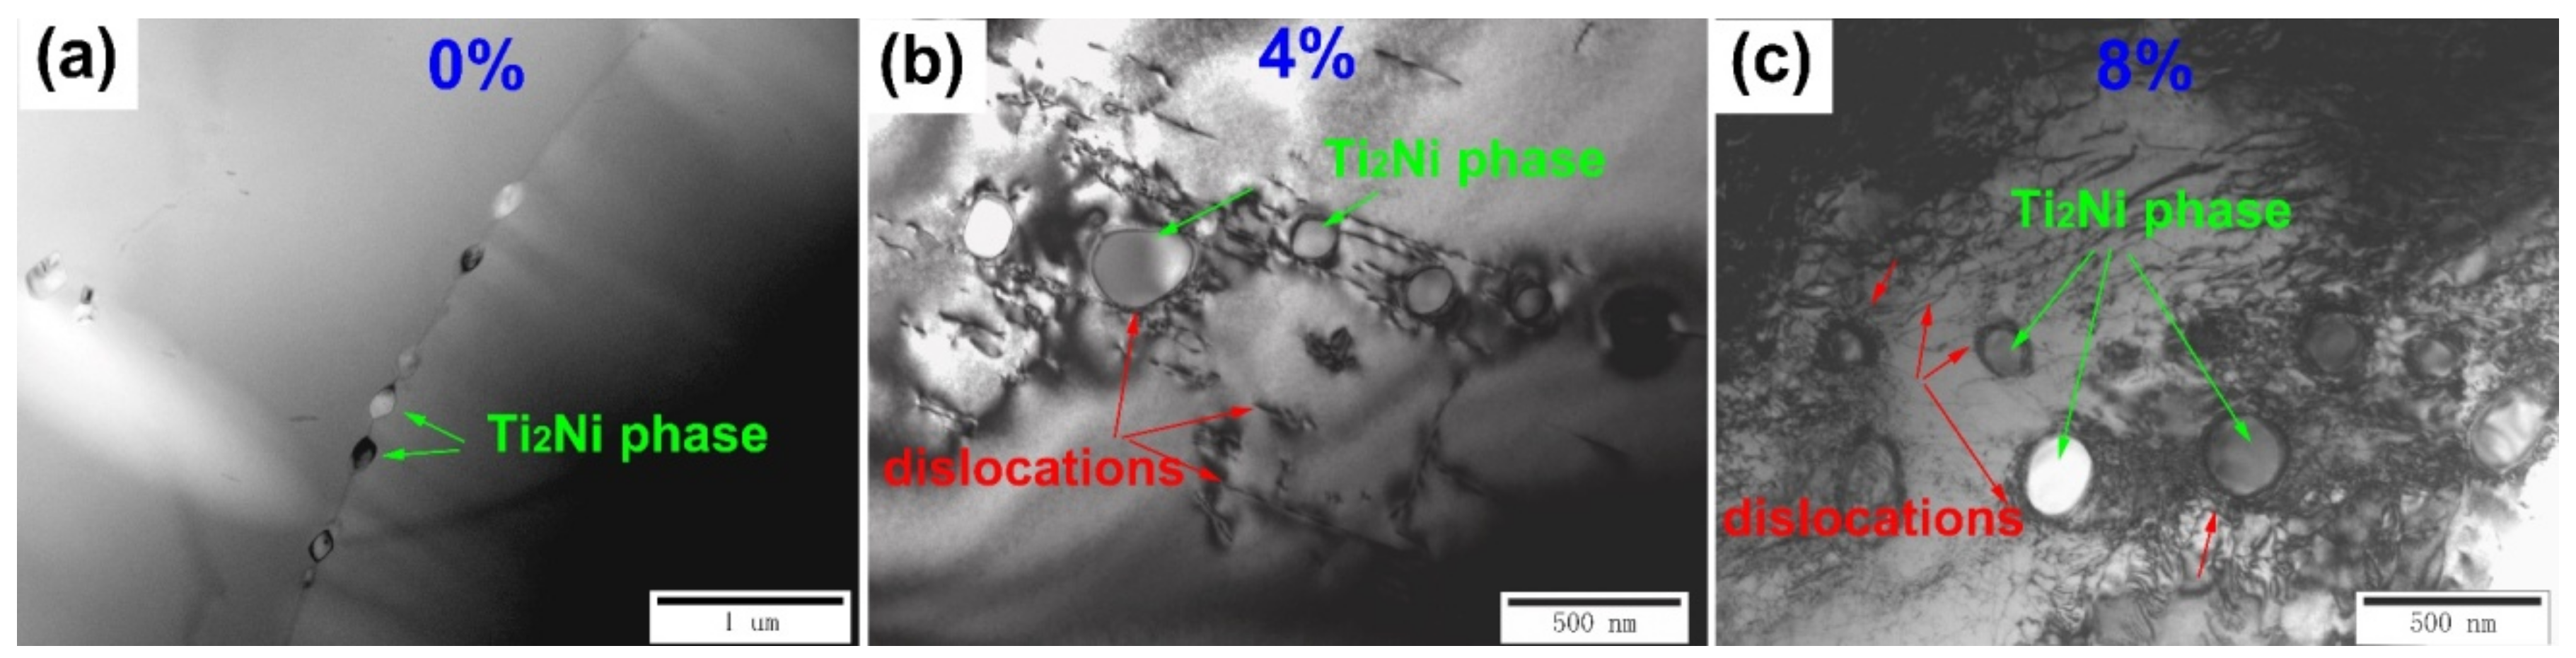
3.5. TEM Analysis
4. Conclusions
Author Contributions
Funding
Institutional Review Board Statement
Informed Consent Statement
Data Availability Statement
Conflicts of Interest
References
- Elahinia, M.; Shayesteh-Moghaddam, N.; Taheri Andani, A.; Amerinatanzi, A.; Bimber, B.A.; Hamilton, R.F. Fabrication of NiTi through additive manufacturing: A review. Prog. Mater. Sci. 2016, 83, 630–663. [Google Scholar] [CrossRef]
- Ou, S.F.; Peng, B.Y.; Chen, Y.C.; Meng-Hsiu, T. Manufacturing and Characterization of NiTi Alloy with Functional Properties by Selective Laser Melting. Metals 2018, 8, 342. [Google Scholar] [CrossRef]
- Sam, J.; Franco, B.; Ma, J.; Karaman, I.; Elwany, A.; Mabe, J.H. Tensile actuation response of additively manufactured nickel-titanium shape memory alloys. Scripta Mater. 2018, 146, 164–168. [Google Scholar] [CrossRef]
- Mohd Jani, J.; Leary, M.; Subic, A.; Gibson, A. A review of shape memory alloyresearch, applications and opportunities. Mater. Des. 2014, 56, 1078–1113. [Google Scholar] [CrossRef]
- Hey, J.; Jardine, A. Shape memory TiNi synthesis from elemental powders. Mater. Sci. Eng. A 1994, 188, 291–300. [Google Scholar] [CrossRef]
- Shin, Y.; Halani, P. In-Situ Synthesis and Micro-Structural Characterization of Shape Memory Alloy-Nitinol by Laser Direct Deposition. In Proceedings of the Aeromat 22 Conference and Exposition American Society for Metals, Long Beach, CA, USA, 23–26 May 2011. [Google Scholar]
- Herzog, D.; Seyda, V.; Wycisk, E.; Emmelmann, C. Additive manufacturing of metals. Acta Mater. 2016, 117, 371–392. [Google Scholar] [CrossRef]
- Qi, T.; Zhu, H.; Zhang, H.; Yin, J.; Ke, L.; Zeng, X. Selective laser melting of Al7050 powder: Melting mode transition and comparison of the characteristics between the keyhole and conduction mode. Mater. Des. 2017, 135, 257–266. [Google Scholar] [CrossRef]
- Li, Z.; Li, H.; Yin, J.; Li, Y.; Nie, Z.; Li, X.; You, D.; Guan, K.; Duan, W.; Cao, L.; et al. A Review of Spatter in Laser Powder Bed Fusion Additive Manufacturing: In Situ Detection, Generation, Effects, and Countermeasures. Micromachines 2022, 13, 1366. [Google Scholar] [CrossRef]
- Zhou, Y.; Xu, L.; Yang, Y.; Wang, J.; Wang, D.; Shen, L. Microstructure and Corrosion Behavior of Iron Based Biocomposites Prepared by Laser Additive Manufacturing. Micromachines 2022, 13, 712. [Google Scholar] [CrossRef]
- Liu, Y.; Meng, J.; Zhu, L.; Chen, H.; Li, Z.; Li, S.; Wang, D.; Wang, Y.; Kosiba, K. Dynamic compressive properties and underlying failure mechanisms of selective laser melted Ti-6Al-4V alloy under high temperature and strain rate conditions. Addit. Manuf. 2022, 54, 102772. [Google Scholar] [CrossRef]
- Aboulkhair, N.T.; Simonelli, M.; Parry, L.; Ashcroft, I.; Tuck, C.; Hague, R. 3D printing of Aluminium alloys: Additive Manufacturing of Aluminium alloys using selective laser melting. Prog. Mater. Sci. 2019, 106, 100578. [Google Scholar] [CrossRef]
- Kusano, M.; Kitano, H.; Watanabe, M. Novel Calibration Strategy for Validation of Finite Element Thermal Analysis of Selective Laser Melting Process Using Bayesian Optimization. Materials 2021, 14, 4948. [Google Scholar] [CrossRef] [PubMed]
- Zhang, Y.; Hu, X.; Jiang, Y. Study on the Microstructure and Fatigue Behavior of a Laser-Welded Ni-Based Alloy Manufactured by Selective Laser Melting Method. J. Mater. Enge. Perform. 2020, 29, 2957–2968. [Google Scholar] [CrossRef]
- Jinoop, A.N.; Paul, C.P.; Nayak, S.K.; Kumar, J.G.; Bindra, K.S. Effect of laser energy per unit powder feed on Hastelloy-X walls built by laser directed energy deposition based additive manufacturing. Opt. Laser Technol. 2021, 138, 106845. [Google Scholar] [CrossRef]
- Radhakrishnan, M.; Hassan, M.M.; Long, B.E.; Otazu, D.; Lienert, T.J.; Anderoglu, O. Microstructures and properties of Ti/TiC composites fabricated by laser-directed energy deposition. Addit. Manuf. 2021, 46, 102198. [Google Scholar] [CrossRef]
- Pan, Q.; Kapoor, M.; Mileski, S.; Carsley, J.; Lou, X. Technical basis of using laser direct energy deposition as a high-throughput combinatorial method for DC-cast Al-Mn alloy development. Mater. Des. 2021, 212, 110290. [Google Scholar] [CrossRef]
- Saedi, S.; Turabi, A.S.; Andani, M.T.; Moghaddam, N.S.; Elahinia, M.; Karaca, H.E. Texture, aging, and superelasticity of selective laser melting fabricated Ni-rich NiTi alloys. Mater. Sci. Eng. A 2017, 686, 1–10. [Google Scholar] [CrossRef]
- Qiu, P.; Gao, P.; Wang, S.; Li, Z.; Yang, Y.; Zhang, Q.; Xiong, Z.; Hao, S. Study on corrosion behavior of the selective laser melted NiTi alloy with superior tensile property and shape memory effect. Corros. Sci. 2020, 175, 108891. [Google Scholar] [CrossRef]
- Li, S.; Hassanin, H.; Attallah, M.; Adkins, N.J.; Essa, K. The development of TiNi-based negative Poisson’s ratio structure using selective laser melting. Acta Mater. 2016, 105, 75–83. [Google Scholar] [CrossRef]
- Saedi, S.; Moghaddam, N.; Amerinatanzi, A.; Elahinia, M.; Karaca, H.E. On the effects of selective laser melting process parameters on microstructure and thermomechanical response of Ni-rich NiTi. Acta Mater. 2018, 144, 552–560. [Google Scholar] [CrossRef]
- Dadbakhsh, S.; Speirs, M.; Kruth, J.P.; Schrooten, J.; Luyten, J.; Van Humbeeck, J. Effect of SLM Parameters on Transformation Temperatures of Shape Memory Nickel Titanium Parts. Adv. Eng. Mater. 2014, 16, 1140–1146. [Google Scholar] [CrossRef]
- Meier, H.; Haberland, C.; Frenzel, J. Structural and functional Properties of NiTi Shape Memory Alloys produced by Selective Laser Melting. In Proceedings of the 5th International Conference on Advanced Research and Rapid Proto Typing, Leiria, Portugal, 28 September–1 October 2011. [Google Scholar]
- Yang, Y.; Zhan, J.; Sui, J.; Li, C.; Yang, K.; Castany, P.; Gloriant, T. Functionally graded NiTi alloy with exceptional strain-hardening effect fabricated by SLM method. ScriptaMaterialia 2020, 188, 130–134. [Google Scholar] [CrossRef]
- Bormann, T.; Schumacher, R.; Müller, B.; Mertmann, M. Tailoring Selective Laser Melting Process Parameters for NiTi Implants. J Mater Enge Perform. 2012, 21, 2519–2524. [Google Scholar] [CrossRef]
- Haberland, C.; Elahinia, M.; Walker, J.; Meier, H.; Frenzel, J. On the development of high quality NiTi shape memory and pseudoelastic parts by additive manufacturing. Smart Mater. Struct. 2014, 23, 104002. [Google Scholar] [CrossRef]
- Lu, H.; Liu, L.; Yang, C.; Luo, X.; Song, C.; Wang, Z.; Wang, J.; Su, Y.; Ding, Y.; Zhang, L.; et al. Simultaneous enhancement of mechanical and shape memory properties by heat-treatment homogenization of Ti2Ni precipitates in TiNi shape memory alloy fabricated by selective laser melting. J. Mater. Sci. Technol. 2022, 101, 205–216. [Google Scholar] [CrossRef]
- Bimber, B.; Hamilton, R.F.; Keist, J.; Palmer, T.A. Anisotropic microstructure and superelasticity of additive manufactured NiTi alloy bulk builds using laser directed energy deposition. Mater. Sci. Eng. A 2016, 674, 125–134. [Google Scholar] [CrossRef]
- Wan, X.; Feng, Y.; Lin, X.; Tan, H. Large superelastic recovery and elastocaloric effect in as-deposited additive manufactured Ni50.8Ti49.2 alloy. Appl. Phys. Lett. 2019, 114, 221903. [Google Scholar] [CrossRef]
- Marattukalam, J.; Balla, V.; Das, M.; Bontha, S.; Kalpathy, S.K. Effect of heat treatment on microstructure, corrosion, and shape memory characteristics of laser deposited NiTi alloy. J. Alloy. Compd. 2018, 744, 337–346. [Google Scholar] [CrossRef]
- Taheri Andani, M.; Saedi, S.; Turabi, A.S.; Karamooz, R.; Haberland, C.; Karac, E.; Elahinia, M. Mechanical and shape memory properties of porous Ni50.1Ti49.9 alloys manufactured by selective laser melting. J. Mech. Behav. Biomed. Mater. 2017, 68, 224–231. [Google Scholar] [CrossRef]
- Hayesteh Moghaddam, N.; Saedi, S.; Amerinatanzi, A.; Hinojos, A.; Ramazani, A.; Kundin, J.; Mills, M.J.; Karaca, H.; Elahinia, M. Achieving superelasticity in additively manufactured NiTi in compression without post-process heat treatment. Sci. Rep. 2019, 9, 41. [Google Scholar] [CrossRef] [Green Version]
- Chen, W.; Yang, Q.; Huang, S.; Kruzic, J.J.; Li, X. Compression Behavior of Graded NiTi Gyroid-Structures Fabricated by Laser Powder Bed Fusion Additive Manufacturing Under Monotonic and Cyclic Loading. JOM 2021, 73, 4154–4165. [Google Scholar] [CrossRef]
- Zhang, Y.; Zhao, S.; Xiao, M.; Zhang, X. Compression mechanical behavior of porous NiTi alloys exhibiting high linear superelasticity. Chin. J. Nonferrous Met. 2009, 19, 2167–2172. [Google Scholar] [CrossRef]
- Li, X.; Wang, T. Numerical investigation of effects of nucleation mechanisms on grain structure in metal additive manufacturing. Comput. Mater. Sci. 2018, 153, 159–169. [Google Scholar] [CrossRef]
- Wang, Y.; Yao, Y.; Wang, Z.; Jin, Y.; Zhang, X.; Liu, J. Thermal ageing on the deformation and fracture mechanisms of a duplex stainless steel by quasi in-situ tensile test under OM and SEM. Mater. Sci. Eng. A 2016, 666, 184–190. [Google Scholar] [CrossRef]
- Xu, H.; Xu, Y.; He, Y.; Jiao, H.; Yue, S.; Li, J. A quasi in-situ EBSD study of the nucleation and growth of Goss grains during primary and secondary recrystallization of a strip-cast Fe-6.5 wt% Si alloy. J. Alloy. Compd. 2020, 861, 158550. [Google Scholar] [CrossRef]
- Yin, J.; Wang, D.; Yang, L.; Wei, H.; Dong, P.; Ke, L.; Wang, G.; Zhu, H.; Zeng, X. Correlation between forming quality and spatter dynamics in laser powder bed fusion. Addit. Manuf. 2020, 31, 100958. [Google Scholar] [CrossRef]
- Yin, J.; Zhang, W.; Ke, L.; Wei, H.; Wang, D.; Yang, L.; Zhu, H.; Dong, P.; Wang, G.; Zeng, X. Vaporization of alloying elements and explosion behavior during laser powder bed fusion of Cu–10Zn alloy. Int. J. Mach. Tools Manuf. 2021, 161, 103686. [Google Scholar] [CrossRef]
- Froend, A.M.; Ventzke, V.; Dorn, F.; Kashaev, N.; Klusemann, B.; Enz, J. Microstructure by design: An approach of grain refinement and isotropy improvement in multi-layer wire-based laser metal deposition. Mater. Sci. Eng. A 2020, 772, 138635. [Google Scholar] [CrossRef]
- Frenzel, J.; George, E.; Dlouhy, A.; Somsen, C.; Wagner, M.; Eggeler, G. Influence of Ni on martensitic phase transformations in NiTi shape memory alloys. Acta Mater. 2010, 58, 3444–3458. [Google Scholar] [CrossRef]
- Sehitoglu, H.; Ikaraman, I.; Anderson, R.; Zhang, X.; Gall, K.; Maier, H.; Chumlyakov, Y. Compressive response of NiTi single crystals. Acta Mater. 2000, 48, 3311–3326. [Google Scholar] [CrossRef]
- Saedi, S.; Turabi, A.; Andani, M.; Haberland, C.; Karaca, H.; Elahinia, M. The influence of heat treatment on the thermomechanical response of Ni-rich NiTi alloys manufactured by selective laser melting. J. Alloy. Compd. 2016, 677, 204–210. [Google Scholar] [CrossRef]


Publisher’s Note: MDPI stays neutral with regard to jurisdictional claims in published maps and institutional affiliations. |
© 2022 by the authors. Licensee MDPI, Basel, Switzerland. This article is an open access article distributed under the terms and conditions of the Creative Commons Attribution (CC BY) license (https://creativecommons.org/licenses/by/4.0/).
Share and Cite
Yang, X.; Wang, S.; Pan, H.; Zhang, C.; Chen, J.; Zhang, X.; Gao, L. Microstructure Transformation in Laser Additive Manufactured NiTi Alloy with Quasi-In-Situ Compression. Micromachines 2022, 13, 1642. https://doi.org/10.3390/mi13101642
Yang X, Wang S, Pan H, Zhang C, Chen J, Zhang X, Gao L. Microstructure Transformation in Laser Additive Manufactured NiTi Alloy with Quasi-In-Situ Compression. Micromachines. 2022; 13(10):1642. https://doi.org/10.3390/mi13101642
Chicago/Turabian StyleYang, Xiao, Shuo Wang, Hengpei Pan, Congyi Zhang, Jieming Chen, Xinyao Zhang, and Lingqing Gao. 2022. "Microstructure Transformation in Laser Additive Manufactured NiTi Alloy with Quasi-In-Situ Compression" Micromachines 13, no. 10: 1642. https://doi.org/10.3390/mi13101642