Recent Developments in Ozone Sensor Technology for Medical Applications

 , ,
, ,
Abstract
:1. Introduction
2. Measurement Principles for Ozone Sensing
2.1. Preprocessing Methods
2.1.1. Gas Stripping
2.2. Electrochemical Measurement Methods
2.2.1. Amperometry
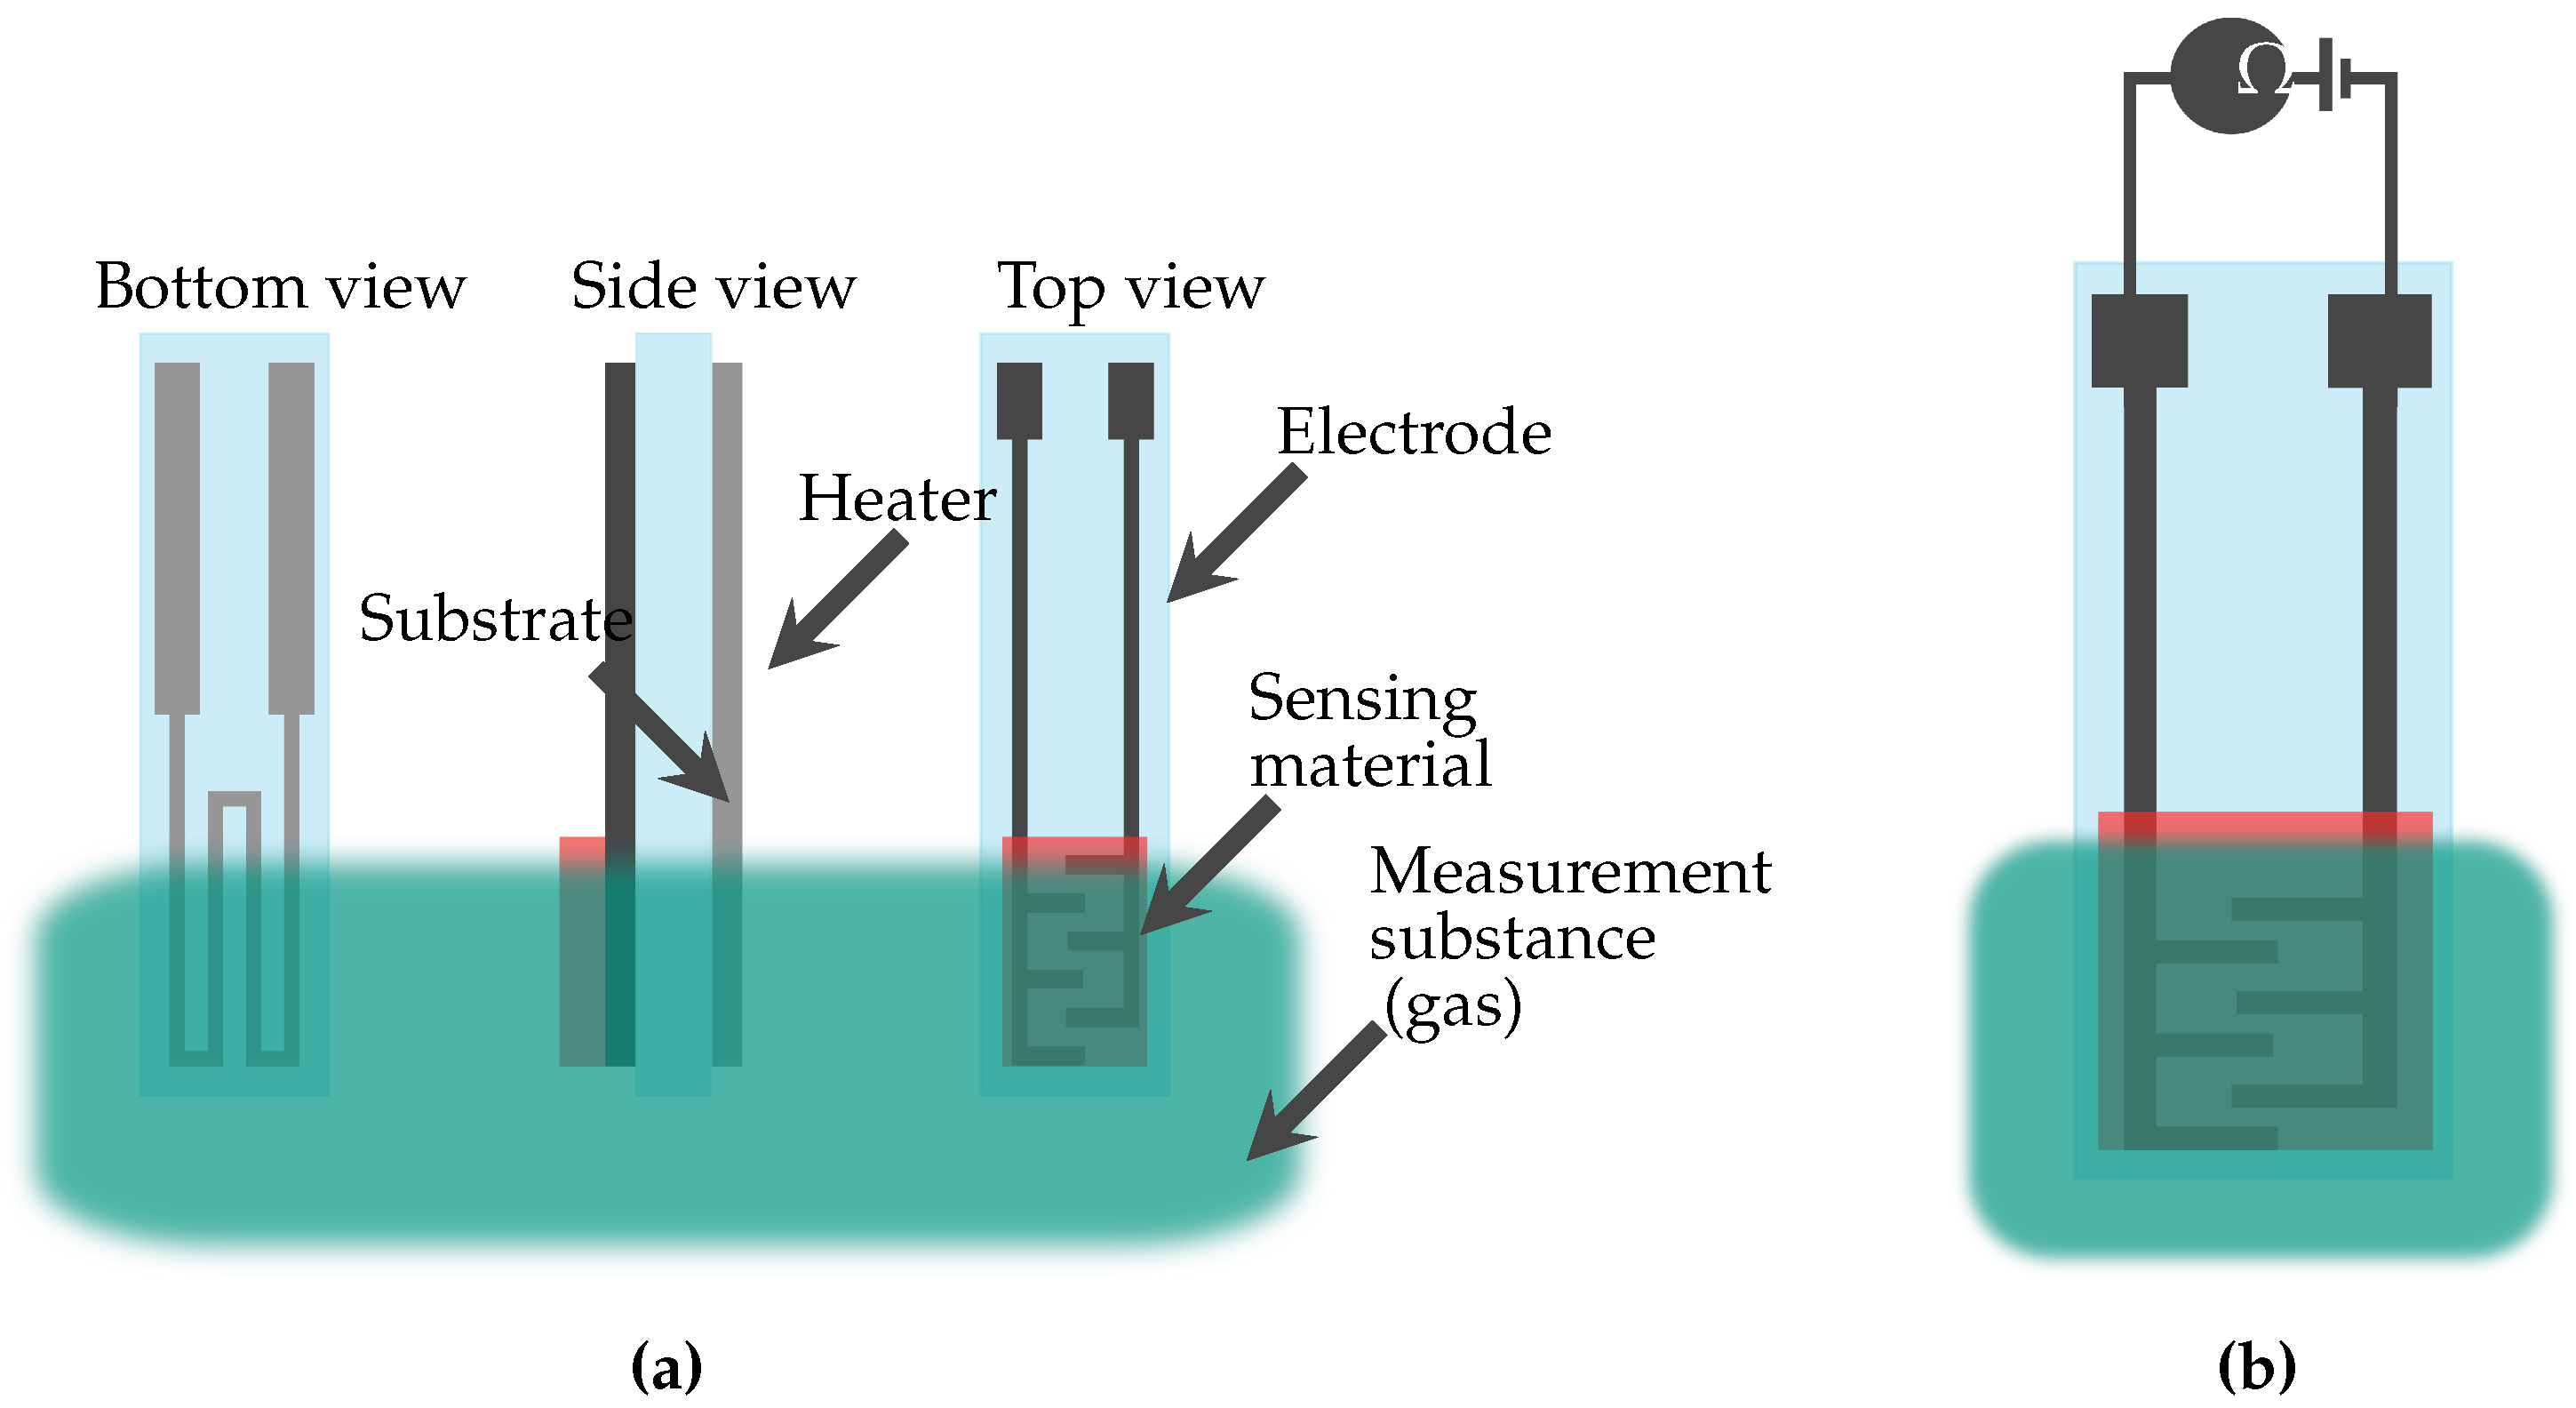
2.2.2. Impedimetry
2.3. Optical Measurement Methods
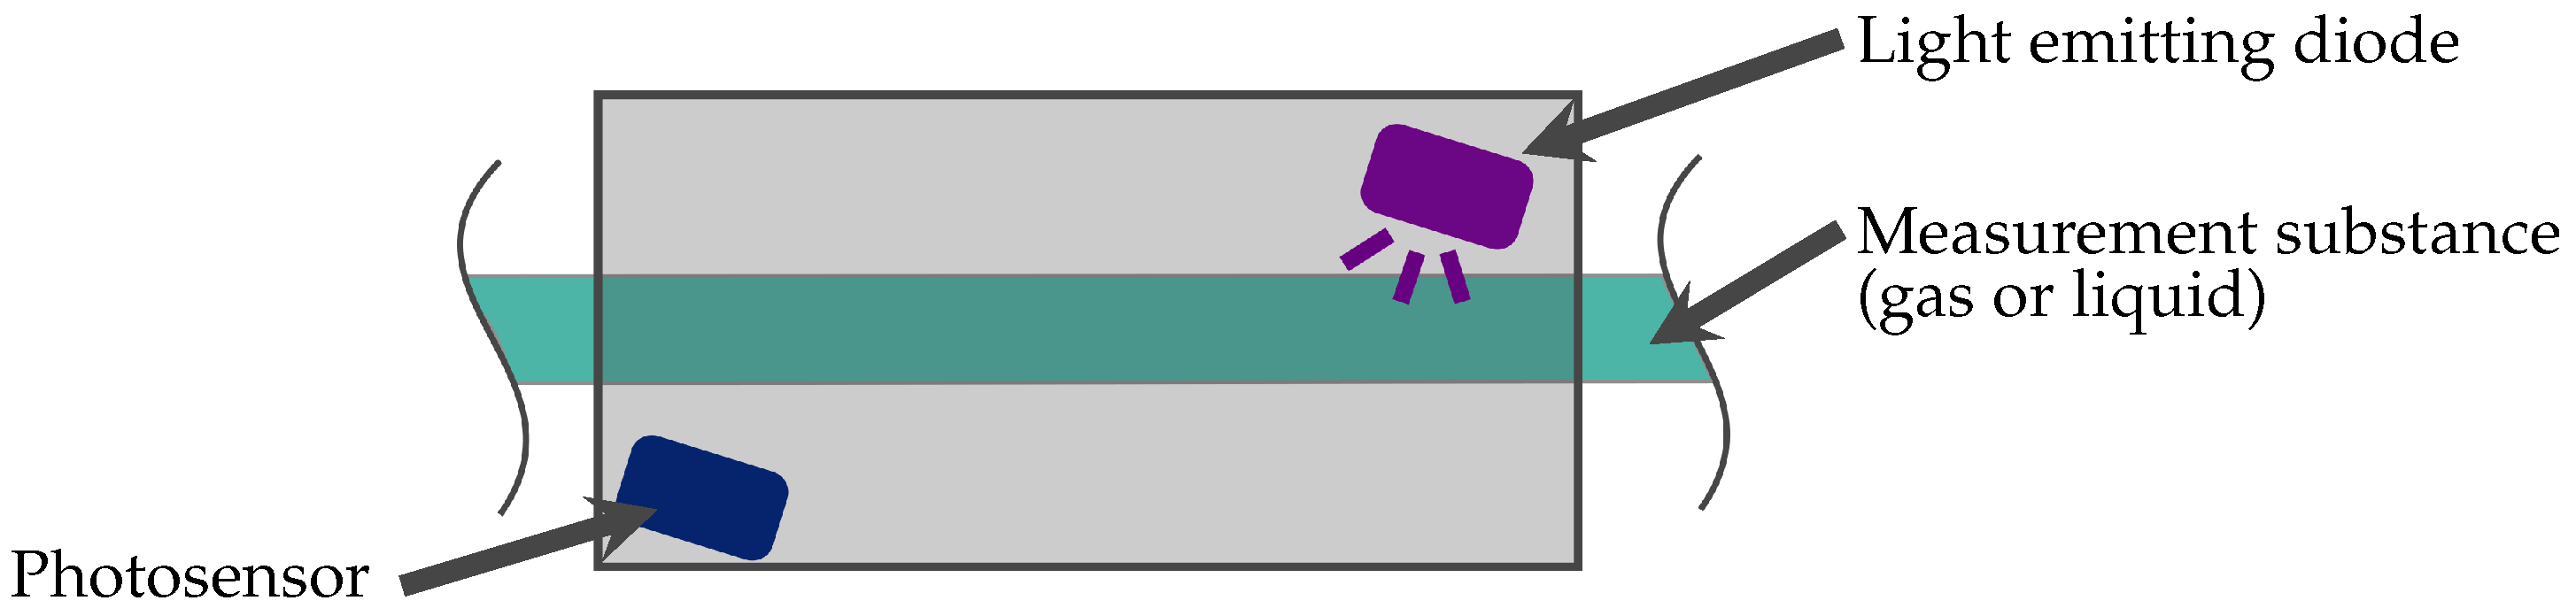
2.3.1. Optical Absorption
2.3.2. Photoluminescence
2.3.3. Colorimetry
2.4. Volumetric Measurement Methods
2.4.1. Titration
2.5. Overview of the Key Parameters for the Ozone Measurement Methods
3. Sensors for Measurement of Ozone Concentration in Gases
3.1. Electrochemical Sensors
3.1.1. Amperometric Sensors
3.1.2. Impedimetric Sensors
3.2. Optical Sensors
3.2.1. Optical Absorption Sensors
3.2.2. Photoluminescence Sensors
4. Sensors for Measurement of Dissolved Ozone Concentration
4.1. Electrochemical Sensors
4.1.1. Amperometric Sensors
- For ceramic membranes made of aluminium oxide a transfer rate of 0.35 g m−2 h;
- For zirconium oxide 10 g m−2 h;
- For porous polytetrafluoroethylene (PTFE) 4 g m−2 h.
4.2. Optical Sensors
4.2.1. Optical Absorption Sensors
4.2.2. Optical Absorption with Gas Stripping Preprocessing Step
4.2.3. Colorimetric Sensors
4.3. Volumetric Sensors
Titration-Based Sensors
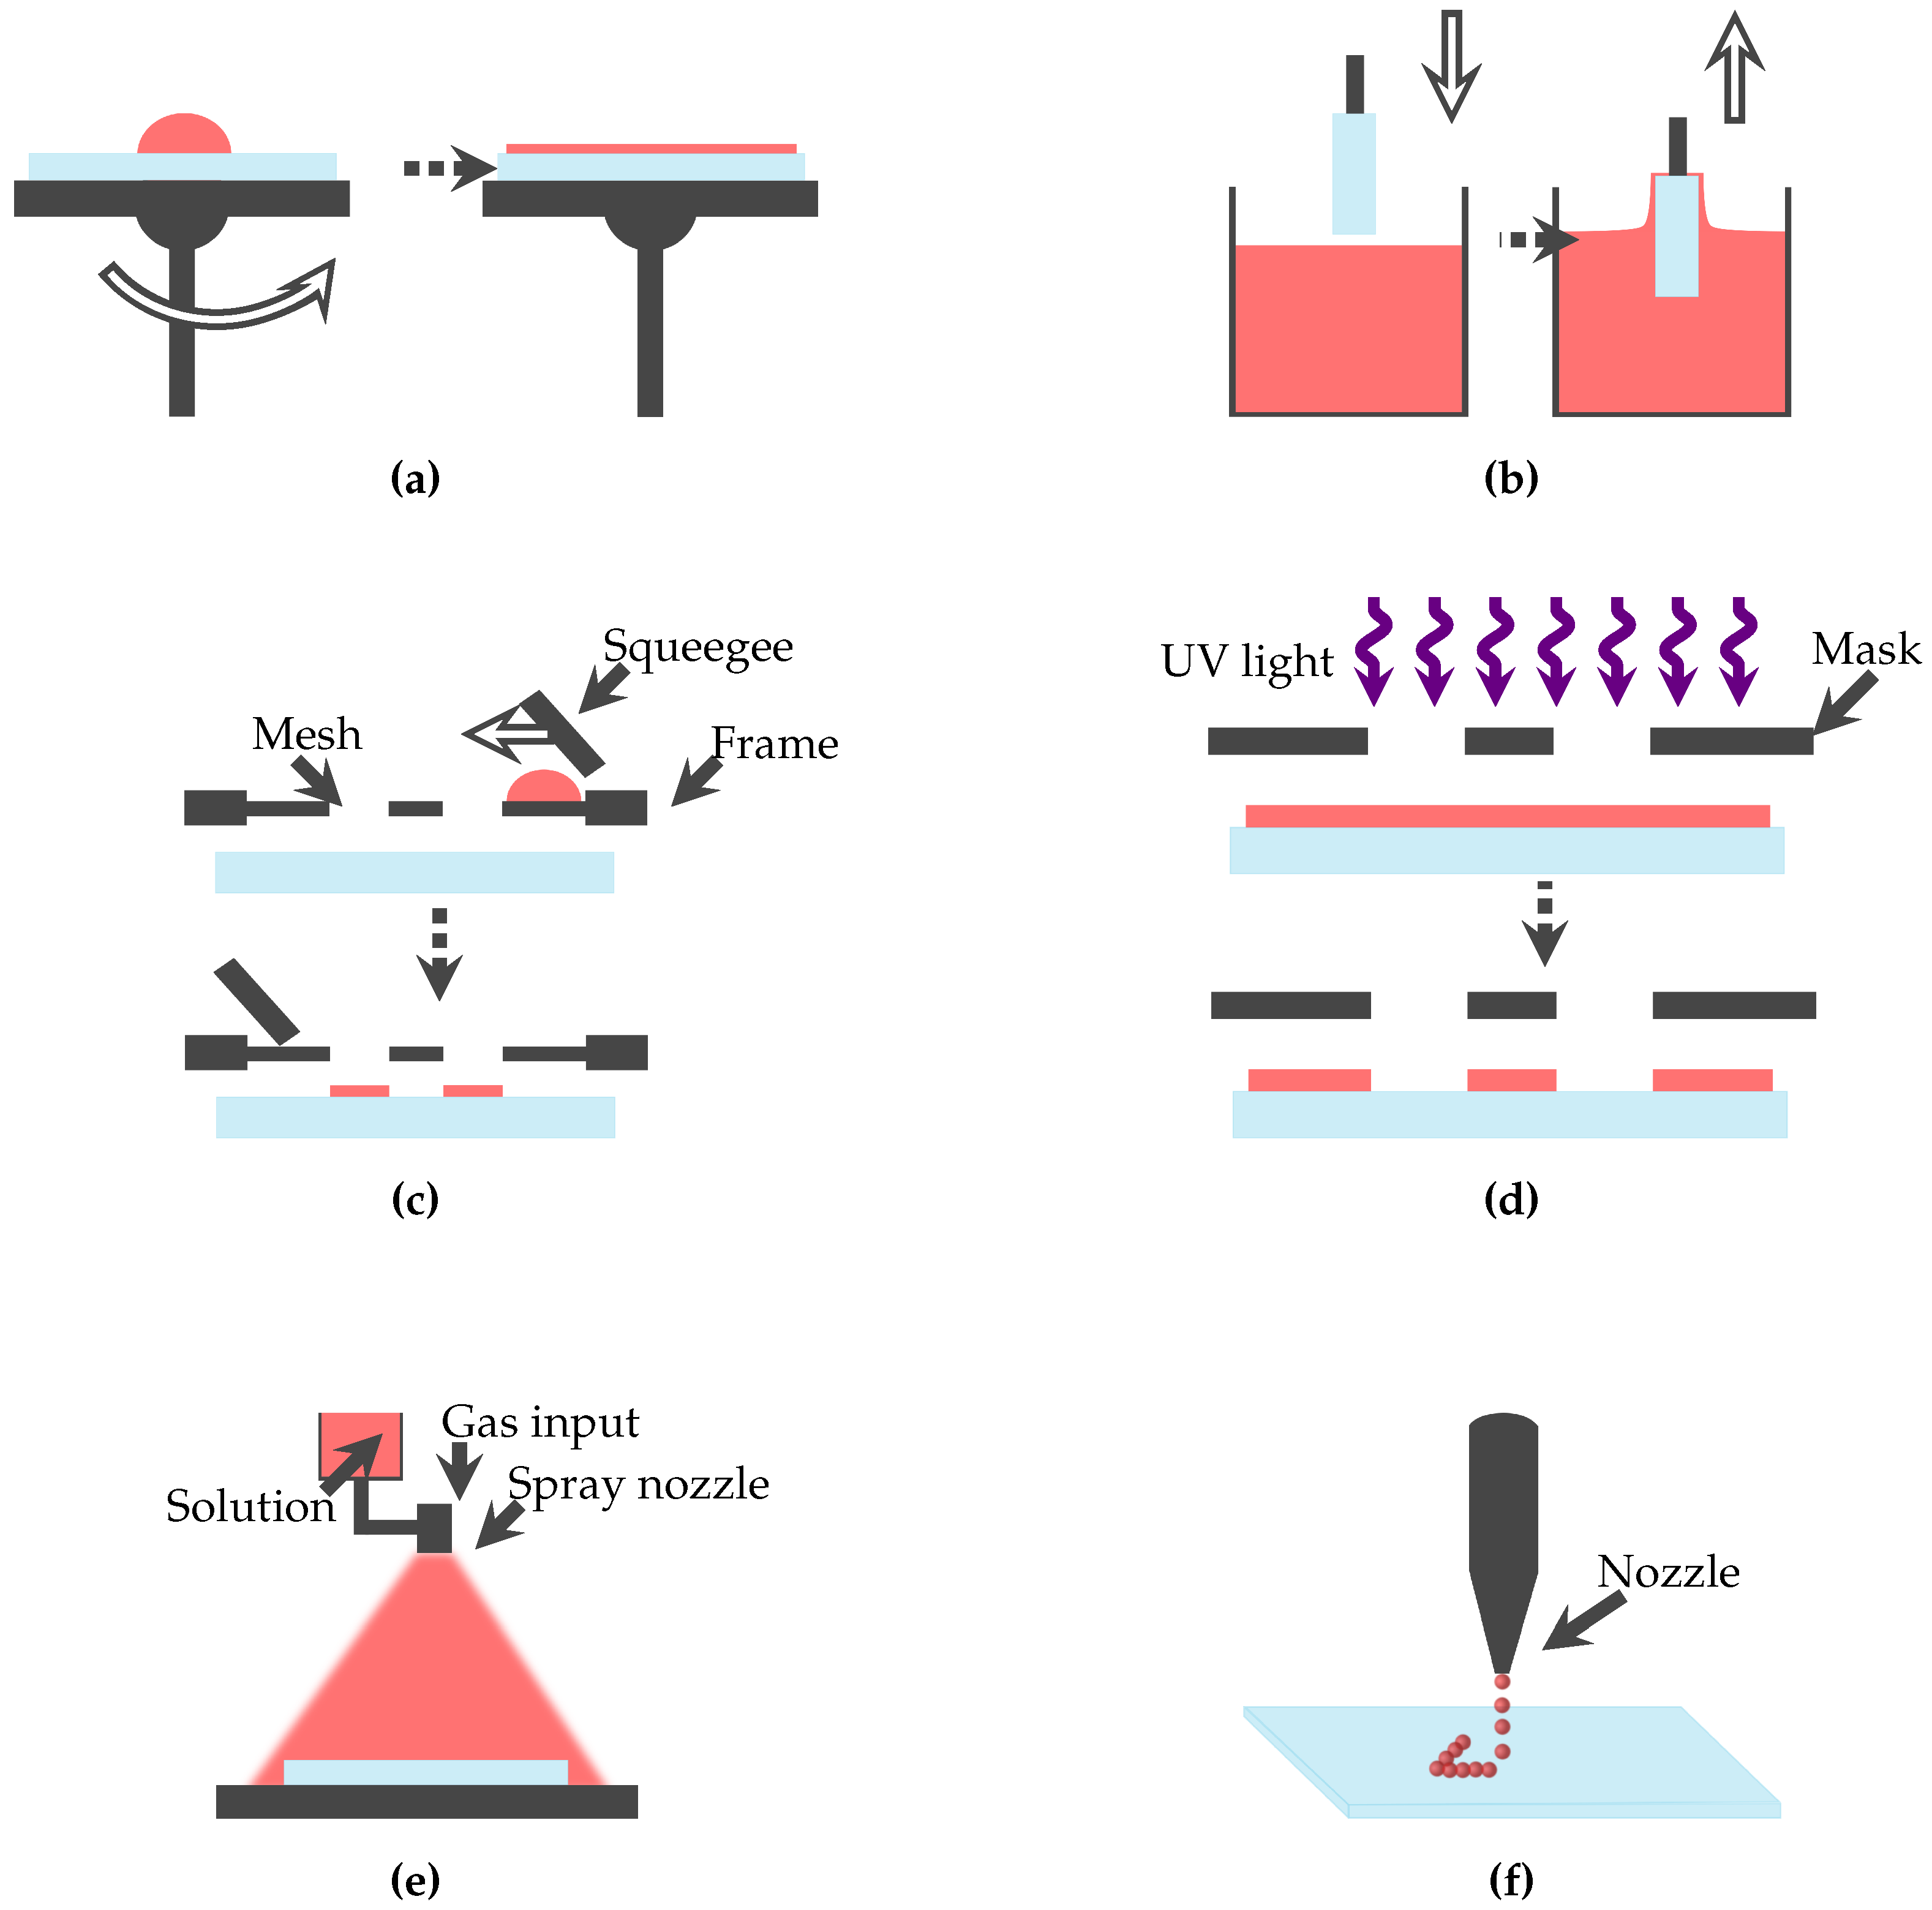
5. Fabrication Methods
6. Conclusions and Future Perspectives
Author Contributions
Funding
Conflicts of Interest
Abbreviations
| BDD | boron-doped diamond |
| CT | computer tomography |
| DNA | deoxyribonucleic acid |
| DPD | N,N-diethyl-p-phenylenediamine |
| EBOO | extracorporeal blood oxygenation and ozonation |
| LEDs | light emitting diodes |
| MW-LA-PECVD | microwave linear antenna plasma enhanced chemical vapour deposition |
| ppb | parts per billion |
| ppm | parts per million |
| PDMS | polydimethylsiloxane |
| PEI | polyetherimide |
| PES | polyethersulfone |
| PE | polyethylene |
| PEN | polyethylene naphthalate |
| PET | polyethylene terephthalate |
| PP | polypropylene |
| PTFE | polytetrafluoroethylene |
| PVC | polyvinyl chloride |
| PVDF | polyvinylidene difluoride |
| PTG | protein thiol groups |
| SWCNT | single-walled carbon nanotubes |
| TAS | total antioxidant status |
| TBAR | thiobarbituric acid reactants |
References
- Ambrósio, E.; Bloor, K.; MacPherson, H. Costs and Consequences of Acupuncture as a Treatment for Chronic Pain: A Systematic Review of Economic Evaluations Conducted Alongside Randomised Controlled Trials. Complement. Ther. Med. 2012, 20, 364–374. [Google Scholar] [CrossRef]
- Groenewald, C.B.; Essner, B.S.; Wright, D.; Fesinmeyer, M.D.; Palermo, T.M. The Economic Costs of Chronic Pain Among a Cohort of Treatment-Seeking Adolescents in the United States. J. Pain 2014, 15, 925–933. [Google Scholar] [CrossRef] [Green Version]
- Margolis, J.; Barron, J.J.; Grochulski, W.D. Health Care Resources and Costs for Treating Peripheral Artery Disease in a Managed Care Population: Results From Analysis of Administrative Claims Data. J. Manag. Care Pharm. 2005, 11, 727–734. [Google Scholar] [CrossRef]
- Gaskin, D.J.; Richard, P. The Economic Costs of Pain in the United States. J. Pain 2012, 13, 715–724. [Google Scholar] [CrossRef]
- De Andrade, R.R.; de Oliveira-Neto, O.B.; Barbosa, L.T.; Santos, I.O.; de Sousa-Rodrigues, C.F.; Barbosa, F.T. Effectiveness of Ozone Therapy Compared to Other Therapies for Low Back Pain: A Systematic Review with Meta-Analysis of Randomized Clinical Trials. Braz. J. Anesthesiol. 2019, 69, 493–501. [Google Scholar] [CrossRef]
- Klocke, R.; Levasseur, K.; Kitas, G.D.; Smith, J.P.; Hirsch, G. Cartilage Turnover and Intra-Articular Corticosteroid Injections in Knee Osteoarthritis. Rheumatol. Int. 2018, 38, 455–459. [Google Scholar] [CrossRef] [PubMed] [Green Version]
- Schoenherr, M.E.; Hollmann, M.W.; Graf, B. Lachgas. Der Anaesthesist 2004, 53, 796–812. [Google Scholar] [CrossRef]
- Brockow, T.; Heissner, T.; Franke, A.; Resch, K.L. Evaluation of the Efficacy of Subcutaneous Carbon Dioxide Insufflations for Treating Acute Non Specific Neck Pain in General Practice: A Sham Controlled Randomized Trial. Eur. J. Pain 2008, 12, 9–16. [Google Scholar] [CrossRef]
- Lehnert, T.; Naguib, N.N.; Wutzler, S.; Nour-Eldin, N.E.A.; Bauer, R.W.; Kerl, J.M.; Vogl, T.J.; Balzer, J.O. Analysis of Disk Volume Before and After CT-Guided lntradiscal and Periganglionic Ozone-Oxygen Injection for the Treatment of Lumbar Disk Herniation. J. Vasc. Interv. Radiol. 2012, 23, 1430–1436. [Google Scholar] [CrossRef] [PubMed]
- Di Paolo, N.; Bocci, V.; Salvo, D.; Palasciano, F.; Biagioli, M.; Meini, S.; Galli, F.; Ciari, I.; Maccari, F.; Cappeletti, F.; et al. Extracorporeal Blood Oxygenation and Ozonation (EBOO): A Controlled Trial in Patients with Peripheral Artery Disease. Int. J. Artif. Organs 2005, 28, 1039–1050. [Google Scholar] [CrossRef]
- Di Paolo, N.; Gaggiotti, E.; Galli, F. Extracorporeal Blood Oxygenation and Ozonation: Clinical and Biological Implications of Ozone Therapy. Redox Rep. Commun. Free Radic. Res. 2005, 10, 121–130. [Google Scholar] [CrossRef] [PubMed]
- Azarpazhooh, A.; Limeback, H. The Application of Ozone in Dentistry: A Systematic Review of Literature. J. Dent. 2008, 36, 104–116. [Google Scholar] [CrossRef] [PubMed]
- Zimmermann, D.; Waltimo, T.; Filippi, A. Ozonized Water in Dental Traumatology—A Preliminary Study on the Treatment of Avulsed Teeth, In Vitro. Ozone Sci. Eng. 2012, 34, 484–488. [Google Scholar] [CrossRef]
- Borrelli, E.; Alexandre, A.; Iliakis, E.; Alexandre, A.; Bocci, V. Disc Herniation and Knee Arthritis as Chronic Oxidative Stress Diseases: The Therapeutic Role of Oxygen Ozone Therapy. J. Arthritis 2015, 4, 161. [Google Scholar] [CrossRef]
- Roostan, M.; Frishman, W.H. Xenon: An Emerging Neuroprotectant with Potential Application for Cardiac Arrest Care. Cardiol. Rev. 2018, 26, 207–212. [Google Scholar] [CrossRef] [PubMed]
- Smith, N.L.; Wilson, A.L.; Gandhi, J.; Vatsia, S.; Khan, S.A. Ozone Therapy: An Overview of Pharmacodynamics, Current Research, and Clinical Utility. Med. Gas Res. 2017, 7, 212–219. [Google Scholar] [CrossRef] [PubMed] [Green Version]
- Sotelo, J.L.; Beltran, F.J.; Benitez, F.J.; Beltran-Heredia, J. Ozone Decomposition in Water: Kinetic Study. Ind. Eng. Chem. Res. 1987, 26, 39–43. [Google Scholar] [CrossRef]
- Bocci, V.; Zanardi, I.; Michaeli, D.; Travagli, V. Mechanisms of Action and Chemical-Biological Interactions Between Ozone and Body Compartments: A Critical Appraisal of the Different Administration Routes. Curr. Drug Ther. 2009, 4, 159–173. [Google Scholar] [CrossRef]
- Hepel, M.; Stobiecka, M.; Peachey, J.; Miller, J. Intervention of Glutathione in Pre-Mutagenic Catechol-Mediated DNA Damage in the Presence of Copper (II) Ions. Mutat. Res. Fundam. Mol. Mech. Mutagen. 2012, 735, 1–11. [Google Scholar] [CrossRef]
- Hakuna, L.; Doughan, B.; Escobedo, J.O.; Strongin, R.M. A Simple Assay for Glutathione in Whole Blood. Analyst 2015, 140, 3339–3342. [Google Scholar] [CrossRef] [Green Version]
- Stobiecka, M.; Hepel, M. Rapid Functionalization of Metal Nanoparticles by Moderator-Tunable Ligand-Exchange Process for Biosensor Designs. Sens. Actuators B Chem. 2010, 149, 373–380. [Google Scholar] [CrossRef]
- 2B Technologies. Model UV-106-W Aqueous Ozone Monitor. Available online: https://twobtech.com/model-uv-106-w-aqueous-ozone-monitor.html (accessed on 5 April 2020).
- Birks, J.W.; Xiong, B.; Ford, C.M.; Andersen, P.C.; Williford, C.J. Aqueous Ozone Monitor Utilizing Gas Stripping. U.S. Patent 9,423,340, 23 August 2016. [Google Scholar]
- Hu, C.; Bai, X.; Wang, Y.; Jin, W.; Zhang, X.; Hu, S. Inkjet Printing of Nanoporous Gold Electrode Arrays on Cellulose Membranes for High-Sensitive Paper-Like Electrochemical Oxygen Sensors Using Ionic Liquid Electrolytes. Anal. Chem. 2012, 84, 3745–3750. [Google Scholar] [CrossRef] [PubMed]
- Bakker, E.; Telting-Diaz, M. Electrochemical Sensors. Anal. Chem. 2002, 74, 2781–2800. [Google Scholar] [CrossRef] [PubMed]
- Joshi, N.; da Silva, L.F.; Shimizu, F.M.; Mastelaro, V.R.; M’Peko, J.C.; Lin, L.; Oliveira, O.N. UV-Assisted Chemiresistors Made with Gold-Modified ZnO Nanorods to Detect Ozone Gas at Room Temperature. Microchim. Acta 2019, 186, 418. [Google Scholar] [CrossRef] [PubMed]
- Sieber, I.; Gengenbach, U. Design and Optimization of Optical Gas Sensor Systems. In Chemical Sensors—Simulation and Modelling Volume 4: Optical Senosrs; Korotcenkov, G., Watson, J., Eds.; Momentum Press: New York, NY, USA, 2013; Chapter 11; pp. 405–453. [Google Scholar] [CrossRef]
- Burrows, J.; Richter, A.; Dehn, A.; Deters, B.; Himmelmann, S.; Voigt, S.; Orphal, J. Atmospheric Remote-Sensing Reference Data From GOME—2. Temperature-Dependent Absorption Cross Sections of O3 in the 231–794 nm Range. J. Quant. Spectrosc. Radiat. Transf. 1999, 61, 509–517. [Google Scholar] [CrossRef]
- Wang, C. Metal Organic Chemical Vapor Deposition of Indium Oxide for Ozone Sensing. Ph.D. Thesis, Albert Ludwig University, Freiburg, Germany, 6 February 2009. [Google Scholar]
- Newnham, D.A.; Ballard, J. Visible Absorption Cross Sections and Integrated Absorption Intensities of Molecular Oxygen (O2 and O4). J. Geophys. Res. Atmos. 1998, 103, 28801–28815. [Google Scholar] [CrossRef]
- Ando, M.; Kamimura, T.; Uegaki, K.; Biju, V.; Shigeri, Y. Sensing of Ozone Based on its Quenching Effect on the Photoluminescence of CdSe-Based Core-Shell Quantum Dots. Microchim. Acta 2016, 183, 3019–3024. [Google Scholar] [CrossRef]
- Chen, E.C.; Pisarenko, A.N.; Kolakovsky, A.; Howe, E.W.; Trussell, R.S.; Trussell, R.R. Evaluation of Four Dissolved Ozone Residual Meters Performance and Disinfection Credits in Potable Reuse Applications. Ozone Sci. Eng. 2020. [Google Scholar] [CrossRef]
- Chasanah, U.; Yulianto, E.; Zain, A.Z.; Sasmita, E.; Restiwijaya, M.; Kinandana, A.W.; Arianto, F.; Nur, M. Evaluation of Titration Method on Determination of Ozone Concentration Produced by Dielectric Barrier Discharge Plasma (DBDP) Technology. J. Phys. Conf. Ser. 2019, 1153, 012086. [Google Scholar] [CrossRef]
- Duvall, R.M.; Long, R.W.; Beaver, M.R.; Kronmiller, K.G.; Wheeler, M.L.; Szykman, J.J. Performance Evaluation and Community Application of Low-Cost Sensors for Ozone and Nitrogen Dioxide. Sensors 2016, 16, 1698. [Google Scholar] [CrossRef]
- ENVEA Cairpol. Technical Document: Cairsens O3/NO2 Sensor. Available online: http://www.cairpol.com/wp-content/uploads/2017/05/Cairsens-O3NO2-0-250ppb-Technical-specifications.pdf (accessed on 31 March 2020).
- Pang, X.; Shaw, M.D.; Lewis, A.C.; Carpenter, L.J.; Batchellier, T. Electrochemical Ozone Sensors: A Miniaturised Alternative for Ozone Measurements in Laboratory Experiments and Air-Quality Monitoring. Sens. Actuators B Chem. 2017, 240, 829–837. [Google Scholar] [CrossRef] [Green Version]
- Stetter, J.R.; Patel, V.; Findlay, M.W.; Carter, M.T. Printed Gas Sensor. U.S. Patent 9,784,708, 10 October 2017. [Google Scholar]
- SPEC Sensors. Technical Document: Ozone Sensor. Available online: https://www.spec-sensors.com/product/ozone-gas-sensor-developer-kit/ (accessed on 10 March 2020).
- Srinives, S.; Sarkar, T.; Hernandez, R.; Mulchandani, A. Potassium Iodide-Functionalized Polyaniline Nanothin Film Chemiresistor for Ultrasensitive Ozone Gas Sensing. Polymers 2017, 9, 80. [Google Scholar] [CrossRef] [Green Version]
- Schenk, E.H.; Burke, P.A.; Centanni, M.A. Amperometric Gas Sensor. U.S. Patent 10,001,455, 19 June 2018. [Google Scholar]
- Hach. User Manual: Orbisphere C1100 Ozone Sensor. Available online: https://uk.hach.com/orbisphere-c1100-ozone-sensor-stainless-steel-up-to-40-bar/product-downloads?id=26369768223 (accessed on 7 April 2020).
- Kuntze Instruments GmbH. O3/M-5. Available online: https://www.kuntze.com/de/gas-sensor-fuer-ozon (accessed on 17 March 2020).
- Rocha, L.S.R.; Foschini, C.R.; Silva, C.C.; Longo, E.; Simões, A.Z. Novel Ozone Gas Sensor Based on ZnO Nanostructures Grown by the Microwave-Assisted Hydrothermal Route. Ceram. Int. 2016, 42, 4539–4545. [Google Scholar] [CrossRef] [Green Version]
- Catto, A.C.; Silva, L.F.d.; Bernardi, M.I.B.; Bernardini, S.; Aguir, K.; Longo, E.; Mastelaro, V.R. Local Structure and Surface Properties of CoxZn1−xO Thin Films for Ozone Gas Sensing. ACS Appl. Mater. Interfaces 2016, 8, 26066–26072. [Google Scholar] [CrossRef] [PubMed]
- Joshi, N.; Shimizu, F.M.; Awan, I.T.; M’Peko, J.C.; Mastelaro, V.R.; Oliveira, O.N.; da Silva, L.F. Ozone Sensing Properties of Nickel Phthalocyanine: ZnO Nanorod Heterostructures. In Proceedings of the IEEE SENSORS Conference, Orlando, FL, USA, 30 October–3 November 2016; pp. 1–3. [Google Scholar] [CrossRef] [Green Version]
- Joshi, N.; da Silva, L.F.; Jadhav, H.; M’Peko, J.C.; Torres, B.B.M.; Aguir, K.; Mastelaro, V.R.; Oliveira, O.N. One-Step Approach for Preparing Ozone Gas Sensors Based on Hierarchical NiCo2O4 Structures. R. Soc. Chem. 2016, 6, 92655–92662. [Google Scholar] [CrossRef] [Green Version]
- Spinelle, L.; Gerboles, M.; Aleixandre, M.; Bonavitacola, F. Evaluation of Metal Oxide Sensors for the Monitoring of O3 in Ambient Air at Pbp Level. Ital. Assoc. Chem. Eng. 2016, 54, 319–324. [Google Scholar] [CrossRef]
- Kang, G.; Zhu, Z.; Tang, B.H.; Wu, C.H.; Wu, R.J. Rapid Detection of Ozone in the Parts per Billion Range Using a Novel Ni–Al Layered Double Hydroxide. Sens. Actuators B Chem. 2017, 241, 1203–1209. [Google Scholar] [CrossRef]
- Mueller, M.; Meyer, J.; Hueglin, C. Design of an Ozone and Nitrogen Dioxide Sensor Unit and its Long-Term Operation Within a Sensor Network in the City of Zurich. Atmos. Meas. Tech. 2017, 10, 3783. [Google Scholar] [CrossRef] [Green Version]
- Aeroqual Limited. SM50 OZU. Available online: http://www.himaxtech.net/product/pdf/AQL%20Sensor%20Head%20Specifications.pdf (accessed on 18 March 2020).
- da Silva, L.F.; M’Peko, J.C.; Catto, A.C.; Bernardini, S.; Mastelaro, V.R.; Aguir, K.; Ribeiro, C.; Longo, E. UV-Enhanced Ozone Gas Sensing Response of ZnO-SnO2 Heterojunctions at Room Temperature. Sens. Actuators B Chem. 2017, 240, 573–579. [Google Scholar] [CrossRef] [Green Version]
- Addanki, S.; Nedumaran, D. Fabrication of Ozone Sensors on Porous Glass Substrates Using Gold and Silver Thin Films Nanoislands. Optik 2017, 150, 11–21. [Google Scholar] [CrossRef]
- Ziegler, D.; Marchisio, A.; Palmero, P.; Tulliani, J.M. WO3-Doped Indium Oxide Thick Films for Ozone Detection at Low Temperature. In Proceedings of the Eurosensors Conference, Paris, France, 3–6 September 2017; p. 428. [Google Scholar] [CrossRef] [Green Version]
- Bernardini, S.; Benchekroun, M.H.; Fiorido, T.; Aguir, K.; Bendahan, M.; Dkhil, S.B.; Gaceur, M.; Ackermann, J.; Margeat, O.; Videlot-Ackermann, C. Ozone Sensors Working at Room Temperature Using Zinc Oxide Nanocrystals Annealed at Low Temperature. In Proceedings of the Eurosensors Conference, Paris, France, 3–6 September 2017; p. 423. [Google Scholar] [CrossRef] [Green Version]
- Peterson, P.J.D.; Aujla, A.; Grant, K.H.; Brundle, A.G.; Thompson, M.R.; Vande Hey, J.; Leigh, R.J. Practical Use of Metal Oxide Semiconductor Gas Sensors for Measuring Nitrogen Dioxide and Ozone in Urban Environments. Sensors 2017, 17, 1653. [Google Scholar] [CrossRef] [PubMed]
- SGX Sensortech. Technical Document: MiCS-2614 MOS Sensor. Available online: https://www.sgxsensortech.com/content/uploads/2014/08/1087_Datasheet-MiCS-2614.pdf (accessed on 10 March 2020).
- Partoll, E.; Kofler, L.; Fuchs, L.; Canaval, E.; Duensing, F.; Fischer, L.; Winkler, J.B.; Schnitzler, J.P.; Schnitzhofer, R.; Hansel, A. Development of a Sensing System and Measurement Network for Monitoring the Spatial Distribution of Ozone in an Alpine Valley. In Proceedings of the International Conference on Proton Transfer Reaction Mass Spectrometry and Its Applications, Innsbruck, Austria, 4–8 February 2019; pp. 242–245. [Google Scholar]
- Huang, J.; Wang, X.; Gong, Y.; Liu, Y.; Zhou, P.; Suo, X.; Zeng, D.; Li, H. Construction of WO3 Coatings with Micro-Nano Hybrid Structures by Liquid Precursor Flame Spray for Enhanced Sensing Performances to Sub-Ppm Ozone. Mater. Lett. 2017, 205, 106–109. [Google Scholar] [CrossRef]
- Wu, C.H.; Jiang, G.J.; Chang, K.W.; Deng, Z.Y.; Li, Y.N.; Chen, K.L.; Jeng, C.C. Analysis of the Sensing Properties of a Highly Stable and Reproducible Ozone Gas Sensor Based on Amorphous In-Ga-Zn-O Thin Film. Sensors 2018, 18, 163. [Google Scholar] [CrossRef] [PubMed] [Green Version]
- Catto, A.C.; Fiorido, T.; Souza, É.L.; Avansi, W.; Andres, J.; Aguir, K.; Longo, E.; Cavalcante, L.S.; da Silva, L.F. Improving the Ozone Gas-Sensing Properties of CuWO4 Nanoparticles. J. Alloys Compd. 2018, 748, 411–417. [Google Scholar] [CrossRef] [Green Version]
- Tsai, Y.T.; Chang, S.J.; Tang, I.T.; Hsiao, Y.J.; Ji, L.W. High Density Novel Porous ZnO Nanosheets Based on a Microheater Chip for Ozone Sensors. IEEE Sens. J. 2018, 18, 5559–5565. [Google Scholar] [CrossRef]
- Ziegler, D.; Bekyarova, E.; Marchisio, A.; Tulliani, J.M.; Naishadham, K. Highly Selective Ozone Sensors Based on Functionalized Carbon Nanotubes. In Proceedings of the IEEE SENSORS Conference, New Dehli, India, 28–31 October 2018; pp. 1–4. [Google Scholar] [CrossRef]
- Ziegler, D.; Bekyarova, E.; Naishadham, G.; Savi, P.; Marchisio, A.; Tulliani, J.M.; Naishadham, K. Nanotechnology-Based Ozone Sensors Exploiting Low-Frequency Impedance Changes for Detection. In Proceedings of the International Meeting on Chemical Sensors, Vienna, Italy, 15–19 July 2018; pp. 740–741. [Google Scholar] [CrossRef]
- Kakavelakis, G.; Gagaoudakis, E.; Petridis, K.; Petromichelaki, V.; Binas, V.; Kiriakidis, G.; Kymakis, E. Solution Processed CH3NH3PbI3−xClx Perovskite Based Self-Powered Ozone Sensing Element Operated at Room Temperature. ACS Sens. 2018, 3, 135–142. [Google Scholar] [CrossRef] [Green Version]
- Wu, C.H.; Chou, T.L.; Wu, R.J. Rapid Detection of Trace Ozone in TiO2-In2O3 Materials by Using the Differential Method. Sens. Actuators B Chem. 2018, 255, 117–124. [Google Scholar] [CrossRef]
- Avansi, W.; Catto, A.C.; da Silva, L.F.; Fiorido, T.; Bernardini, S.; Mastelaro, V.R.; Aguir, K.; Arenal, R. One-Dimensional V2O5/TiO2 Heterostructures for Chemiresistive Ozone Sensors. ACS Appl. Nano Mater. 2019, 2, 4756–4764. [Google Scholar] [CrossRef]
- Lo, T.H.; Shih, P.Y.; Wu, C.H. The Response of UV/Blue Light and Ozone Sensing Using Ag-TiO2 Planar Nanocomposite Thin Film. Sensors 2019, 19, 5061. [Google Scholar] [CrossRef] [Green Version]
- Onofre, Y.J.; Catto, A.C.; Bernardini, S.; Fiorido, T.; Aguir, K.; Longo, E.; Mastelaro, V.R.; da Silva, L.F.; de Godoy, M.P. Highly Selective Ozone Gas Sensor Based on Nanocrystalline Zn0.95Co0.05O Thin Film Obtained Via Spray Pyrolysis Technique. Appl. Surf. Sci. 2019, 478, 347–354. [Google Scholar] [CrossRef]
- Sui, Y.; Liang, H.; Chen, Q.; Huo, W.; Du, X.; Mei, Z. Room-Temperature Ozone Sensing Capability of IGZO-Decorated Amorphous Ga2O3 Films. ACS Appl. Mater. Interfaces 2020, 12, 8929–8934. [Google Scholar] [CrossRef]
- Jayachandiran, J.; Arivanandhan, M.; Padmaraj, O.; Jayavel, R.; Nedumaran, D. Investigation on Ozone-Sensing Characteristics of Surface Sensitive Hybrid rGO/WO3 Nanocomposite Films at Ambient Temperature. Adv. Compos. Hybrid Mater. 2020, 3, 16–30. [Google Scholar] [CrossRef]
- Izumi, K.; Utiyama, M.; Maruo, Y.Y. A Porous Glass-Based Ozone Sensing Chip Impregnated with Potassium Iodide and α-Cyclodextrin. Sens. Actuators B Chem. 2017, 241, 116–122. [Google Scholar] [CrossRef]
- Bilenko, Y.; Dobrinsky, A.; Shur, M.; Gaska, R. Ultraviolet-Based Ozone Sensor. U.S. Patent 9,625,372, 18 April 2017. [Google Scholar]
- Jayachandiran, J.; Raja, A.; Arivanandhan, M.; Jayavel, R.; Nedumaran, D. A Facile Synthesis of Hybrid Nanocomposites of Reduced Graphene Oxide/ZnO and its Surface Modification Characteristics for Ozone Sensing. J. Mater. Sci. Mater. Electron. 2018, 29, 3074–3086. [Google Scholar] [CrossRef]
- Ghazaly, C.; Guillemot, M.; Castel, B.; Langlois, E.; Etienne, M.; Hebrant, M. Real-Time Optical Ozone Sensor for Occupational Exposure Assessment. In Proceedings of the International Conference on Solid-State Sensors, Actuators and Microsystems & Eurosensors XXXIII, Berlin, Germany, 23–27 June 2019; pp. 1403–1406. [Google Scholar] [CrossRef]
- Korotcenkov, G.; Brinzari, V.; Cho, B.K. In2O3- and SnO2-Based Ozone Sensors: Design and Characterization. Crit. Rev. Solid State Mater. Sci. 2018, 43, 83–132. [Google Scholar] [CrossRef]
- Sauter, D.; Weimar, U.; Noetzel, G.; Mitrovics, J.; Göpel, W. Development of Modular Ozone Sensor System for Application in Practical Use. Sens. Actuators B Chem. 2000, 69, 1–9. [Google Scholar] [CrossRef]
- Penza, M.; Cassano, G.; Tortorella, F. Gas Recognition by Activated WO3 Thin-Film Sensors Array. Sens. Actuators B Chem. 2001, 81, 115–121. [Google Scholar] [CrossRef]
- Belysheva, T.; Bogovtseva, L.; Gutman, E. Application of Semiconductor Metal Oxide Heterosystems for Gas Analysis. Int. Sci. J. Altern. Energy Ecol. 2003, 122, 122. [Google Scholar]
- Einaga, Y.; Tribidasarianggraningrum, I.; Ishii, Y.; Sekiguchi, S.; Murata, K. Ozone Water Concentration Measurement Apparatus and Ozone Water Concentration Measurement Method. U.S. Patent 9,625,405, 18 April 2017. [Google Scholar]
- Ishii, Y.; Ivandini, T.A.; Murata, K.; Einaga, Y. Development of Electrolyte-Free Ozone Sensors Using Boron-Doped Diamond Electrodes. Anal. Chem. 2013, 85, 4284–4288. [Google Scholar] [CrossRef]
- Kuntze Instruments GmbH. Kuntze Krypton Dis. Available online: https://www.kuntze.com/de/download (accessed on 5 April 2020).
- Emerson Electric Co. Rosemount 499AOZ Amperometric Ozone Sensor. Available online: https://www.emerson.com/de-de/catalog/rosemount-sku-499aoz-amperometric-ozone-sensor-de-de (accessed on 5 April 2020).
- JUMO GmbH & Co. KG. JUMO TecLine ClO2 and O3. Available online: https://www.jumo.de/web/products/apps/productdetailpage?pdpId=202634 (accessed on 17 March 2020).
- Process Instruments Pi. OzoSense Residual Ozone Analyser—Data Sheet. Available online: https://www.processinstruments.co.uk/wp-content/uploads/ISB34-OzoSense.pdf (accessed on 17 March 2020).
- Analytical Technology, Inc. Dissolved Ozone Monitor Model Q46H/64—Data Sheet. Available online: https://www.analyticaltechnology.com/sys/docs/2096/ATI_Q46-64%20Dissolved%20Ozone%20Monitor.pdf (accessed on 17 March 2020).
- Thermo Fisher Scientific. AquaSensorsTMAnalogPlusTM Sensor. Available online: https://www.thermofisher.com/order/catalog/product/ASAPOZNE#/ASAPOZNE (accessed on 17 March 2020).
- METTLER TOLEDO. Sensor Pure O3. Available online: https://www.mt.com/de/de/home/products/Process-Analytics/DO-CO2-ozone-sensor/dissolved-O3-meter/pureO3-ISM.html#documents (accessed on 17 March 2020).
- Eco Sensors. DO3—Data Sheet. Available online: http://www.spectrex.com/html_files2/pdf/Pocket%20Ozone%20DO3%20r1%200%20Manual%201-3-09.pdf (accessed on 17 March 2020).
- Oh, J.S.; Yajima, H.; Hashida, K.; Ono, T.; Ishijima, T.; Serizawa, I.; Furuta, H.; Hatta, A. In-Situ UV Absorption Spectroscopy for Observing Dissolved Ozone in Water. J. Photopolym. Sci. Technol. 2016, 29, 427–432. [Google Scholar] [CrossRef] [Green Version]
- Spiliotopoulou, A.; Martin, R.; Pedersen, L.F.; Andersen, H.R. Use of Fluorescence Spectroscopy to Control Ozone Dosage in Recirculating Aquaculture Systems. Water Res. 2017, 111, 357–365. [Google Scholar] [CrossRef] [Green Version]
- Teledyne API. Model 470. Available online: http://www.teledyne-api.com/products/dissolved-ozone-instruments/470 (accessed on 17 March 2020).
- Janknecht, P.; Picard, C.; Larbot, A.; Wilderer, P.A. Membrane Ozonation in Wastewater Treatment. Acta Hydrochim. Hydrobiol. 2004, 32, 33–39. [Google Scholar] [CrossRef]
- Zoumpouli, G.; Baker, R.; Taylor, C.; Chippendale, M.; Smithers, C.; Xian, S.; Mattia, D.; Chew, Y.; Wenk, J. A Single Tube Contactor for Testing Membrane Ozonation. Water 2018, 10, 1416. [Google Scholar] [CrossRef] [Green Version]
- Shanbhag, P.V.; Sirkar, K.K. Ozone and Oxygen Permeation Behavior of Silicone Capillary Membranes Employed in Membrane Ozonators. J. Appl. Polym. Sci. 1998, 69, 1263–1273. [Google Scholar] [CrossRef]
- Zhang, H.; Cloud, A. The Permeability Characteristics of Silicone Rubber. In Proceedings of the SAMPE Fall Technical Conference, Dallas, TX, USA, 6–9 November 2006. [Google Scholar]
- Levine, S.; Seiwert, J.; Lohr, J.; Brammer, U.; Fittkau, J. Ozone Concentration Sensor. U.S. Patent 7,502,114, 10 March 2009. [Google Scholar]
- Erel, O. A Novel Automated Direct Measurement Method for Total Antioxidant Capacity Using a New Generation, More Stable ABTS Radical Cation. Clin. Biochem. 2004, 37, 277–285. [Google Scholar] [CrossRef] [PubMed]
- Kampa, M.; Nistikaki, A.; Tsaousis, V.; Maliaraki, N.; Notas, G.; Castanas, E. A New Automated Method for the Determination of the Total Antioxidant Capacity (TAC) of Human Plasma, Based on the Crocin Bleaching Assay. BMC Clin. Pathol. 2002, 2, 3. [Google Scholar] [CrossRef] [PubMed] [Green Version]
- Guth, U.; Vonau, W.; Zosel, J. Recent Developments in Electrochemical Sensor Application and Technology—A Review. Meas. Sci. Technol. 2009, 20, 042002. [Google Scholar] [CrossRef]
- Jadhav, H.S.; Kalubarme, R.S.; Park, C.N.; Kim, J.; Park, C.J. Facile and Cost Effective Synthesis of Mesoporous Spinel NiCo2O4 as an Anode for High Lithium Storage Capacity. Nanoscale 2014, 6, 10071–10076. [Google Scholar] [CrossRef]
- Koker, L.; Mansour, M.; Ungerer, M.; Reichert, K.M.; Stiller, P.; Gengenbach, U. Potential and Challenges of Inkjet-Printing for Wearable Medical Devices. In Proceedings of the Conference for Biomedical Engineering, Frankfurt, Germany, 25–26 September 2019. [Google Scholar]
- Gengenbach, U.; Ungerer, M.; Koker, L.; Reichert, K.M.; Stiller, P.; Huang, C.; Hagenmeyer, V. Automated Fabrication of Multi-Layer Printed Electronic Circuits Using a Novel Vector Ink-Jet Printing Process Control and Surface Mounting of Discrete Components. IFAC-PapersOnLine 2019, 52, 609–614. [Google Scholar] [CrossRef]
- Kim, S.; Won, S.; Sim, G.D.; Park, I.; Lee, S.B. Tensile Characteristics of Metal Nanoparticle Films on Flexible Polymer Substrates for Printed Electronics Applications. Nanotechnology 2013, 24, 085701. [Google Scholar] [CrossRef]
- Xu, Z.; Dong, Q.; Otieno, B.; Liu, Y.; Williams, I.; Cai, D.; Li, Y.; Lei, Y.; Li, B. Real-Time in Situ Sensing of Multiple Water Quality Related Parameters Using Micro-Electrode Array (MEA) Fabricated by Inkjet-Printing Technology (IPT). Sens. Actuators B Chem. 2016, 237, 1108–1119. [Google Scholar] [CrossRef]
- Moya, A.; Ortega-Ribera, M.; Guimerà, X.; Sowade, E.; Zea, M.; Illa, X.; Ramon, E.; Villa, R.; Gracia-Sancho, J.; Gabriel, G. Online Oxygen Monitoring Using Integrated Inkjet-Printed Sensors in a Liver-On-A-Chip System. Lab Chip 2018, 18, 2023–2035. [Google Scholar] [CrossRef] [PubMed] [Green Version]
- Moya, A.; Pol, R.; Martínez-Cuadrado, A.; Villa, R.; Gabriel, G.; Baeza, M. Stable Full-Inkjet- Printed Solid-State Ag/AgCl Reference Electrode. Anal. Chem. 2019, 91, 15539–15546. [Google Scholar] [CrossRef] [PubMed]
- Wu, J.; Roberts, R.C.; Tien, N.C.; Li, D. Inkjet Printed Silver Patterning on PDMS to Fabricate Microelectrodes for Microfluidic Sensing. In Proceedings of the IEEE SENSROS Conference, Valencia, Spain, 2–5 November 2014; pp. 1100–1103. [Google Scholar] [CrossRef]
- Laposa, A.; Kroutil, J.; Davydova, M.; Taylor, A.; Voves, J.; Klimsa, L.; Kopecek, J.; Husak, M. Inkjet Seeded CVD-Grown Hydrogenated Diamond Gas Sensor Under UV-LED Illumination. IEEE Sens. J. 2019, 20, 1. [Google Scholar] [CrossRef]
- Rieu, M.; Camara, M.; Tournier, G.; Viricelle, J.P.; Pijolat, C.; de Rooij, N.F.; Briand, D. Fully Inkjet Printed SnO2 Gas Sensor on Plastic Substrate. Sens. Actuators B Chem. 2016, 236, 1091–1097. [Google Scholar] [CrossRef] [Green Version]
- Kassem, O.; Saadaoui, M.; Rieu, M.; Sao-Joao, S.; Viricelle, J.P. Synthesis and Inkjet Printing of Sol-Gel Derived Tin Oxide Ink for Flexible Gas Sensing Application. J. Mater. Sci. 2018, 53, 12750–12761. [Google Scholar] [CrossRef]
- Spinella, N.; Galati, C.; Renna, L. Inkjet Printing of Controlled ZnO Nanoparticles Layering. J. Mater. Appl. 2019, 8, 34–40. [Google Scholar] [CrossRef]
- Leppäniemi, J.; Eiroma, K.; Majumdar, H.; Alastalo, A. Far-UV Annealed Inkjet-Printed In2O3 Semiconductor Layers for Thin-Film Transistors on a Flexible Polyethylene Naphthalate Substrate. ACS Appl. Mater. Interfaces 2017, 9, 8774–8782. [Google Scholar] [CrossRef] [Green Version]
- Hassan, B.; Liang, Y.; Yong, J.; Yu, Y.; Ganesan, K.; Walla, A.; Evans, R.; Chana, G.; Nasr, B.; Skafidas, E. Facile Fabrication of an Electrolyte-Gated In2O3 Nanoparticle-Based Thin-Film Transistor Uniting Laser Ablation and Inkjet Printing. Flex. Print. Electron. 2018, 3, 042001. [Google Scholar] [CrossRef]
- Hong, S.; Shin, J.; Hong, Y.; Wu, M.; Jeong, Y.; Jang, D.; Jung, G.; Bae, J.H.; Lee, J.H. Humidity-Sensitive Field Effect Transistor with In2O3 Nanoparticles as a Sensing Layer. J. Nanosci. Nanotechnol. 2019, 19, 6656–6662. [Google Scholar] [CrossRef]
- Kim, B.; Geier, M.L.; Hersam, M.C.; Dodabalapur, A. Inkjet Printed Circuits Based on Ambipolar and P-Type Carbon Nanotube Thin-Film Transistors. Sci. Rep. 2017, 7, 39627. [Google Scholar] [CrossRef] [PubMed]
- Tran, V.T.; Wei, Y.; Yang, H.; Zhan, Z.; Du, H. All-Inkjet-Printed Flexible ZnO Micro Photodetector for a Wearable UV Monitoring Device. Nanotechnology 2017, 28, 095204. [Google Scholar] [CrossRef] [PubMed]
- Kaufhold, R.; Baeuscher, M.; Wang, B.; Mackowiak, P.; Ehrmann, O.; Schneider-Ramelow, M.; Lang, K.; Ngo, H. An All-Inkjet Printed Photosensor on Flexible Plastic Substrate for the Detection of Ultraviolet Radiation. In Proceedings of the International Conference and Exhibition on Integration Issues of Miniaturized Systems, Barcelona, Spain, 10–11 April 2019; pp. 126–133. [Google Scholar]
- Nahlik, J.; Laposa, A.; Voves, J.; Kroutil, J.; Drahokoupil, J.; Davydova, M. A High Sensitivity UV Photodetector with Inkjet Printed ZnO/Nanodiamond Active Layers. IEEE Sens. J. 2019, 19, 5587–5593. [Google Scholar] [CrossRef]
- Figueira, J.; Gaspar, C.; Carvalho, J.T.; Loureiro, J.; Fortunato, E.; Martins, R.; Pereira, L. Sustainable Fully Printed UV Sensors on Cork Using Zinc Oxide/Ethylcellulose Inks. Micromachines 2019, 10, 601. [Google Scholar] [CrossRef] [Green Version]
- Zhan, Z.; An, J.; Wei, Y.; van Tran, T.; Du, H. Inkjet-Printed Optoelectronics. Nanoscale 2017, 9, 965–993. [Google Scholar] [CrossRef]
- Han, T.; Yuan, Y.; Liang, X.; Zhang, Y.; Xiong, C.; Dong, L. Colloidal Stable Quantum Dots Modified by Dual Functional Group Polymers for Inkjet Printing. J. Mater. Chem. C 2017, 5, 4629–4635. [Google Scholar] [CrossRef]
- Pan, Y.; Zhang, W.; Zhang, S.; Liu, Z.; Xue, L.; Gao, Y.; Wang, J.; Chen, Y.; Li, L. Inkjet Printing of Water-Soluble Quantum Dots. In Advanced Graphic Communication, Printing and Packaging Technology; Zhao, P., Ye, Z., Xu, M., Yang, L., Eds.; Springer Nature: Singapore, 2020; pp. 296–303. [Google Scholar] [CrossRef]
- David, M.; Ibrahim, M.H.; Mahdaliza Idrus, S.; En Marcus, T.C. Fundamental Review to Ozone Gas Sensing Using Optical Fibre Sensors. Telkomnika 2015, 13, 1133–1144. [Google Scholar] [CrossRef] [Green Version]
- David, M.; Ibrahim, M.H.; Idrus, S.M.; Azmi, A.I.; Ngajikin, N.H.; En Marcus, T.C.; Yaacob, M.; Salim, M.R.; Abdul Aziz, A. Progress in Ozone Sensors Performance: A Review. J. Teknol. 2015, 73. [Google Scholar] [CrossRef] [Green Version]
- Moya, A.; Gabriel, G.; Villa, R.; Javier del Campo, F. Inkjet-Printed Electrochemical Sensors. Curr. Opin. Electrochem. 2017, 3, 29–39. [Google Scholar] [CrossRef]


| Measurement Method | Sensing Unit | Ozone (Dissolved/Gas) | TMeasurement [°C] | tResponse | Range of Typical Wavelengths |
|---|---|---|---|---|---|
| amperometric | electrodes | gas | −30 to 90 | 15 s to 3 min | NA |
| electrodes | dissolved | −5 to 50 | 15 s to 3 min | NA | |
| impedimetric | metal-oxide | gas | 0 to 350 | 4 s to 10 min | NA |
| metal-oxide | gas | 25 to 26 | 13 s to 12.9 min | light activation a | |
| nanotubes | gas | 25 to 75 | 15.5 min | NA | |
| opticalabsorption | photosensor | gas | TRoom | real-time | 190 to 800 nm |
| photosensor | dissolved | 5 to 40 | real-time | 190 to 900 nm | |
| photoluminescence | photosensor | gas | 25 | 10 to 20 min | 500 to 800 nm |
| colorimetric | detection reagent and photosensor | dissolved | TRoom | 2.5 min | NR |
| titration | titrant | dissolved | TRoom | NR | NA |
| Measurement Method | Sensing Material/Unit | Electrode Material | TMeasurement | λ | Measurement Range | tResponse | tRecovery |
|---|---|---|---|---|---|---|---|
| amperometric | ✓ | ✗ | ✗ | ✗ | ✓ | ✓ | ✓ |
| impedimetric | ✓ | ✓ | ✓ | ✓ | ✓ | ✓ | ✓ |
| optical absorption | ✓ | ✗ | ✗ | ✓ | ✓ | ✓ | ✓ |
| photoluminescence | ✓ | ✗ | ✗ | ✓ | ✓ | ✓ | ✓ |
| colorimetric | ✓ | ✗ | ✗ | ✓ | ✓ | ✓ | ✓ |
| titrtration | ✓ | ✗ | ✗ | ✗ | ✓ | ✗ | ✗ |
| Measurement Method | Sensing Material | Substrate | Electrode Material | TMeasurement [°C] | λ [nm] | Measurement Range [ppb]a | tResponse (cOzone [ppb]) | tRecovery | Com. av. | Year [Ref.] |
|---|---|---|---|---|---|---|---|---|---|---|
| amperometric | WE: NR; RE: NR; CE: NR | NR | NA | 20 | - | 20 to 250 | <180 s (NR) | <180 s | yes | 2016 [34,35] |
| WE: NR; RE: NR; CE: NR | NR | NA | 12 to 26 | - | 5 to 1 × 10⁴ | NR | NR | yes | 2017 [36] | |
| WE: NR; RE: NR; CE: NR | NR | NA | −30 to 50 | - | 20 to 2 × 10⁴ | 15 s (NR) | NR | yes | 2017 [37,38] | |
| WE: Au; RE: Ag; CE: Pt | silicon | NA | 25, 35, 50 | - | 0.23 to 180 | NR | NR | no | 2017 [39] | |
| WE: Au, Ag, Pt; RE: Au, | PE, PVC, | NA | 15 to 90 | - | NR | NR | NR | no | 2018 [40] | |
| Ag, Pt; CE: Au, Ag, Pt | PP | |||||||||
| WE: Au; RE: NR; CE: Ag | NR | NA | −5 to 45 | - | 0.6 to 5 × 10⁴ | 30 s (NR) | NR | yes | 2020 [41] | |
| WE: NR; RE: NR; CE: NR | NR | NA | −20 to 50 | - | 0 to 5 × 10³ | NR | NR | yes | 2020 [42] | |
| impedimetric | ZnO | SiO2/Si | Pt | 200 | - | 100 to 1 × 10⁶ | 9.6 s (100) | 45.6 s | no | 2016 [43] |
| CoxZn1−xO | SiO2/Si | Pt | 150 to 350 | - | 42 to 560 | 40 s (NR) | 6 min | no | 2016 [44] | |
| ZnO mod. NiPc | SiO2/Si | Pt | 250 | - | 80 to 890 | 22 s (80) | 33 s | no | 2016 [45] | |
| NiCo2O4 | SiO2/Si | Pt | 200 | - | 28 to 165 | 32 s (28) | 60 s | no | 2016 [46] | |
| NR | NR | NR | 12 to 32 | - | 1.5 to 110 | 10 min (90) | NR | yes | 2016 [47] | |
| NR | NR | NR | 12 to 32 | - | 0.5 to 110 | 5 min (90) | NR | yes | 2016 [47] | |
| WO3 | NR | NR | 12 to 32 | - | 1 to 110 | 10 min (90) | NR | no | 2016 [47] | |
| NiAl-LDH | Al | Au | 25 | - | 15 to 3580 | 4 s (15) | 4 s | no | 2017 [48] | |
| NR | NR | NR | 0 to 40 | - | 1 to 150 | NR | NR | yes | 2017 [49,50] | |
| ZnO-SnO2 | Al2O3 | Pt | 26 | 325 | 20 to 300 | 13 s (60) | 90 s | no | 2017 [51] | |
| Ag (APTMS) | glass | NR | NR | - | 15 × 104 to 1 × 10⁶ | 50 s (2 × 10⁵) | NR | no | 2017 [52] | |
| Ag (PVA) | glass | NR | NR | - | 18 × 104 to 1 × 10⁶ | 15 s (2 × 10⁵) | NR | no | 2017 [52] | |
| Au (APTMS) | glass | NR | NR | - | 15 × 104 to 1 × 10⁶ | 70 s (2 × 10⁵) | NR | no | 2017 [52] | |
| Au (PVA) | glass | NR | NR | - | 18 × 104 to 1 × 10⁶ | 25 s (2 × 10⁵) | NR | no | 2017 [52] | |
| In2O3 dop. WO3 | Al2O3 | Pt | 75 | - | 200 to 500 | 60 s (200) | 60 to 120 s | no | 2017 [53] | |
| ZnO | Si/SiO2 | Ti/Pt | 25 | 390 | 35 to 165 | NR | NR | no | 2017 [54] | |
| NR | NR | NR | 25 | - | 10 to 1000 | NR | NR | yes | 2017 [55,56,57] | |
| WO3 | Al | Au | 150 | - | 500 to 2000 | NR | NR | no | 2017 [58] | |
| am.-IGZO | glass | NR | 25 | 365 | 500 to 5000 | 775 s (500) | 2470 s | no | 2018 [59] | |
| CuWO4 | SiO2/Si | Pt | 200 to 290 | - | 15 to 1400 | 7 s (90) | 5 to 10 s | no | 2018 [60] | |
| ZnO | Al | Au | 300 | - | NR to 100 | NR | NR | no | 2018 [61] | |
| CNT func. ODA | Al2O3 | Pt | 75 | - | 200 to 500 | 15.5 min (200) | 28.7 min | no | 2018 [62] | |
| CNT | FR-4 | Cu | TRoom | - | 200 to 500 | NR | NR | no | 2018 [63] | |
| CH3NH3Pbl3−xClx | glass | Pt | TRoom | - | 5 to 2500 | 225 s (180) | 40 to 60 s | no | 2018 [64] | |
| TiO2-In2O3 | Al | Au | 25 | 405 | 40 to 2000 | 40 s (2000) | 280 s | no | 2018 [65] | |
| V2O5/TiO2 | SiO2/Si | Pt | 300 | - | 90 to 1250 | 4.4 min (1250) | 5 to 16 min | no | 2019 [66] | |
| ZnO mod. Au | BOPET | Pt | 26 | 370 | 30 to 570 | 13 s (30) | 29 s | no | 2019 [26] | |
| Ag-TiO2 | glass | Au | TRoom | UV, blue | 100 | NR | NR | no | 2019 [67] | |
| Zn0.95Co0.05O | SiO2/Si | Pt | 250 | - | 20 to 1040 | 40 s (260) | 100 s | no | 2019 [68] | |
| IGZO-dec. | quartz | ITO | TRoom | 254 | NR | NR | NR | no | 2020 [69] | |
| am.-Ga2O3 | ||||||||||
| rGO/WO3 | quartz | NR | TRoom | - | 100 to 1000 | NR | NR | no | 2020 [70] | |
| optical absorption | KI and α-CD | glass | NA | 20 to 22 | 320 to 750 | 3 to 150 | NR | NR | no | 2017 [71] |
| ZnO or LiGaO2 | NR | NA | NR | 250 to 290 | NR | NR | NR | no | 2017 [72] | |
| rGO/ZnO | quartz | NA | TRoom | 190 to 500 | 300 to 700 | real-time | real-time | no | 2018 [73] | |
| methylene blue | quartz | NA | 23 | 400 to 800 | 10 to 200 ppbv | real-time | real-time | no | 2019 [74] | |
| photo-luminescence | QD CdSe | glass | NA | 25 | 500 to 800 | 100 to 5 × 10⁵ | 10 to 20 min (NR) | 1 day | no | 2016 [31] |
| Measurement Method | Sensing Unit/ Sensing Material | TMeasurement [°C] | λ [nm] | Measurement Range | tResponse | tRecovery | Commercially Available | Year [Ref.] |
|---|---|---|---|---|---|---|---|---|
| amperometric | WE: BDD; RE: Pt; CE: Pt | 25 | - | 0.185 to 740 μM | NR | NR | no | 2017 [79,80] |
| WE: Au; RE: Au; CE: NR | 26.4 | - | 0 to 5 mg L−1 | NR | 1 s | yes | 2020 [32,81] | |
| WE: Au; RE: NR; CE: NR | 26.4 | - | 0 to 3 mg L−1 | 30 s | 1 s | yes | 2020 [32,82] | |
| WE: NR; RE: NR; CE: NR | 0 to 45 | - | 0.05 to 20 mg L−1 | 15 s | NR | yes | 2020 [83] | |
| WE: Au; RE: NR; CE: Ag | 0 to 45 | - | 0 to 20 mg L−1 | 50 s | NR | yes | 2020 [84] | |
| WE: NR; RE: NR; CE: NR | 0 to 50 | - | 0 to 200 ppb | 60 s | NR | yes | 2020 [85] | |
| WE: Au; RE: Ag; CE: Ag | −5 to 50 | - | 0 to 10 ppm | 90 s | NR | yes | 2020 [86] | |
| WE: NR; RE: NR; CE: NR | 5 to 50 | - | 0 to 5 mg L−1 | 30 s | NR | yes | 2020 [87] | |
| WE: NR; RE: NR; CE: NR | 0 to 40 | - | 0 to 5 mg L−1 | 3 min | NR | yes | 2020 [88] | |
| optical absorption | photometer | 25 | 190 to 900 | 0.05 0 to 9 mg L−1 | real-time | real-time | yes | 2016 [89] |
| fluorometer | 15 | excitation: 213 to 335 emission: 310 to 450 | 0 to 5 mg L−1 | real-time | real-time | yes | 2017 [90] | |
| photometer | 5 to 40 | NR | 0 to 150 mg L−1 | 2 s | NR | yes | 2020 [91] | |
| photometer (preprocessing: gas stripping) | NR | 254 | 0 to 890 ppb | 10 s | NR | no | 2016 [23] | |
| photometer (preprocessing: gas stripping) | 26.4 | 254 | 0 to 100 mg L−1 | 20 s | 10 s | yes | 2020 [22,32] | |
| colorimetric | DPD or DPD with KI | 26.4 | NR | 0 to 5 mg L−1 | 2.5 min | NR | yes | 2020 [32] |
| titration | Na2S2O3 | TRoom | - | 30 to 192 ppm | NR | NR | no | 2019 [33] |
| Measurement Method | Sensing Material | Fabrication Method | TProcess,max [°C] | Year [Ref.] |
|---|---|---|---|---|
| amperometric (gas) | WE: NR; RE: NR; CE: NR | screen-printing | NR | 2017 [37,38] |
| KI-PANI | electropolymerisation | 100 | 2017 [39] | |
| amperometric (dissolved) | WE: BDD; RE: Pt; CE: Pt | MPCVD | NR | 2017 [79,80] |
| impedimetric (gas) | ZnO | microwave-assisted hydrothermal synthesis | 120 | 2016 [43] |
| CoxZn1−xO | polymeric precursor spin-coating | 500 | 2016 [44] | |
| ZnO mod. NiPc | hydrothermal synthesis and dipping | 95 | 2016 [45] | |
| NiCo2O4 | urea-assisted chemical co-precipitation [100] | 450 | 2016 [46] | |
| NiAl-LDH | hydrothermal synthesis and dip-coating | 100 | 2017 [48] | |
| ZnOSnO2 | hydrothermal synthesis | 200 | 2017 [51] | |
| Au and Ag | immersion, dipping, or spin-coating | 160 | 2017 [52] | |
| In2O3 dop. WO3 | screen-printing | 600 | 2017 [53] | |
| ZnO | magnetron sputtering and spin-coating | 80 | 2017 [54] | |
| WO3 | liquid precursor flame spraying | 200 | 2017 [58] | |
| am.-IGZO | RF sputtering | 100 | 2018 [59] | |
| CuWO4 | sono-chemical route | 500 | 2018 [60] | |
| ZnO | electron beam evaporation and hydrothermal synthesis | 100 | 2018 [61] | |
| CNT func. ODA | spray-coating and screen-printing | 100 | 2018 [62] | |
| CNT | spray-coating | NR | 2018 [63] | |
| CH3NH3Pbl3−xClx | spin-coating | 100 | 2018 [64] | |
| TiO2-In2O3 | dip-coating | 400 | 2018 [65] | |
| V2O5/TiO2 | hydrothermal synthesis | 500 | 2019 [66] | |
| ZnO mod. Au | photolithography, hydrothermal synthesis, and thermal evaporation (gold deposition in vacuum) | 95 | 2019 [26] | |
| Zn0.95Co0.05O | spray pyrolysis | 300 | 2019 [68] | |
| IGZO-dec. | UV photolithography and | TRoom | 2020 [69] | |
| am.-Ga2O3 | RF magnetron sputtering | |||
| rGo/WO3 | hydrothermal synthesis and dip-coating | 180 | 2020 [70] | |
| optical absorption (gas) | KI and α-CD | immersion | NR | 2017 [71] |
| rGO/ZnO | ultra-sonic assisted solution process and immersion | 400 | 2018 [73] | |
| methylene blue | dip-coating | 450 | 2019 [74] | |
| Ag-TiO2 | RF magnetron sputtering | 250 | 2019 [67] | |
| photoluminescence (gas) | QD CdSe | cast deposition | NR | 2016 [31] |
© 2020 by the authors. Licensee MDPI, Basel, Switzerland. This article is an open access article distributed under the terms and conditions of the Creative Commons Attribution (CC BY) license (http://creativecommons.org/licenses/by/4.0/).
Share and Cite
Petani, L.; Koker, L.; Herrmann, J.; Hagenmeyer, V.; Gengenbach, U.; Pylatiuk, C. Recent Developments in Ozone Sensor Technology for Medical Applications. Micromachines 2020, 11, 624. https://doi.org/10.3390/mi11060624
Petani L, Koker L, Herrmann J, Hagenmeyer V, Gengenbach U, Pylatiuk C. Recent Developments in Ozone Sensor Technology for Medical Applications. Micromachines. 2020; 11(6):624. https://doi.org/10.3390/mi11060624
Chicago/Turabian StylePetani, Lisa, Liane Koker, Janina Herrmann, Veit Hagenmeyer, Ulrich Gengenbach, and Christian Pylatiuk. 2020. "Recent Developments in Ozone Sensor Technology for Medical Applications" Micromachines 11, no. 6: 624. https://doi.org/10.3390/mi11060624