A Comparative Study of Cavitation Characteristics of Nano-Fluid and Deionized Water in Micro-Channels


Abstract
:1. Introduction
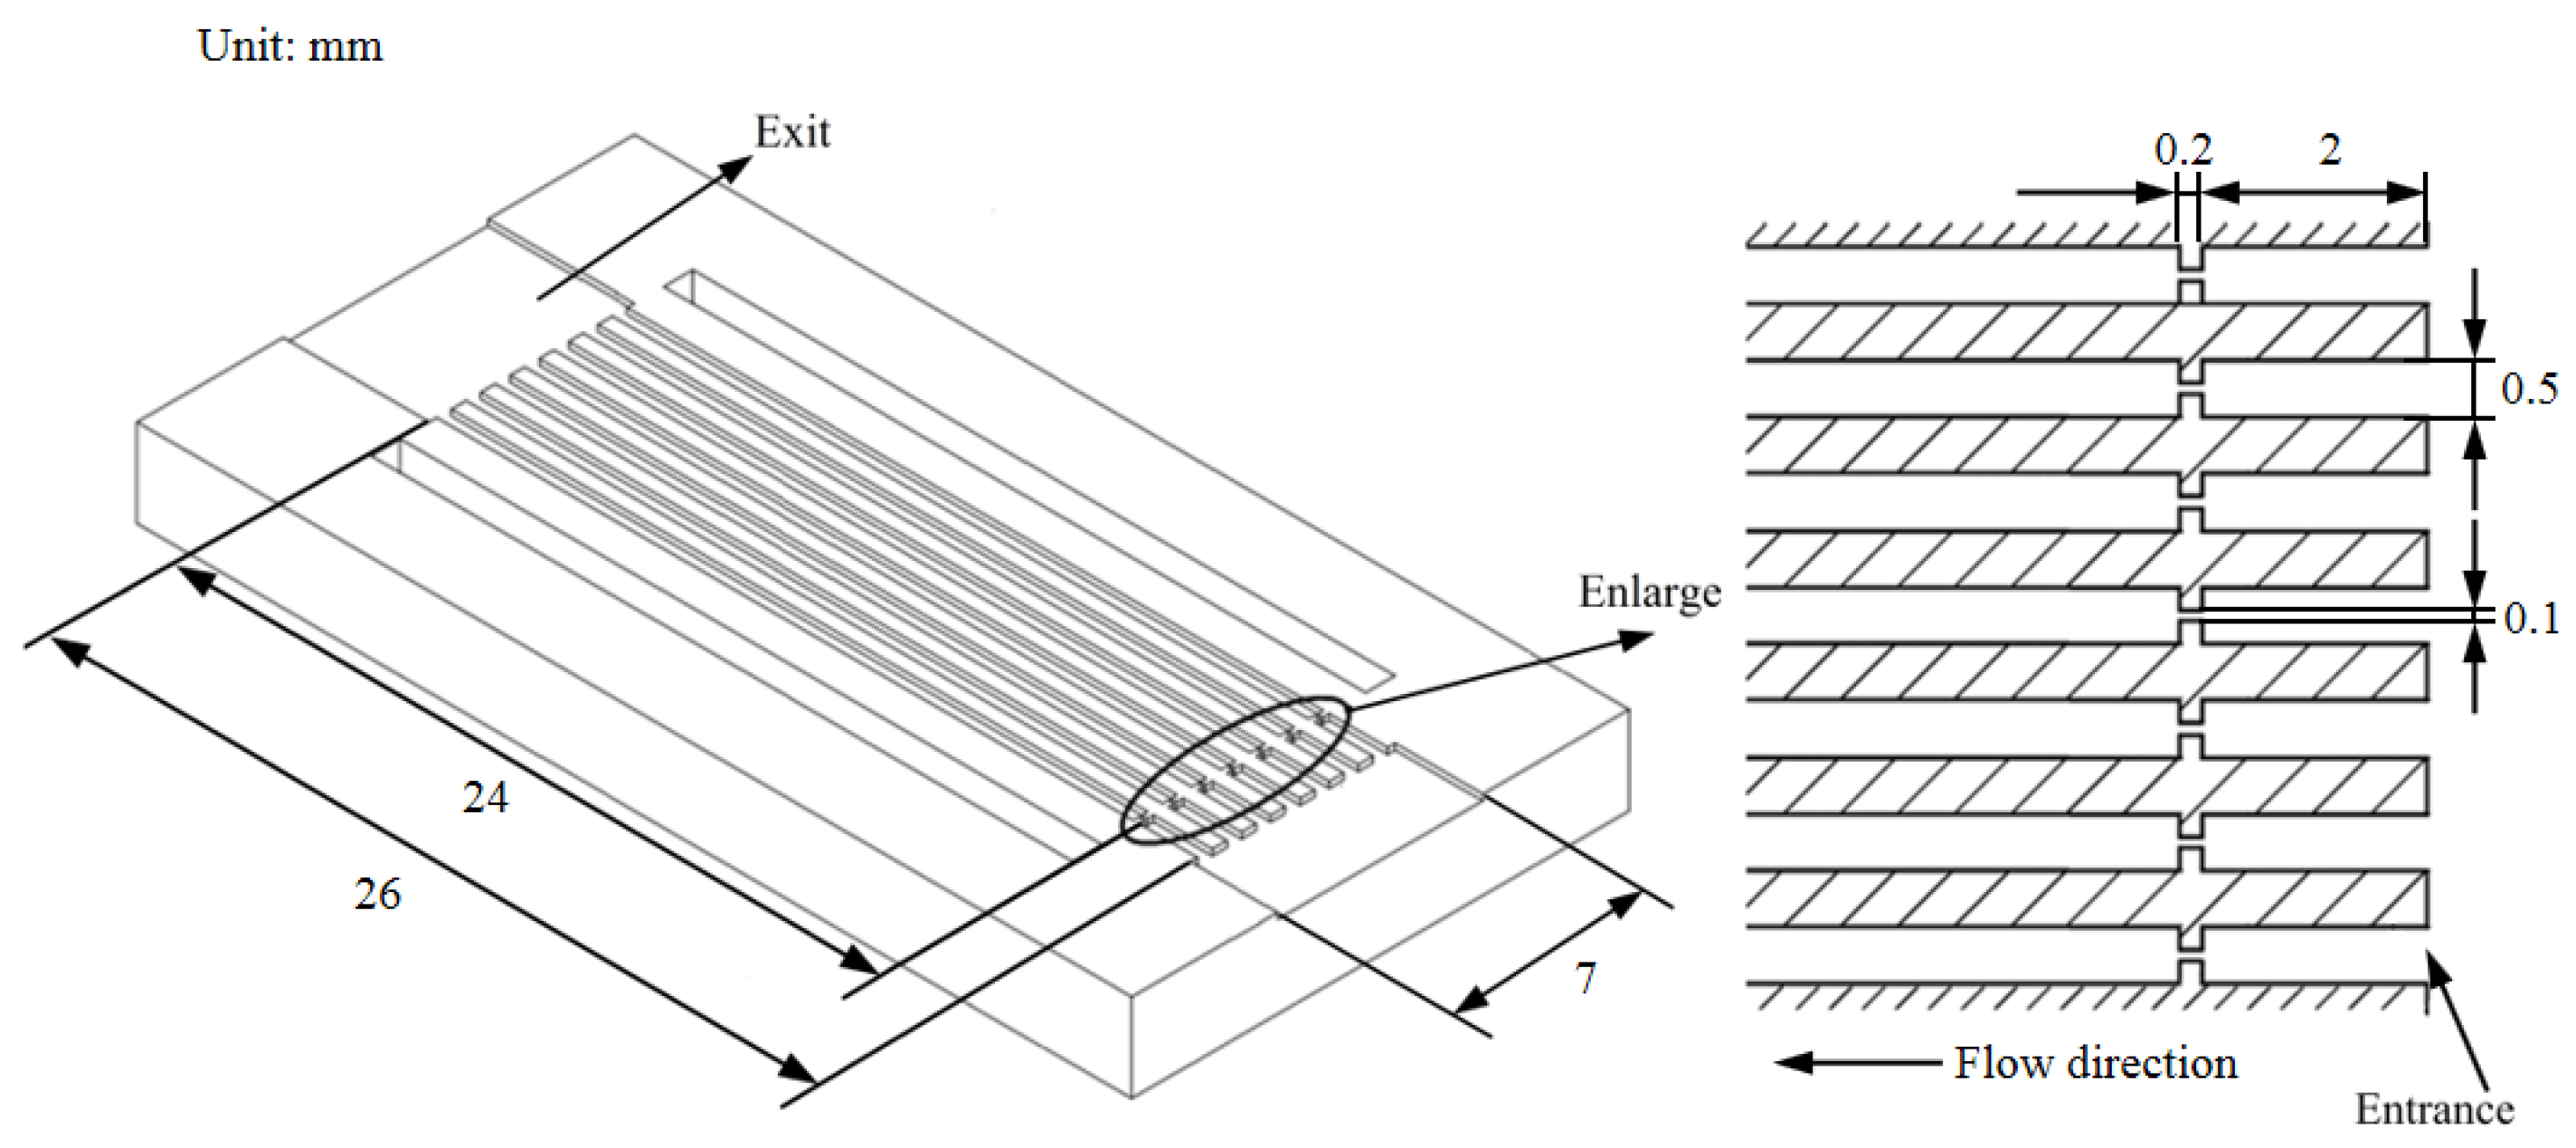
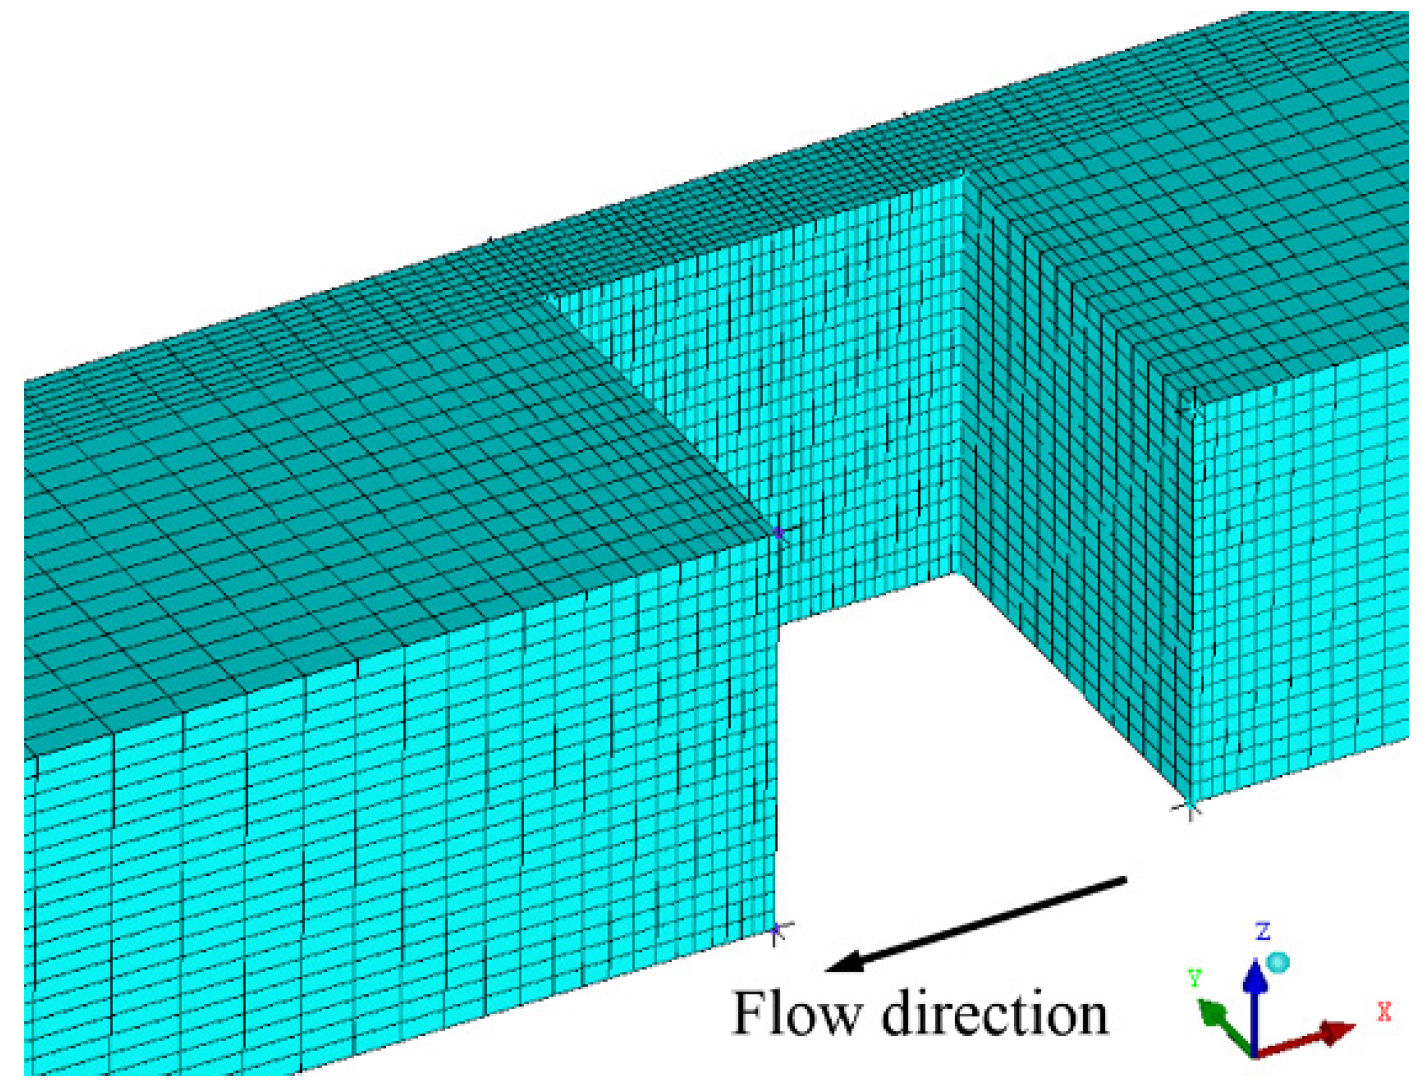
2. Numerical Models
2.1. Governing Equations
2.2. Turbulence Modeling
2.3. Cavitation Model
3. Results and Discussion
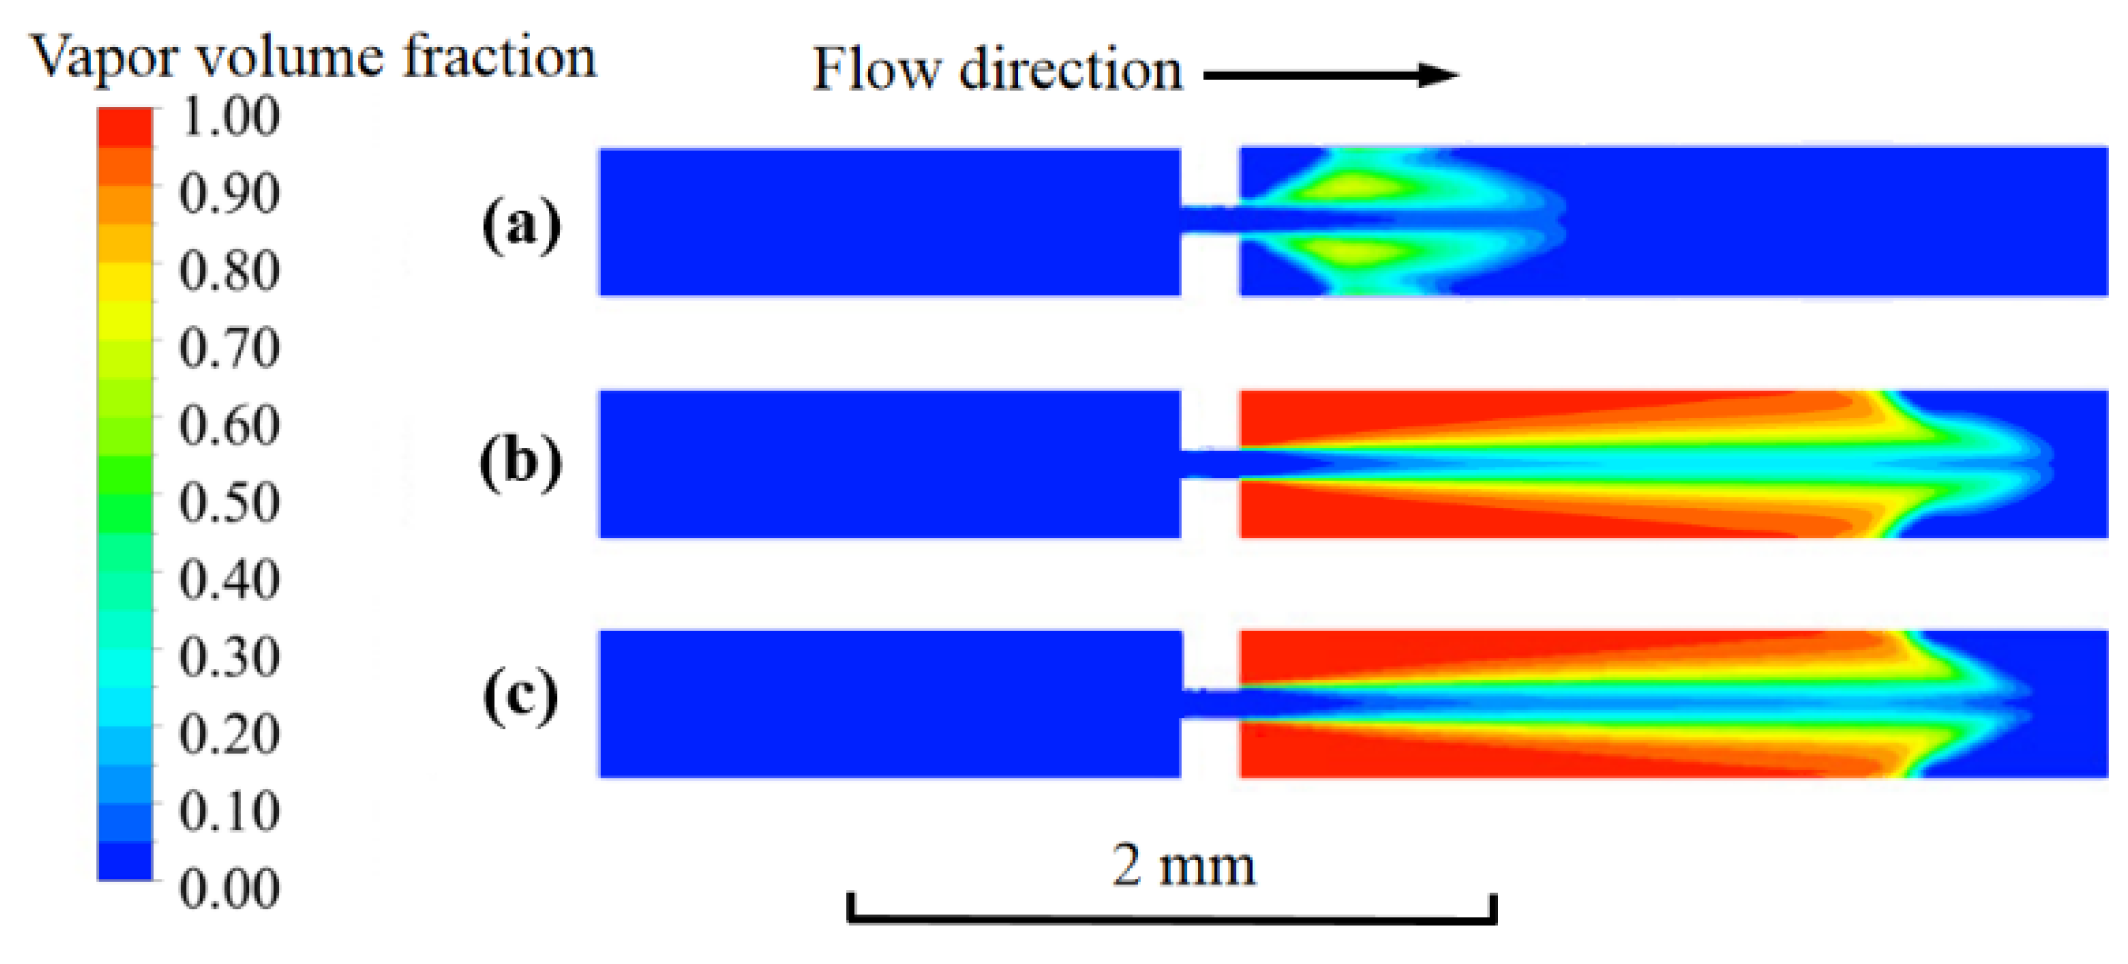
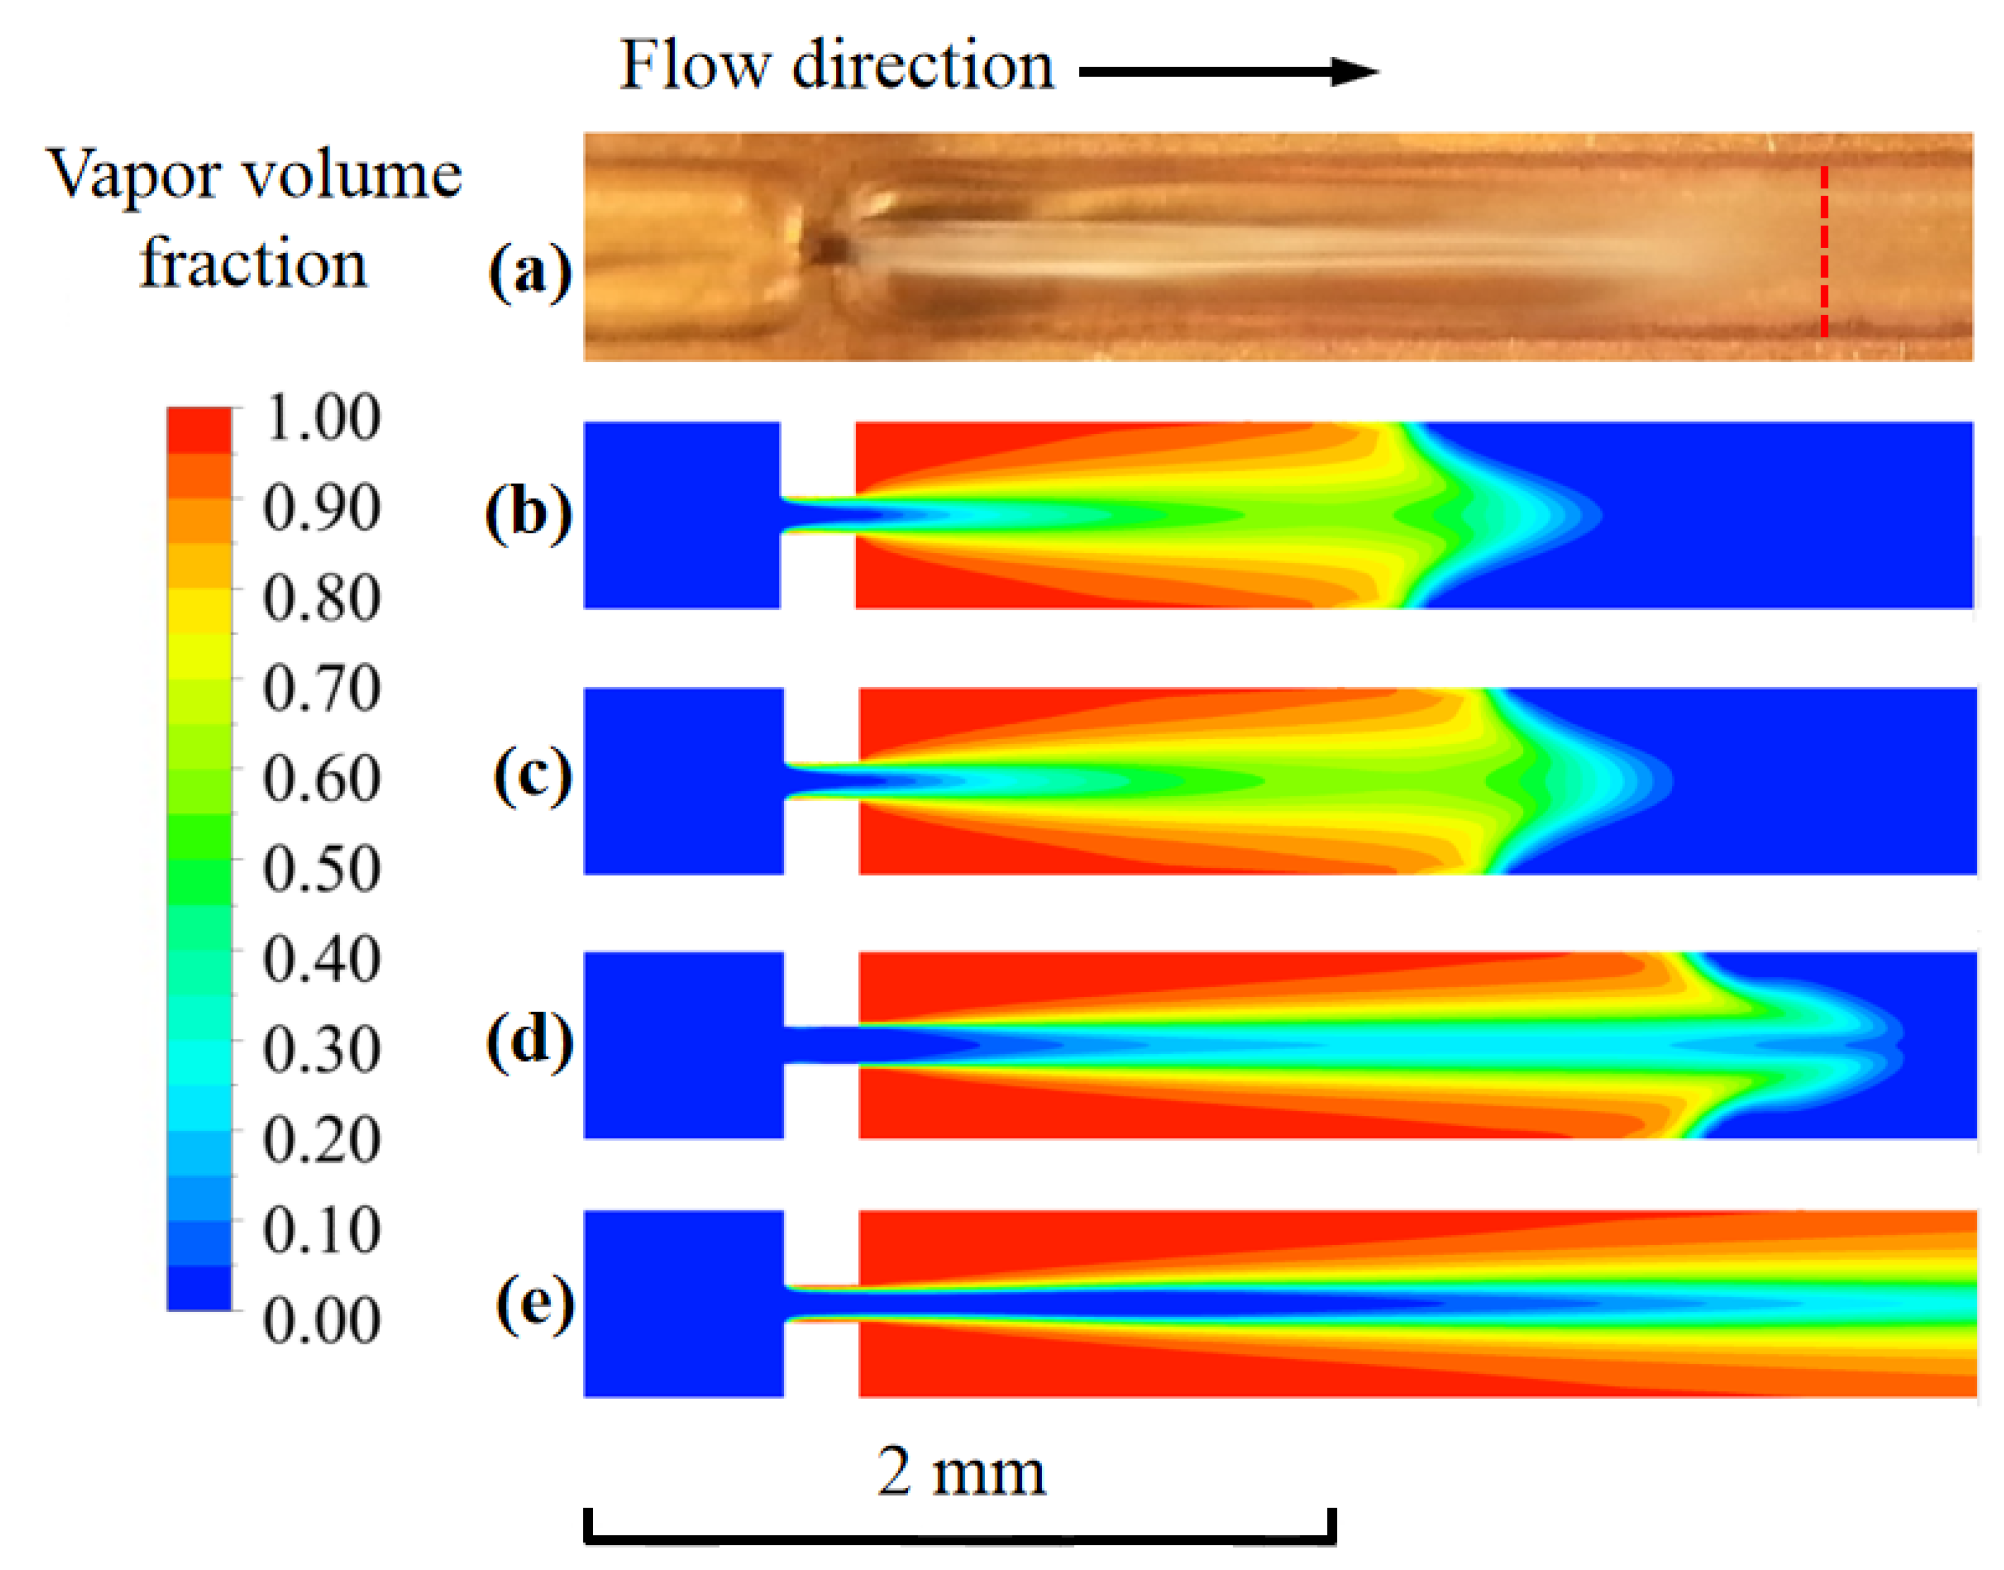
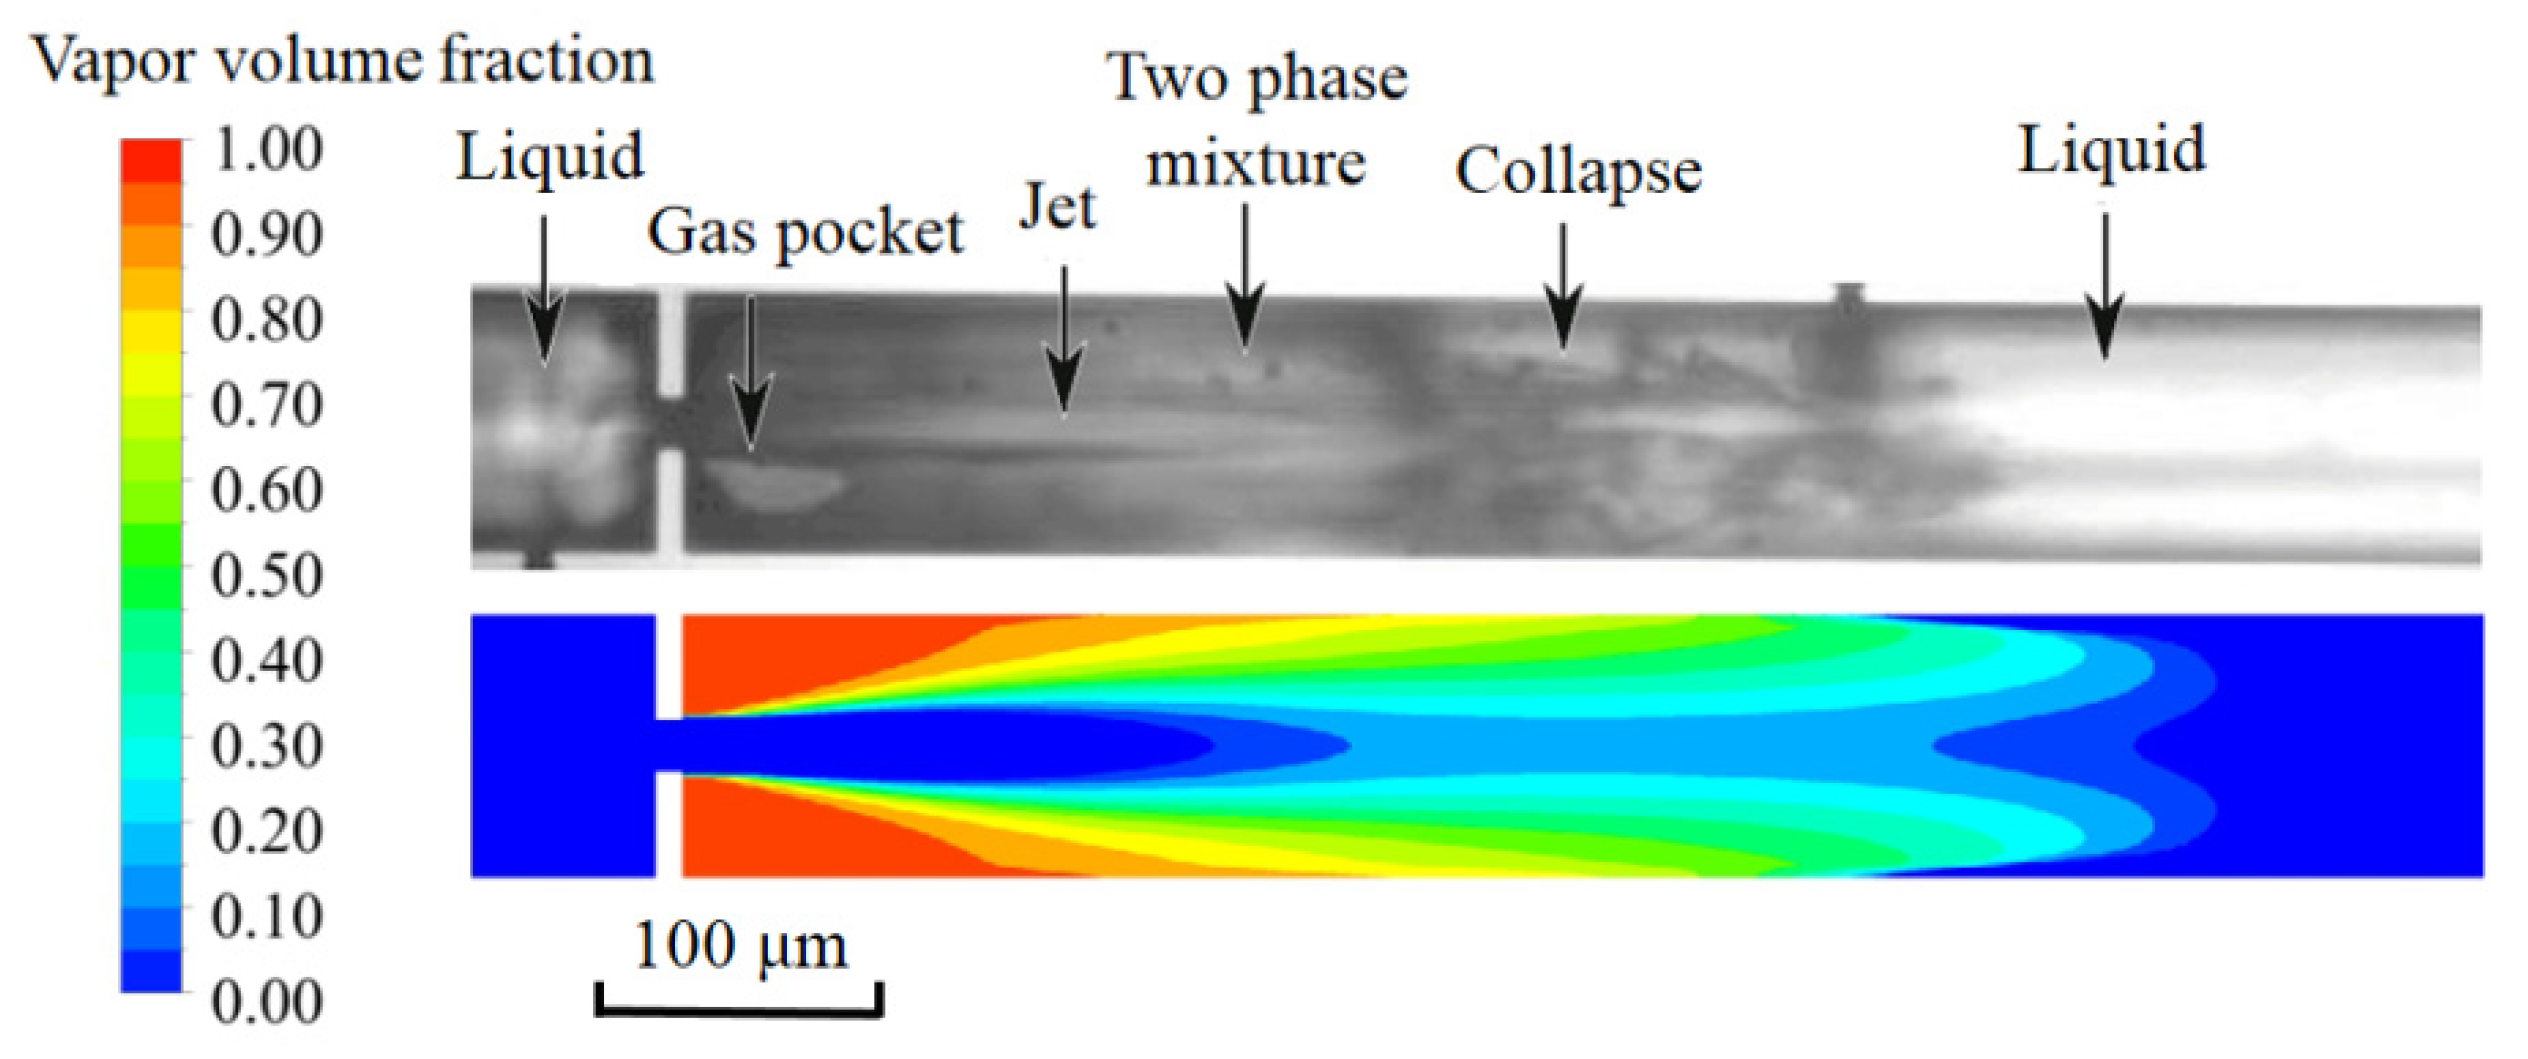
3.1. Model Validation
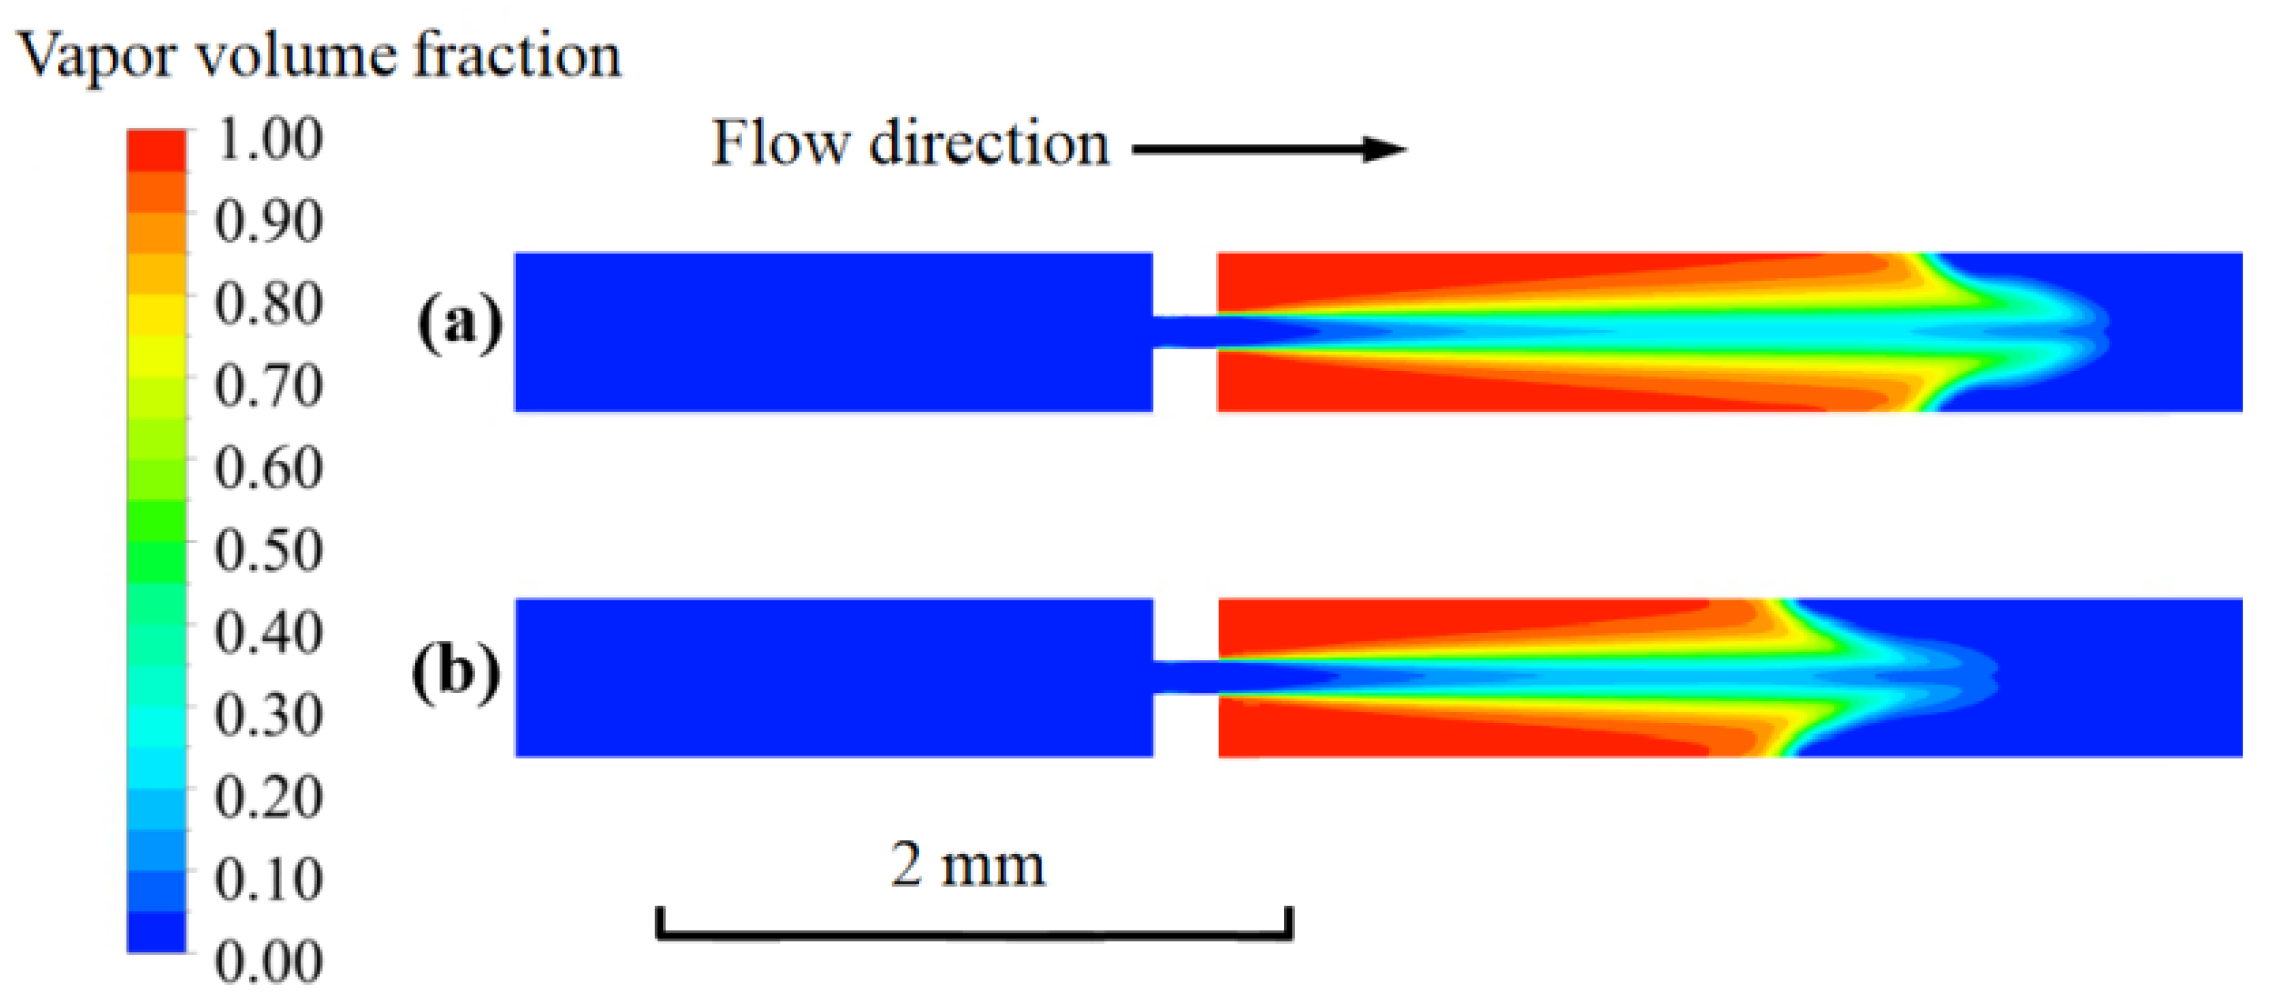
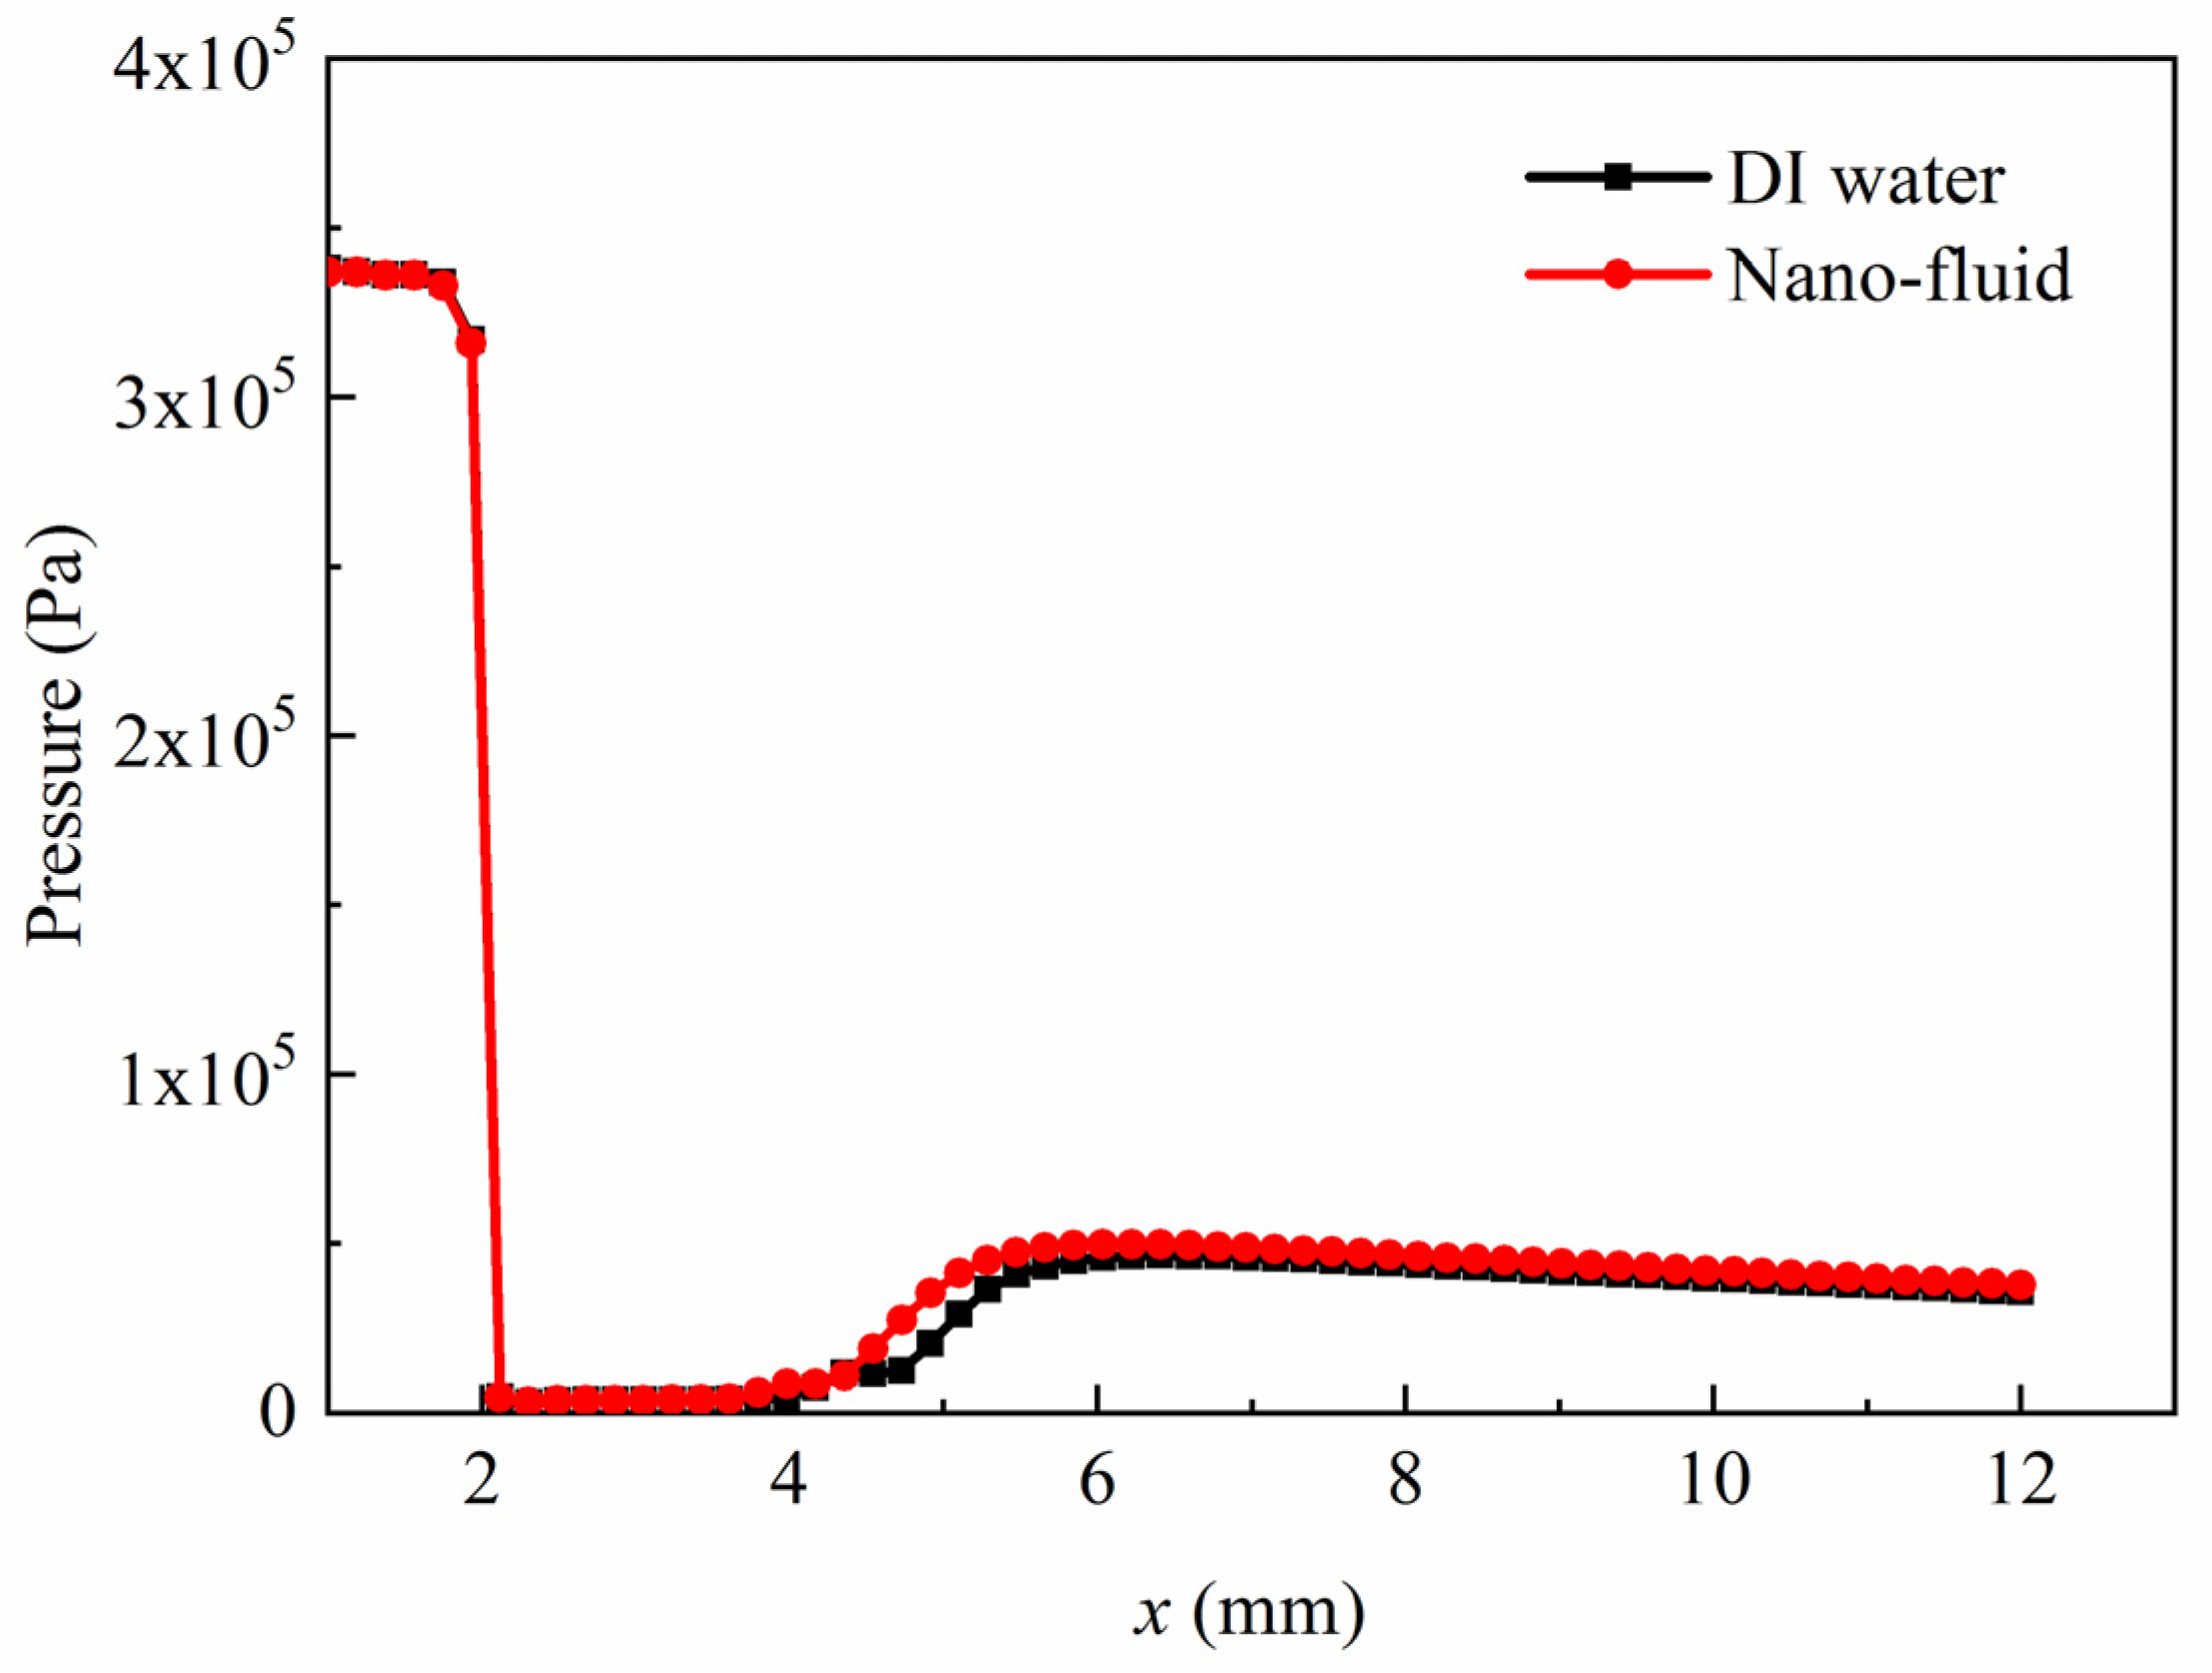
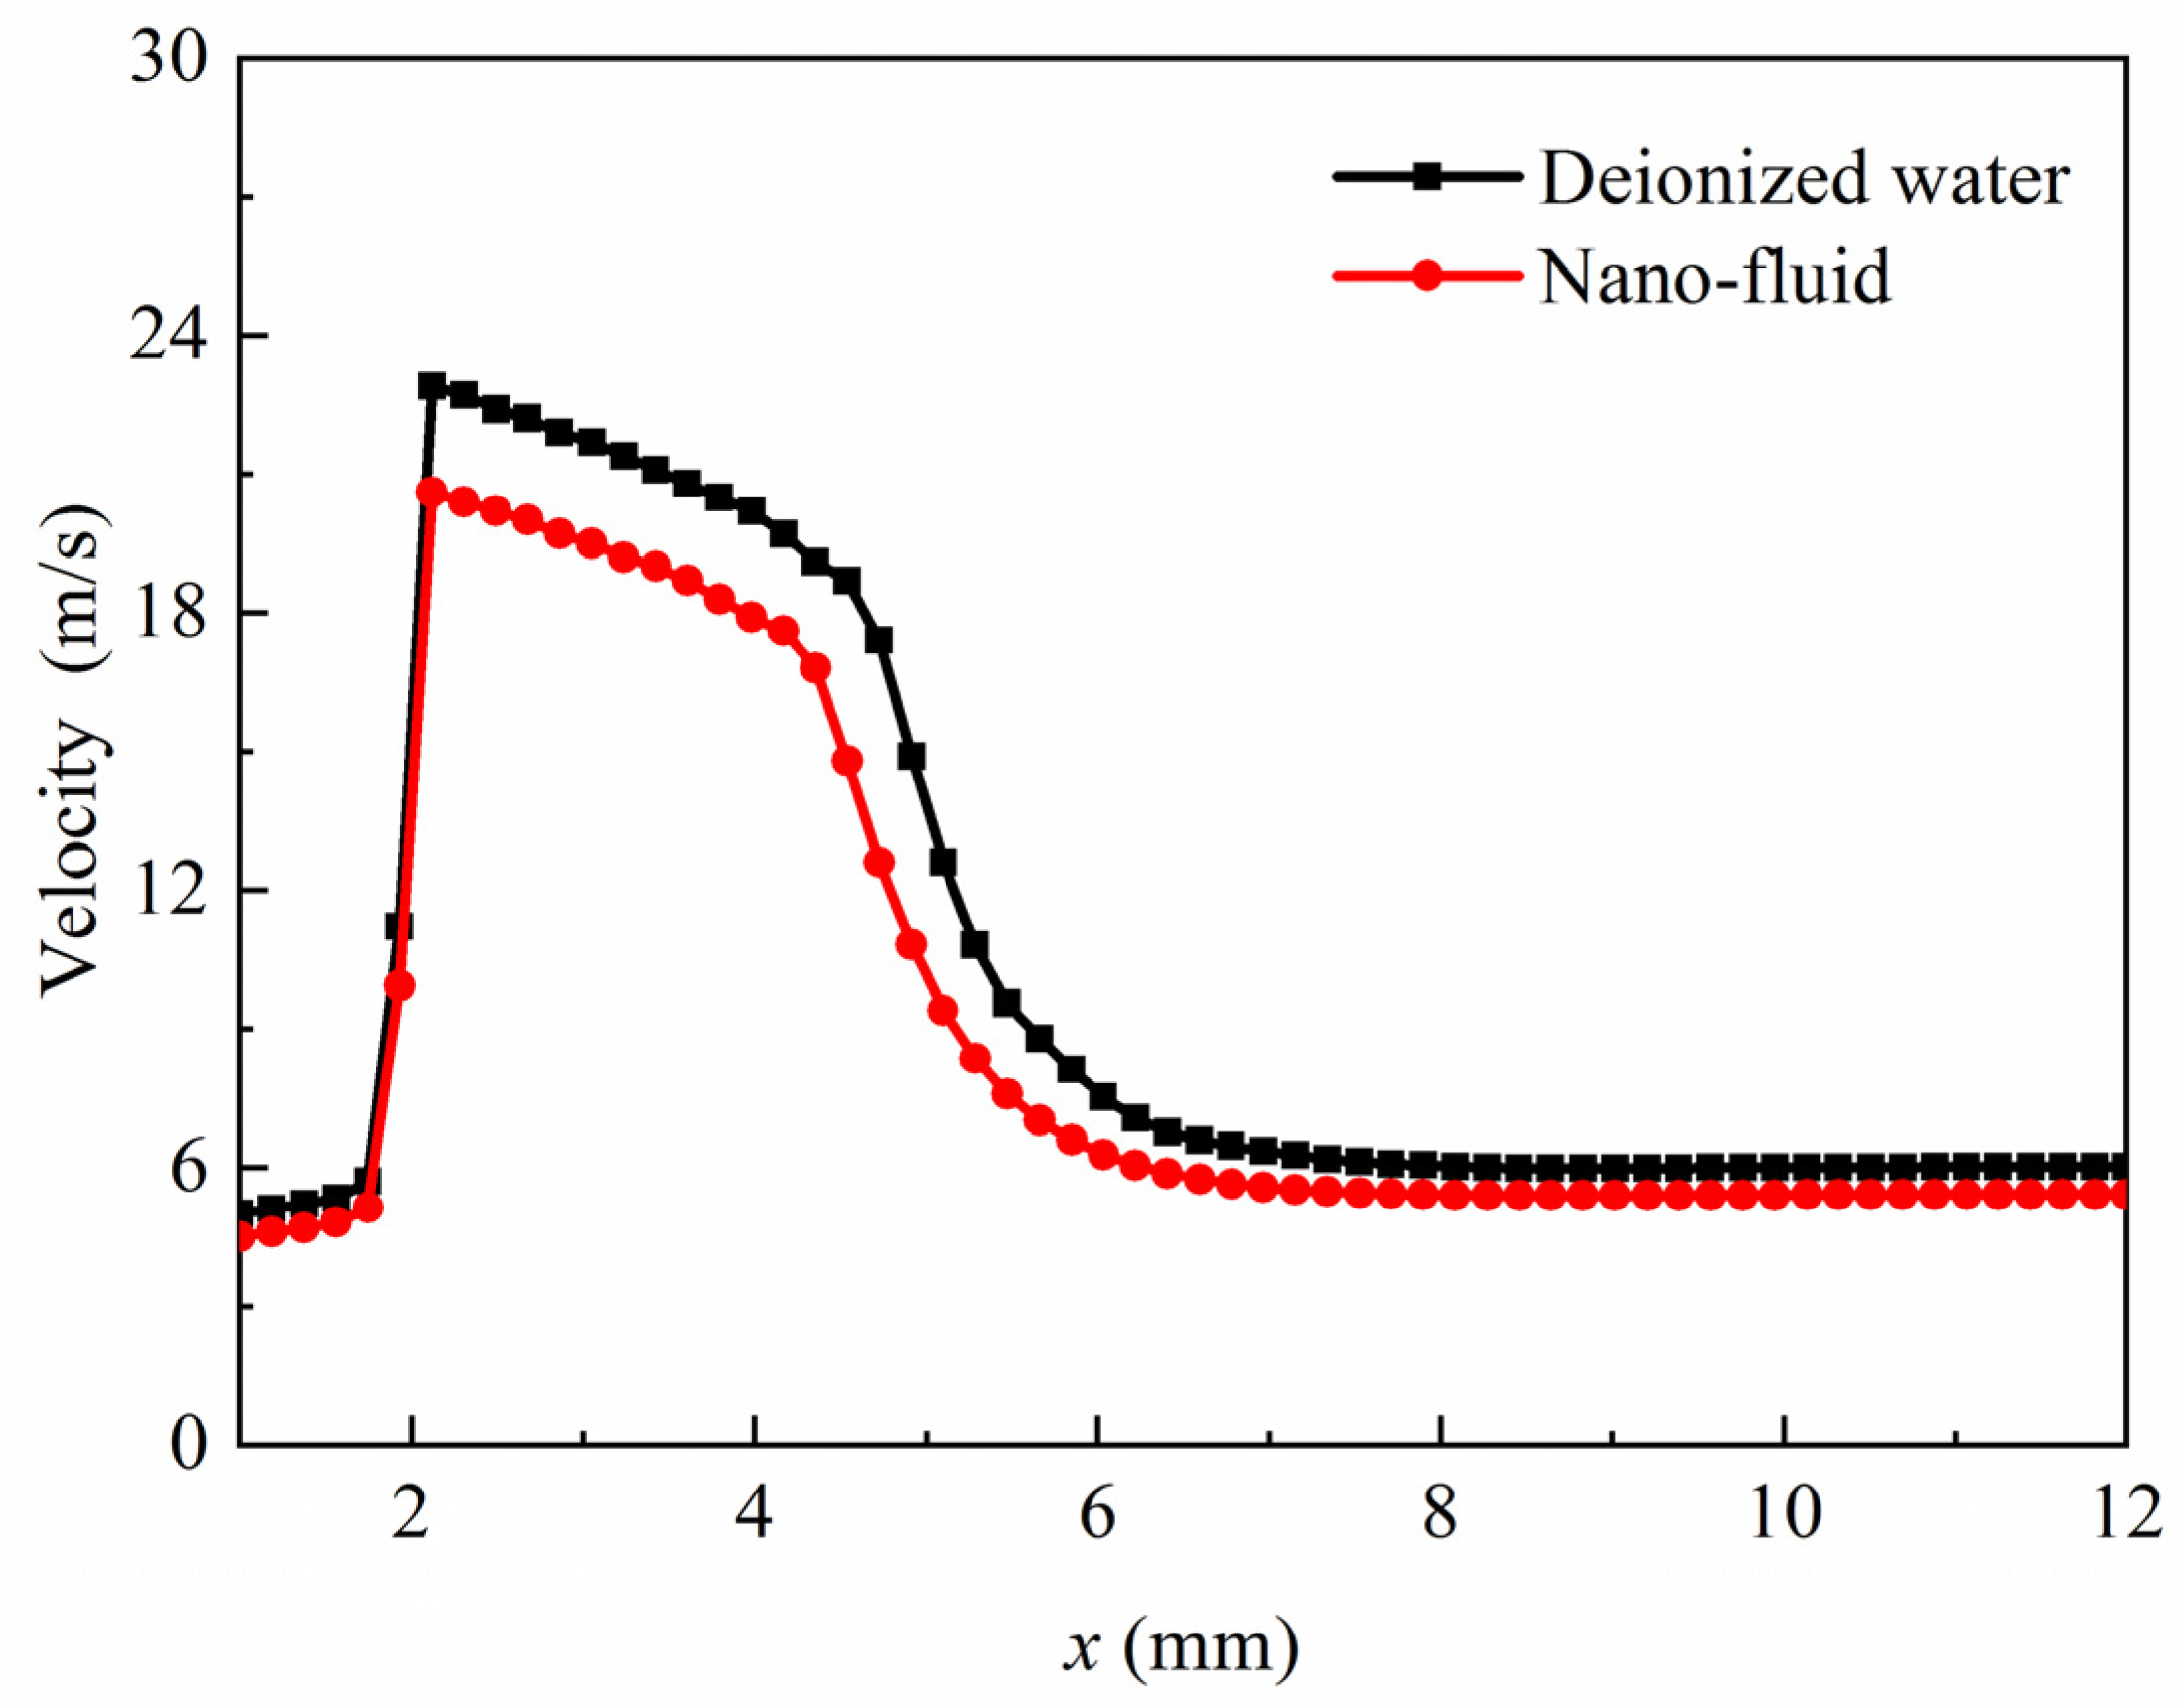
3.2. Cavitating Flow Characteristics of Nano-fluid and DI Wwater
3.3. Effects of the Orifice Structure
3.4. Effects of the Inlet Pressure
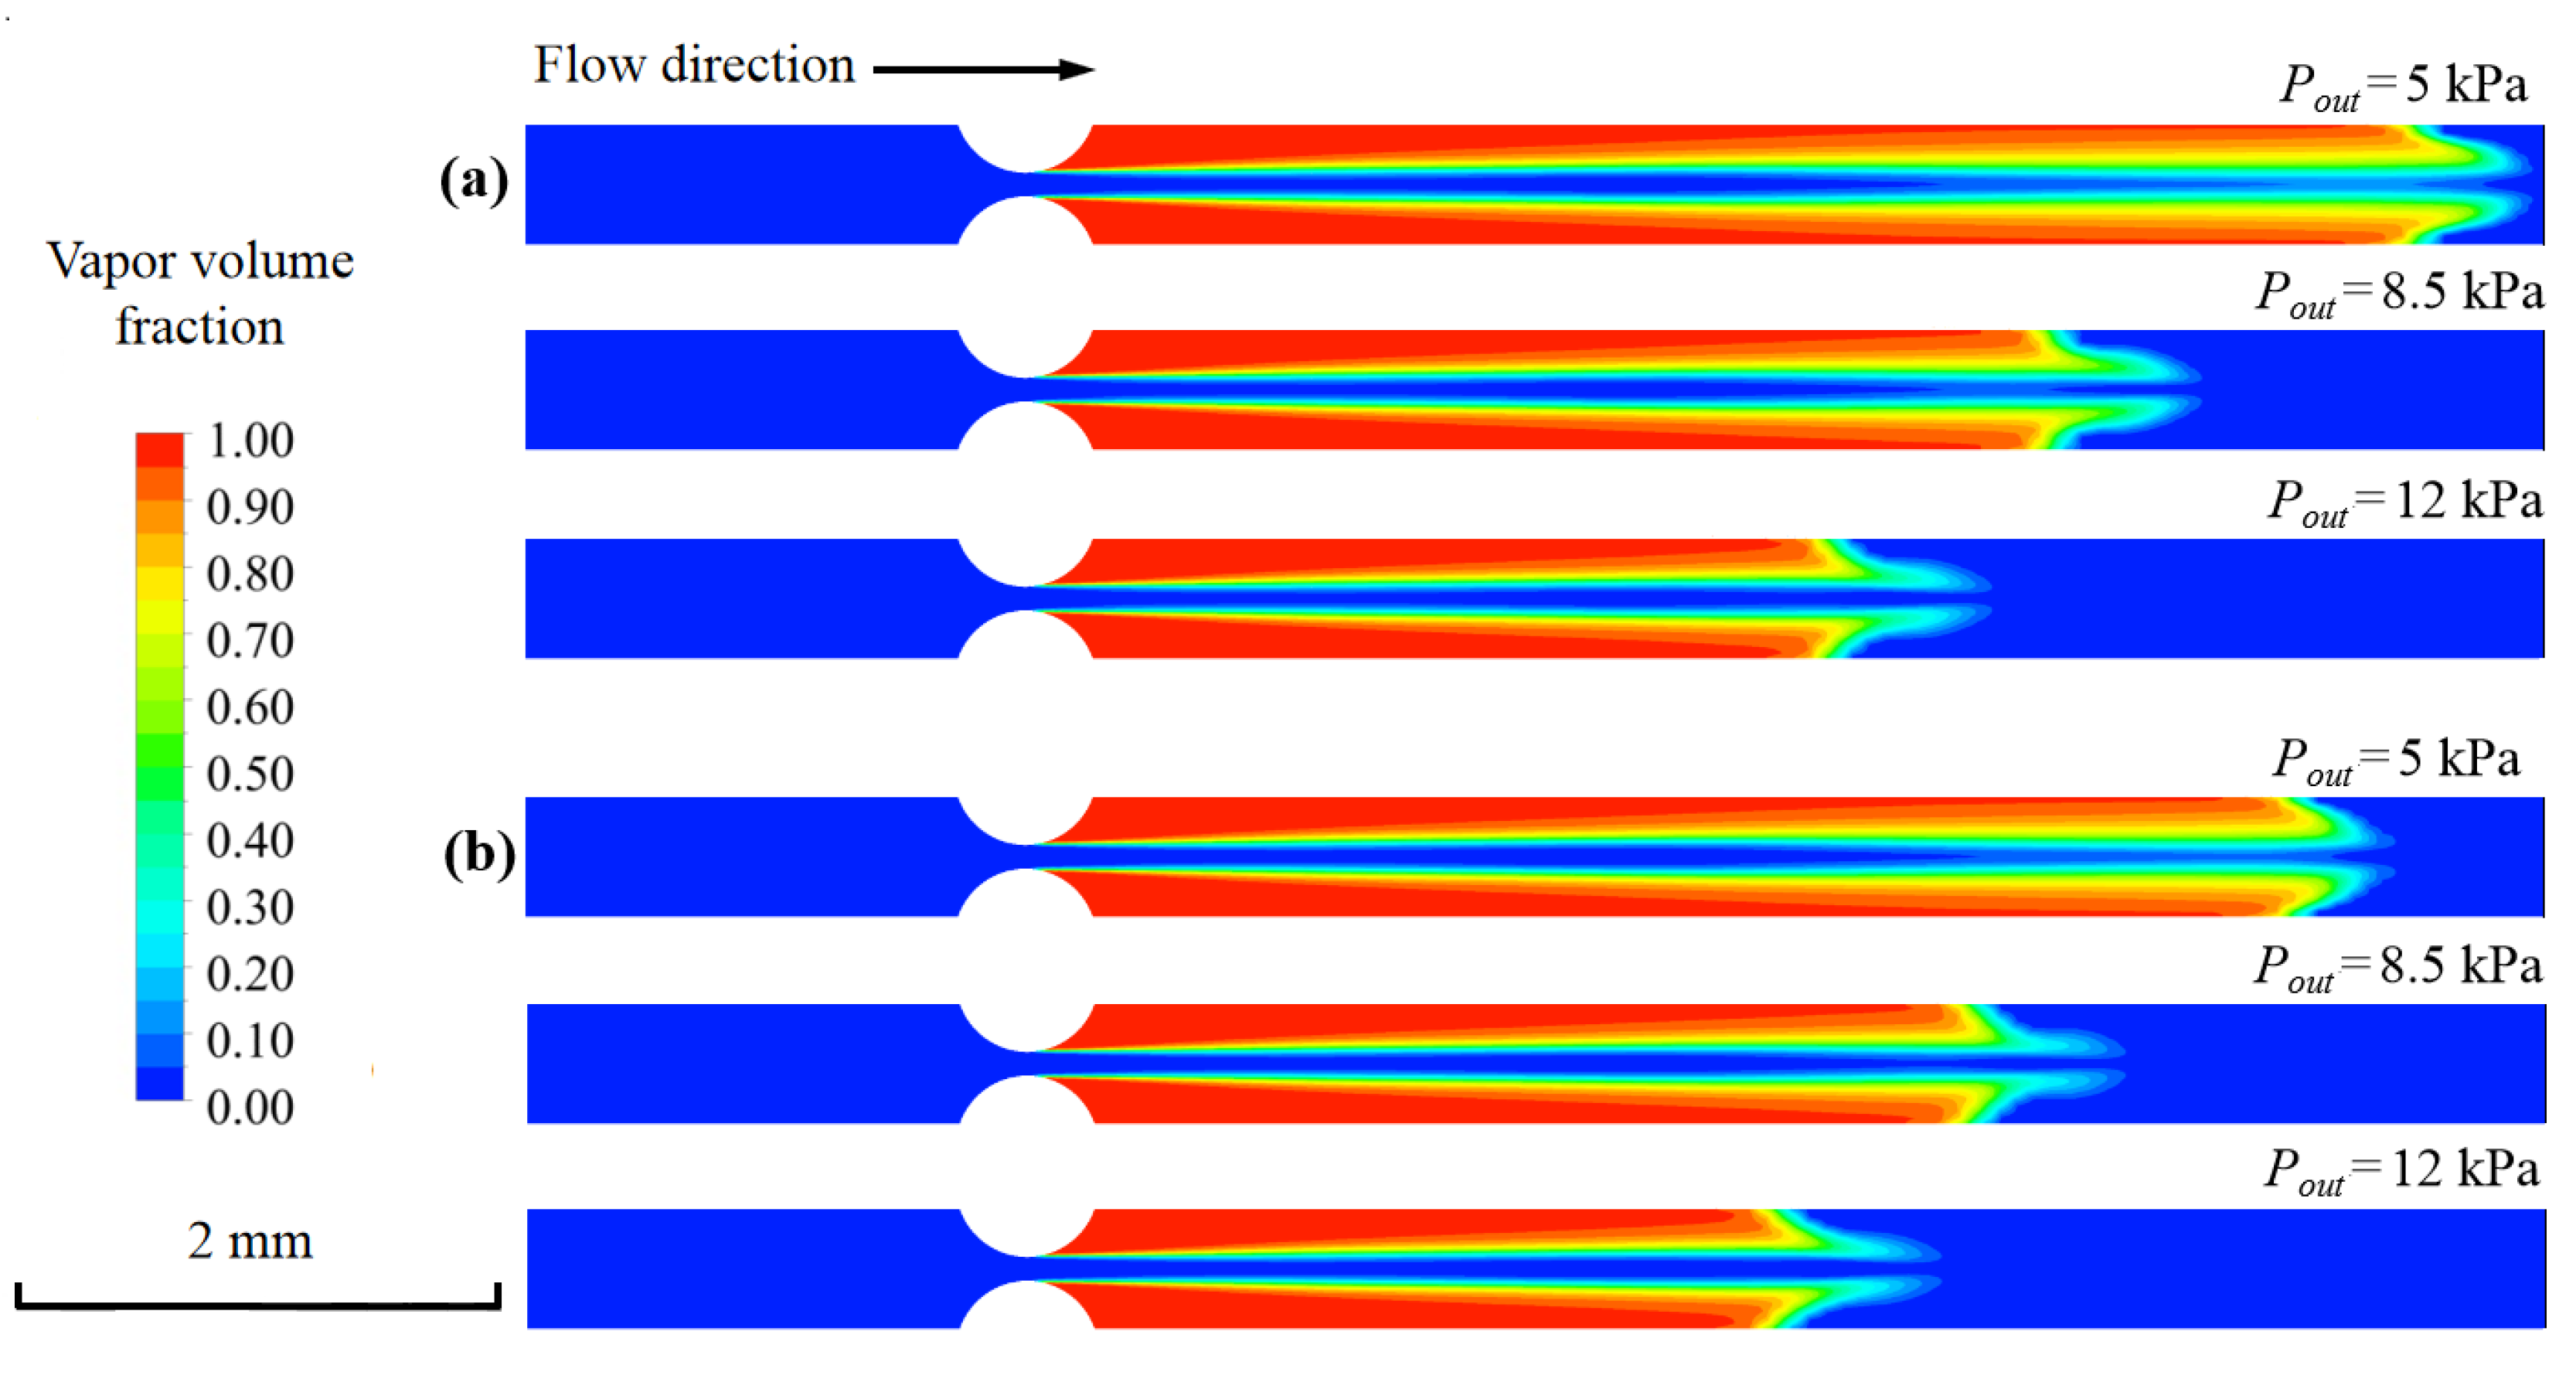
3.5. Effects of the Outlet Pressure
4. Conclusions
Author Contributions
Funding
Conflicts of Interest
References
- Kumar, P.S.; Kumar, M.S.; Pandit, A. Experimental quantification of chemical effects of hydrodynamic cavitation. Chem. Eng. Sci. 2000, 55, 1633–1639. [Google Scholar] [CrossRef]
- Yusof, N.S.; Babgi, B.A.; Alghamdi, Y.G.; Aksu, M.; Madhavan, J.; Ashokkumar, M. Physical and chemical effects of acoustic cavitation in selected ultrasonic cleaning applications. Ultrason. Sonochem. 2016, 29, 568–576. [Google Scholar] [CrossRef] [PubMed]
- Schneider, B.; Koşar, A.; Kuo, C.J.; Mishra, C.; Cole, G.S.; Scaringe, R.P.; Peles, Y. Cavitation enhanced heat transfer in microchannels. J. Heat Trans. 2006, 128, 1293–1301. [Google Scholar] [CrossRef]
- Liu, B.; Cai, J.; Huai, X.L. Heat transfer with the growth and collapse of cavitation bubble between two parallel heated walls. Int. J. Heat Mass Trans. 2014, 78, 830–838. [Google Scholar] [CrossRef]
- Legay, M.; Gondrexon, N.; Le Person, S.; Boldo, P.; Bontemps, A. Enhancement of heat transfer by ultrasound: Review and recent advances. Int. J. Chem. Eng. 2011, 2011, 670108. [Google Scholar] [CrossRef]
- Nakashima, K.; Ebi, Y.; Shibasakikitakawa, N.; Soyama, H.; Yonemoto, T. Hydrodynamic cavitation reactor for efficient pretreatment of lignocellulosic biomass. Ind. Eng. Chem. Res. 2016, 55, 1866–1871. [Google Scholar] [CrossRef]
- Merouani, S.; Hamdaoui, O.; Rezgui, Y.; Guemini, M. Modeling of ultrasonic cavitation as an advanced technique for water treatment. Desalin. Water Treat. 2015, 56, 1465–1475. [Google Scholar] [CrossRef]
- Kaldre, I.; Bojarevičs, A.; Grants, I.; Beinerts, T.; Kalvāns, M.; Milgrāvis, M.; Gerbeth, G. Nanoparticle dispersion in liquid metals by electromagnetically induced acoustic cavitation. Acta Mater. 2016, 118, 253–259. [Google Scholar] [CrossRef]
- Jin, Z.J.; Gao, Z.X.; Li, X.J.; Qian, J.Y. Cavitating Flow through a Micro-Orifice. Micromachines 2019, 10, 191. [Google Scholar] [CrossRef] [Green Version]
- Mishra, C.; Peles, Y. Cavitation in flow through a micro-orifice inside a silicon microchannel. Phys. Fluids 2005, 17, 013601. [Google Scholar] [CrossRef]
- Ghorbani, M.; Yildiz, M.; Gozuacik, D.; Kosar, A. Cavitating nozzle flows in micro- and minichannels under the effect of turbulence. J. Mech. Sci. Technol. 2016, 30, 2565–2581. [Google Scholar] [CrossRef]
- Gothsch, T.; Schilcher, C.; Richter, C.; Beinert, S.; Dietzel, A.; Büttgenbach, S.; Kwade, A. High-pressure microfluidic systems (HPMS): Flow and cavitation measurements in supported silicon microsystems. Microfluid. Nanofluid. 2014, 18, 121–130. [Google Scholar] [CrossRef]
- Pennathur, S.; Peles, Y.; Epstein, A. Cavitation at micro-scale in MEMS fluid machinery. ASME Pap. IMECE 2002, 33328, 87–92. [Google Scholar]
- Mishra, C.; Peles, Y. Size scale effects on cavitating flows through microorifices entrenched in rectangular microchannels. J. Microelectromech. Syst. 2005, 14, 987–999. [Google Scholar] [CrossRef]
- Singhal, A.K.; Athavale, M.M.; Li, H.; Jiang, Y. Mathematical basis and validation of the full cavitation model. J. Fluid. Eng. 2002, 124, 617–624. [Google Scholar] [CrossRef]
- Schnerr, G.H.; Sauer, J. In Physical and numerical modeling of unsteady cavitation dynamics. In Proceedings of the Fourth International Conference on Multiphase Flow, New Orleans, LA, USA, 27 May–1 June 2001. [Google Scholar]
- Zwart, P.J.; Gerber, A.G.; Belamri, T. In A two-phase flow model for predicting cavitation dynamics. In Proceedings of the Fifth International Conference on Multiphase Flow, Yokohama, Japan, 30 May–3 June 2004. [Google Scholar]
- Athavale, M.M.; Li, H.; Jiang, Y.; Singhal, A.K. Application of the full cavitation model to pumps and inducers. Int. J. Rotating Mach. 2002, 8, 45–56. [Google Scholar] [CrossRef] [Green Version]
- Zhu, J.K.; Chen, Y.; Zhao, D.F.; Zhang, X.B. Extension of the Schnerr–Sauer model for cryogenic cavitation. Eur. J. Mech. B/Fluids 2015, 52, 1–10. [Google Scholar] [CrossRef]
- Narendran, G.; Gnanasekaran, N.; Perumal, D.A. Thermodynamic irreversibility and conjugate effects of integrated microchannel cooling device using TiO2 nanofluid. Heat and Mass Transfer 2020, 56, 489–505. [Google Scholar] [CrossRef]
- Karimipour, A.; Dorazio, A.; Shadloo, M.S. The effects of different nano particles of Al2O3 and Ag on the MHD nano fluid flow and heat transfer in a microchannel including slip velocity and temperature jump. Phys. E Low Dimens. Syst. Nanostruct. 2017, 86, 146–153. [Google Scholar] [CrossRef]
- Abbassi, H.; Aghanajafi, C. Evaluation of Heat Transfer Augmentation in a Nanofluid-Cooled Microchannel Heat Sink. J. Fusion Energ. 2006, 25, 187–196. [Google Scholar] [CrossRef]
- Karimipour, A.; Nezhad, A.H.; Dorazio, A.; Esfe, M.H.; Safaei, M.R.; Shirani, E. Simulation of copper-water nanofluid in a microchannel in slip flow regime using the lattice Boltzmann method. Eur. J. Mech. 2015, 49, 89–99. [Google Scholar] [CrossRef]
- Xing, L.; Ying, C.; Mo, S.; Jia, L.; Shao, X. Effect of surface modification on the stability and thermal conductivity of water-based SiO2-coated graphene nanofluid. Thermochim. Acta 2014, 595, 6–10. [Google Scholar]
- Ghanbarpour, M.; Haghigi, E.B.; Khodabandeh, R. Thermal properties and rheological behavior of water based Al2O3 nanofluid as a heat transfer fluid. Exp. Therm. Fluid Sci. 2014, 53, 227–235. [Google Scholar] [CrossRef]
- Xu, J.H.; Bandyopadhyay, K.; Jung, D. Experimental investigation on the correlation between nano-fluid characteristics and thermal properties of Al2O3 nano-particles dispersed in ethylene glycol–water mixture. Int. J. Heat Mass Trans. 2016, 94, 262–268. [Google Scholar] [CrossRef]
- Gu, Y.W.; Li, B.X.; Min, C. An experimental study on the cavitation of water with effects of SiO2 nanoparticles. Exp. Therm. Fluid Sci. 2016, 79, 195–201. [Google Scholar] [CrossRef]
- Bidhendi, M.E.; Riasi, A.; Ashjaee, M. The influence of SiO2 nanoparticles on cavitation initiation and intensity in a centrifugal water pump. Exp. Therm. Fluid Sci. 2014, 55, 71–76. [Google Scholar] [CrossRef]
- Bidhendi, M.E.; Ashjaee, M.; Riasi, A. Effect of SiO2 nanoparticle size on initiation and intensity of bubble formation in a water pump. Exp. Therm. Fluid Sci. 2015, 72, 40–46. [Google Scholar] [CrossRef]
- Liu, B. Research on the Mechanism of Cavitation Enhanced Heat Transfer in Micro-Channels. Ph.D. Thesis, University of Chinese Academy of Science, Beijing, China, 2014. [Google Scholar]
- Rooze, J.J.; Andre, M.A.; Der Gulik, G.S.; Fernandezrivas, D.; Gardeniers, J.G.; Rebrov, E.V.; Schouten, J.C.; Keurentjes, J.T. Hydrodynamic cavitation in micro channels with channel sizes of 100 and 750 micrometers. Microfluid. Nanofluid. 2012, 12, 499–508. [Google Scholar] [CrossRef] [Green Version]
- Medrano, M.; Zermatten, P.J.; Pellone, C.; Franc, J.P.; Ayela, F. Hydrodynamic cavitation in microsystems. I. Experiments with deionized water and nanofluids. Phys. Fluids 2011, 23, 127103. [Google Scholar] [CrossRef]


| Items | Mass Flow Rate (L/h) | Error (%) |
|---|---|---|
| Experiment | 9.6 | ― |
| Standard k-ε model | 8.92 | 7.1% |
| Realizable k-ε model | 8.90 | 7.3% |
| k-ω SST model | 9.07 | 5.5% |
| Standard k-ω model | 9.45 | 1.5% |
| Structure of the Orifice | DI Water (L/h) | Nano-Fluid (L/h) |
|---|---|---|
| rectangle orifice | 9.45 | 8.39 |
| converging-diverging orifice | 11.56 | 10.37 |
| converging orifice | 11.53 | 10.29 |
| curved orifice (R = 0.6 mm) | 12.23 | 10.90 |
| curved orifice (R = 0.3 mm) | 12.36 | 10.95 |
| Outlet Pressure (kPa) | DI Water (L/h) | Nano-Fluid (L/h) |
|---|---|---|
| 5 | 12.36 | 10.95 |
| 8.5 | 12.32 | 10.93 |
| 12 | 12.34 | 10.94 |
© 2020 by the authors. Licensee MDPI, Basel, Switzerland. This article is an open access article distributed under the terms and conditions of the Creative Commons Attribution (CC BY) license (http://creativecommons.org/licenses/by/4.0/).
Share and Cite
Li, T.; Liu, B.; Zhou, J.; Xi, W.; Huai, X.; Zhang, H. A Comparative Study of Cavitation Characteristics of Nano-Fluid and Deionized Water in Micro-Channels. Micromachines 2020, 11, 310. https://doi.org/10.3390/mi11030310
Li T, Liu B, Zhou J, Xi W, Huai X, Zhang H. A Comparative Study of Cavitation Characteristics of Nano-Fluid and Deionized Water in Micro-Channels. Micromachines. 2020; 11(3):310. https://doi.org/10.3390/mi11030310
Chicago/Turabian StyleLi, Tao, Bin Liu, Jinzhi Zhou, Wenxuan Xi, Xiulan Huai, and Hang Zhang. 2020. "A Comparative Study of Cavitation Characteristics of Nano-Fluid and Deionized Water in Micro-Channels" Micromachines 11, no. 3: 310. https://doi.org/10.3390/mi11030310