A Microfluidic Detection System for Bladder Cancer Tumor Cells

Abstract
:
1. Introduction
2. Materials and Methods
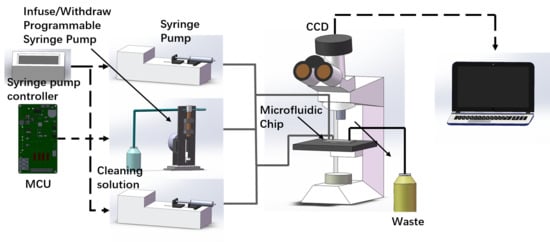
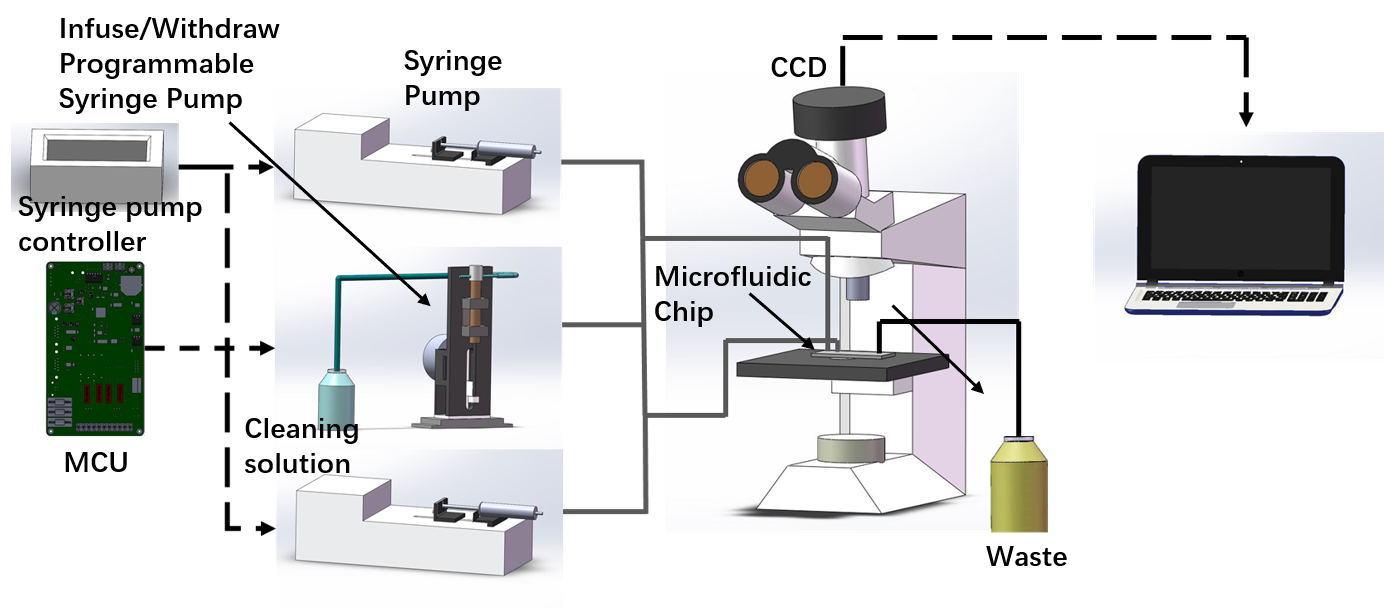
2.1. Microfluidic Chip Setup and Design
2.2. Cell Culture
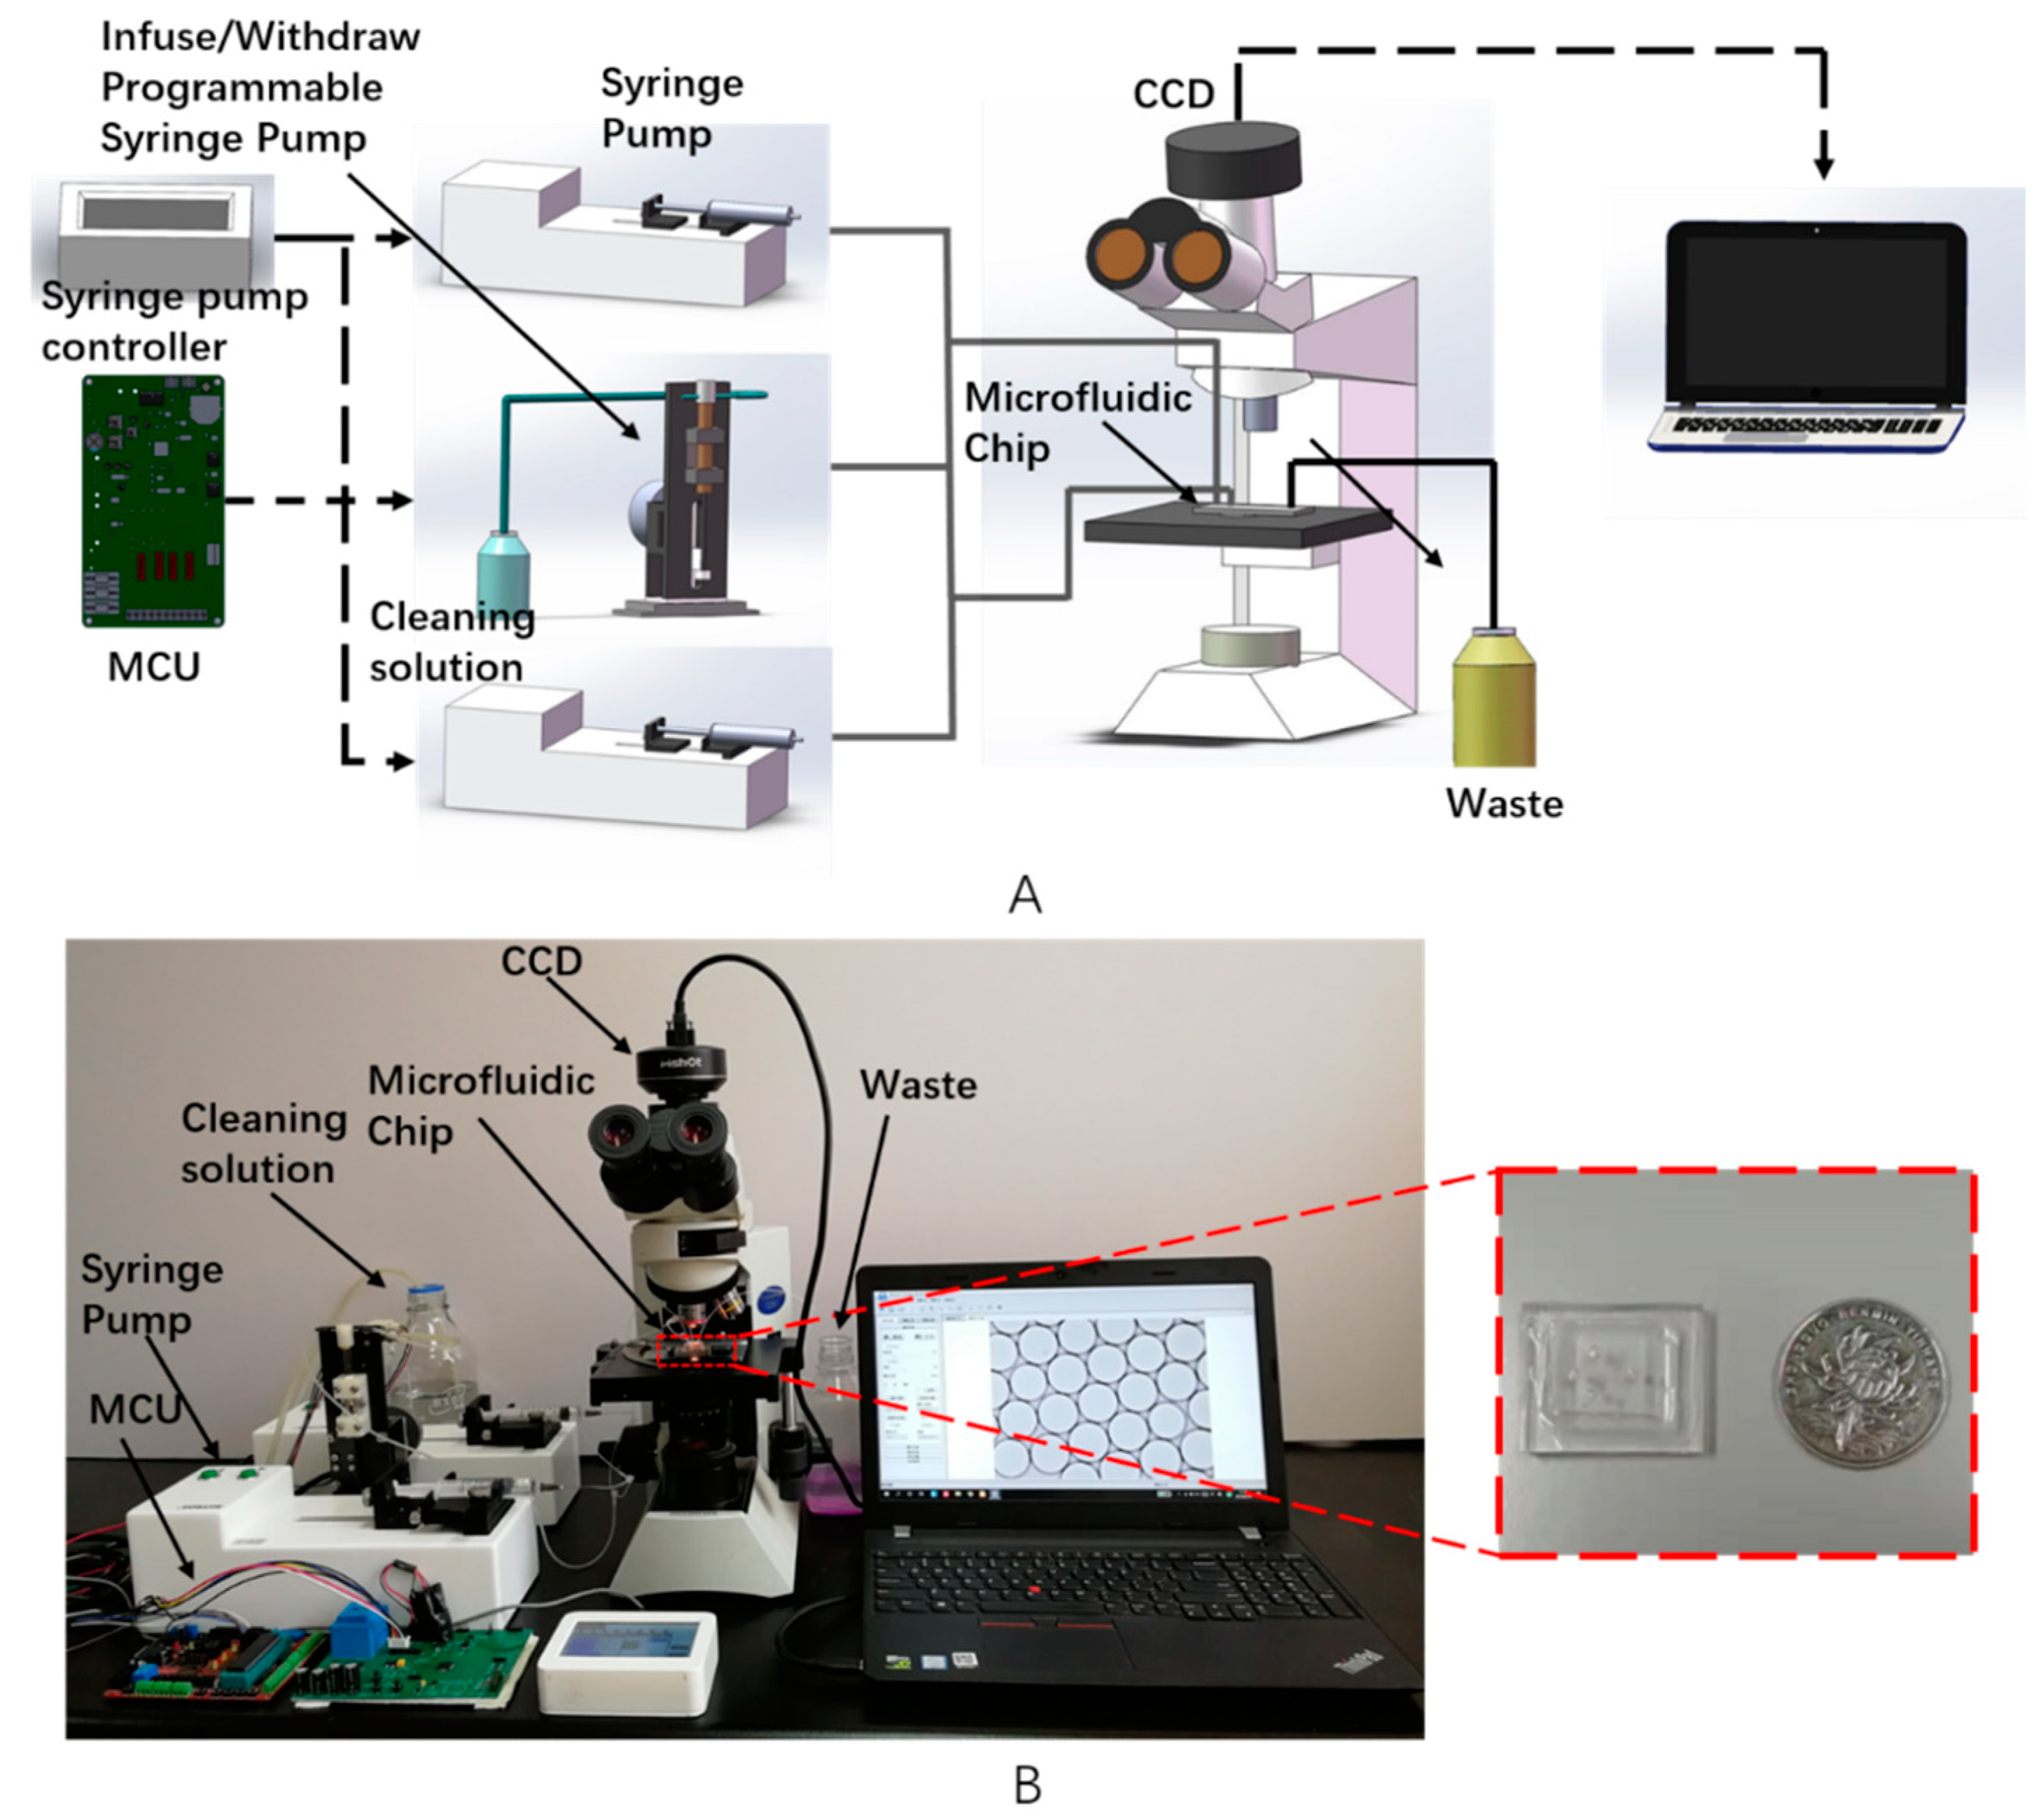
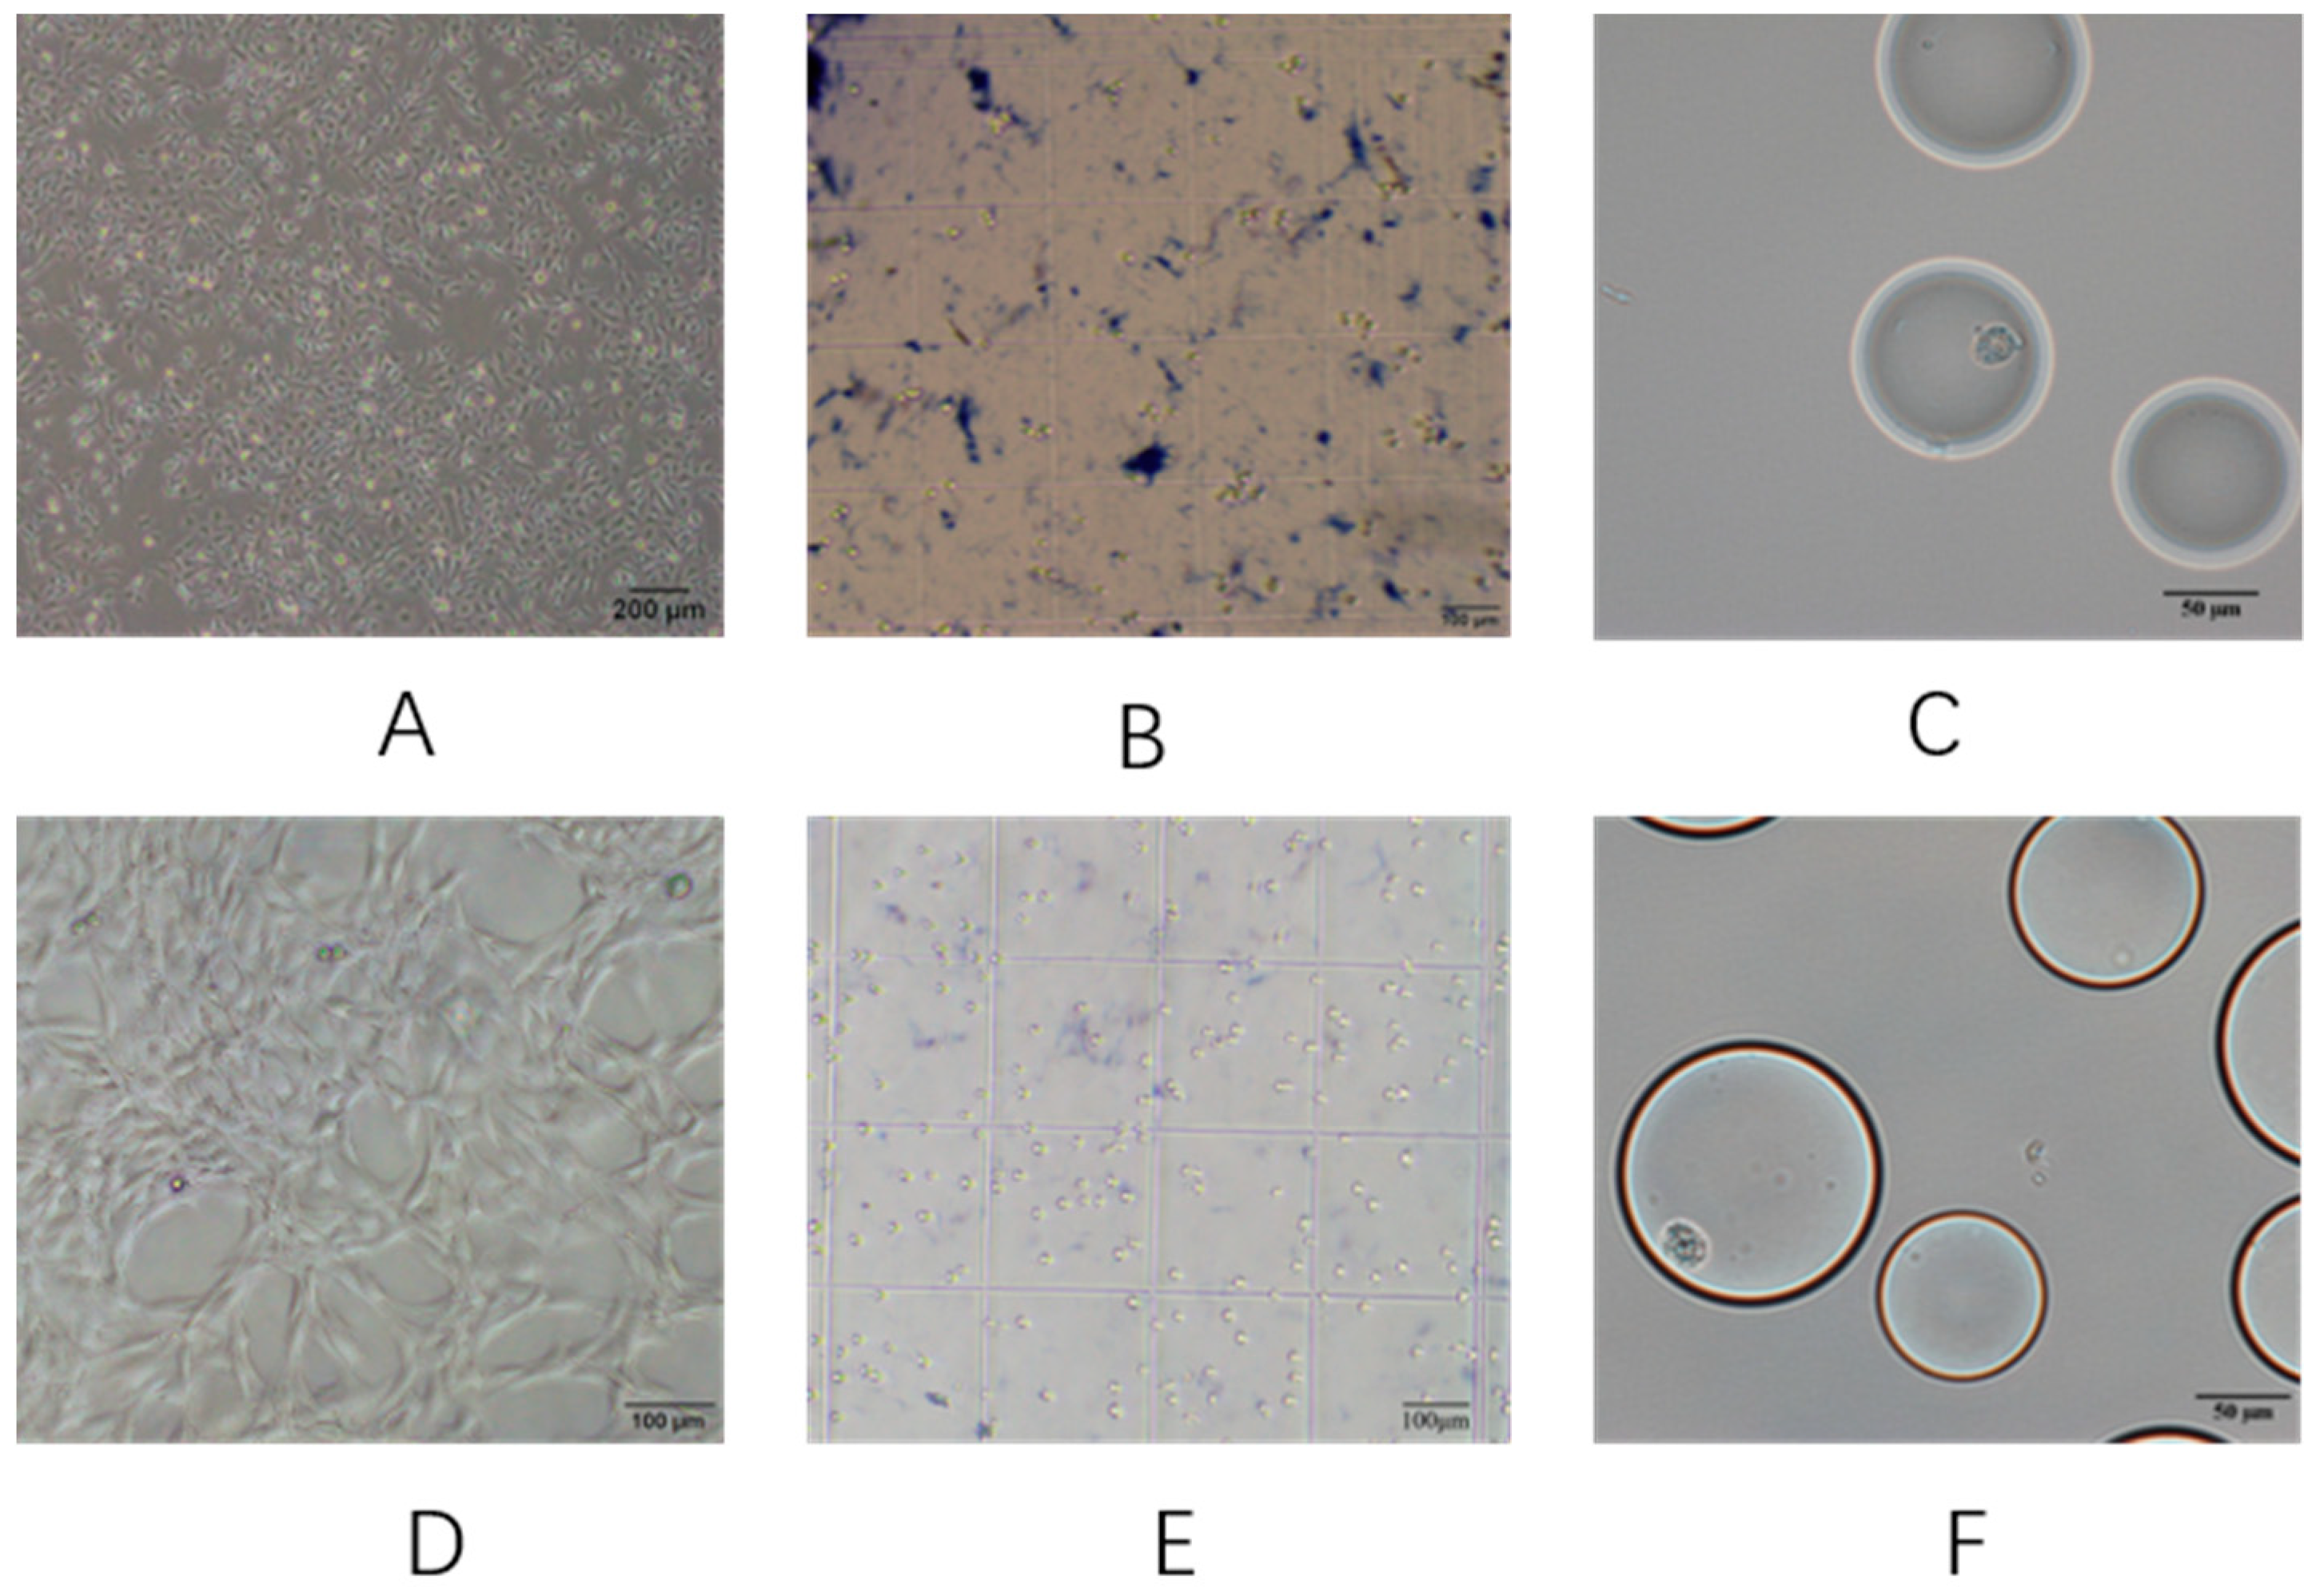
2.3. Trypan Blue Staining
2.4. Image Characteristics of Cells
2.5. Statistical Analysis
3. Results
3.1. Device Setup and Working Principle
3.2. Cell Concentration and Viability
3.3. Analysis of Tumor Cells Based on Cell Image Characteristics
3.4. Performance of Bladder Cancer Cell Detection
4. Discussion
5. Conclusions
Supplementary Materials
Author Contributions
Funding
Acknowledgments
Conflicts of Interest
References
- Shkolyar, E.; Jia, X.; Chang, T.C.; Trivedi, D.; Mach, K.E.; Meng, M.Q.; Xing, L.; Liao, J.C. Augmented Bladder Tumor Detection Using Deep Learning. Eur. Urol. 2019, 76, 714–718. [Google Scholar] [CrossRef] [PubMed]
- Trenti, E.; D’Elia, C.; Mian, C.; Schwienbacher, C.; Hanspeter, E.; Pycha, A.; Kafka, M.; Degener, S.; Danuser, H.; Roth, S.; et al. Diagnostic predictive value of the Bladder EpiCheck test in the follow-up of patients with non-muscle-invasive bladder cancer. Cancer Cytopathol. 2019, 127, 465–469. [Google Scholar] [CrossRef] [PubMed]
- Birkhahn, M.; Mitra, A.P.; Williams, A.J.; Barr, N.J.; Skinner, E.C.; Stein, J.P.; Skinner, D.G.; Tai, Y.C.; Datar, R.H.; Cote, R.J. A novel precision-engineered microfiltration device for capture and characterisation of bladder cancer cells in urine. Eur. J. Cancer 2013, 49, 3159–3168. [Google Scholar] [CrossRef] [PubMed] [Green Version]
- Cho, J.; Oh, K.J.; Jeon, B.C.; Lee, S.G.; Kim, J.H. Comparison of five automated urine sediment analyzers with manual microscopy for accurate identification of urine sediment. Clin. Chem. Lab. Med. 2019, 57, 1744–1753. [Google Scholar] [CrossRef]
- Becker, G.J.; Garigali, G.; Fogazzi, G.B. Advances in Urine Microscopy. Am. J. Kidney Dis. Off. J. Natl. Kidney Found. 2016, 67, 954–964. [Google Scholar] [CrossRef]
- Cho, E.J.; Ko, D.H.; Lee, W.; Chun, S.; Lee, H.K.; Min, W.K. The efficient workflow to decrease the manual microscopic examination of urine sediment using on-screen review of images. Clin. Biochem. 2018, 56, 70–74. [Google Scholar] [CrossRef]
- Kouri, T.T.; Makkonen, P. External quality assessment of urine particle identification: A Northern European experience. Clin. Chem. Lab. Med. 2015, 53, s1489–s1493. [Google Scholar] [CrossRef]
- Scheler, O.; Postek, W.; Garstecki, P. Recent developments of microfluidics as a tool for biotechnology and microbiology. Curr. Opin. Biotechnol. 2019, 55, 60–67. [Google Scholar] [CrossRef]
- Li, M.; van Zee, M.; Riche, C.T.; Tofig, B.; Gallaher, S.D.; Merchant, S.S.; Damoiseaux, R.; Goda, K.; Di Carlo, D. A Gelatin Microdroplet Platform for High-Throughput Sorting of Hyperproducing Single-Cell-Derived Microalgal Clones. Small 2018, 14, e1803315. [Google Scholar] [CrossRef]
- Postel, M.; Roosen, A.; Laurent-Puig, P.; Taly, V.; Wang-Renault, S.F. Droplet-based digital PCR and next generation sequencing for monitoring circulating tumor DNA: A cancer diagnostic perspective. Expert Rev. Mol. Diagn. 2018, 18, 7–17. [Google Scholar] [CrossRef]
- Ng, E.X.; Miller, M.A.; Jing, T.; Chen, C.H. Single cell multiplexed assay for proteolytic activity using droplet microfluidics. Biosens. Bioelectron. 2016, 81, 408–414. [Google Scholar] [CrossRef] [PubMed]
- Courtney, M.; Chen, X.; Chan, S.; Mohamed, T.; Rao, P.P.; Ren, C.L. Droplet Microfluidic System with On-Demand Trapping and Releasing of Droplet for Drug Screening Applications. Anal. Chem. 2017, 89, 910–915. [Google Scholar] [CrossRef] [PubMed]
- Liang, L.G.; Kong, M.Q.; Zhou, S.; Sheng, Y.F.; Wang, P.; Yu, T.; Inci, F.; Kuo, W.P.; Li, L.J.; Demirci, U.; et al. An integrated double-filtration microfluidic device for isolation, enrichment and quantification of urinary extracellular vesicles for detection of bladder cancer. Sci. Rep. 2017, 7, 46224. [Google Scholar] [CrossRef] [PubMed]
- Chen, A.; Fu, G.; Xu, Z.; Sun, Y.; Chen, X.; Cheng, K.S.; Neoh, K.H.; Tang, Z.; Chen, S.; Liu, M.; et al. Detection of Urothelial Bladder Carcinoma via Microfluidic Immunoassay and Single-Cell DNA Copy-Number Alteration Analysis of Captured Urinary-Exfoliated Tumor Cells. Cancer Res. 2018, 78, 4073–4085. [Google Scholar] [CrossRef] [PubMed] [Green Version]
- Kamat, A.M.; Hegarty, P.K.; Gee, J.R.; Clark, P.E.; Svatek, R.S.; Hegarty, N.; Shariat, S.F.; Xylinas, E.; Schmitz-Drager, B.J.; Lotan, Y.; et al. ICUD-EAU International Consultation on Bladder Cancer 2012: Screening, diagnosis, and molecular markers. Eur. Urol. 2013, 63, 4–15. [Google Scholar] [CrossRef] [PubMed]
- Yang, Y.; Zhao, M.; Liu, X.; Ge, P.; Zheng, F.; Chen, T.; Sun, X. Two-way detection of image features and immunolabeling of lymphoma cells with one-step microarray analysis. Biomicrofluidics 2018, 12, 064106. [Google Scholar] [CrossRef]
- Zhao, L.; Zhao, M.; Yang, Y.; Gu, Y.; Zheng, F.; Wang, X.; Zheng, Z.; Sun, X. Label-free microfluidic chip for the identification of mesothelial cell clusters in pleural effusion. Oncol. Lett. 2019, 17, 4532–4544. [Google Scholar] [CrossRef] [Green Version]
- Ringuette Goulet, C.; Bernard, G.; Chabaud, S.; Couture, A.; Langlois, A.; Neveu, B.; Pouliot, F.; Bolduc, S. Tissue-engineered human 3D model of bladder cancer for invasion study and drug discovery. Biomaterials 2017, 145, 233–241. [Google Scholar] [CrossRef]
- Yamaji, M.; Ota, A.; Wahiduzzaman, M.; Karnan, S.; Hyodo, T.; Konishi, H.; Tsuzuki, S.; Hosokawa, Y.; Haniuda, M. Novel ATP-competitive Akt inhibitor afuresertib suppresses the proliferation of malignant pleural mesothelioma cells. Cancer Med. 2017, 6, 2646–2659. [Google Scholar] [CrossRef] [Green Version]
- Zhao, M.; Chen, L.; Bian, L.; Zhang, J.; Yao, C.; Zhang, J. Feature quantification and abnormal detection on cervical squamous epithelial cells. Comput. Math. Methods Med. 2015, 2015, 941680. [Google Scholar] [CrossRef]
- Zhao, M.; Wu, A.; Song, J.; Sun, X.; Dong, N. Automatic screening of cervical cells using block image processing. Biomed. Eng. Online 2016, 15, 14. [Google Scholar] [CrossRef] [PubMed] [Green Version]
- Rodrigues, D.; Jeronimo, C.; Henrique, R.; Belo, L.; de Lourdes Bastos, M.; de Pinho, P.G.; Carvalho, M. Biomarkers in bladder cancer: A metabolomic approach using in vitro and ex vivo model systems. Int. J. Cancer 2016, 139, 256–268. [Google Scholar] [CrossRef] [PubMed] [Green Version]
- Dinges, S.S.; Hohm, A.; Vandergrift, L.A.; Nowak, J.; Habbel, P.; Kaltashov, I.A.; Cheng, L.L. Cancer metabolomic markers in urine: Evidence, techniques and recommendations. Nat. Rev. Urol. 2019, 16, 339–362. [Google Scholar] [CrossRef] [PubMed]
- Di Meo, A.; Bartlett, J.; Cheng, Y.; Pasic, M.D.; Yousef, G.M. Liquid biopsy: A step forward towards precision medicine in urologic malignancies. Mol. Cancer 2017, 16, 80. [Google Scholar] [CrossRef]
- Kassouf, W. The value of urine cytology in the workup of hematuria. Cancer Cytopathol. 2016, 124, 303–304. [Google Scholar] [CrossRef] [Green Version]
- Chu-Su, Y.; Shukuya, K.; Yokoyama, T.; Lin, W.C.; Chiang, C.K.; Lin, C.W. Enhancing the Detection of Dysmorphic Red Blood Cells and Renal Tubular Epithelial Cells with a Modified Urinalysis Protocol. Sci. Rep. 2017, 7, 40521. [Google Scholar] [CrossRef] [Green Version]
- van der Aa, M.N.; Steyerberg, E.W.; Sen, E.F.; Zwarthoff, E.C.; Kirkels, W.J.; van der Kwast, T.H.; Essink-Bot, M.L. Patients’ perceived burden of cystoscopic and urinary surveillance of bladder cancer: A randomized comparison. BJU Int. 2008, 101, 1106–1110. [Google Scholar] [CrossRef]
- Raitanen, M.P.; Aine, R.; Rintala, E.; Kallio, J.; Rajala, P.; Juusela, H.; Tammela, T.L. Differences between local and review urinary cytology in diagnosis of bladder cancer. An interobserver multicenter analysis. Eur. Urol. 2002, 41, 284–289. [Google Scholar] [CrossRef]
- Topcuoglu, C.; Sezer, S.; Kosem, A.; Ercan, M.; Turhan, T. Comparison of vacuum and non-vacuum urine tubes for urinary sediment analysis. Scand. J. Clin. Lab. Investig. 2017, 77, 592–594. [Google Scholar] [CrossRef]
- Zhang, X.; Jiang, L.; Yang, D.; Yan, J.; Lu, X. Urine Sediment Recognition Method Based on Multi-View Deep Residual Learning in Microscopic Image. J. Med Syst. 2019, 43, 325. [Google Scholar] [CrossRef]
- Collins, D.J.; Neild, A.; deMello, A.; Liu, A.Q.; Ai, Y. The Poisson distribution and beyond: Methods for microfluidic droplet production and single cell encapsulation. Lab A Chip 2015, 15, 3439–3459. [Google Scholar] [CrossRef] [PubMed]
- Huang, H.; Yu, Y.; Hu, Y.; He, X.; Berk Usta, O.; Yarmush, M.L. Generation and manipulation of hydrogel microcapsules by droplet-based microfluidics for mammalian cell culture. Lab A Chip 2017, 17, 1913–1932. [Google Scholar] [CrossRef] [PubMed]
- Crawford, D.F.; Smith, C.A.; Whyte, G. Image-based closed-loop feedback for highly mono-dispersed microdroplet production. Sci. Rep. 2017, 7, 10545. [Google Scholar] [CrossRef] [PubMed] [Green Version]
- Zhang, Y.; Minagawa, Y.; Kizoe, H.; Miyazaki, K.; Iino, R.; Ueno, H.; Tabata, K.V.; Shimane, Y.; Noji, H. Accurate high-throughput screening based on digital protein synthesis in a massively parallel femtoliter droplet array. Sci. Adv. 2019, 5, eaav8185. [Google Scholar] [CrossRef] [Green Version]


| Characteristic Parameters | Energy Variance (n = 100) | Color Mean (n = 100) |
|---|---|---|
| T-24 | 7.914 ± 1.665 | 7.067 ± 0.048 |
| MeT-5A | 4.624 ± 1.375 | 7.103 ± 0.036 |
| t | 21.54 | 0.2357 |
| p | 0.000 | 0.814 |
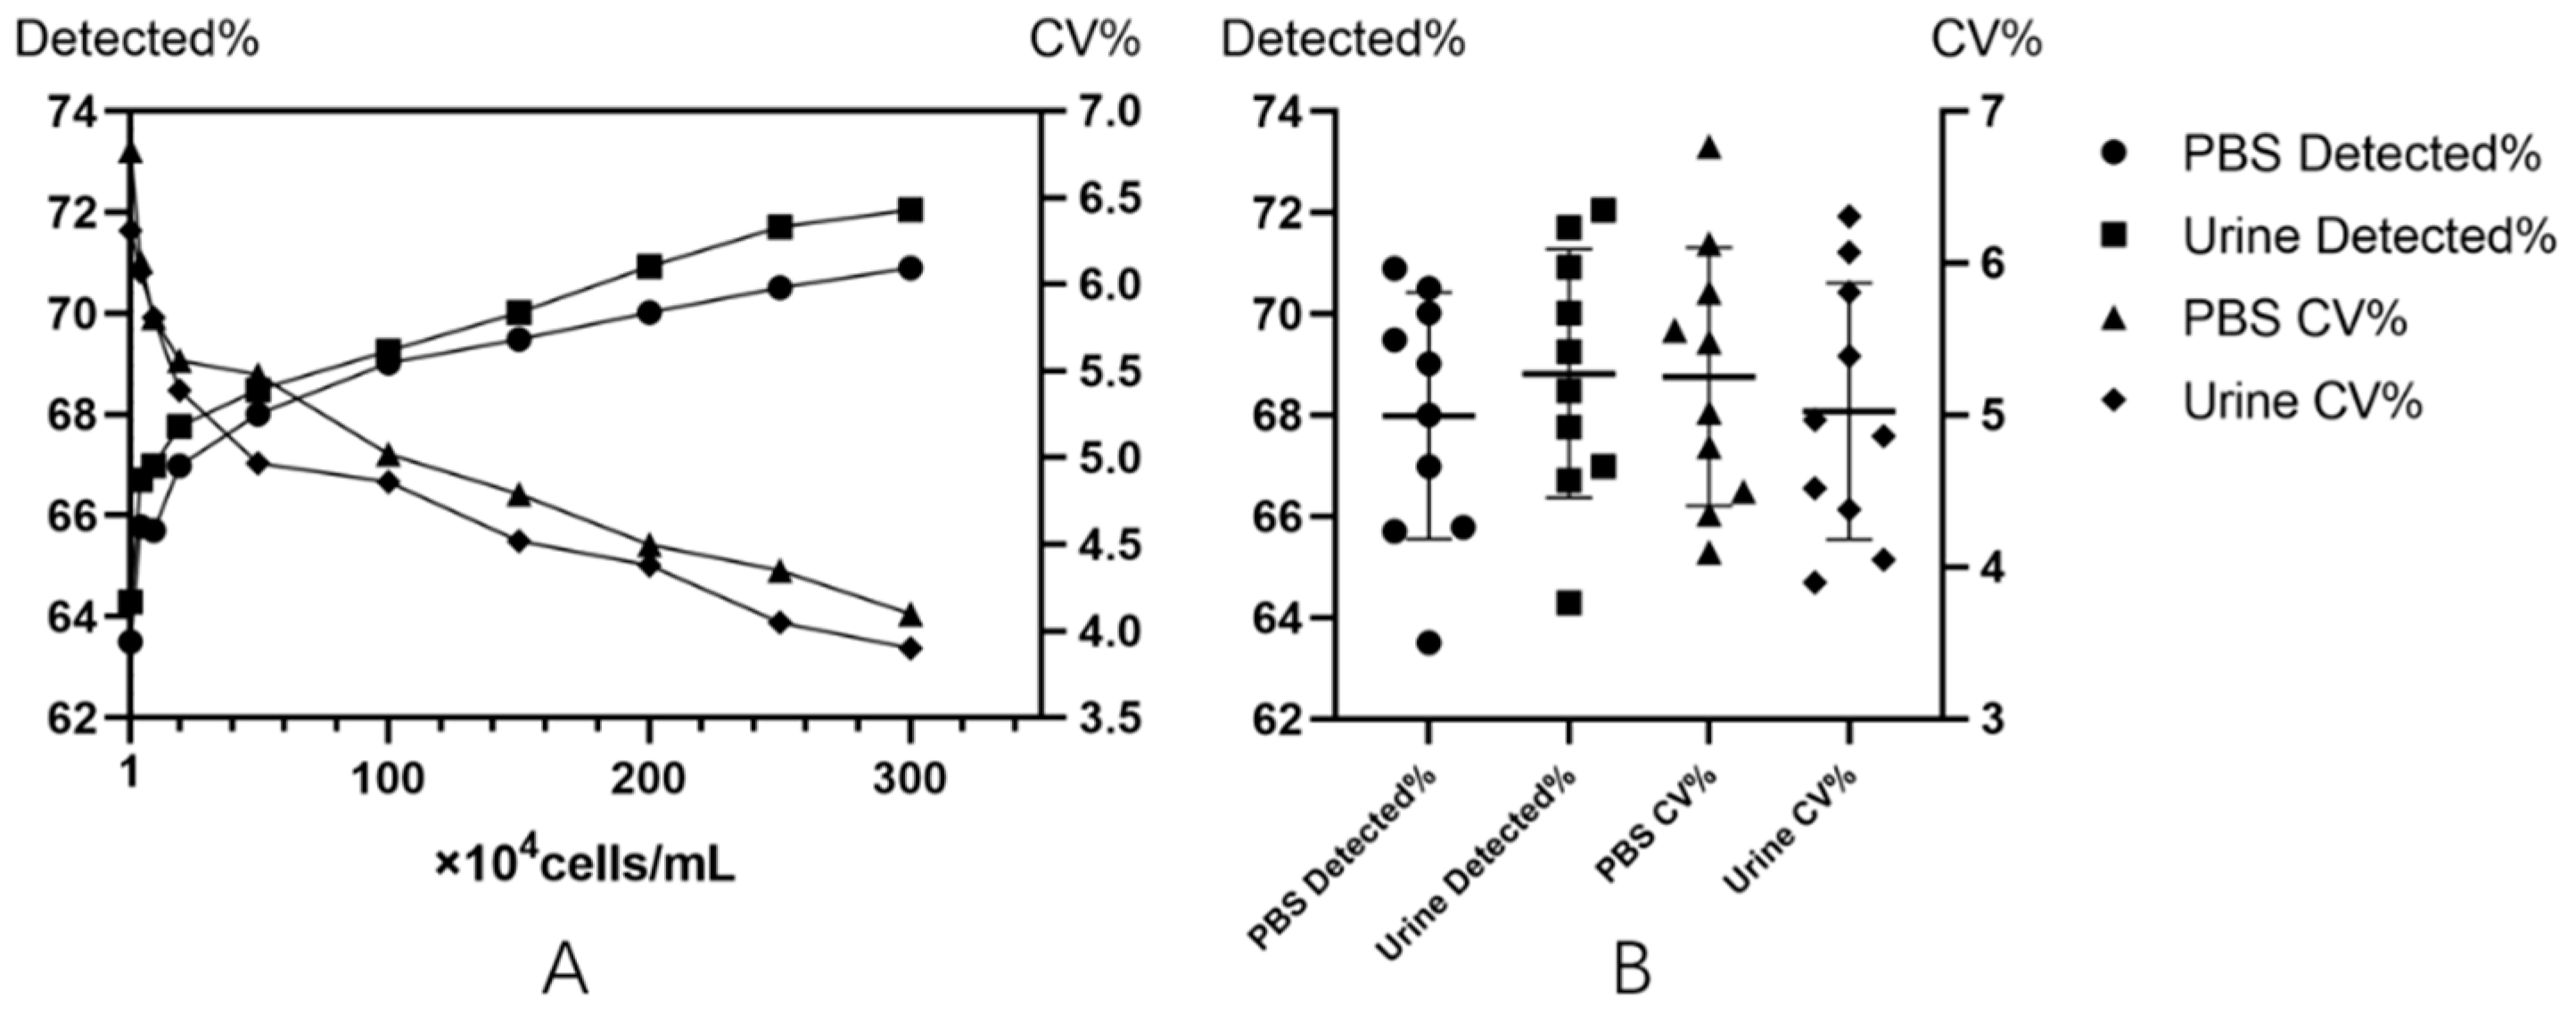
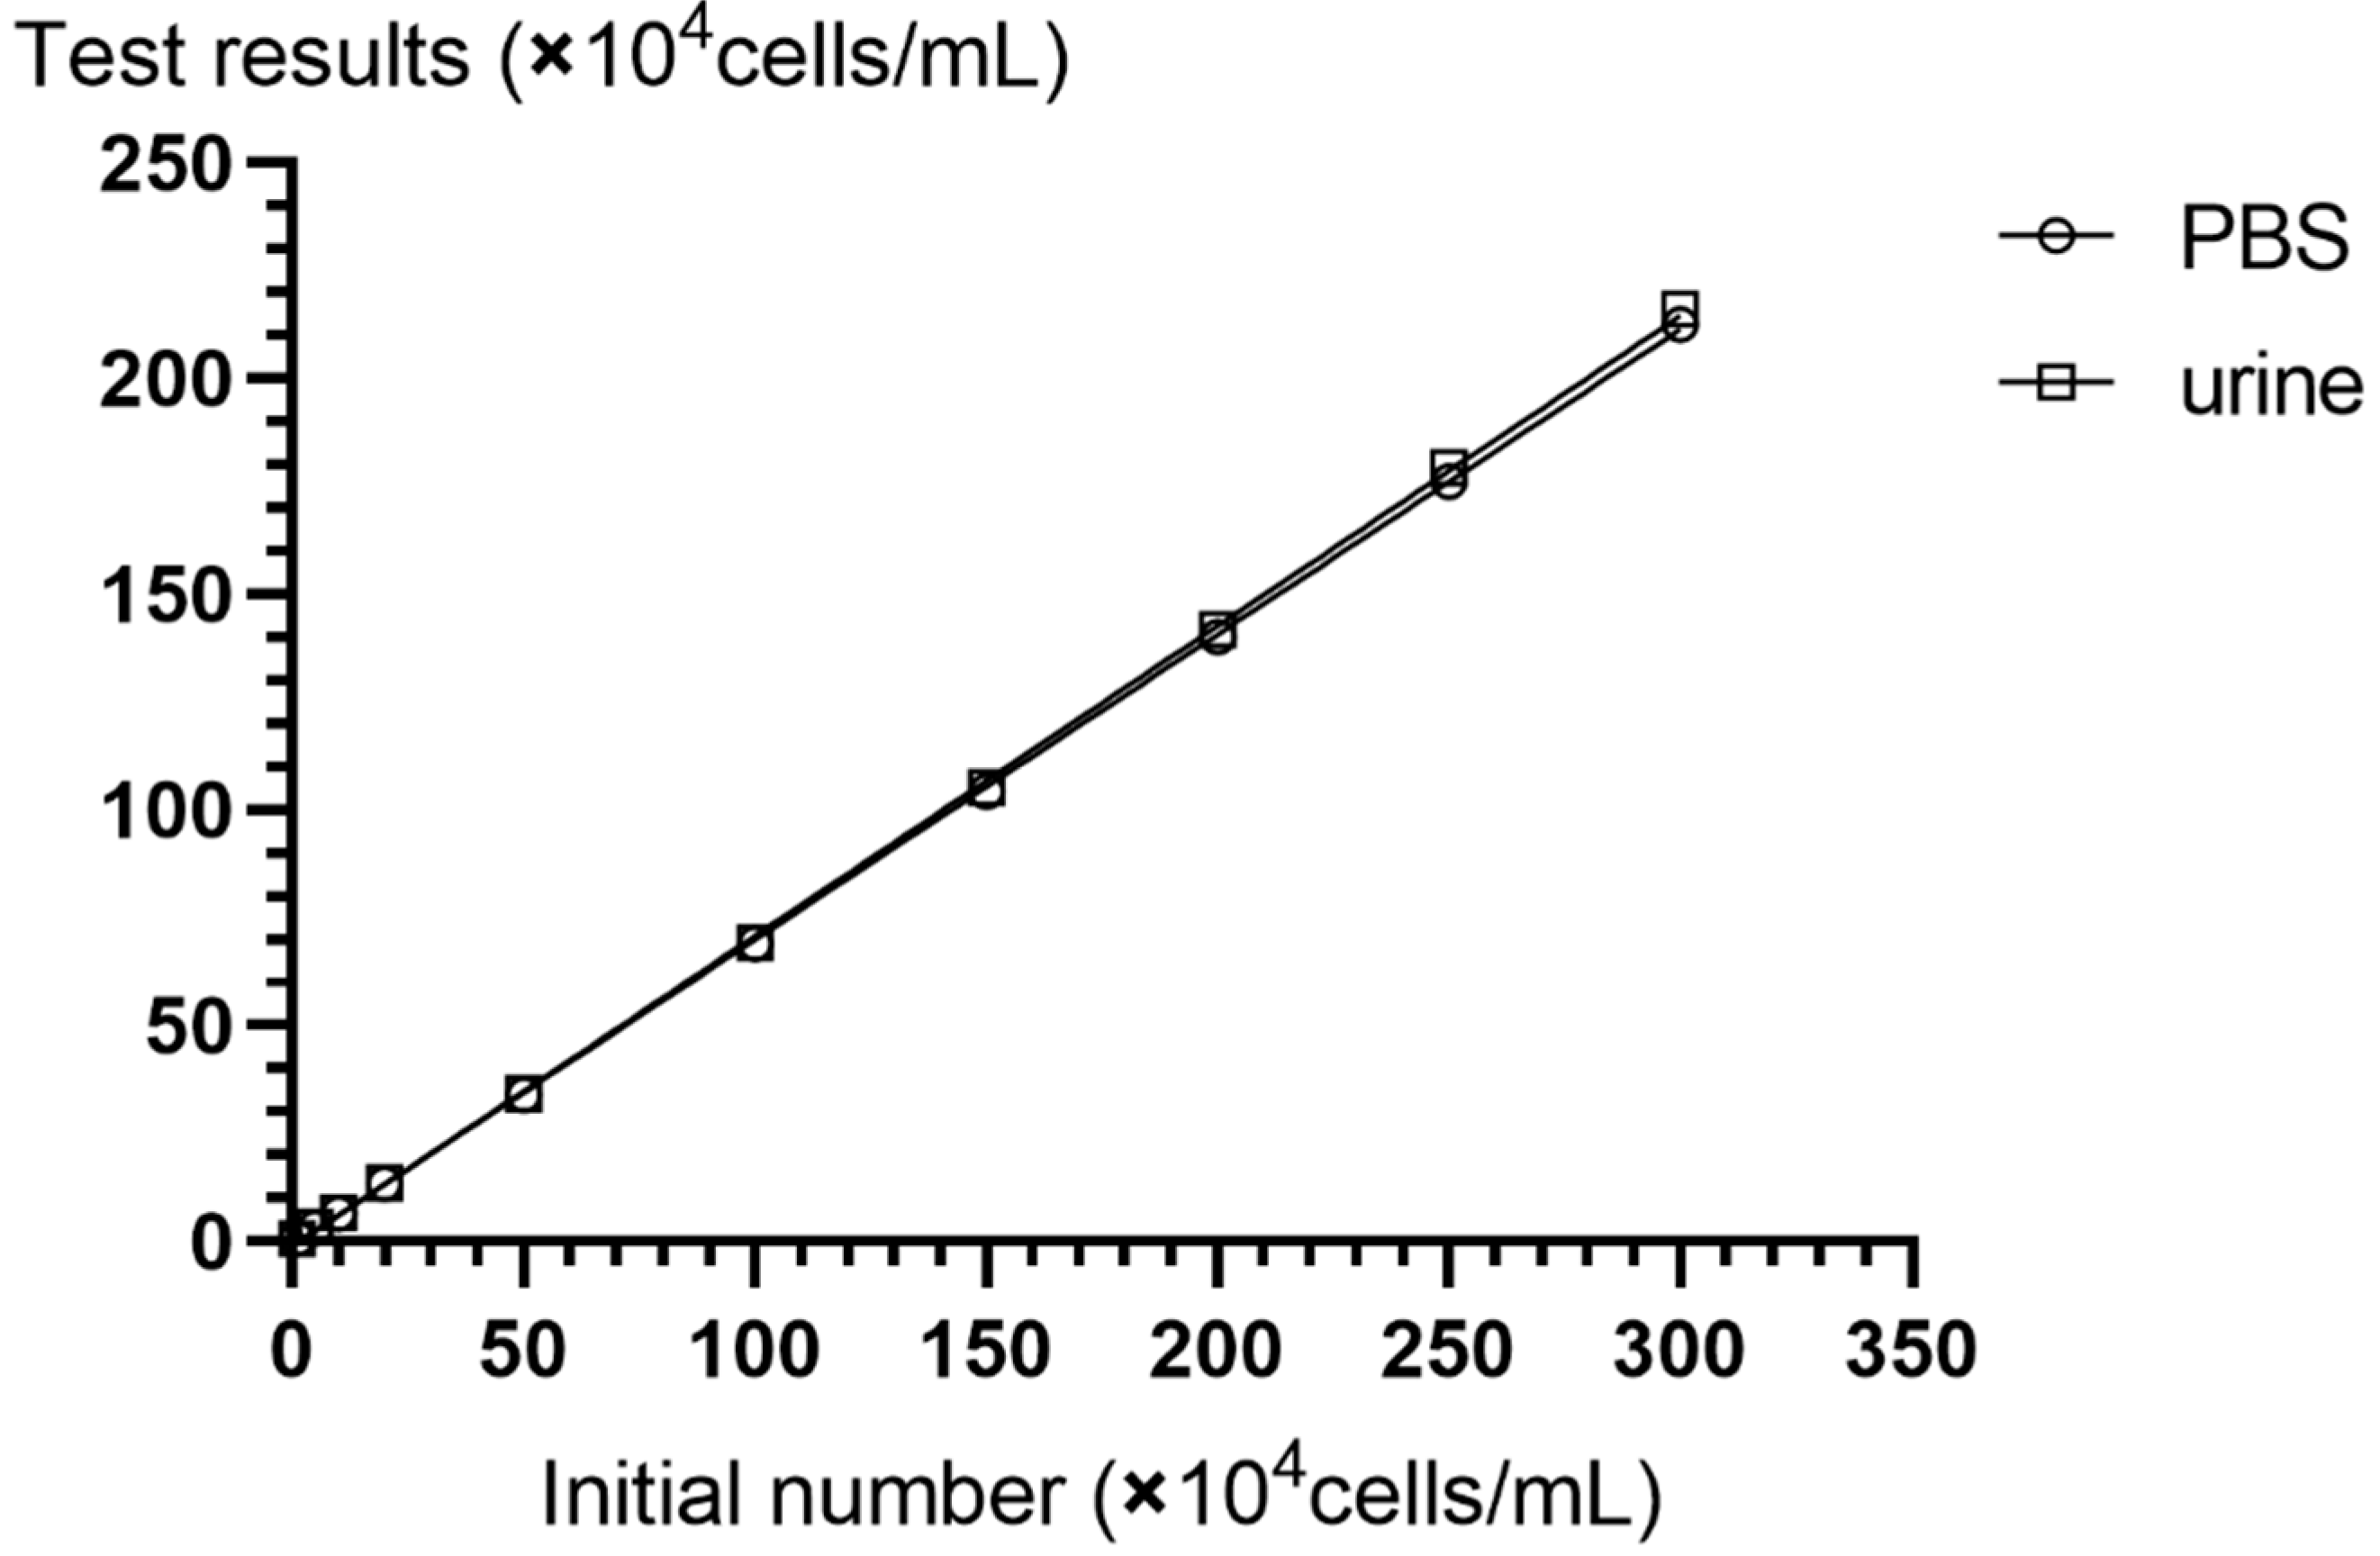
| T24 Cells (104 per mL) | Detected% | CV% | ||||
|---|---|---|---|---|---|---|
| PBS | Urine | PBS | Urine | PBS | Urine | |
| 1 | 0.64 ± 0.04 | 0.64 ± 0.04 | 63.50 | 64.30 | 6.77 | 6.31 |
| 5 | 3.28 ± 0.20 | 3.34 ± 0.20 | 65.78 | 66.71 | 6.13 | 6.07 |
| 10 | 6.58 ± 0.38 | 6.7 ± 0.38 | 65.71 | 66.99 | 5.81 | 5.81 |
| 20 | 13.4 ± 0.74 | 13.56 ± 0.74 | 66.98 | 67.77 | 5.56 | 5.39 |
| 50 | 34 ± 1.86 | 34.24 ± 1.70 | 68.00 | 68.49 | 5.48 | 4.97 |
| 100 | 69 ± 3.46 | 69.2 ± 3.36 | 69.01 | 69.25 | 5.02 | 4.86 |
| 150 | 104.24 ± 5.00 | 105.04 ± 4.74 | 69.49 | 70.02 | 4.79 | 4.52 |
| 200 | 140.02 ± 6.30 | 141.84 ± 6.22 | 70.01 | 70.92 | 4.50 | 4.38 |
| 250 | 176.24 ± 7.66 | 179.24 ± 7.26 | 70.50 | 71.70 | 4.35 | 4.05 |
| 300 | 212.68 ± 8.72 | 216.16 ± 8.44 | 70.89 | 72.05 | 4.10 | 3.90 |
© 2019 by the authors. Licensee MDPI, Basel, Switzerland. This article is an open access article distributed under the terms and conditions of the Creative Commons Attribution (CC BY) license (http://creativecommons.org/licenses/by/4.0/).
Share and Cite
Lv, S.; Yu, J.; Zhao, Y.; Li, H.; Zheng, F.; Liu, N.; Li, D.; Sun, X. A Microfluidic Detection System for Bladder Cancer Tumor Cells. Micromachines 2019, 10, 871. https://doi.org/10.3390/mi10120871
Lv S, Yu J, Zhao Y, Li H, Zheng F, Liu N, Li D, Sun X. A Microfluidic Detection System for Bladder Cancer Tumor Cells. Micromachines. 2019; 10(12):871. https://doi.org/10.3390/mi10120871
Chicago/Turabian StyleLv, Shuxing, Jinwei Yu, Yan Zhao, Hongxiang Li, Fang Zheng, Ning Liu, Dahua Li, and Xuguo Sun. 2019. "A Microfluidic Detection System for Bladder Cancer Tumor Cells" Micromachines 10, no. 12: 871. https://doi.org/10.3390/mi10120871