Mycotoxins in Rice Correlate with Other Contaminants? A Pilot Study of the Portuguese Scenario and Human Risk Assessment

 ,
,  , , and
Abstract
:1. Introduction
2. Results and Discussion
2.1. Frequency and Occurrence
2.1.1. Mycotoxins
Ochratoxin A
Aflatoxin B1
Zearalenone
2.1.2. Inorganic Arsenic
2.1.3. Co-Occurrence and Correlation of Mycotoxins and Inorganic Arsenic
2.2. Estimated Daily Intake and Risk Assessment
2.2.1. Mycotoxins
Aflatoxin B1
Zearalenone
2.2.2. Inorganic Arsenic
3. Conclusions
4. Materials and Methods
4.1. Sampling
4.2. Experimental Procedures
4.2.1. Mycotoxins
4.2.2. Inorganic Arsenic
4.3. Analytical Performance
4.3.1. Mycotoxins
4.3.2. Inorganic Arsenic
4.4. Statistical Analysis
4.5. Calculation of Estimated Daily Intake and Risk Assessment
Author Contributions
Funding
Institutional Review Board Statement
Informed Consent Statement
Data Availability Statement
Conflicts of Interest
References
- Umadevi, M.; Pushpa, R.; Sampathkumar, K.P.; Bhowmik, D. Rice-Traditional Medicinal Plant in India. J. Pharmacogn. Phytochem. 2012, 1, 6–12. [Google Scholar]
- Zhao, M.; Lin, Y.; Chen, H. Improving Nutritional Quality of Rice for Human Health. Theor. Appl. Genet. 2020, 133, 1397–1413. [Google Scholar] [CrossRef] [PubMed]
- European Commission EU Agricultural Outlook for Markets, Income and Environment 2020—2030; Publications Office of the European Union: Luxembourg, 2020; ISBN 978-92-76-25645-8.
- Rohman, A.; Helmiyati, S.; Hapsari, M.; Setyaningrum, D.L. Rice in Health and Nutrition. Int. Food Res. J. 2014, 21, 13–24. [Google Scholar]
- van Dam, R.M. A Global Perspective on White Rice Consumption and Risk of Type 2 Diabetes. Diabetes Care 2020, 43, 2625–2627. [Google Scholar] [CrossRef]
- Menon, M.; Sarkar, B.; Hufton, J.; Reynolds, C.; Reina, S.V.; Young, S. Do Arsenic Levels in Rice Pose a Health Risk to the UK Population? Ecotoxicol. Environ. Saf. 2020, 197, 110601. [Google Scholar] [CrossRef]
- Saleh, A.S.M.; Wang, P.; Wang, N.; Yang, L.; Xiao, Z. Brown Rice Versus White Rice: Nutritional Quality, Potential Health Benefits, Development of Food Products, and Preservation Technologies. Compr. Rev. Food Sci. Food Saf. 2019, 18, 1070–1096. [Google Scholar] [CrossRef]
- Fitzgerald, M.A.; McCouch, S.R.; Hall, R.D. Not Just a Grain of Rice: The Quest for Quality. Trends Plant Sci. 2009, 14, 133–139. [Google Scholar] [CrossRef]
- Lemming, E.W.; Montano Montes, A.; Schmidt, J.; Cramer, B.; Humpf, H.-U.; Moraeus, L.; Olsen, M. Mycotoxins in Blood and Urine of Swedish Adolescents—Possible Associations to Food Intake and Other Background Characteristics. Mycotoxin Res. 2020, 36, 193–206. [Google Scholar] [CrossRef]
- Luo, S.; Du, H.; Kebede, H.; Liu, Y.; Xing, F. Contamination Status of Major Mycotoxins in Agricultural Product and Food Stuff in Europe. Food Control 2021, 127, 108120. [Google Scholar] [CrossRef]
- IARC. Some Traditional Herbal Medicines, Some Mycotoxins, Naphthalene and Styrene. In IARC Monographs on Theevaluation of Carcinogenic Risks to Humans (vol. 82); IARC Press: Lyon, France, 2002; p. 601. [Google Scholar]
- Sun, X.D.; Su, P.; Shan, H. Mycotoxin Contamination of Rice in China. J. Food Sci. 2017, 82, 573–584. [Google Scholar] [CrossRef] [PubMed]
- Juang, K.W.; Chu, L.J.; Syu, C.H.; Chen, B.C. Assessing Human Health Risk of Arsenic for Rice Consumption by an Iron Plaque Based Partition Ratio Model. Sci. Total Environ. 2021, 763, 142973. [Google Scholar] [CrossRef]
- Chanpiwat, P.; Kim, K.-W. Arsenic Health Risk Assessment Related to Rice Consumption Behaviors in Adults Living in Northern Thailand. Environ. Monit. Assess. 2019, 191, 674. [Google Scholar] [CrossRef] [PubMed]
- Majeed, S.; De Boevre, M.; De Saeger, S.; Rauf, W.; Tawab, A.; Fazal-e-Habib; Rahman, M.; Iqbal, M. Multiple Mycotoxins in Rice: Occurrence and Health Risk Assessment in Children and Adults of Punjab, Pakistan. Toxins 2018, 10, 77. [Google Scholar] [CrossRef]
- Alves, S.P.; Brum, D.M.; Branco de Andrade, É.C.; Pereira Netto, A.D. Determination of Synthetic Dyes in Selected Foodstuffs by High Performance Liquid Chromatography with UV-DAD Detection. Food Chem. 2008, 107, 489–496. [Google Scholar] [CrossRef]
- EC, E.C. Commission Regulation (EC) No 165/2010 of 26 February 2010, Amending Regulation (EC) No 1881/2006setting Maximum Levels for Certain Contaminants in Foodstuffs as Regards Aflatoxins. Off. J. Eur. Union. 2010, 50, 8–12. [Google Scholar]
- EC, E.C. Commission Regulation (EC) No 1881/2006 of 19 December 2006 Setting Maximum Levels for Certain Contaminants in Foodstuffs. Off. J. Eur. Union 2006, 49, 5–24. [Google Scholar]
- EC, E.C. Commission Regulation (EU) 2015/1006 of 25 June 2015 Amending Regulation (EC) No 1881/2006 as Regards Maximum Levels of Inorganic Arsenic in Foodstuffs. Off. J. Eur. Union 2015, L 161/14, 14–16. [Google Scholar]
- Tanaka, K.; Sago, Y.; Zheng, Y.; Nakagawa, H.; Kushiro, M. Mycotoxins in Rice. Int. J. Food Microbiol. 2007, 119, 59–66. [Google Scholar] [CrossRef] [PubMed]
- Reiter, E.V.; Vouk, F.; Böhm, J.; Razzazi-Fazeli, E. Aflatoxins in Rice—A Limited Survey of Products Marketed in Austria. Food Control 2010, 21, 988–991. [Google Scholar] [CrossRef]
- Bansal, J.; Pantazopoulos, P.; Tam, J.; Cavlovic, P.; Kwong, K.; Turcotte, A.-M.; Lau, B.P.-Y.; Scott, P.M. Surveys of Rice Sold in Canada for Aflatoxins, Ochratoxin A and Fumonisins. Food Addit. Contam. Part A 2011, 28, 767–774. [Google Scholar] [CrossRef]
- Lai, X.; Liu, R.; Ruan, C.; Zhang, H.; Liu, C. Occurrence of Aflatoxins and Ochratoxin A in Rice Samples from Six Provinces in China. Food Control 2015, 50, 401–404. [Google Scholar] [CrossRef]
- Sun, G.; Wang, S.; Hu, X.; Su, J.; Zhang, Y.; Xie, Y.; Zhang, H.; Tang, L.; Wang, J.S. Co-Contamination of Aflatoxin B1 and Fumonisin B1 in Food and Human Dietary Exposure in Three Areas of China. Food Addit. Contam.—Part A Chem. Anal. Control. Expo. Risk Assess. 2011, 28, 461–470. [Google Scholar] [CrossRef] [PubMed]
- Liu, Z.; Gao, J.; Yu, J. Aflatoxins in Stored Maize and Rice Grains in Liaoning Province, China. J. Stored Prod. Res. 2006, 42, 468–479. [Google Scholar] [CrossRef]
- Sales, A.C.; Yoshizawa, T. Updated Profile of Aflatoxin and Aspergillus Section Flavi Contamination in Rice and Its Byproducts from the Philippines. Food Addit. Contam. 2005, 22, 429–436. [Google Scholar] [CrossRef] [PubMed]
- Eslami, M.; Mashak, Z.; Heshmati, A.; Shokrzadeh, M.; Mozaffari Nejad, A.S. Determination of Aflatoxin B1 Levels in Iranian Rice by ELISA Method. Toxin Rev. 2015, 34, 125–128. [Google Scholar] [CrossRef]
- Mazaheri, M. Determination of Aflatoxins in Imported Rice to Iran. Food Chem. Toxicol. 2009, 47, 2064–2066. [Google Scholar] [CrossRef]
- Reddy, K.R.N.; Farhana, N.I.; Salleh, B. Occurrence of Aspergillus Spp. and Aflatoxin B1 in Malaysian Foods Used for Human Consumption. J. Food Sci. 2011, 76, T99–T104. [Google Scholar] [CrossRef]
- Iqbal, S.Z.; Asi, M.R.; Hanif, U.; Zuber, M.; Jinap, S. The Presence of Aflatoxins and Ochratoxin A in Rice and Rice Products; and Evaluation of Dietary Intake. Food Chem. 2016, 210, 135–140. [Google Scholar] [CrossRef]
- Iqbal, J.; Asghar, M.A.; Ahmed, A.; Khan, M.A.; Jamil, K. Aflatoxins Contamination in Pakistani Brown Rice: A Comparison of TLC, HPLC, LC-MS/MS and ELISA Techniques. Toxicol. Mech. Methods 2014, 24, 544–551. [Google Scholar] [CrossRef]
- Lutfullah, G.; Hussain, A. Studies on Contamination Level of Aflatoxins in Some Cereals and Beans of Pakistan. Food Control 2012, 23, 32–36. [Google Scholar] [CrossRef]
- Ghali, R.; Khlifa, K.H.; Ghorbel, H.; Maaroufi, K.; Hedilli, A. Aflatoxin Determination in Commonly Consumed Foods in Tunisia. J. Sci. Food Agric. 2010, 90, 2347–2351. [Google Scholar] [CrossRef] [PubMed]
- Aydin, A.; Aksu, H.; Gunsen, U. Mycotoxin Levels and Incidence of Mould in Turkish Rice. Environ. Monit. Assess. 2011, 178, 271–280. [Google Scholar] [CrossRef]
- Nguyen, M.T.; Tozlovanu, M.; Tran, T.L.; Pfohl-Leszkowicz, A. Occurrence of Aflatoxin B1, Citrinin and Ochratoxin A in Rice in Five Provinces of the Central Region of Vietnam. Food Chem. 2007, 105, 42–47. [Google Scholar] [CrossRef]
- Almeida, M.I.; Almeida, N.G.; Carvalho, K.L.; Gonçalves, G.A.A.; Silva, C.N.; Santos, E.A.; Garcia, J.C.; Vargas, E.A. Co-Occurrence of Aflatoxins B 1, B 2, G 1 and G 2, Ochratoxin A, Zearalenone, Deoxynivalenol, and Citreoviridin in Rice in Brazil. Food Addit. Contam. Part A 2012, 29, 694–703. [Google Scholar] [CrossRef] [PubMed]
- Vega, M.; Muñoz, K.; Sepúlveda, C.; Aranda, M.; Campos, V.; Villegas, R.; Villarroel, O. Solid-Phase Extraction and HPLC Determination of Ochratoxin A in Cereals Products on Chilean Market. Food Control 2009, 20, 631–634. [Google Scholar] [CrossRef]
- Rahimi, E. The Occurrence of Ochratoxin A in Rice in Six Provinces of Iran. Toxicol. Ind. Health 2016, 32, 1324–1327. [Google Scholar] [CrossRef]
- Sangare-Tigori, B.; Dem, A.A.; Kouadio, H.J.; Betbeder, A.-M.; Dano, D.S.; Moukha, S.; Creppy, E.E. Preliminary Survey of Ochratoxin A in Millet, Maize, Rice and Peanuts in Côte d’Ivoire from 1998 to 2002. Hum. Exp. Toxicol. 2006, 25, 211–216. [Google Scholar] [CrossRef]
- Arne Dübecke, M.S. Simultaneous Multi- Residue Determination of Mycotoxins in Foods Using LC-MS/MS. J. Environ. Anal. Toxicol. 2014, 05, 1000259. [Google Scholar] [CrossRef]
- Zinedine, A.; Soriano, J.M.; Juan, C.; Mojemmi, B.; Moltó, J.C.; Bouklouze, A.; Cherrah, Y.; Idrissi, L.; El Aouad, R.; Mañes, J. Incidence of Ochratoxin A in Rice and Dried Fruits from Rabat and Salé Area, Morocco. Food Addit. Contam. 2007, 24, 285–291. [Google Scholar] [CrossRef]
- Pena, A.; Cerejo, F.; Lino, C.; Silveira, I. Determination of Ochratoxin A in Portuguese Rice Samples by High Performance Liquid Chromatography with Fluorescence Detection. Anal. Bioanal. Chem. 2005, 382, 1288–1293. [Google Scholar] [CrossRef] [PubMed]
- Juan, C.; Moltó, J.C.; Lino, C.M.; Mañes, J. Determination of Ochratoxin A in Organic and Non-Organic Cereals and Cereal Products from Spain and Portugal. Food Chem. 2008, 107, 525–530. [Google Scholar] [CrossRef]
- Lim, C.W.; Yoshinari, T.; Layne, J.; Chan, S.H. Multi-Mycotoxin Screening Reveals Separate Occurrence of Aflatoxins and Ochratoxin A in Asian Rice. J. Agric. Food Chem. 2015, 63, 3104–3113. [Google Scholar] [CrossRef]
- Park, J.W.; Choi, S.; Hwang, H.; Kim, Y. Fungal Mycoflora and Mycotoxins in Korean Polished Rice Destined for Humans. Int. J. Food Microbiol. 2005, 103, 305–314. [Google Scholar] [CrossRef] [PubMed]
- González, L.; Juan, C.; Soriano, J.M.; Moltó, J.C.; Mañes, J. Occurrence and Daily Intake of Ochratoxin A of Organic and Non-Organic Rice and Rice Products. Int. J. Food Microbiol. 2006, 107, 223–227. [Google Scholar] [CrossRef]
- Ghali, R.; Hmaissia-khlifa, K.; Ghorbel, H.; Maaroufi, K.; Hedili, A. Incidence of Aflatoxins, Ochratoxin A and Zearalenone in Tunisian Foods. Food Control 2008, 19, 921–924. [Google Scholar] [CrossRef]
- Zaied, C.; Abid, S.; Zorgui, L.; Bouaziz, C.; Chouchane, S.; Jomaa, M.; BACHA, H. Natural Occurrence of Ochratoxin A in Tunisian Cereals. Food Control 2009, 20, 218–222. [Google Scholar] [CrossRef]
- Buyukunal, S.K.; Kahraman, T.; Ciftcioglu, G.R. Occurrence of AF, AFB1, OTA in Rice Commercialized in Eastern Turkey. Polish J. Environ. Stud. 2010, 19, 907–912. [Google Scholar]
- Sangare-Tigori, B.; Moukha, S.; Kouadio, H.J.; Betbeder, A.; Dano, D.S.; Creppy, E.E. Co-Occurrence of Aflatoxin B 1, Fumonisin B 1, Ochratoxin A and Zearalenone in Cereals and Peanuts from Côte d’Ivoire. Food Addit. Contam. 2006, 23, 1000–1007. [Google Scholar] [CrossRef]
- Manizan, A.L.; Oplatowska-Stachowiak, M.; Piro-Metayer, I.; Campbell, K.; Koffi-Nevry, R.; Elliott, C.; Akaki, D.; Montet, D.; Brabet, C. Multi-Mycotoxin Determination in Rice, Maize and Peanut Products Most Consumed in Côte d’Ivoire by UHPLC-MS/MS. Food Control 2018, 87, 22–30. [Google Scholar] [CrossRef]
- da Silva, L.P.; Madureira, F.; de Azevedo Vargas, E.; Faria, A.F.; Augusti, R. Development and Validation of a Multianalyte Method for Quantification of Mycotoxins and Pesticides in Rice Using a Simple Dilute and Shoot Procedure and UHPLC-MS/MS. Food Chem. 2019, 270, 420–427. [Google Scholar] [CrossRef]
- Do, T.H.; Tran, S.C.; Le, C.D.; Nguyen, H.-B.T.; Le, P.-T.T.; Le, H.-H.T.; Le, T.D.; Thai-Nguyen, H.-T. Dietary Exposure and Health Risk Characterization of Aflatoxin B1, Ochratoxin A, Fumonisin B1, and Zearalenone in Food from Different Provinces in Northern Vietnam. Food Control 2020, 112, 107108. [Google Scholar] [CrossRef]
- Mahdjoubi, C.K.; Arroyo-manzanares, N.; Hamini-kadar, N. Multi-Mycotoxin Occurrence and Exposure. Toxins 2020, 12, 194. [Google Scholar] [CrossRef]
- Ruttens, A.; Cheyns, K.; Blanpain, A.C.; De Temmerman, L.; Waegeneers, N. Arsenic Speciation in Food in Belgium. Part 2: Cereals and Cereal Products. Food Chem. Toxicol. 2018, 118, 32–41. [Google Scholar] [CrossRef]
- Mataveli, L.R.V.; Buzzo, M.L.; De Arauz, L.J.; Carvalho, M.D.F.H.; Arakaki, E.E.K.; Matsuzaki, R.; Tiglea, P. Total Arsenic, Cadmium, and Lead Determination in Brazilian Rice Samples Using ICP-MS. J. Anal. Methods Chem. 2016, 2016, 3968786. [Google Scholar] [CrossRef]
- Rintala, E.M.; Ekholm, P.; Koivisto, P.; Peltonen, K.; Venäläinen, E.R. The Intake of Inorganic Arsenic from Long Grain Rice and Rice-Based Baby Food in Finland—Low Safety Margin Warrants Follow Up. Food Chem. 2014, 150, 199–205. [Google Scholar] [CrossRef]
- Rego, A.; Mota, C.; Gueifão, S.; Ventura, M.; Delgado, I.; Lopes, J.; Matos, A.; Castanheira, I. Amino Acid Contents and Toxically Relevant Arsenic of Rice Varieties Consumed in Portugal. Meas. J. Int. Meas. Confed. 2018, 113, 189–195. [Google Scholar] [CrossRef]
- Šlejkovec, Z.; Gorše, L.; Grobler, A.; Jagodic, M.; Falnoga, I. Arsenic Speciation and Elemental Composition of Rice Samples from the Slovenian Market. Food Chem. 2021, 342, 128348. [Google Scholar] [CrossRef]
- Torres-Escribano, S.; Leal, M.; Vélez, D.; Montoro, R. Total and Inorganic Arsenic Concentrations in Rice Sold in Spain, Effect of Cooking, and Risk Assessments. Environ. Sci. Technol. 2008, 42, 3867–3872. [Google Scholar] [CrossRef] [PubMed]
- González, N.; Calderón, J.; Rúbies, A.; Bosch, J.; Timoner, I.; Castell, V.; Marquès, M.; Nadal, M.; Domingo, J.L. Dietary Exposure to Total and Inorganic Arsenic via Rice and Rice-Based Products Consumption. Food Chem. Toxicol. 2020, 141, 111420. [Google Scholar] [CrossRef] [PubMed]
- Guillod-Magnin, R.; Brüschweiler, B.J.; Aubert, R.; Haldimann, M. Arsenic Species in Rice and Rice-Based Products Consumed by Toddlers in Switzerland. Food Addit. Contam.—Part A Chem. Anal. Control. Expo. Risk Assess. 2018, 35, 1164–1178. [Google Scholar] [CrossRef] [PubMed]
- Kukusamude, C.; Sricharoen, P.; Limchoowong, N.; Kongsri, S. Heavy Metals and Probabilistic Risk Assessment via Rice Consumption in Thailand. Food Chem. 2021, 334, 127402. [Google Scholar] [CrossRef] [PubMed]
- Lamont, W.H. Concentration of Inorganic Arsenic in Samples of White Rice from the United States. J. Food Compos. Anal. 2003, 16, 687–695. [Google Scholar] [CrossRef]
- Chandravarnan, P.; Agyei, D.; Ali, A. Green and Sustainable Technologies for the Decontamination of Fungi and Mycotoxins in Rice: A Review. Trends Food Sci. Technol. 2022, 124, 278–295. [Google Scholar] [CrossRef]
- Ferre, F.S. Worldwide Occurrence of Mycotoxins in Rice. Food Control 2016, 62, 291–298. [Google Scholar] [CrossRef]
- Suriyagoda, L.D.B.; Dittert, K.; Lambers, H. Mechanism of Arsenic Uptake, Translocation and Plant Resistance to Accumulate Arsenic in Rice Grains. Agric. Ecosyst. Environ. 2018, 253, 23–37. [Google Scholar] [CrossRef]
- Carey, M.; Meharg, C.; Williams, P.; Marwa, E.; Jiujin, X.; Farias, J.G.; De Silva, P.M.C.S.; Signes-Pastor, A.; Lu, Y.; Nicoloso, F.T.; et al. Global Sourcing of Low-Inorganic Arsenic Rice Grain. Expo. Heal. 2020, 12, 711–719. [Google Scholar] [CrossRef]
- Zhao, Y.; Wang, Q.; Huang, J.; Chen, Z.; Liu, S.; Wang, X.; Wang, F. Mycotoxin Contamination and Presence of Mycobiota in Rice Sold for Human Consumption in China. Food Control 2019, 98, 19–23. [Google Scholar] [CrossRef]
- Lopes, C.; Torres, D.; Oliveira, A.; Severo, M.; Alarcão, V.; Guiomar, S.; Mota, J.; Teixeira, P.; Rodrigues, S.; Lobato, L.; et al. Inquérito Alimentar Nacional e de Atividade Física IAN-AF, 2015-2016. Oporto Univ. 2017, 112, 211–212. [Google Scholar]
- Miraglia, M.; Van Edmond, H.; Brera, C.G.J. (Eds.) Kuiper-Goodman Food Safety: Mycotoxins and Phycotoxins in Perspective. In Mycotoxins and Phycotoxins—Developments in Chemistry, Toxicology and Food Safety; Alaken Inc.: Fort Collins, CO, USA, 1998; pp. 25–48. [Google Scholar]
- EFSA Opinion of the Scientific Committee on a Request from EFSA Related to A Harmonised Approach for Risk Assessment of Substances Which Are Both Genotoxic and Carcinogenic. EFSA J. 2005, 3, 282. [CrossRef]
- EFSA Appropriateness to Set a Group Health-based Guidance Value for Zearalenone and Its Modified Forms. EFSA J. 2016, 14, 4425. [CrossRef]
- EFSA Scientific Opinion on Arsenic in Food. EFSA J. 2009, 7, 1351. [CrossRef]
- Silva, A.; Pereira, A.; Silva, L.; Pena, A. Arsenic in Portuguese Rice: Is There Any Risk? Foods 2022, 11, 277. [Google Scholar] [CrossRef] [PubMed]
- Arezes, P.M.; Barroso, M.P.; Cordeiro, P.; Costa, L.G.; Miguel, A.S. Estudo Antropométrico da População Portuguesa, 1st ed.; Instituto para a Segurança, Higiene e Saúde no Trabalho: Lisboa, Portugal, 2006. [Google Scholar]
- DGS (Direcção-Geral da Saúde). Circular Normativa No: 05/DSMIA. Consultas de Vigilância de Saúde Infantil e Juvenil—Actualização das Curvas de Crescimento; DGS: Lisboa, Portugal, 2006.
- EFSA. Management of Left-censored Data in Dietary Exposure Assessment of Chemical Substances. EFSA J. 2010, 8, 1557. [Google Scholar] [CrossRef]
- EFSA. Opinion of the Scientific Panel on Contaminants in the Food Chain [CONTAM] Related to the Potential Increase of Consumer Health Risk by a Possible Increase of the Existing Maximum Levels for Aflatoxins in Almonds, Hazelnuts and Pistachios and Derived Prod. EFSA J. 2007, 5, 446. [Google Scholar] [CrossRef]


| Country | Sample Type | Methodology | LOQ (LOD) (µg kg−1) | N Samples | Frequency (%) | Levels (µg kg−1) | Reference | ||
|---|---|---|---|---|---|---|---|---|---|
| Min. | Máx. | Average | |||||||
| Aflatoxins | |||||||||
| Austria | Rice | SPE(IAC)-LC-FD | 0.44 (0.1) | 81 | 29.6 | <LOQ | 9.86 | ns | [21] |
| Canada | Rice | LC-MS | 0.05 (0.002) | 200 | 49.5 | 1.44 | 7.14 | 0.18 | [22] |
| China | Rice | LLME-LC-FD | 0.03 (0.009) | 370 | 63.5 | 0.030 | 20.0 | 0.60 | [23] |
| China | Rice | ELISA/HPLC | (0.1) | 29 | 100 | 0.1 | 1.4 | 0.5 | [24] |
| China | Rice | SLE-LC-FD | (0.05) | 37 | 97.3 | 21 | 30 | 0.88 | [25] |
| Philippines | Rice | SPE(IAC)-LC-FD | (0.025) | 78 | 95 | ND | 8.33 | 1.48 | [26] |
| Iran | Rice | ELISA | ns | 40 | 100 | 0.29 | 2.92 | 2.09 | [27] |
| Iran | Rice | SPE(IAC)-LC-FD | (0.1) | 71 | 83 | ND | 10 | 1.89 | [28] |
| Malaysia | Rice products | ELISA | 0.35 (0.2) | 13 | 69.2 | 0.68 | 3.79 | 1.5 | [29] |
| Pakistan | Rice | SPE(IAC)-LC-FD | 0.20 (0.04) | 208 | 35 | ND | 21.30 | 8.31 | [30] |
| Pakistan | Brown rice | ELISA | (1.0) | 120 | 73.3 | 1.24 | 11.68 | 3.70 | [31] |
| Pakistan | Rice | SPE(IAC)-LC-FD | (0.5) | 20 | 25 | 1.5 a | 10.8 a | 4.6 a | [32] |
| Tunisia | Rice | SPE(IAC)-LC-FD | 0.1 (0.05) | 11 | 0 | ND | ND | ND | [33] |
| Turkey | Rice | ELISA | (1) | 100 | 58 | ND | 21.4 a | ns | [34] |
| Vietnam | Rice | SLE-LC-FD | 0.22 (0.07) | 100 | 51 | ND | 29.8 | 3.31 | [35] |
| Ochratoxin A | |||||||||
| Brazil | Rice | SPE(IAC)-LC-FD | (0.10) | 165 | 28 | ND | 30.24 | 1.78 | [36] |
| Canada | Rice | SPE(IAC)-LC-FD | 0.2 (0.05) | 100 99 | 43 1.01 | ND | 0.49 | 0.11 0.49 | [22] |
| Chile | Rice | SPE-LC-FD | 2.1 (0.6) | 31 | 42 | 0 | 12.5 | ns | [37] |
| China | Rice | SLE-LC-FD | 0.3 (0.08) | 370 | 4.9 | 0.3 | 3.2 | 0.85 | [23] |
| Iran | Rice | ELISA | 0.625 | 308 | 9.4 | 0.84 | 11.37 | 3.6 ± 2.66 | [38] |
| Côte d’Ivoire | Rice | SPE-LC-FD | 0.05 (0.01) | 10 | 100.0 | 9.0 | 92.0 | ns | [39] |
| Malaysia | Rice | 20 | 0 | NQ | NQ | NQ | [40] | ||
| Morocco | Rice | SPE(C8)-LC-FD | 0.021 | 20 | 90.0 | 0.02 ± 0.01 | 32.4 ± 2.10 | 4.15 ± 1.45 | [41] |
| Pakistan | White rice Brown rice | SPE(IAC)-LC-FD | 0.18 (0.06) | 34 28 | 29.4 46.4 | ns ns | 24.9 25.4 | 8.5 ± 0.6 7.84 ± 0.9 | [30] |
| Portugal | Rice | SPE(IAC)-LC-FD | 0.05 | 42 | 14.2 | 0.09 | 3.52 | ns | [42] |
| Portugal and Spain | Organic rice Conventional rice | SPE(C8)-LC-FD | 0.19 (0.05) | 9 4 | 44.4 0 | 2.10 NQ | 7.60 NQ | 2.57 ± 3.43 NQ | [43] |
| Singapore | Rice | SLE-LC-MS-MS | 0.4 (0.2) | 190 | 0.5 | 46.5 | 46.5 | 46.5 | [44] |
| South Korea | Rice | SPE(C18)-LC-FD | (1) | 88 | 9.0 | 2.1 | 6.0 | 3.9 | [45] |
| Spain | Rice | ASE-LC-FD | 0.03 (0.01) | 64 | 7.8 | 4.3 | 27.3 | 0.74 | [46] |
| Tunisia | Rice | ELISA | (0.625) | 16 | 25.0 | 0.8 | 2.3 | 1.4 | [47] |
| Tunisia | Rice | SPE(IAC)-LC-FD | 0.15 (0.05) | 96 | 28 | 10 | 150 | 44 | [48] |
| Turkey | Rice | ELISA | (0.025) | 100 | 38.0 | 0.042 | 3.02 | 0.83 | [49] |
| Vietnam | Rice | SLE-LC-FD | 0.25 (0.08) | 100 | 35.0 | 0.08 | 2.78 | 0.75 | [35] |
| Zearalenone | |||||||||
| R. Korea | Rice | SLE-LC-FD | 4 | 88 | 3.4 | 21.7 | 47.0 | 38.5 | [45] |
| Côte d’Ivoire | Rice | ELISA | ns | 10 | 100 | 50 | 200 | 95 | [50] |
| Côte d’Ivoire | Rice | QuEChERS-UHPLC-MS-MS | 5 (2.5) | 9 | 21.05 | <LOQ | 7.5 | 6.6 | [51] |
| Tunisia | Rice | ELISA | 0.025 | 16 | 0 | ND | ND | ND | [47] |
| Brazil | Rice | SPE (MycoSep)-LC-FD | (3.6) | 166 | 29 | ND | 4872 | 143 | [36] |
| Brazil | Rice | DSP-UHPLC-MS-MS | 58.6 (29.3) | 42 | 2.38 | ns | ns | 67 | [52] |
| Pakistan | Rice | SPE(C18)-LC-MS-MS | 13 (7) | 180 | 15 | ND | 114 | 8.48 | [15] |
| Vietnam | Rice | QuEChERS-LC-MS-MS | 1.5 (0.5) | 144 | 0 | ND | ND | ND | [53] |
| Algeria | Rice | QuEChERS-UHPLC-MS-MS | 8.4 (2.5) | 30 | 20 | 8.6 | 15.5 | 9.9 | [54] |
| Arsenic | |||||||||
| Belgium | White rice Brown rice Asian rice Wild/colored rice | MWE-LC-ICP-MS | 2–4 | 30 | 100 | ns ns ns ns | ns ns ns ns | 80–245 119–243 19–147 40–141 | [55] |
| Brazil | Polished Brown Parboiled | MWE-ICP-MS | 38.0 (11.0) b | 27 8 2 | 100 100 100 | ns ns ns | ns ns ns | <38.0–245.0 101.0–660.0 61–80 | [56] |
| Finland | Long grain rice | MWE-LC-ICP-MS | 10 (5) | ns | n = 8 | 90 | 280 | 160 | [57] |
| Portugal | White rice Brown rice | SLE-LC-ICP-MS | 8 for As(III) 17 for As(V) | 22 17 | 100 100 | ns ns | ns ns | 62.9–121.2 119–190 | [58] |
| Slovenia | Rice Polished Brown | MWE-LC-HG-AFS | (1) for As(III) (2) for As(V) | 50 40 10 | ns ns ns | 28.9 28.9 74.3 | 211 211 147.0 | 90.2 51.1–125 111.0 | [59] |
| Spain | White rice Brown rice | SLE-FI-HG-AAS | (130) | 39 | 100 | ns ns | ns ns | 85 144 | [60] |
| Spain | Rice | SLE-LC-ICP-MS | ns | 121 | ns | 47 | 190 | 101 | [61] |
| Switzerland | White rice Brown rice | SLE-IC-ICP-MS | 10.3 (3.44) b | 27 4 | 100 100 | 5.6 117 | 188 172 | 94.0 152 | [62] |
| Thailand | White rice Sticky rice | SLE-ICP-MS | 100 | 96 63 | ns ns | <100 <100 | 254.9 262.0 | 134.0 124.5 | [14] |
| Thailand | Rice | MWE-ICP-MS | 2.0 (0.98) | 55 | ns | 67 b | 402 b | 110–240 b | [63] |
| United Kingdom | Total rice | SLE-LC-ICP-MS | nsgg | 42 | 100 | 65 | 286 | 129 | [6] |
| United States | White rice | SLE-ESI-IT-MS | ns | 40 | 100 | 25 | 271 | 112 | [64] |
| Rice | Frequency (%) | Levels (µg kg−1) | p Value | |
|---|---|---|---|---|
| Min.–Max. | Mean ± SD | |||
| Total (n = 36) | 100 | >LOD–100.0 | 35.3 ± 28.2 | - |
| Supermarket (n = 14) | 100 | >LOD–90.0 | 25.9 ± 26.9 | 0.0419 |
| Producers (n = 22) | 100 | >LOD–100.0 | 41.2 ± 28.0 | |
| White brand (n = 6) | 100 | >LOD–23.0 | 10.5 ± 7.1 | 0.0220 |
| Private brand (n = 8) | 100 | >LOD–90.0 | 37.5 ± 30.9 | |
| Long grain (n = 16) | 100 | >LOD–90.0 | 26.9 ± 26.1 | 0.0480 |
| Short grain (n = 20) | 100 | >LOD–100.0 | 41.9 ± 28.6 | |
| Brown rice (n = 14) | 100 | 23.0–100.0 | 55.1 ± 27.7 | <0.0001 |
| White rice (n = 22) | 100 | >LOD–80.0 | 22.6 ± 20.5 | |
| Portugal (n = 27) | 100 | >LOD–100.0 | 38.3 ± 26.1 | 0.0272 |
| Abroad (n = 9) | 100 | >LOD–90.0 | 26.1 ± 33.9 | |
| EDI (ng kg−1 b.w./day) | EDI/PMTDI1.0 (%) | EDI/PMTDI 0.4 (%) | MOE | |||||||||
|---|---|---|---|---|---|---|---|---|---|---|---|---|
| Children | Adolescents | Adults | Children | Adolescents | Adults | Children | Adolescents | Adults | Children | Adolescents | Adults | |
| LB–average consumption | 0.26 | 0.18 | 0.12 | 26.2 | 18.2 | 12.0 | 65.5 | 45.5 | 29.9 | 648.9 | 933.5 | 1420.8 |
| LB–95th consumption | 0.66 | 0.40 | 0.28 | 65.6 | 40.5 | 28.1 | 163.9 | 101.2 | 70.3 | 259.3 | 419.8 | 604.9 |
| UB–average consumption | 3.42 | 1.61 | 1.06 | 341.9 | 160.9 | 105.7 | 854.6 | 402.2 | 264.2 | 49.7 | 105.7 | 160.8 |
| UB–95th consumption | 5.79 | 2.64 | 2.48 | 579.0 | 264.4 | 248.3 | 1447.6 | 661.0 | 620.6 | 29.4 | 64.3 | 68.5 |
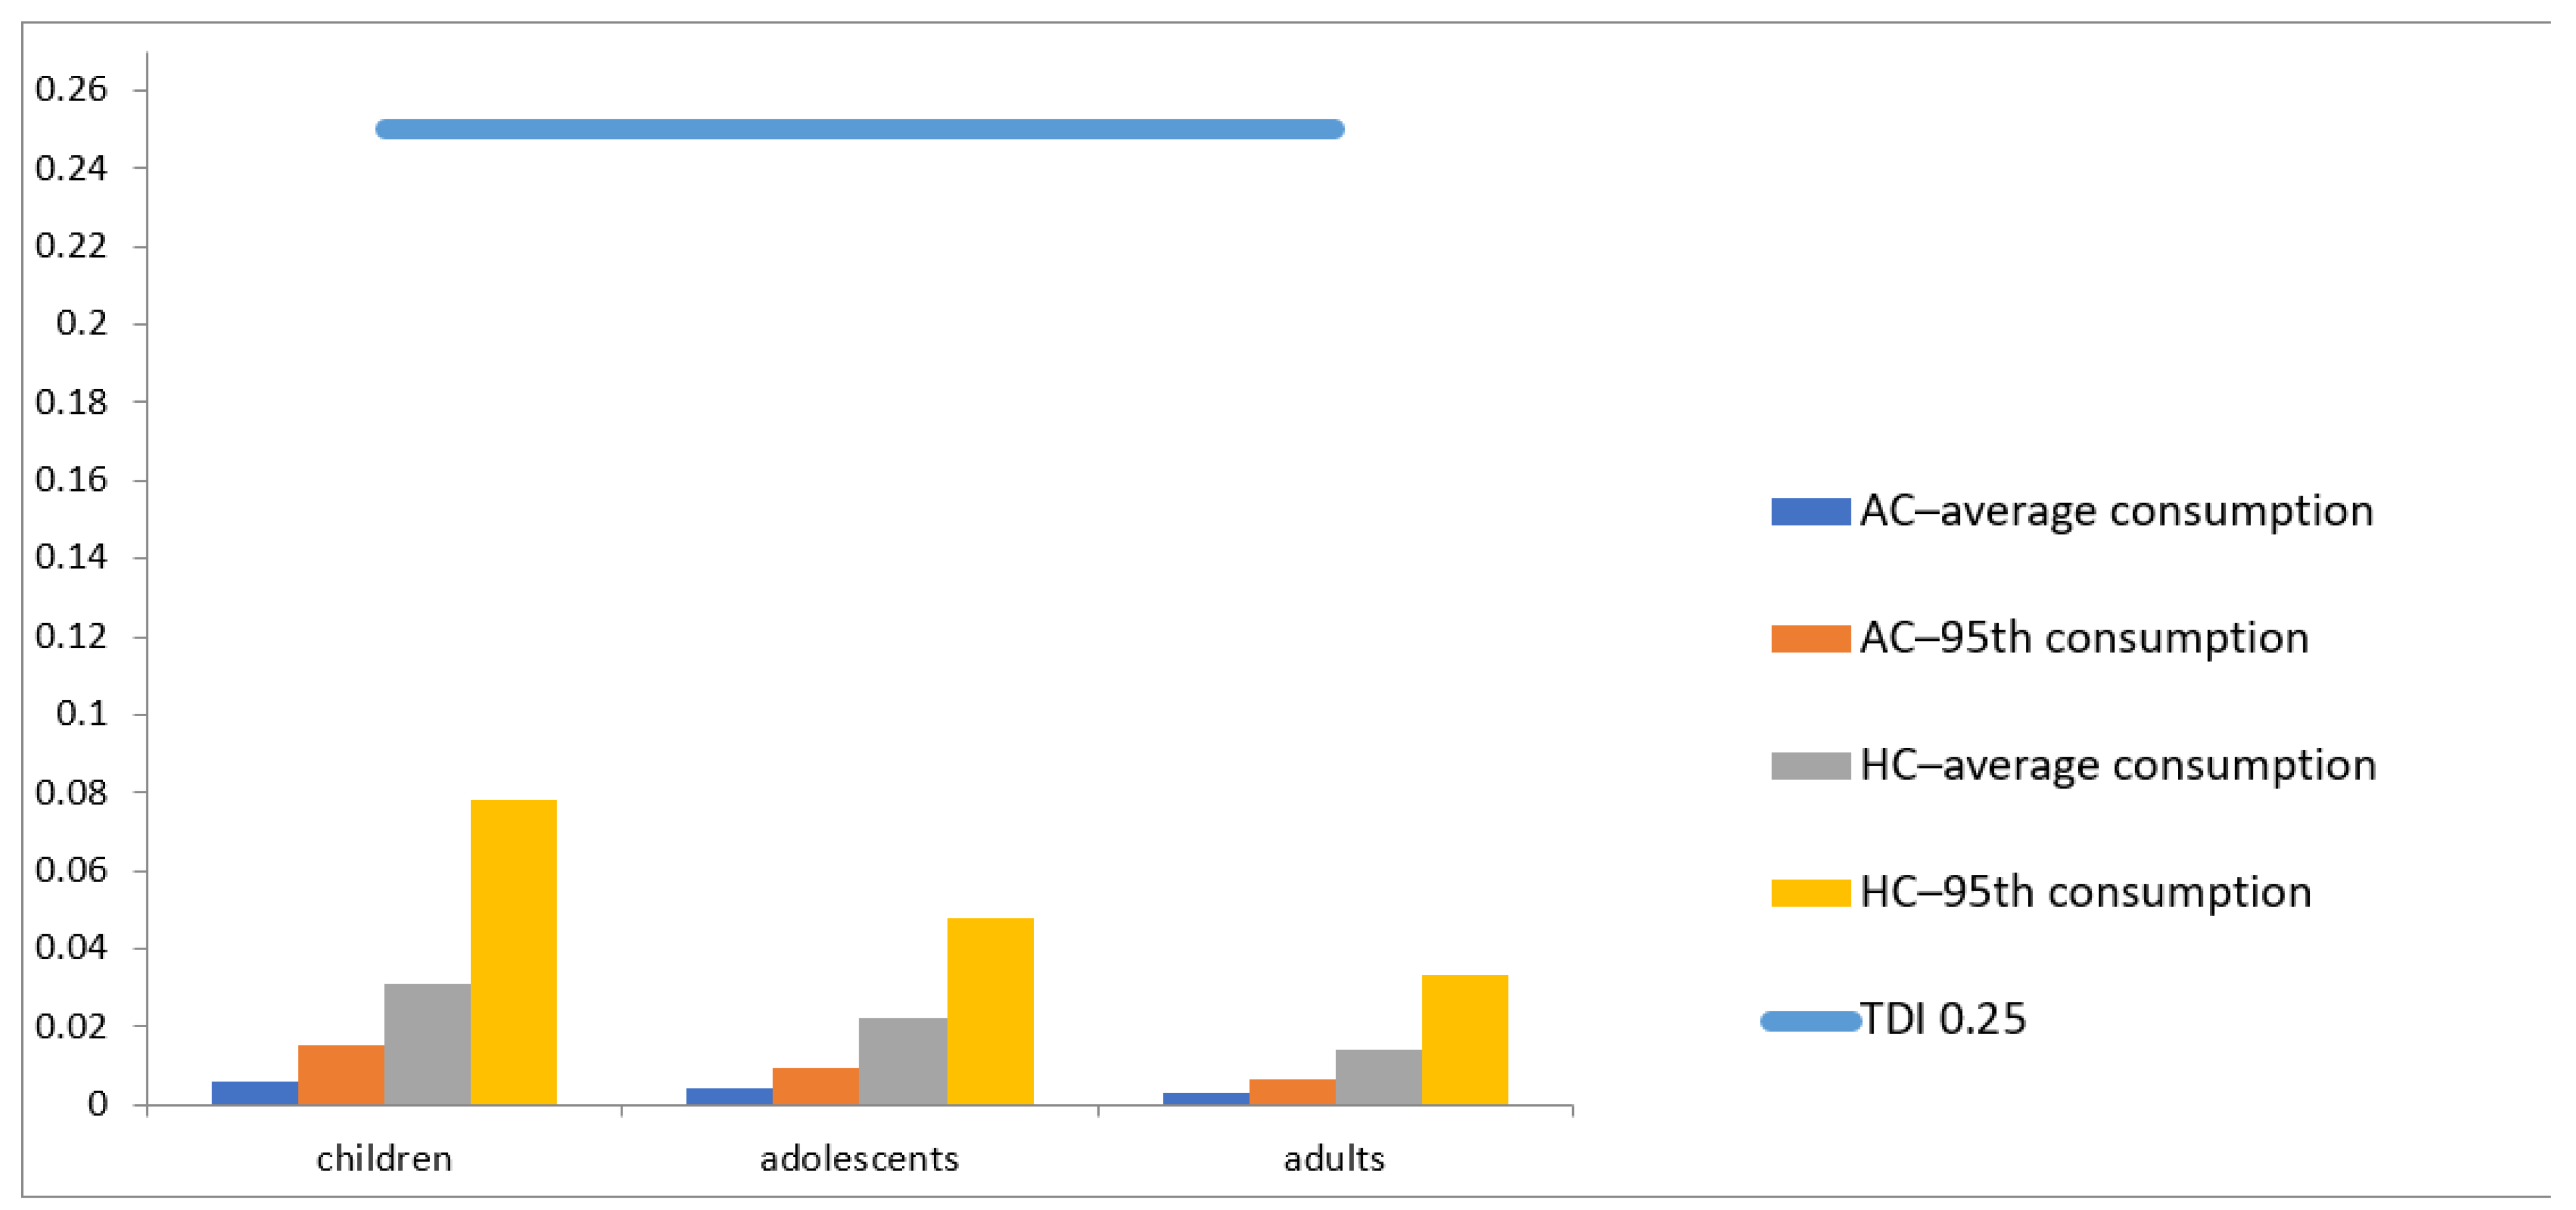
| EDI (µg kg−1 b.w./day) | EDI/TDI (%) | |||||
|---|---|---|---|---|---|---|
| Children | Adolescents | Adults | Children | Adolescents | Adults | |
| LB–average consumption | 0.00601 | 0.00418 | 0.00275 | 2.40 | 1.67 | 1.10 |
| LB–95th consumption | 0.015042 | 0.009293 | 0.006449 | 6.02 | 3.72 | 2.58 |
| UB–average consumption | 0.031 | 0.022 | 0.014 | 12.44 | 8.65 | 5.68 |
| UB–95th consumption | 0.078 | 0.048 | 0.033 | 31.1 | 19.2 | 13.3 |
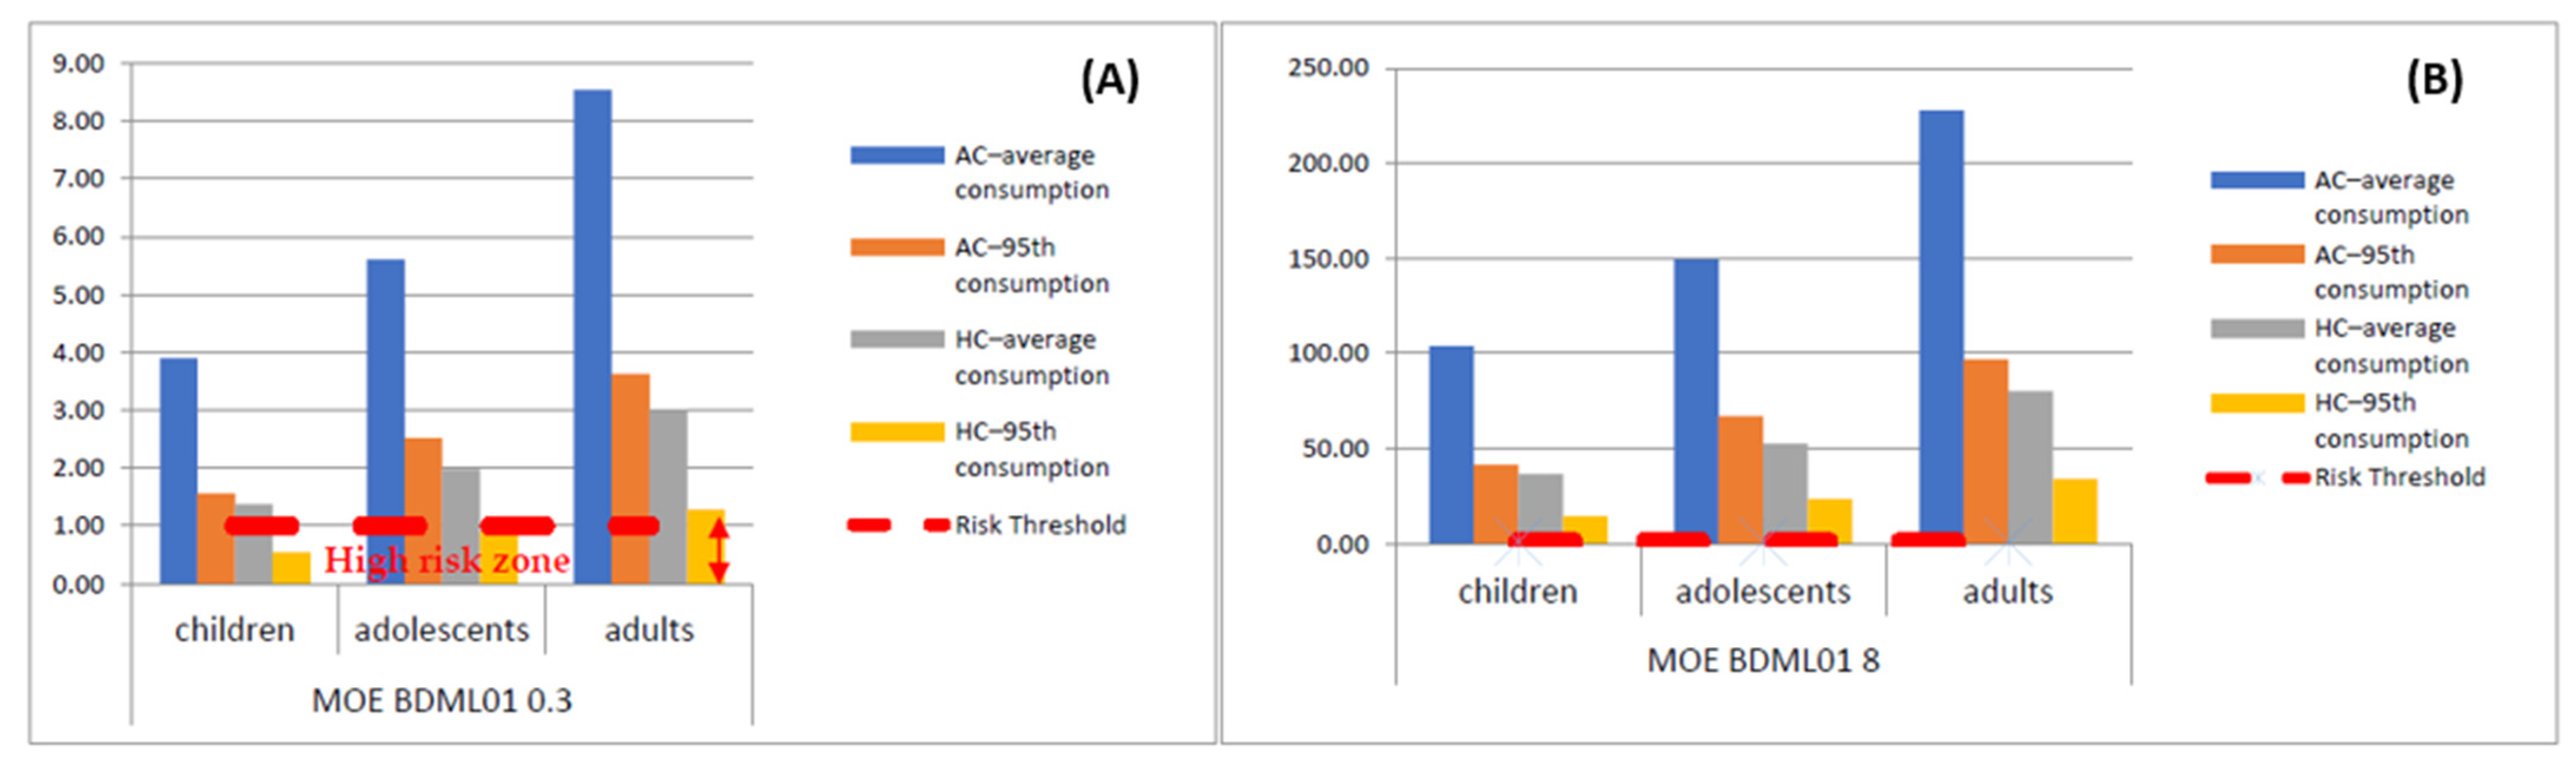
| EDI (µg kg−1 b.w./day) | MOE BDML01 0.3 | MOE BDML01 8 | |||||||
|---|---|---|---|---|---|---|---|---|---|
| Children | Adolescents | Adults | Children | Adolescents | Adults | Children | Adolescents | Adults | |
| AC–average consumption | 0.0770 | 0.0535 | 0.0351 | 3.90 | 5.61 | 8.54 | 103.95 | 149.54 | 227.61 |
| AC–95th consumption | 0.1926 | 0.1190 | 0.0826 | 1.56 | 2.52 | 3.63 | 41.55 | 67.25 | 96.90 |
| HC–average consumption | 0.2183 | 0.1518 | 0.0997 | 1.37 | 1.98 | 3.01 | 36.64 | 52.71 | 80.23 |
| HC–95th consumption | 0.5463 | 0.3375 | 0.2342 | 0.55 | 0.89 | 1.28 | 14.65 | 23.71 | 34.16 |
Disclaimer/Publisher’s Note: The statements, opinions and data contained in all publications are solely those of the individual author(s) and contributor(s) and not of MDPI and/or the editor(s). MDPI and/or the editor(s) disclaim responsibility for any injury to people or property resulting from any ideas, methods, instructions or products referred to in the content. |
© 2023 by the authors. Licensee MDPI, Basel, Switzerland. This article is an open access article distributed under the terms and conditions of the Creative Commons Attribution (CC BY) license (https://creativecommons.org/licenses/by/4.0/).
Share and Cite
Silva, L.J.G.; Pereira, A.M.P.T.; Duarte, S.; Pedro, I.; Perdigão, C.; Silva, A.; Lino, C.M.; Almeida, A.; Pena, A. Mycotoxins in Rice Correlate with Other Contaminants? A Pilot Study of the Portuguese Scenario and Human Risk Assessment. Toxins 2023, 15, 291. https://doi.org/10.3390/toxins15040291
Silva LJG, Pereira AMPT, Duarte S, Pedro I, Perdigão C, Silva A, Lino CM, Almeida A, Pena A. Mycotoxins in Rice Correlate with Other Contaminants? A Pilot Study of the Portuguese Scenario and Human Risk Assessment. Toxins. 2023; 15(4):291. https://doi.org/10.3390/toxins15040291
Chicago/Turabian StyleSilva, Liliana J. G., André M. P. T. Pereira, Sofia Duarte, Inês Pedro, Catarina Perdigão, Alexandra Silva, Celeste M. Lino, Anabela Almeida, and Angelina Pena. 2023. "Mycotoxins in Rice Correlate with Other Contaminants? A Pilot Study of the Portuguese Scenario and Human Risk Assessment" Toxins 15, no. 4: 291. https://doi.org/10.3390/toxins15040291