Phase Angle and Handgrip Strength Are Sensitive Early Markers of Energy Intake in Hypophagic, Non-Surgical Patients at Nutritional Risk, with Contraindications to Enteral Nutrition

Abstract
:1. Introduction
2. Methods
2.1. Ethics
2.2. Subjects
2.3. Assessments
2.4. Treatment
2.5. Aims
- To assess the change in PhA and HG/SMM in hypophagic, non-surgical patients at nutritional risk, with contraindications to enteral nutrition after a one-week personalized nutritional support.
- To compare the change in PhA and HG/SMM between patients satisfying vs. those not satisfying their energy estimated requirements after the one-week personalized nutritional support.
- To assess whether PhA is a marker of HG/SMM in this patient population.
2.6. Statistics
3. Results


| Variable | Overall | Satisfied | Not Satisfied | p-Value |
|---|---|---|---|---|
| (N = 30) | (N = 20) | (N = 10) | ||
| Baseline | ||||
| Gender (male), N (%) | 15 (50) | 9 (45) | 6 (60) | 0.700 |
| Age (years), mean (SD) | 63.0 (13.7) | 59.8 (13.3) | 69.4 (11.2) | 0.058 |
| Baseline body weight (kg), mean (SD) | 55.8 (13.4) | 54.7 (15.2) | 58.0 (8.9) | 0.363 |
| Baseline body mass index (kg·m−2), mean (SD) | 20.2 (3.9) | 20.0 (4.3) | 20.6 (2.5) | 0.619 |
| 6-month weight loss (%), mean (SD) | 11.8 (6.4) | 12.1 (5.9) | 11.1 (7.1) | 0.728 |
| Phase Angle, mean (SD) | 4.6 (1.3) | 4.4 (1.3) | 5.0 (1.3) | 0.223 |
| Body cell mass, mean (SD) | 19.7 (6.9) | 19.3 (7.6) | 20.6 (4.9) | 0.602 |
| Whole-body skeletal muscle mass (kg), mean (SD) | 22.1 (4.9) | 22.3 (5.0) | 21.5 (4.5) | 0.680 |
| Handgrip strength (kg), mean (SD) | 16.2 (7.7) | 15.2 (8.0) | 18.5 (5.9) | 0.277 |
| Adjusted-handgrip strength a, mean (SD) | 0.69 (0.31) | 0.67 (0.29) | 0.83 (0.17) | 0.096 |
| Administration of PN (central infusion line), N (%) | 13 (43) | 11 (55) | 2 (20) | 0.119 |
| Estimated energy requirements (kcal·day−1), mean (SD) | 1820 (270) | 1805 (291) | 1846 (204) | 0.667 |
| (kcal (kg·day−1)), mean (SD) | 33.4 (4.5) | 34.2 (5.0) | 32.1 (2.3) | 0.150 |
| Estimated protein requirements (g (kg·day−1)), mean (SD) | 1.3 (0.1) | 1.3 (0.1) | 1.3 (0.1) | 1.00 |
| Baseline energy intake (kcal·day−1), mean (SD) | 608 (487) | 690 (493) | 446 (405) | 0.179 |
| (kcal (kg·day−1)), mean (SD) | 11.7 (10.8) | 13.7 (11.2) | 7.8 (8.1) | 0.129 |
| Percentage of requirements (%), mean (SD) | 33 (27) | 38 (27) | 24 (23) | 0.185 |
| Baseline protein intake (g·day−1), mean (SD) | 24.9 (22.8) | 30.3 (23.5) | 14.3 (15.1) | 0.040 |
| (g (kg·day−1)), mean (SD) | 0.49 (0.53) | 0.61 (0.57) | 0.25 (0.30) | 0.040 |
| Percentage of requirements (%), mean (SD) | 38 (40) | 47 (43) | 19 (23) | 0.037 |
| After the one-week personalized nutritional support | ||||
| Final energy intake (kcal(kg day−1)), mean (SD) | ||||
| Total | 36.9 (12.5) | 42.6 (11.2) | 25.5 (2.1) | <0.001 |
| Percentage of requirements | 111 (30) | 127 (23) | 80 (6) | <0.001 |
| Oral | 16.0 (12.0) | 22.2 (9.2) | 3.5 (3.2) | <0.001 |
| Supplemental PN | 20.9 (6.9) | 20.4 (7.8) | 22.0 (3.8) | 0.462 |
| Final protein intake (g/(kg day−1)) | ||||
| Total | 1.46 (0.57) | 1.71 (0.54) | 0.98 (0.14) | <0.001 |
| Percentage of requirements | 117 (48) | 138 (45) | 76 (11) | <0.001 |
| Oral | 0.70 (0.56) | 0.98 (0.45) | 0.15 (0.14) | <0.001 |
| Supplemental PN | 0.76 (0.27) | 0.73 (0.31) | 0.83 (0.14) | 0.253 |
| Endpoint | Overall (N = 30) | Patients Not Satisfying Requirements (N = 10) | Patients Satisfying Requirements (N = 20) | ||||||
|---|---|---|---|---|---|---|---|---|---|
| Mean (SD) a | Δ (95% CI) b | p-Value c | Mean (SD) a | Δ (95% CI) b | p-Value c | Mean (SD) a | Δ (95% CI) b | p-Value c | |
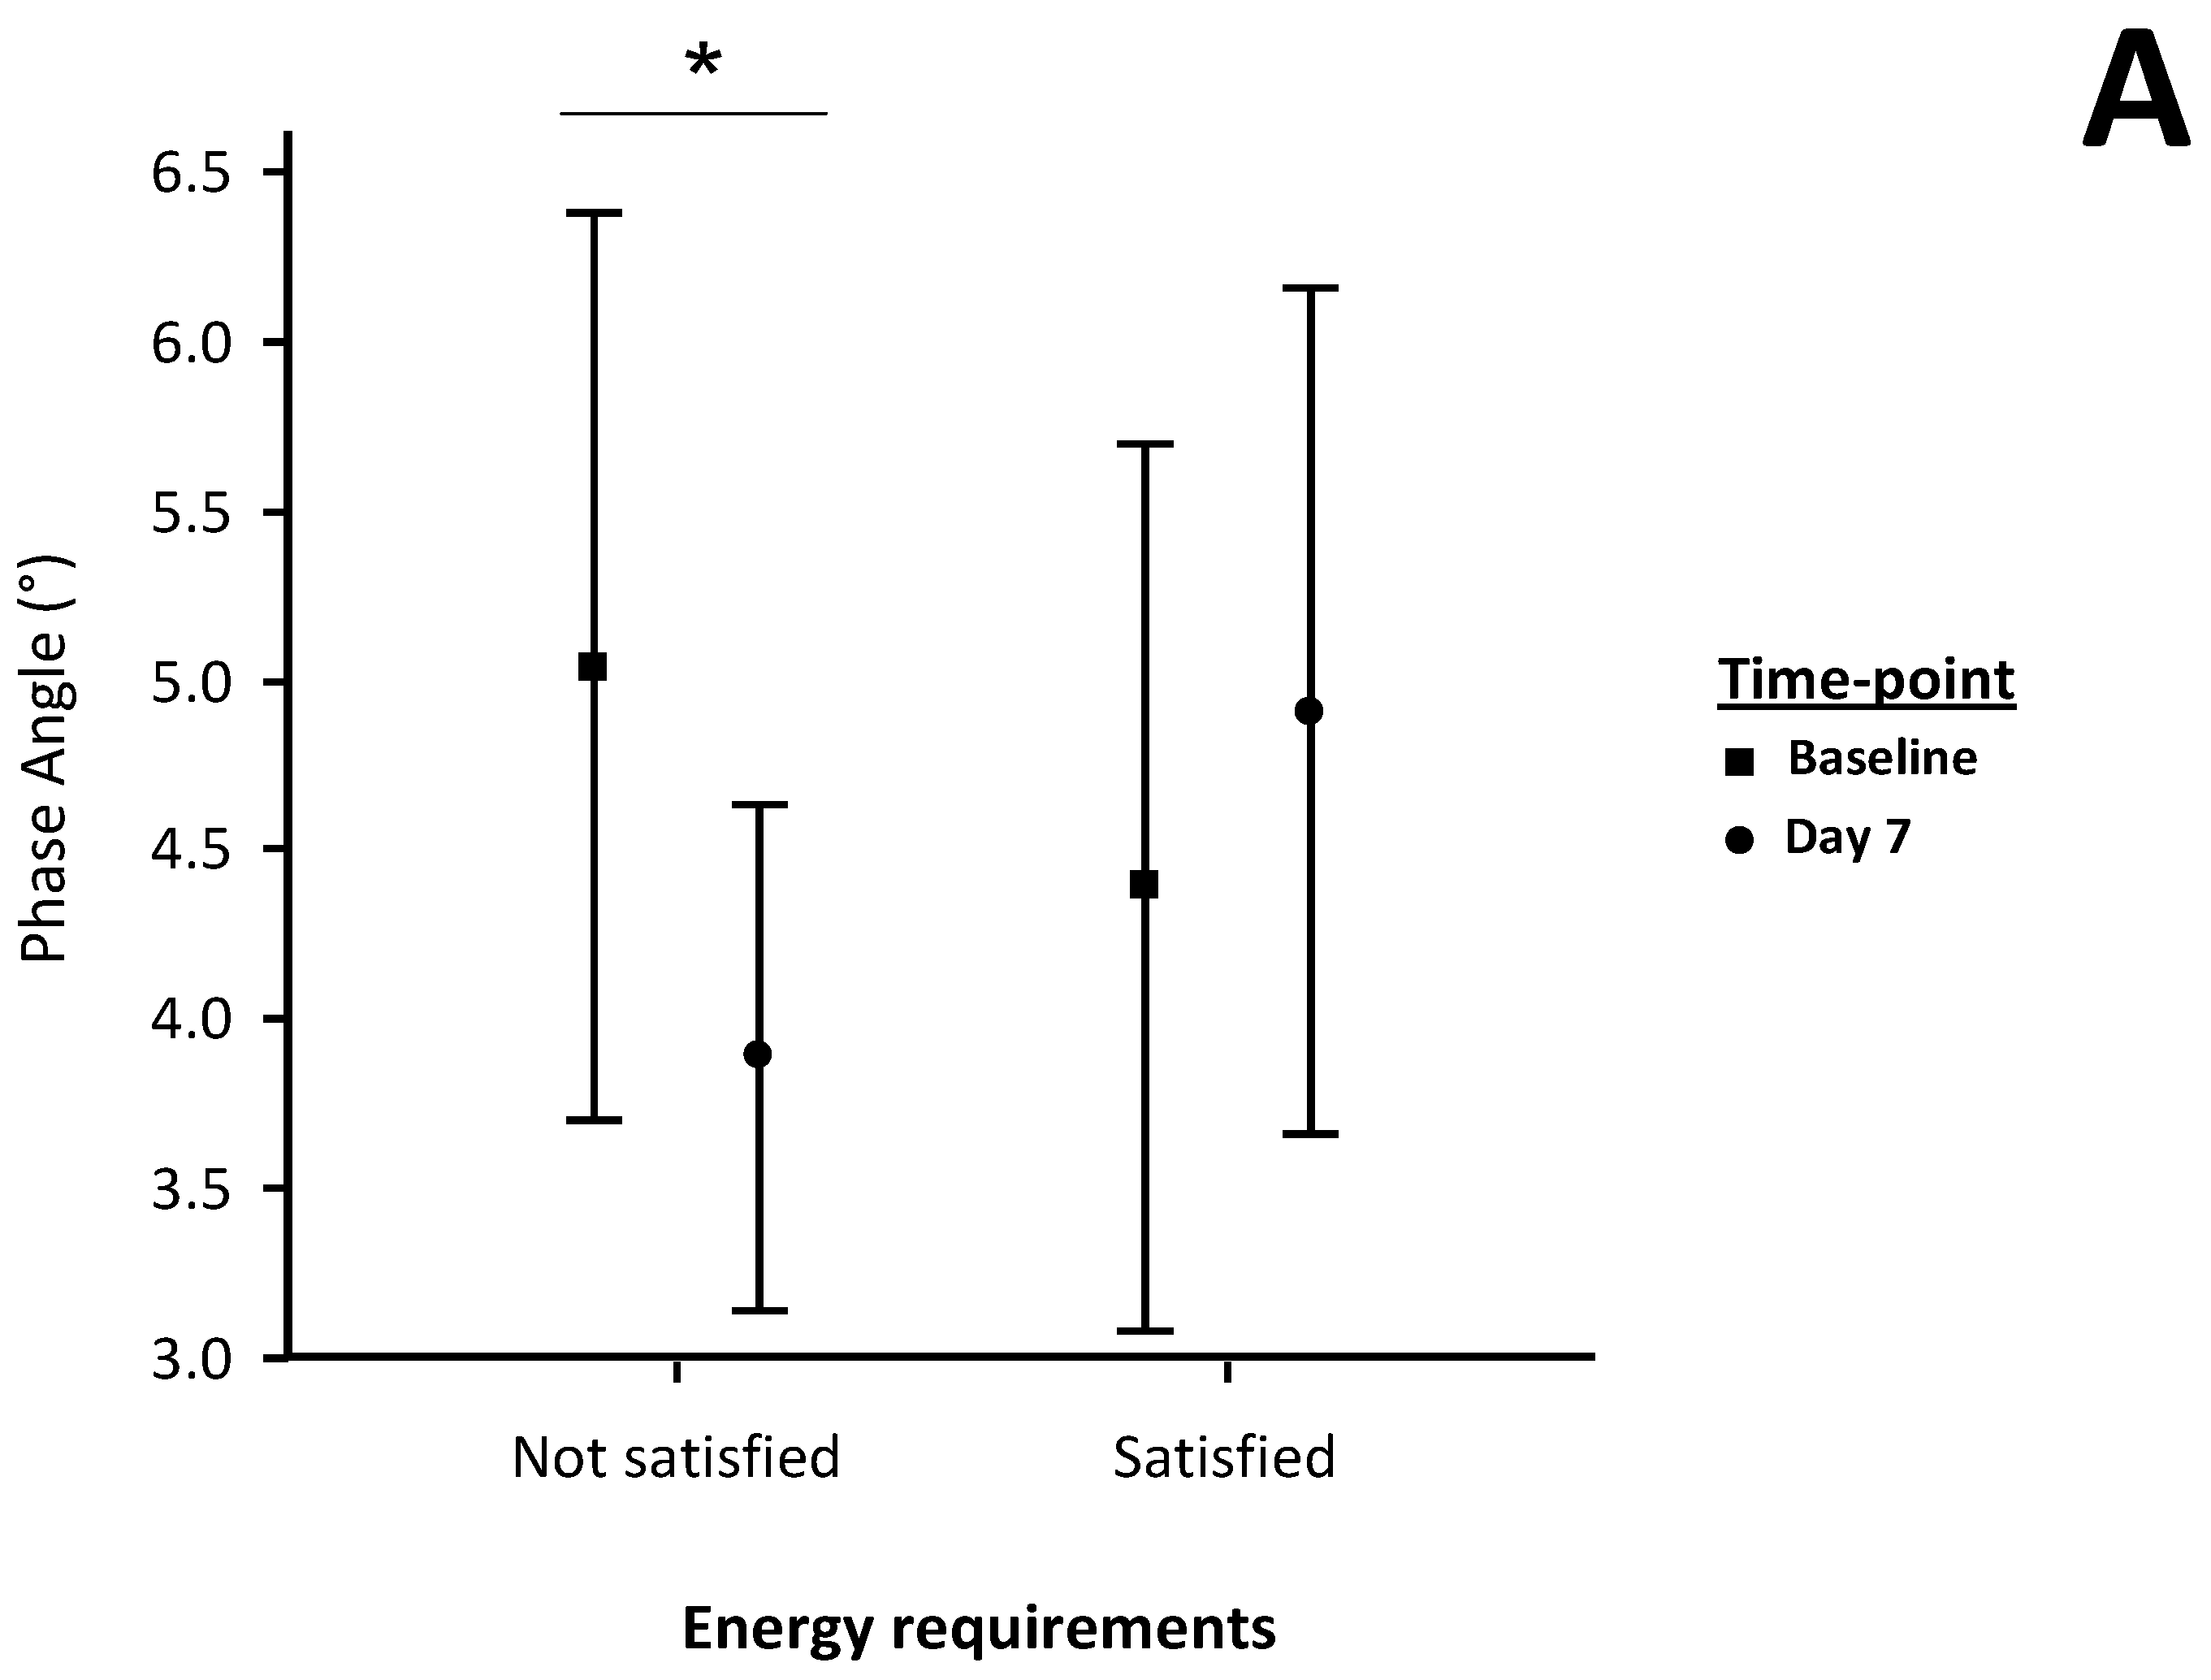
| Phase angle (°) | 4.6 (1.2) | −0.02 (−0.3, 0.2) | 0.875 | 3.9 (0.8) | −0.7 (−1.1, −0.3) | 0.004 | 4.9 (1.3) | 0.3 (−0.04, 0.7) | 0.076 |
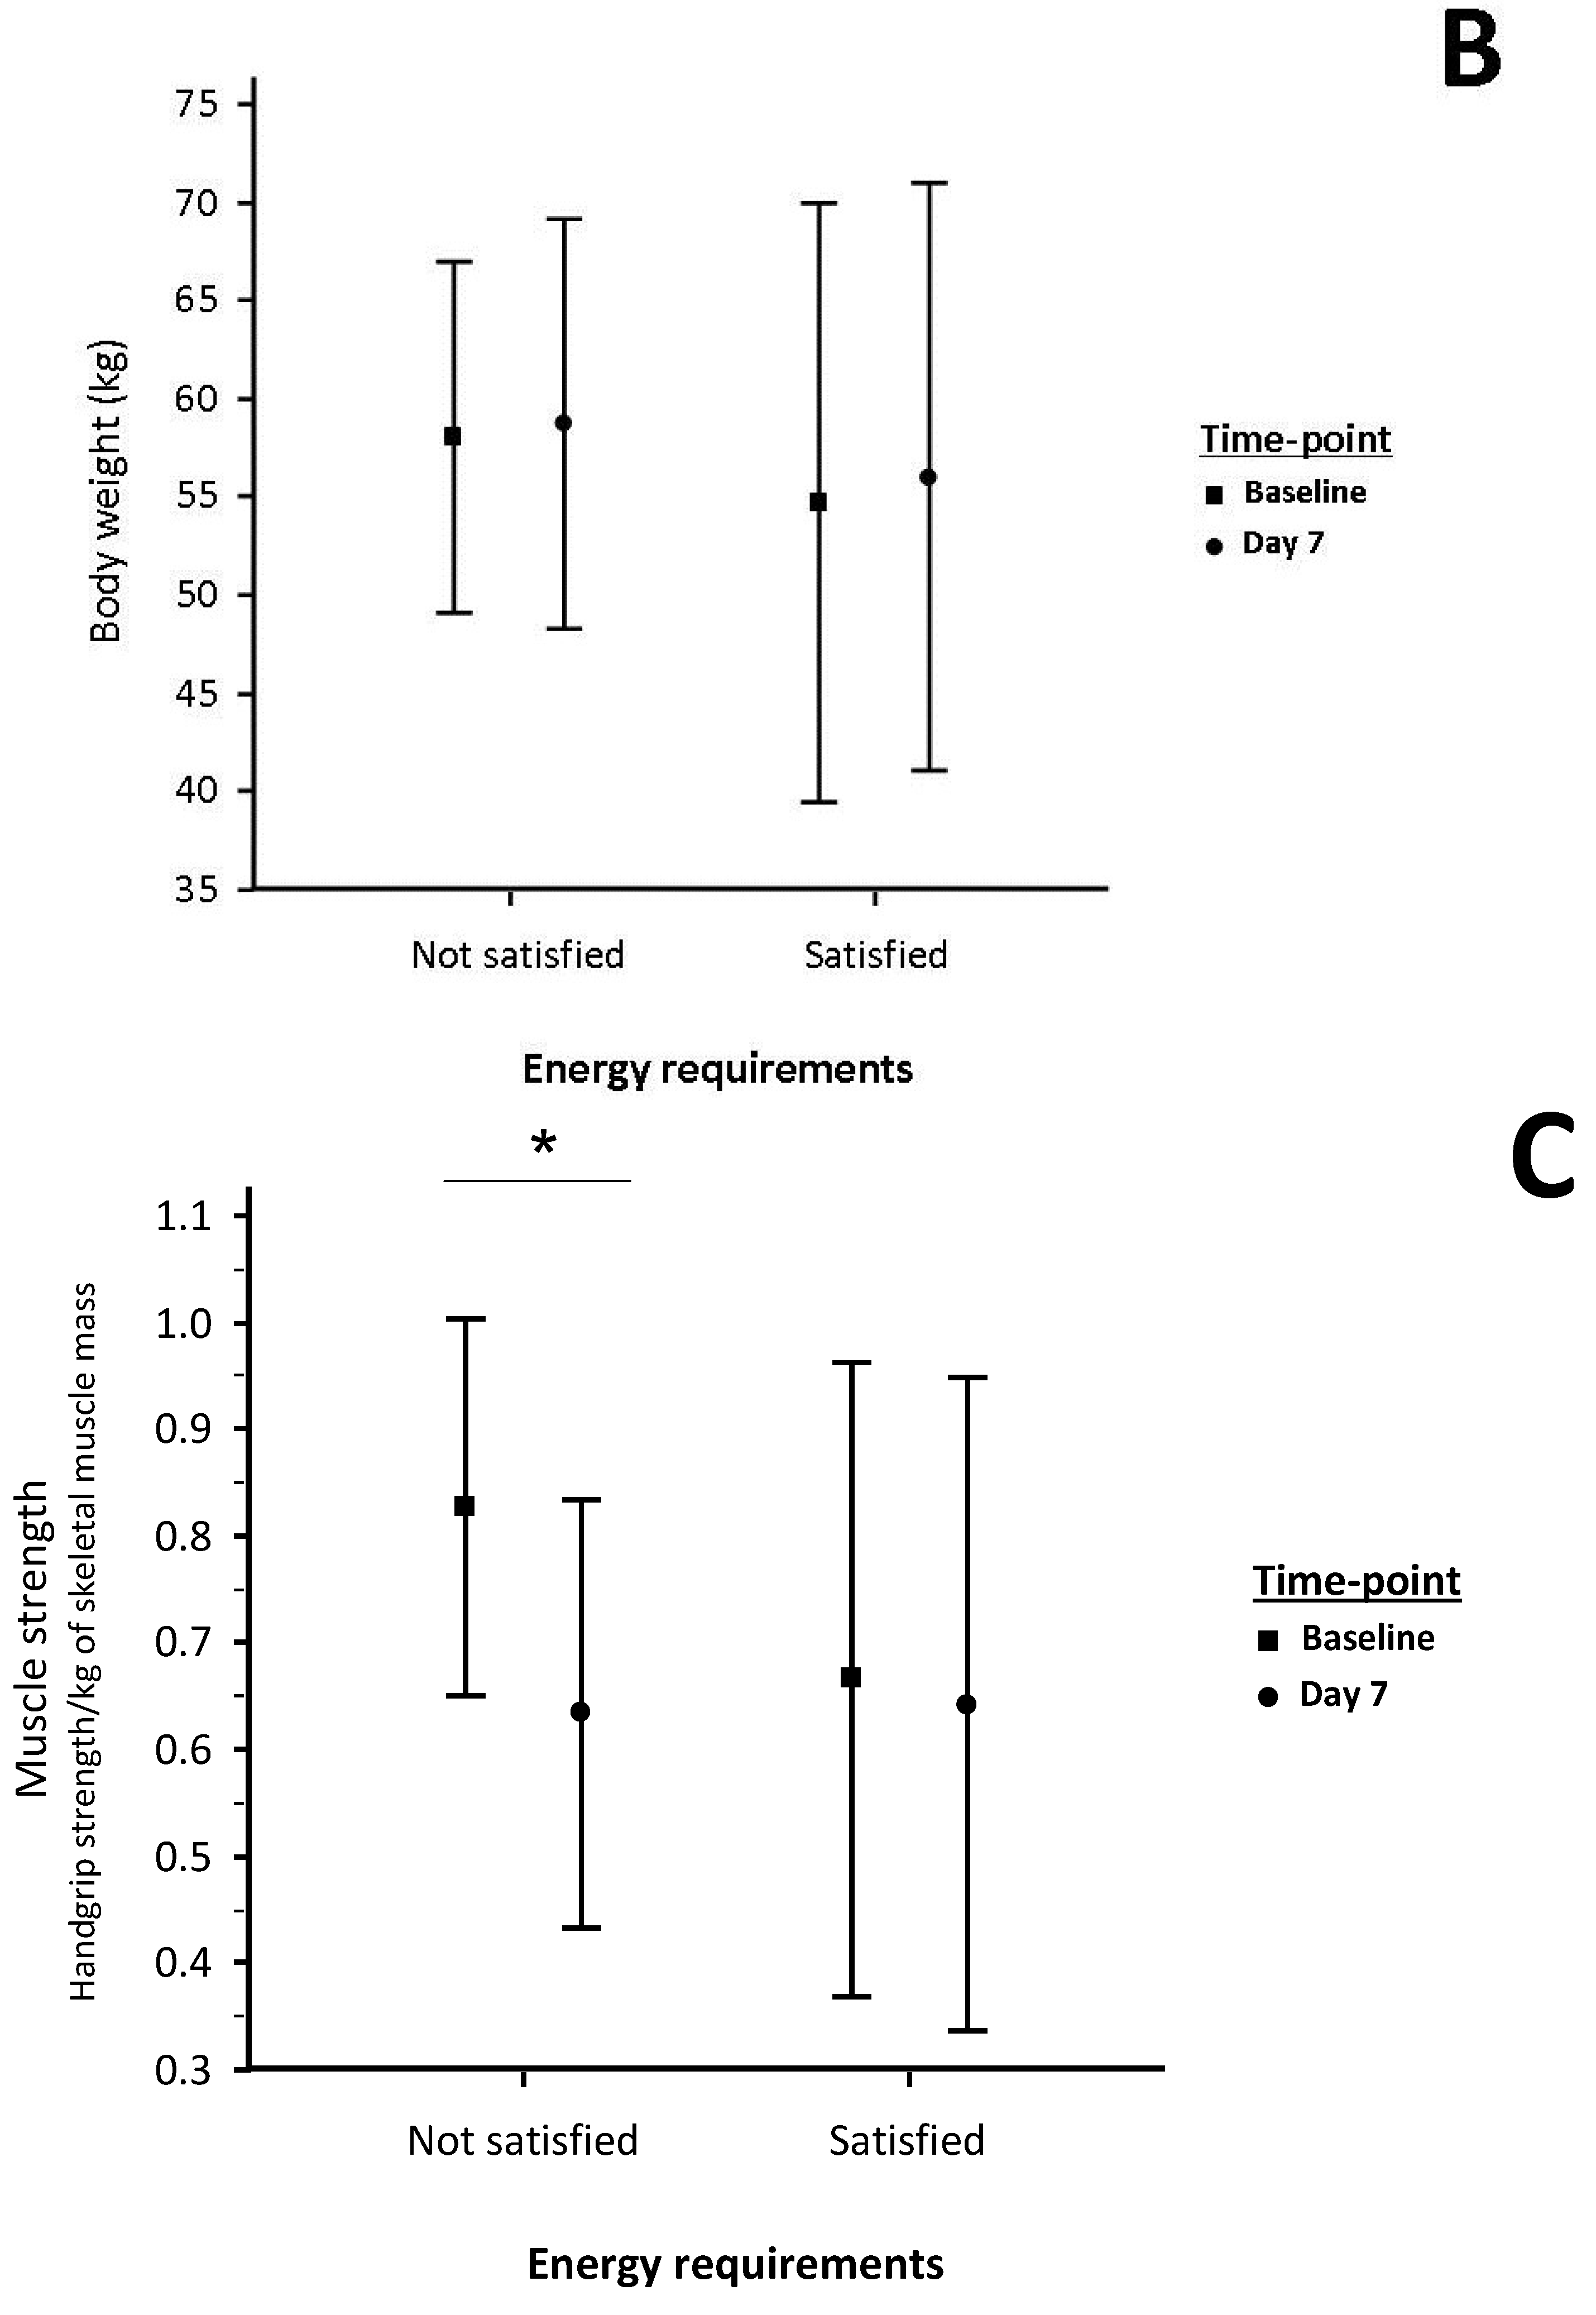
| Body weight (kg) | 56.9 (13.5) | 0.4 (−0.8, 1.5) | 0.507 | 58.7 (10.5) | 0.8 (−0.8, 2.4) | 0.277 | 56.0 (15.0) | 0.2 (−2.8, 3.3) | 0.872 |
| HG/SMM | 0.64 (0.28) | −0.04 (−0.08, 0.001) | 0.057 | 0.63 (0.20) | −0.11 (−0.18, −0.04) | 0.010 | 0.64 (0.31) | −0.01 (−0.07, 0.06) | 0.778 |

4. Discussion
5. Conclusions
Acknowledgments
Author Contributions
Conflicts of Interest
References
- Norman, K.; Pichard, C.; Lochs, H.; Pirlich, M. Prognostic impact of disease-related malnutrition. Clin. Nutr. 2008, 27, 5–15. [Google Scholar] [CrossRef] [PubMed]
- Caccialanza, R.; Klersy, C.; Cereda, E.; Cameletti, B.; Bonoldi, A.; Bonardi, C.; Marinelli, M.; Dionigi, P. Nutritional parameters associated with prolonged hospital stay among ambulatory adult patients. CMAJ 2010, 182, 1843–1849. [Google Scholar] [CrossRef]
- Caccialanza, R.; Cereda, E.; Klersy, C. Malnutrition, age and in-hospital mortality. CMAJ 2011, 183, 826. [Google Scholar] [CrossRef] [PubMed]
- Cereda, E.; Klersy, C.; Pedrolli, C.; Cameletti, B.; Bonardi, C.; Quarleri, L.; Cappello, S.; Bonoldi, A.; Bonadeo, E.; Caccialanza, R. The Geriatric Nutritional Risk Index predicts hospital length of stay and in-hospital weight loss in elderly patients. Clin. Nutr. 2015, 34, 74–78. [Google Scholar]
- Kyle, U.G.; Schneider, S.M.; Pirlich, M.; Lochs, H.; Hebuterne, X.; Pichard, C. Does nutritional risk, as assessed by nutritional risk index, increase during hospital stay? A multinational population-based study. Clin. Nutr. 2005, 24, 516–524. [Google Scholar] [CrossRef] [PubMed]
- Arends, J.; Bodoky, G.; Bozzetti, F.; Fearon, K.; Muscaritoli, M.; Selga, G.; van Bokhorst-de van der Schueren, M.A.; von Meyenfeldt, M.; German Society for Nutritional Medicine; Zürcher, G.; et al. ESPEN Guidelines on Enteral Nutrition: Non-surgical oncology. Clin. Nutr. 2006, 25, 245–259. [Google Scholar] [CrossRef]
- Bozzetti, F.; Arends, J.; Lundholm, K.; Micklewright, A.; Zurcher, G.; Muscaritoli, M.; ESPEN. ESPEN Guidelines on Parenteral Nutrition: Nonsurgical oncology. Clin. Nutr. 2009, 28, 445–454. [Google Scholar] [CrossRef]
- Norman, K.; Stobäus, N.; Pirlich, M.; Bosy-Westphal, A. Bioelectrical phase angle and impedance vector analysis-Clinical relevance and applicability of impedance parameters. Clin. Nutr. 2012, 31, 854–861. [Google Scholar] [CrossRef] [PubMed]
- Kyle, U.G.; Genton, L.; Pichard, C. Low phase angle determined by bioelectrical impedance analysis is associated with malnutrition and nutritional risk at hospital admission. Clin. Nutr. 2013, 32, 294–299. [Google Scholar] [CrossRef] [PubMed]
- Norman, K.; Pirlich, M.; Sorensen, J.; Christensen, P.; Kemps, M.; Schütz, T.; Lochs, H.; Kondrup, J. Bioimpedance vector analysis as a measure of muscle function. Clin. Nutr. 2009, 28, 78–82. [Google Scholar] [CrossRef] [PubMed]
- Gupta, D.; Lis, C.G.; Dahlk, S.L.; Vashi, P.G.; Grutsch, J.F.; Lammersfeld, C.A. Bioelectrical impedance phase angle as a prognostic indicator in advanced pancreatic cancer. Br. J. Nutr. 2004, 92, 957–962. [Google Scholar] [CrossRef] [PubMed]
- Gupta, D.; Lammersfeld, C.A.; Burrows, J.L.; Burrows, J.L.; Dahlk, S.L.; Vashi, P.G.; Grutsch, J.F.; Hoffman, S.; Lis, C.G. Bioelectrical impedance phase angle in clinical practice: Implications for prognosis in advanced colorectal cancer. Am. J. Clin. Nutr. 2004, 80, 1634–1638. [Google Scholar] [PubMed]
- Gupta, D.; Lammersfeld, C.A.; Vashi, P.G.; King, J.; Dahlk, S.L.; Grutsch, J.F.; Lis, C.G. Bioelectrical impedance phase angle as a prognostic indicator in breast cancer. BMC Cancer 2008, 8, 249. [Google Scholar] [CrossRef] [PubMed]
- Gupta, D.; Lammersfeld, C.A.; Vashi, P.G.; King, J.; Dahlk, S.L.; Grutsch, J.F.; Lis, C.G. Bioelectrical impedance phase angle in clinical practice: Implications for prognosis in stage IIIB and IV non-small cell lung cancer. BMC Cancer 2009, 9, 37. [Google Scholar] [CrossRef] [PubMed]
- Toso, S.; Piccoli, A.; Gusella, M.; Menon, D.; Bononi, A.; Crepaldi, G.; Ferrazzi, E. Altered tissue electric properties in lung cancer patients as detected by bioelectric impedance vector analysis. Nutrition 2000, 16, 120–124. [Google Scholar] [CrossRef]
- Selberg, O.; Selberg, D. Norms and correlates of bioimpedance phase angle in healthy human subjects, hospitalized patients, and patients with liver cirrhosis. Eur. J. Appl. Physiol. 2000, 86, 509–516. [Google Scholar] [CrossRef]
- Kondrup, J.; Rasmussen, H.H.; Hamberg, O.; Stanga, Z.; Ad Hoc ESPEN Working Group. Nutritional Risk Screening (NRS 2002): A new method based on an analysis of controlled clinical trials. Clin. Nutr. 2003, 22, 321–336. [Google Scholar] [CrossRef]
- Oken, M.M.; Creech, R.H.; Tormey, D.C.; Horton, J.; Davis, T.E.; McFadden, E.T.; Carbone, P.P. Toxicity and response criteria of the Eastern Cooperative Oncology Group. Am. J. Clin. Oncol. 1982, 5, 649–655. [Google Scholar] [CrossRef]
- Janssen, I.; Heymsfield, S.B.; Baumgartner, R.N.; Ross, R. Estimation of skeletal muscle mass by bioelectrical impedance analysis. J. Appl. Physiol. 2000, 89, 465–471. [Google Scholar] [PubMed]
- Cereda, E.; Vanotti, A. The new Geriatric Nutritional Risk Index is a good predictor of muscle dysfunction in institutionalized older patients. Clin. Nutr. 2007, 26, 78–83. [Google Scholar] [CrossRef] [PubMed]
- Pelzer, U.; Arnold, D.; Gövercin, M.; Stieler, J.; Doerken, B.; Riess, H.; Oettle, H. Parenteral nutrition support for patients with pancreatic cancer. Results of a phase II study. BMC Cancer 2010, 10, 86. [Google Scholar] [CrossRef]
- Richter, E.; Denecke, A.; Klapdor, S.; Klapdor, R. Parenteral nutrition support for patients with pancreatic cancer-improvement of the nutritional status and the therapeutic outcome. Anticancer Res. 2012, 32, 2111–2118. [Google Scholar] [PubMed]
- Gemming, L.; Jiang, Y.; Swinburn, B.; Utter, J.; Mhurchu, C.N. Under-reporting remains a key limitation of self-reported dietary intake: An analysis of the 2008/09 New Zealand Adult Nutrition Survey. Eur. J. Clin. Nutr. 2014, 68, 259–264. [Google Scholar] [CrossRef]
- Caccialanza, R.; Palladini, G.; Klersy, C.; Cereda, E.; Bonardi, C.; Quarleri, L.; Vadacca, G.; Albertini, R.; Merlini, G. Serum prealbumin: An independent marker of short-term energy intake in the presence of multiple organ disease involvement. Nutrition 2013, 29, 580–582. [Google Scholar] [CrossRef]
- Stobäus, N.; Pirlich, M.; Valentini, L.; Schulzke, J.D.; Norman, K. Determinants of bioelectrical phase angle in disease. Br. J. Nutr. 2012, 107, 1217–1220. [Google Scholar] [CrossRef]
© 2015 by the authors; licensee MDPI, Basel, Switzerland. This article is an open access article distributed under the terms and conditions of the Creative Commons Attribution license (http://creativecommons.org/licenses/by/4.0/).
Share and Cite
Caccialanza, R.; Cereda, E.; Klersy, C.; Bonardi, C.; Cappello, S.; Quarleri, L.; Turri, A.; Montagna, E.; Iacona, I.; Valentino, F.; et al. Phase Angle and Handgrip Strength Are Sensitive Early Markers of Energy Intake in Hypophagic, Non-Surgical Patients at Nutritional Risk, with Contraindications to Enteral Nutrition. Nutrients 2015, 7, 1828-1840. https://doi.org/10.3390/nu7031828
Caccialanza R, Cereda E, Klersy C, Bonardi C, Cappello S, Quarleri L, Turri A, Montagna E, Iacona I, Valentino F, et al. Phase Angle and Handgrip Strength Are Sensitive Early Markers of Energy Intake in Hypophagic, Non-Surgical Patients at Nutritional Risk, with Contraindications to Enteral Nutrition. Nutrients. 2015; 7(3):1828-1840. https://doi.org/10.3390/nu7031828
Chicago/Turabian StyleCaccialanza, Riccardo, Emanuele Cereda, Catherine Klersy, Chiara Bonardi, Silvia Cappello, Lara Quarleri, Annalisa Turri, Elisabetta Montagna, Isabella Iacona, Francesco Valentino, and et al. 2015. "Phase Angle and Handgrip Strength Are Sensitive Early Markers of Energy Intake in Hypophagic, Non-Surgical Patients at Nutritional Risk, with Contraindications to Enteral Nutrition" Nutrients 7, no. 3: 1828-1840. https://doi.org/10.3390/nu7031828