

Postprandial Glucose Variability Following Typical Meals in Youth Living with Type 1 Diabetes
 and
and
Abstract
:1. Introduction
2. Materials and Methods
Statistical Methods
3. Results
4. Discussion
5. Conclusions
Supplementary Materials
Author Contributions
Funding
Institutional Review Board Statement
Informed Consent Statement
Data Availability Statement
Conflicts of Interest
References
- ElSayed, N.A.; Aleppo, G.; Aroda, V.R.; Bannuru, R.R.; Brown, F.M.; Bruemmer, D.; Collins, B.S.; Hilliard, M.E.; Isaacs, D.; Johnson, E.L.; et al. 14. Children and Adolescents: Standards of Care in Diabetes-2023. Diabetes Care 2023, 46, S230–S253. [Google Scholar] [CrossRef] [PubMed]
- Kahkoska, A.R.; Nguyen, C.T.; Adair, L.A.; Aiello, A.E.; Burger, K.S.; Buse, J.B.; Dabelea, D.; Dolan, L.M.; Malik, F.S.; Mottl, A.K.; et al. Longitudinal Phenotypes of Type 1 Diabetes in Youth Based on Weight and Glycemia and Their Association with Complications. J. Clin. Endocrinol. Metab. 2019, 104, 6003–6016. [Google Scholar] [CrossRef] [PubMed]
- Cengiz, E.; Xing, D.; Wong, J.C.; Wolfsdorf, J.I.; Haymond, M.W.; Rewers, A.; Shanmugham, S.; Tamborlane, W.V.; Willi, S.M.; Seiple, D.L.; et al. Severe hypoglycemia and diabetic ketoacidosis among youth with type 1 diabetes in the T1D Exchange clinic registry. Pediatr. Diabetes 2013, 14, 447–454. [Google Scholar] [CrossRef] [PubMed]
- Pivovarov, J.A.; Taplin, C.E.; Riddell, M.C. Current perspectives on physical activity and exercise for youth with diabetes. Pediatr. Diabetes 2015, 16, 242–255. [Google Scholar] [CrossRef] [PubMed]
- Smart, C.E.; Evans, M.; O’Connell, S.M.; McElduff, P.; Lopez, P.E.; Jones, T.W.; Davis, E.A.; King, B.R. Both dietary protein and fat increase postprandial glucose excursions in children with type 1 diabetes, and the effect is additive. Diabetes Care 2013, 36, 3897–3902. [Google Scholar] [CrossRef] [PubMed]
- Lejk, A.; Chrzanowski, J.; Cieslak, A.; Fendler, W.; Mysliwiec, M. Reduced Carbohydrate Diet Influence on Postprandial Glycemia-Results of a Short, CGM-Based, Interventional Study in Adolescents with Type 1 Diabetes. Nutrients 2022, 14, 4689. [Google Scholar] [CrossRef] [PubMed]
- Booth, M. Assessment of physical activity: An international perspective. Res. Q. Exerc. Sport 2000, 71, S114–S120. [Google Scholar] [CrossRef]
- Martin, C.K.; Correa, J.B.; Han, H.; Allen, H.R.; Rood, J.C.; Champagne, C.M.; Gunturk, B.K.; Bray, G.A. Validity of the Remote Food Photography Method (RFPM) for estimating energy and nutrient intake in near real-time. Obesity 2012, 20, 891–899. [Google Scholar] [CrossRef]
- Martin, C.K.; Han, H.; Coulon, S.M.; Allen, H.R.; Champagne, C.M.; Anton, S.D. A novel method to remotely measure food intake of free-living individuals in real time: The remote food photography method. Br. J. Nutr. 2009, 101, 446–456. [Google Scholar] [CrossRef]
- U.S. Department of Agriculture ARS. USDA Food and Nutrient Database for Dietary Studies 2015–2016; U.S. Department of Agriculture ARS: Beltsville, MD, USA, 2018. [Google Scholar]
- Rose, M.H.; Streisand, R.; Aronow, L.; Tully, C.; Martin, C.K.; Mackey, E. Preliminary Feasibility and Acceptability of the Remote Food Photography Method for Assessing Nutrition in Young Children with Type 1 Diabetes. Clin. Pract. Pediatr. Psychol. 2018, 6, 270–277. [Google Scholar] [CrossRef]
- Monzon, A.D.; Smith, L.B.; Powers, S.W.; Dolan, L.M.; Patton, S.R. The Association between Glycemic Variability and Macronutrients in Young Children with T1D. J. Pediatr. Psychol. 2020, 45, 749–758. [Google Scholar] [CrossRef] [PubMed]
- Faber, E.M.; van Kampen, P.M.; Clement-de Boers, A.; Houdijk, E.; van der Kaay, D.C.M. The influence of food order on postprandial glucose levels in children with type 1 diabetes. Pediatr. Diabetes 2018, 19, 809–815. [Google Scholar] [CrossRef] [PubMed]
- Wolpert, H.A.; Atakov-Castillo, A.; Smith, S.A.; Steil, G.M. Dietary fat acutely increases glucose concentrations and insulin requirements in patients with type 1 diabetes: Implications for carbohydrate-based bolus dose calculation and intensive diabetes management. Diabetes Care 2013, 36, 810–816. [Google Scholar] [CrossRef] [PubMed]
- Viguiliouk, E.; Stewart, S.E.; Jayalath, V.H.; Ng, A.P.; Mirrahimi, A.; de Souza, R.J.; Hanley, A.J.; Bazinet, R.P.; Blanco Mejia, S.; Leiter, L.A.; et al. Effect of Replacing Animal Protein with Plant Protein on Glycemic Control in Diabetes: A Systematic Review and Meta-Analysis of Randomized Controlled Trials. Nutrients 2015, 7, 9804–9824. [Google Scholar] [CrossRef] [PubMed]
- Adolfsson, P.; Taplin, C.E.; Zaharieva, D.P.; Pemberton, J.; Davis, E.A.; Riddell, M.C.; McGavock, J.; Moser, O.; Szadkowska, A.; Lopez, P.; et al. ISPAD Clinical Practice Consensus Guidelines 2022: Exercise in children and adolescents with diabetes. Pediatr. Diabetes 2022, 23, 1341–1372. [Google Scholar] [CrossRef] [PubMed]
- Muntis, F.R.; Smith-Ryan, A.E.; Crandell, J.; Evenson, K.R.; Maahs, D.M.; Seid, M.; Shaikh, S.R.; Mayer-Davis, E.J. A High Protein Diet Is Associated with Improved Glycemic Control Following Exercise among Adolescents with Type 1 Diabetes. Nutrients 2023, 15, 1981. [Google Scholar] [CrossRef] [PubMed]
- Annan, S.F.; Higgins, L.A.; Jelleryd, E.; Hannon, T.; Rose, S.; Salis, S.; Baptista, J.; Chinchilla, P.; Marcovecchio, M.L. ISPAD Clinical Practice Consensus Guidelines 2022: Nutritional management in children and adolescents with diabetes. Pediatr. Diabetes 2022, 23, 1297–1321. [Google Scholar] [CrossRef]
- Bell, K.J.; Smart, C.E.; Steil, G.M.; Brand-Miller, J.C.; King, B.; Wolpert, H.A. Impact of fat, protein, and glycemic index on postprandial glucose control in type 1 diabetes: Implications for intensive diabetes management in the continuous glucose monitoring era. Diabetes Care 2015, 38, 1008–1015. [Google Scholar] [CrossRef]
- Mozzillo, E.; Franceschi, R.; Di Candia, F.; Ricci, A.; Leonardi, L.; Girardi, M.; Rosanio, F.M.; Marcovecchio, M.L. Optimal Prandial Timing of Insulin Bolus in Youths with Type 1 Diabetes: A Systematic Review. J. Pers. Med. 2022, 12, 58. [Google Scholar] [CrossRef]
- Kuwata, H.; Iwasaki, M.; Shimizu, S.; Minami, K.; Maeda, H.; Seino, S.; Nakada, K.; Nosaka, C.; Murotani, K.; Kurose, T.; et al. Meal sequence and glucose excursion, gastric emptying and incretin secretion in type 2 diabetes: A randomised, controlled crossover, exploratory trial. Diabetologia 2016, 59, 453–461. [Google Scholar] [CrossRef]
- Ma, J.; Stevens, J.E.; Cukier, K.; Maddox, A.F.; Wishart, J.M.; Jones, K.L.; Clifton, P.M.; Horowitz, M.; Rayner, C.K. Effects of a protein preload on gastric emptying, glycemia, and gut hormones after a carbohydrate meal in diet-controlled type 2 diabetes. Diabetes Care 2009, 32, 1600–1602. [Google Scholar] [CrossRef] [PubMed]
- Wolever, T.M.; Mullan, Y.M. Sugars and fat have different effects on postprandial glucose responses in normal and type 1 diabetic subjects. Nutr. Metab. Cardiovasc. Dis. 2011, 21, 719–725. [Google Scholar] [CrossRef] [PubMed]
- Craig, M.E.; Twigg, S.M.; Donaghue, K.C.; Cameron, F.J.; Conn, J.; Jenkins, A.J.; Silink, M. National Evidence-Based Clinical Care Guidelines for Type 1 Diabetes in Children, Adolescents, and Adults; Australian Government Department of Health and Ageing: Canberra, Australia, 2011. [Google Scholar]
- Garcia-Iborra, M.; Castanys-Munoz, E.; Oliveros, E.; Ramirez, M. Optimal Protein Intake in Healthy Children and Adolescents: Evaluating Current Evidence. Nutrients 2023, 15, 1683. [Google Scholar] [CrossRef] [PubMed]
- Katz, M.L.; Mehta, S.; Nansel, T.; Quinn, H.; Lipsky, L.M.; Laffel, L.M. Associations of nutrient intake with glycemic control in youth with type 1 diabetes: Differences by insulin regimen. Diabetes Technol. Ther. 2014, 16, 512–518. [Google Scholar] [CrossRef] [PubMed]
- Mackey, E.R.; O’Brecht, L.; Holmes, C.S.; Jacobs, M.; Streisand, R. Teens with Type 1 Diabetes: How Does Their Nutrition Measure Up? J. Diabetes Res. 2018, 2018, 5094569. [Google Scholar] [CrossRef] [PubMed]
- Thongpaeng, S.; Sorncharoen, P.; Preechasuk, L.; Santiprabhob, J. Dietary Intake and Physical Activity of Thai Children and Adolescents with Type 1 Diabetes Mellitus. Nutrients 2022, 14, 5169. [Google Scholar] [CrossRef] [PubMed]
- Vance, V.A.; Woodruff, S.J.; McCargar, L.J.; Husted, J.; Hanning, R.M. Self-reported dietary energy intake of normal weight, overweight and obese adolescents. Public. Health Nutr. 2009, 12, 222–227. [Google Scholar] [CrossRef]
- LeBlanc, A.G.; Janssen, I. Difference between self-reported and accelerometer measured moderate-to-vigorous physical activity in youth. Pediatr. Exerc. Sci. 2010, 22, 523–534. [Google Scholar] [CrossRef]
- Spruijt-Metz, D.; Wen, C.K.F.; Bell, B.M.; Intille, S.; Huang, J.S.; Baranowski, T. Advances and Controversies in Diet and Physical Activity Measurement in Youth. Am. J. Prev. Med. 2018, 55, e81–e91. [Google Scholar] [CrossRef]


| Carbohydrates | Fat | Protein | |||||||||
|---|---|---|---|---|---|---|---|---|---|---|---|
| Overall | <25 g | 25–<50 g | 50–<75 g | ≥75 g | <10 g | 10–<30 g | ≥30 g | <0.25 g/kg | 0.25–<0.50 g/kg | ≥0.5 g/kg | |
| Number of Meals | 1980 | 507 | 603 | 458 | 412 | 695 | 815 | 470 | 1000 | 514 | 466 |
| Carbohydrates (g) | 44 (24, 69) | 16 (11, 19) | 37 (30, 43) | 61 (55, 67) | 96 (83, 114) | 24 (14, 43) | 50 (33, 68) | 72 (46, 99) | 30 (18, 49) | 57 (35, 80) | 68 (44, 97) |
| Protein (g/kg) | 0.25 | 0.05 | 0.20 | 0.31 | 0.49 | 0.06 | 0.28 | 0.61 | 0.08 | 0.36 | 0.70 |
| (0.08, 0.48) | (0.02, 0.19) | (0.08, 0.40) | (0.17, 0.51) | (0.33, 0.72) | (0.02, 0.16) | (0.14, 0.45) | (0.42, 0.83) | (0.03, 0.16) | (0.31, 0.43) | (0.59, 0.88) | |
| Fat (g) | 16 (7, 29) | 6 (1, 11) | 14 (8, 23) | 20 (11, 30) | 32 (20, 47) | 4 (1, 7) | 18 (14, 23) | 42 (35, 53) | 8 (3, 14) | 21 (14, 31) | 36 (24, 51) |
| Fiber (g) | 2.7 | 0.7 | 2.2 | 3.7 | 6.2 | 1.0 | 3.1 | 5.2 | 1.5 | 3.7 | 5.3 |
| (1.1, 5.1) | (0.1, 1.6) | (1.2, 3.5) | (2.2, 5.5) | (4.3, 8.8) | (0.3, 2.7) | (1.6, 5.1) | (3.1, 7.7) | (0.5, 3.1) | (2.0, 5.6) | (2.9, 7.6) | |
| Meal weight (g) | 248 | 68 | 215 | 305 | 481 | 124 | 246 | 400 | 121 | 307 | 427 |
| (111, 401) | (28, 161) | (118, 327) | (208, 419) | (358, 661) | (32, 272) | (135, 393) | (285, 585) | (49, 248) | (204, 430) | (327, 629) | |
| Insulin on board (U/kg) | 0.07 | 0.05 | 0.07 | 0.08 | 0.09 | 0.06 | 0.07 | 0.07 | 0.06 | 0.07 | 0.08 |
| (0.02, 0.12) | (0.02, 0.09) | (0.02, 0.11) | (0.02, 0.14) | (0.03, 0.15) | (0.02, 0.11) | (0.02, 0.13) | (0.02, 0.13) | (0.02, 0.12) | (0.02, 0.13) | (0.03, 0.13) | |
| N | Mean ± SD | Adjusted Mean Difference (95% CI) | p-Value a | |
|---|---|---|---|---|
| Glucose CV (%) | ||||
| Overall | 1980 | 19 ± 10% | - | - |
| Carbohydrates | 0.002 | |||
| <25 g | 507 | 18 ± 9% | Reference | |
| 25 to <50 g | 603 | 18 ± 9% | 0.3% (−0.8%, 1.5%) | |
| 50 to <75 g | 458 | 20 ± 10% | 1.9% (0.6%, 3.2%) | |
| ≥75 g | 412 | 21 ± 10% | 3.0% (1.4%, 4.6%) | |
| Fat | 0.006 | |||
| <10 g | 695 | 19 ± 9% | Reference | |
| 10 to <30 g | 815 | 19 ± 10% | −0.5% (−1.5%, 0.5%) | |
| ≥30 g | 470 | 19 ± 10% | −1.0% (−2.4%, 0.3%) | |
| Protein | 0.19 | |||
| <0.25 g/kg | 1000 | 19 ± 9% | Reference | |
| 0.25 to <0.50 g/kg | 514 | 19 ± 9% | −0.7% (−1.8%, 0.4%) | |
| ≥0.50 g/kg | 466 | 19 ± 10% | −0.9% (−2.1%, 0.3%) | |
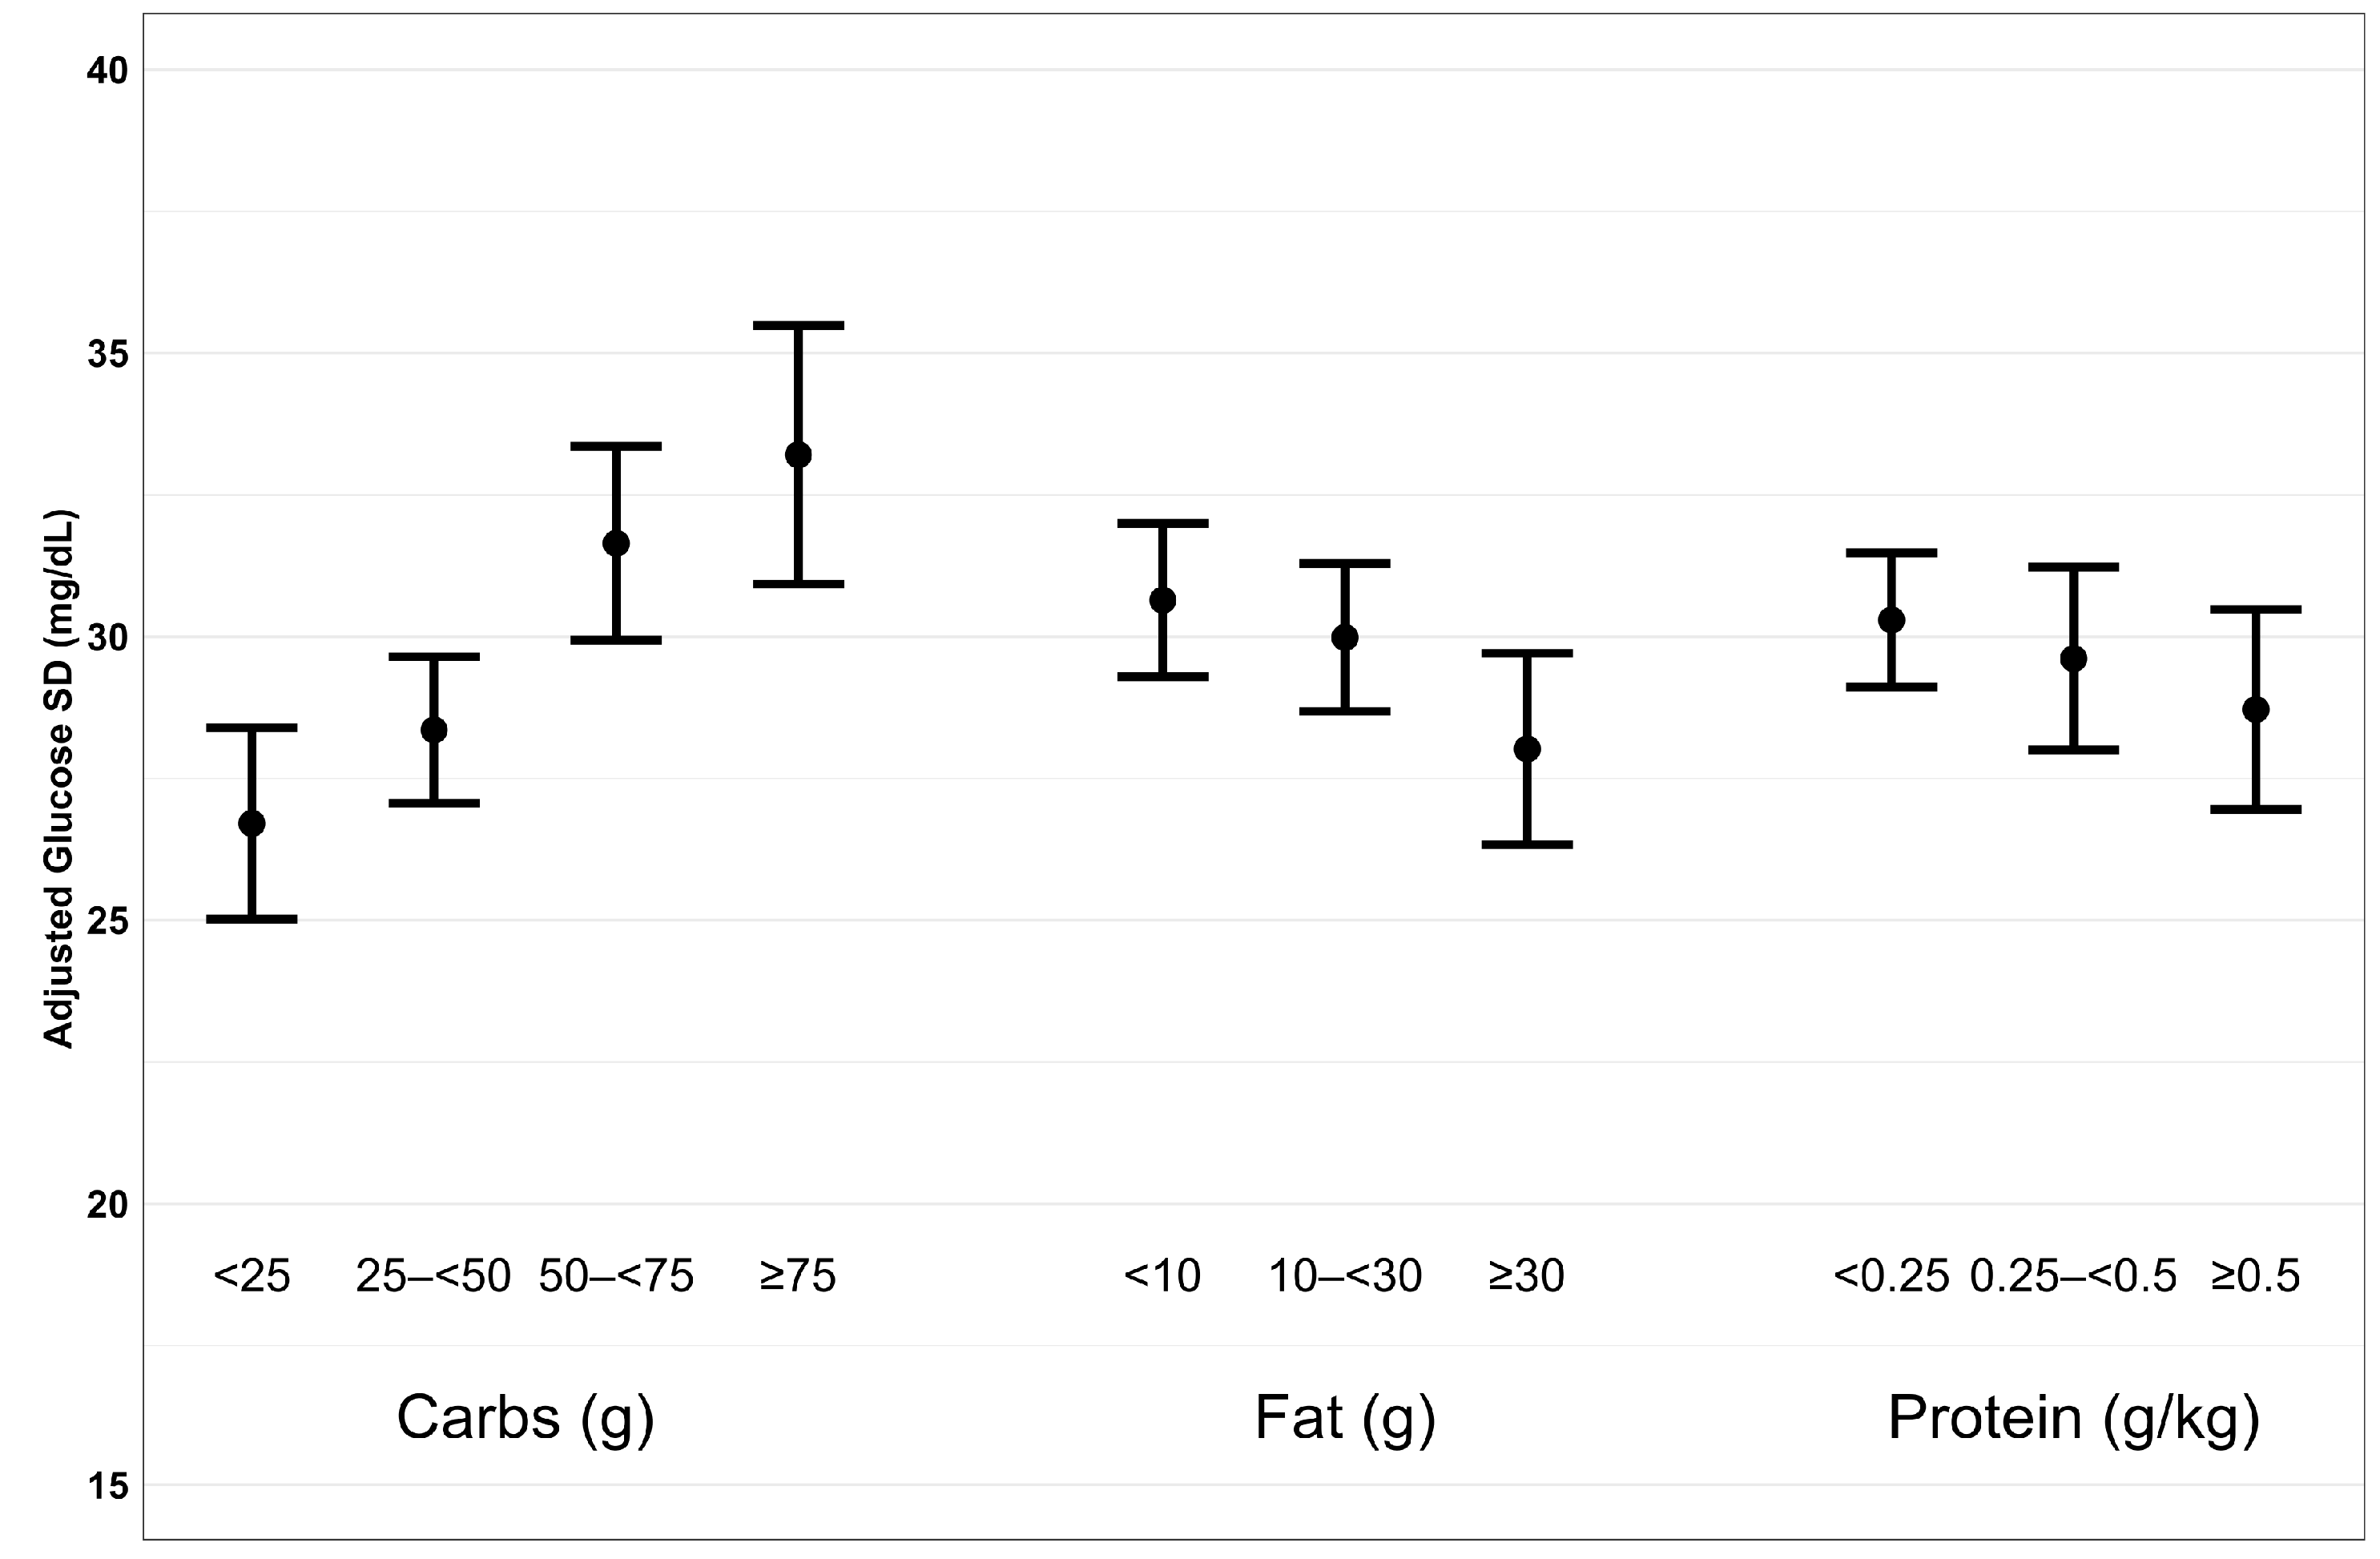
| Glucose SD (mg/dL) | ||||
| Overall | 1980 | 30 ± 17 | - | - |
| Carbohydrates | <0.001 | |||
| <25 g | 507 | 26 ± 15 | Reference | |
| 25 to <50 g | 603 | 28 ± 15 | 1.6 (−0.4, 3.6) | |
| 50 to <75 g | 458 | 32 ± 18 | 5.1 (2.8, 7.4) | |
| ≥75 g | 412 | 33 ± 19 | 6.6 (3.8, 9.3) | |
| Fat | <0.001 | |||
| <10 g | 695 | 29 ± 17 | Reference | |
| 10 to <30 g | 815 | 30 ± 17 | −0.5 (−2.3, 1.3) | |
| ≥30 g | 470 | 30 ± 17 | −2.7 (−5.0, −0.4) | |
| Protein | 0.03 | |||
| <0.25 g/kg | 1000 | 29 ± 16 | Reference | |
| 0.25 to <0.50 g/kg | 514 | 30 ± 17 | −0.7 (−2.6, 1.2) | |
| ≥0.50 g/kg | 466 | 30 ± 18 | −1.8 (−3.8, 0.3) |
Disclaimer/Publisher’s Note: The statements, opinions and data contained in all publications are solely those of the individual author(s) and contributor(s) and not of MDPI and/or the editor(s). MDPI and/or the editor(s) disclaim responsibility for any injury to people or property resulting from any ideas, methods, instructions or products referred to in the content. |
© 2024 by the authors. Licensee MDPI, Basel, Switzerland. This article is an open access article distributed under the terms and conditions of the Creative Commons Attribution (CC BY) license (https://creativecommons.org/licenses/by/4.0/).
Share and Cite
Patton, S.R.; Bergford, S.; Sherr, J.L.; Gal, R.L.; Calhoun, P.; Clements, M.A.; Riddell, M.C.; Martin, C.K. Postprandial Glucose Variability Following Typical Meals in Youth Living with Type 1 Diabetes. Nutrients 2024, 16, 162. https://doi.org/10.3390/nu16010162
Patton SR, Bergford S, Sherr JL, Gal RL, Calhoun P, Clements MA, Riddell MC, Martin CK. Postprandial Glucose Variability Following Typical Meals in Youth Living with Type 1 Diabetes. Nutrients. 2024; 16(1):162. https://doi.org/10.3390/nu16010162
Chicago/Turabian StylePatton, Susana R., Simon Bergford, Jennifer L. Sherr, Robin L. Gal, Peter Calhoun, Mark A. Clements, Michael C. Riddell, and Corby K. Martin. 2024. "Postprandial Glucose Variability Following Typical Meals in Youth Living with Type 1 Diabetes" Nutrients 16, no. 1: 162. https://doi.org/10.3390/nu16010162