
The Relationship between Mental and Physical Minor Health Complaints and the Intake of Dietary Nutrients
 ,
,
Abstract
:
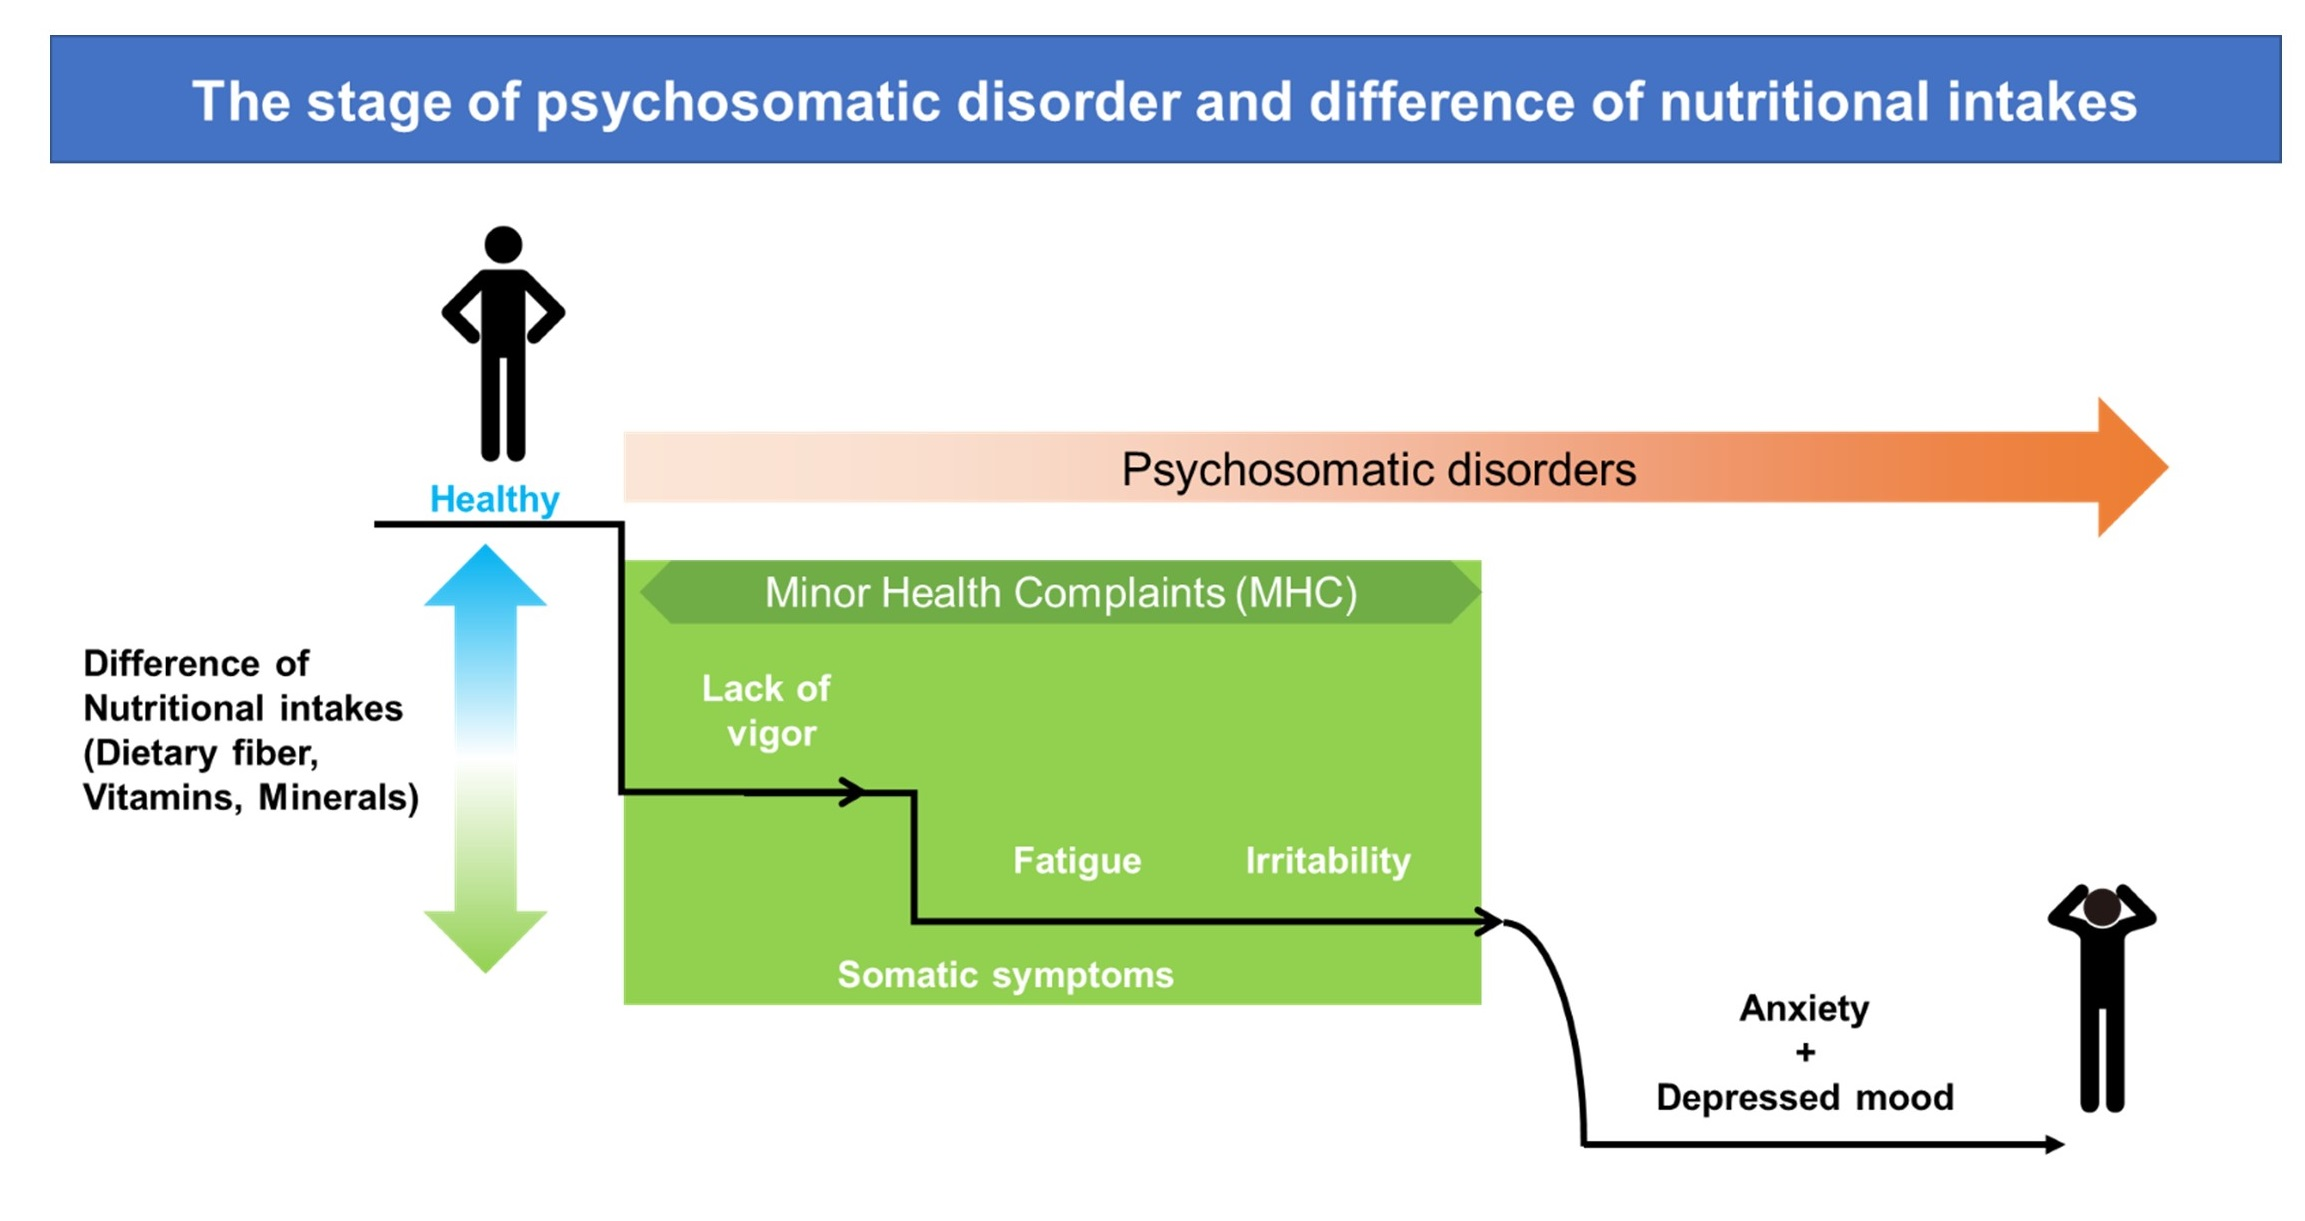
1. Introduction
2. Materials and Methods
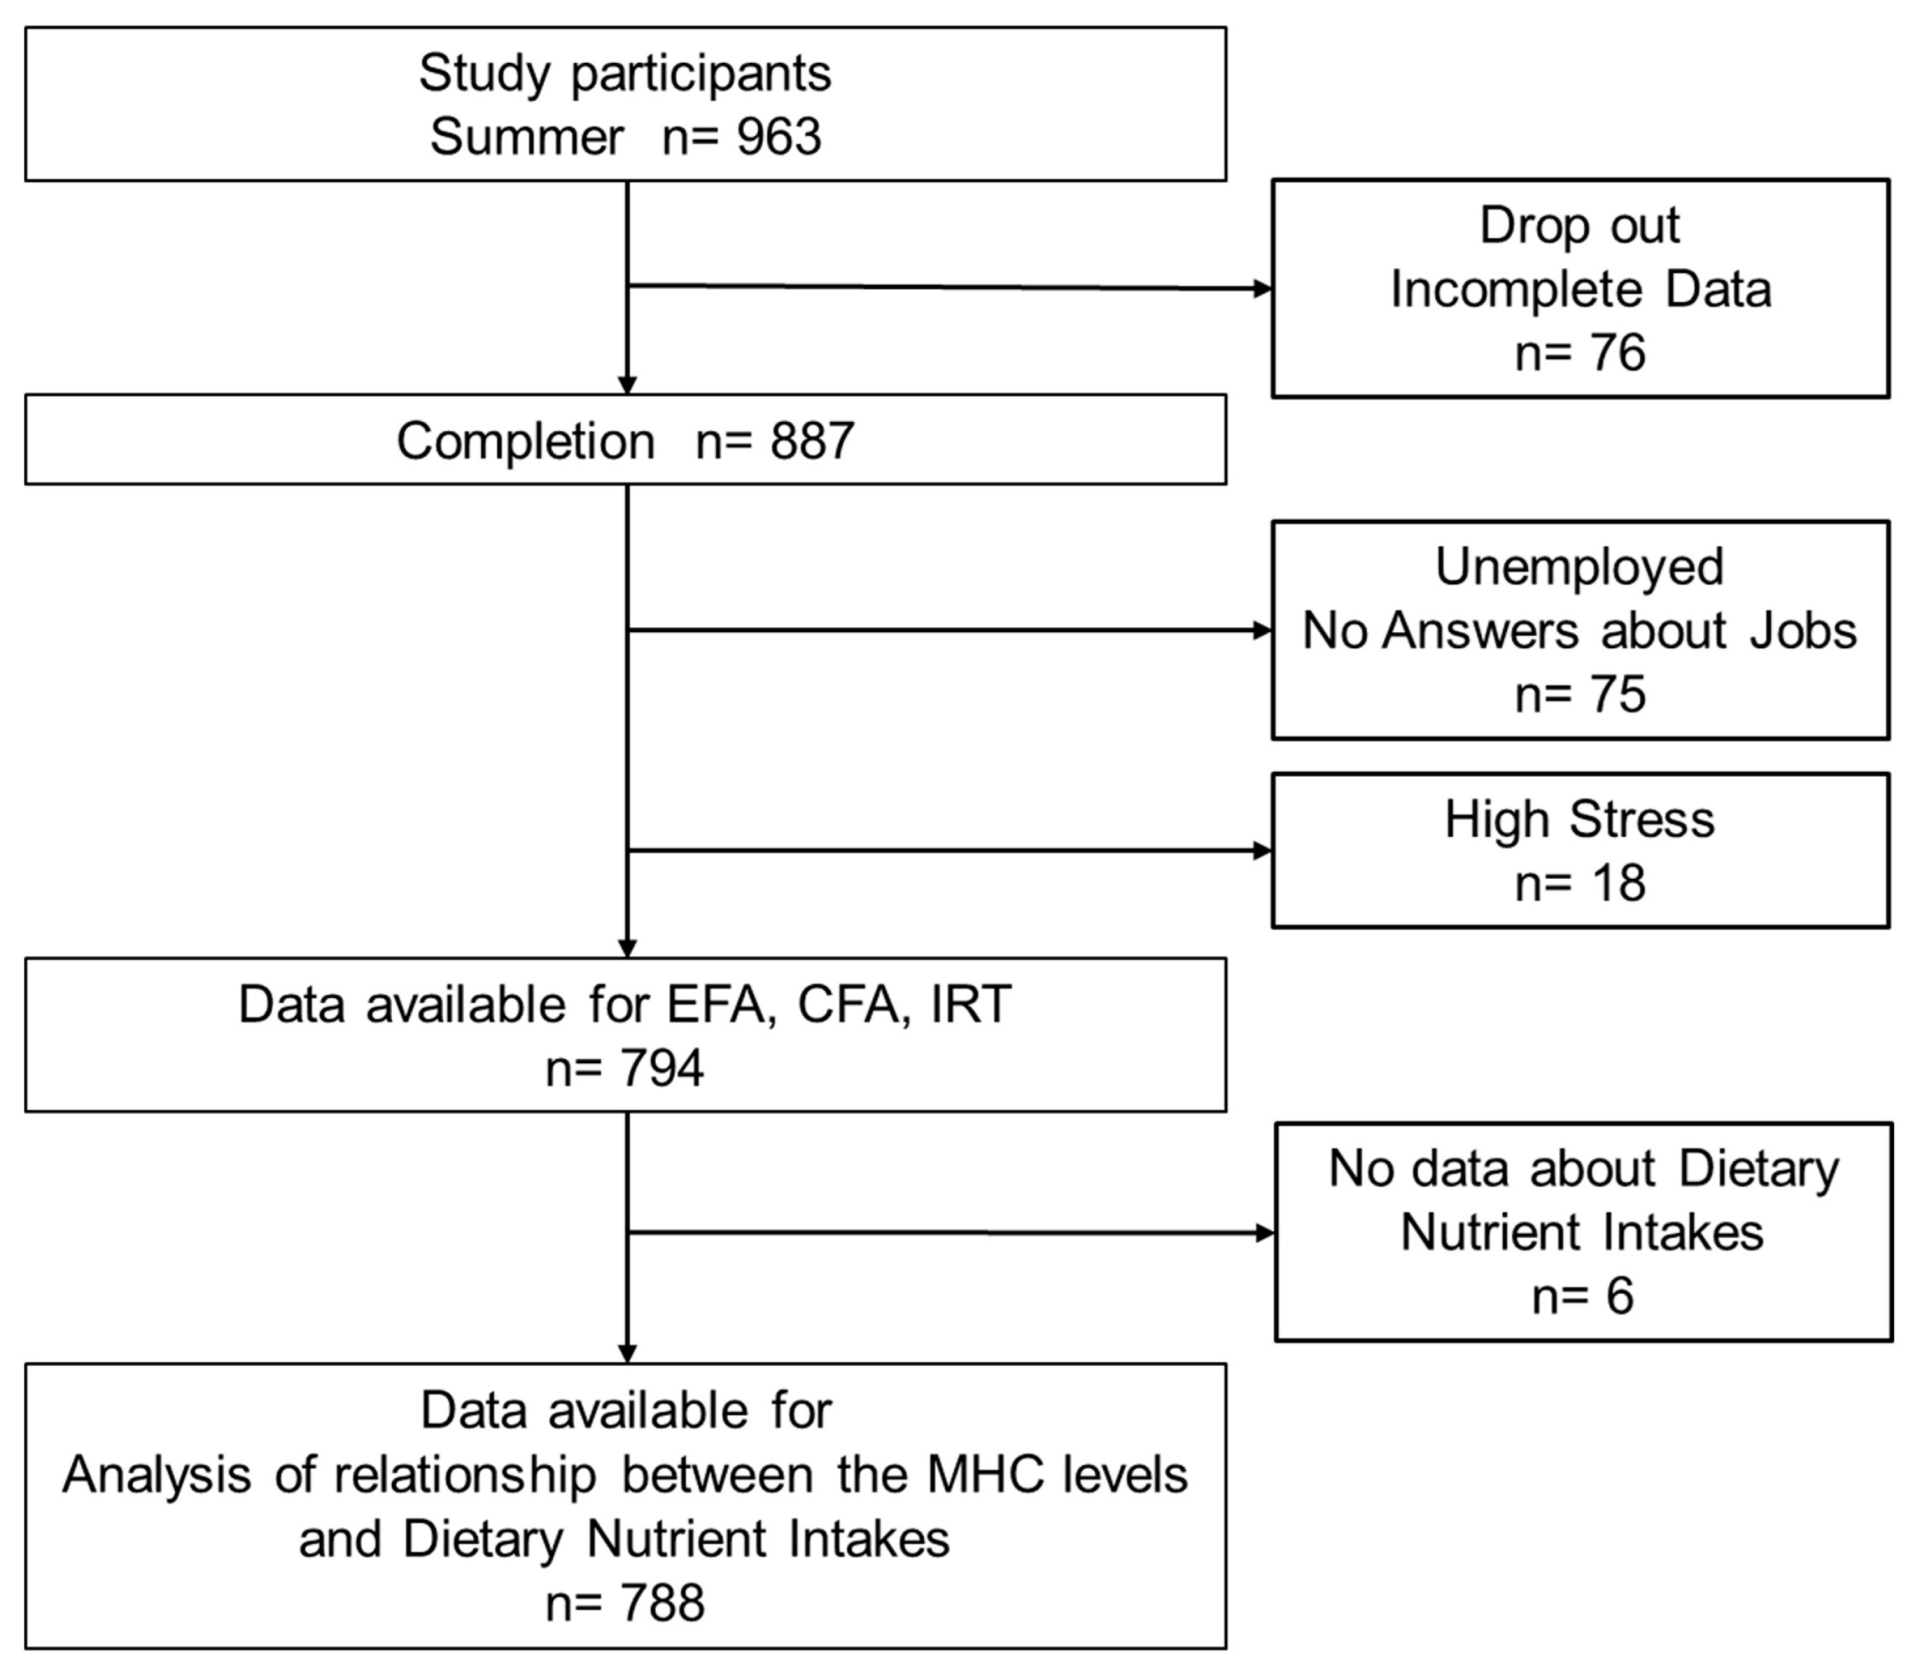
2.1. Study Design and Population
2.2. Measurement of the Level of Psychosomatic Disorders
2.3. Estimation of Dietary Nutrient Intakes (Nutritional Survey)
2.4. Analysis of the Relationship between the MHC Levels and the Intake of Dietary Nutrients
2.5. Statistical Analysis
2.6. Ethics
3. Results
3.1. Baseline Characteristics
3.2. Characterization of the Analysis Population Using the BJSQ
3.3. Evaluation of MHCs Using the BJSQ
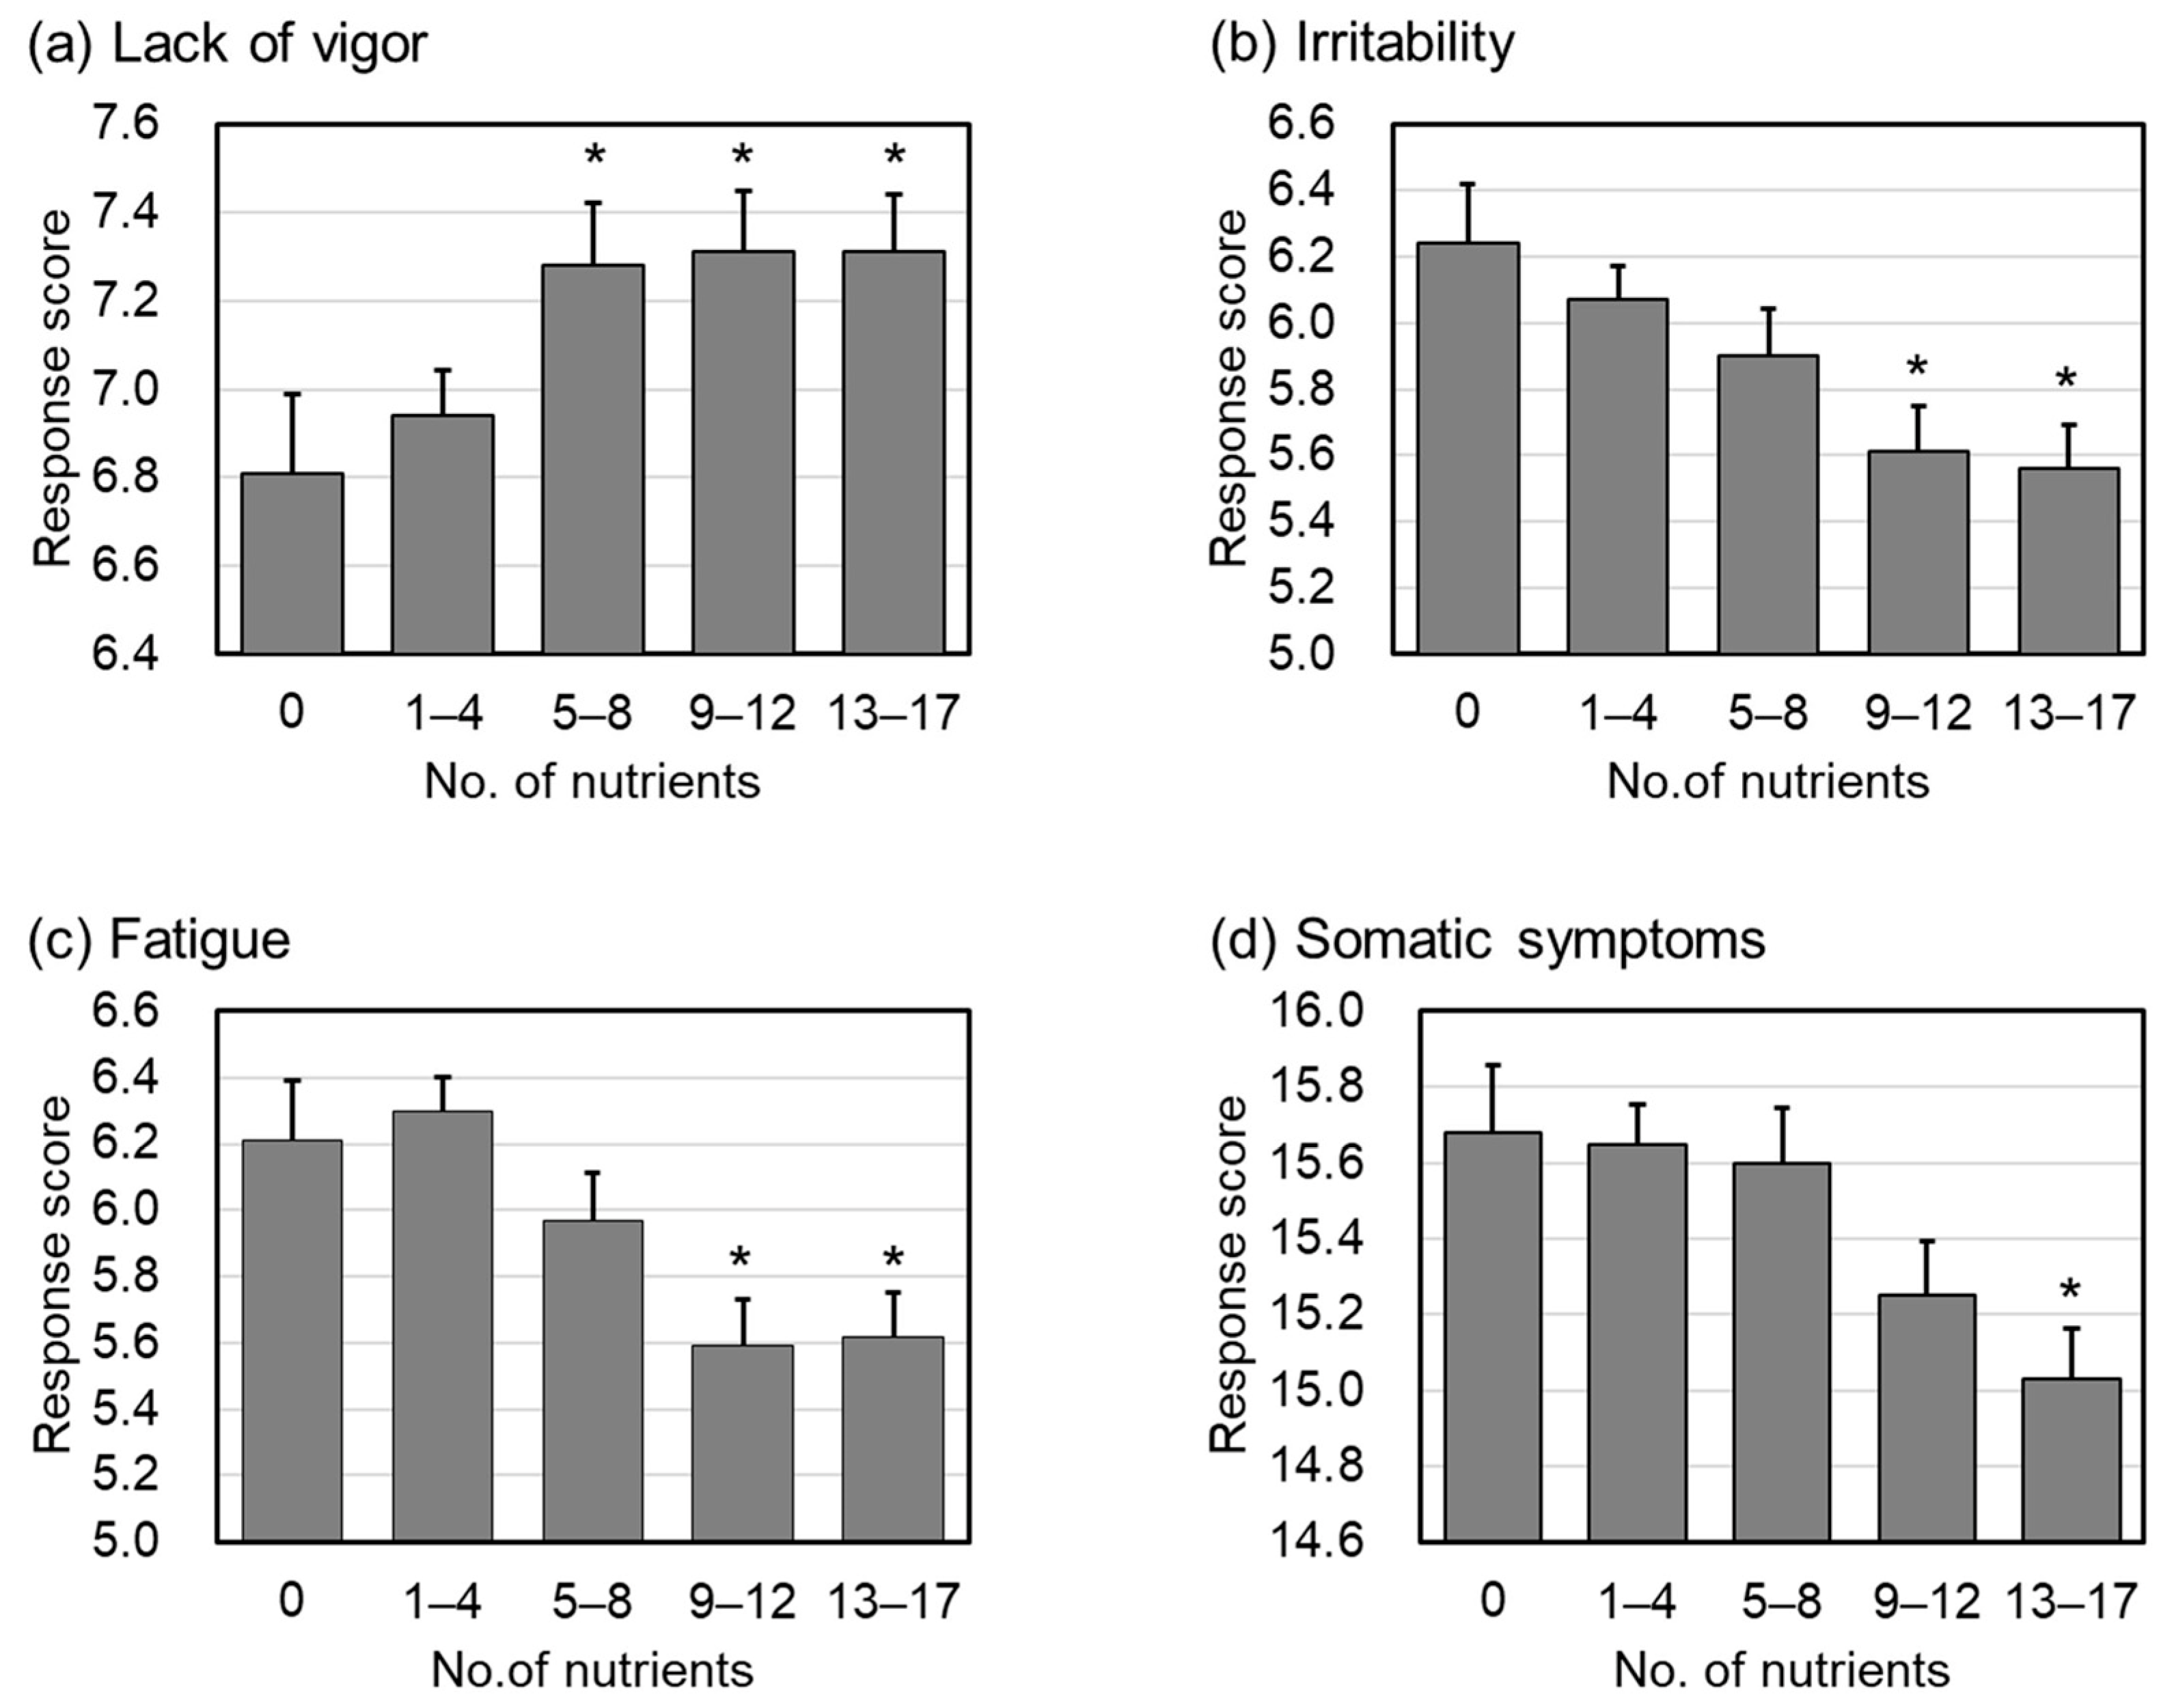
3.4. Relationship between MHC and the Intake of Dietary Nutrients
4. Discussion
5. Conclusions
Author Contributions
Funding
Institutional Review Board Statement
Informed Consent Statement
Data Availability Statement
Acknowledgments
Conflicts of Interest
References
- Suga, M.; Araki, T.; Suzuki, T.; Miyaki, K.; Nakayama, T. [Presenteeism-a pilot study towards the integration of medicine and business administration] Presenteeism-igaku to keieigaku no yuugo ni muketa Pilot Study. Res. Work. Competency 2017, 5, 25–42. (In Japanese) [Google Scholar]
- Proto, E. Are happy workers more productive? IZA World Labor 2016, 315. [Google Scholar] [CrossRef]
- Domínguez Díaz, L.; Fernández-Ruiz, V.; Cámara, M. An international regulatory review of food health-related claims in functional food products labeling. J. Funct. Foods 2020, 68, 103896. [Google Scholar] [CrossRef]
- Grand-View-Research-Inc. Functional Foods Market Size Worth $586.1 Billion by 2030. Available online: https://www.grandviewresearch.com/press-release/global-functional-foods-market (accessed on 12 December 2022).
- Martín-Peláez, S.; Fito, M.; Castaner, O. Mediterranean Diet Effects on Type 2 Diabetes Prevention, Disease Progression, and Related Mechanisms. A Review. Nutrients 2020, 12, 2236. [Google Scholar] [CrossRef] [PubMed]
- Knight, E.; Geetha, T.; Burnett, D.; Babu, J.R. The Role of Diet and Dietary Patterns in Parkinson’s Disease. Nutrients 2022, 14, 4472. [Google Scholar] [CrossRef] [PubMed]
- Maeda-Yamamoto, M.; Honmou, O.; Sasaki, M.; Haseda, A.; Kagami-Katsuyama, H.; Shoji, T.; Namioka, A.; Namioka, T.; Magota, H.; Oka, S.; et al. The Impact of Purple-Flesh Potato (Solanum tuberosum L.) cv. “Shadow Queen” on Minor Health Complaints in Healthy Adults: A Randomized, Double-Blind, Placebo-Controlled Study. Nutrients 2022, 14, 2446. [Google Scholar] [CrossRef] [PubMed]
- Shimizu, K.; Fukuda, M.; Yamamoto, H. Effect of Repeated Intake of Imidazole Dipeptides-containing Drink on Healthy People with Feeling of Fatigue from Daily Activities—The Results of 207 Volunteers Enrolled in the 1st Recruitment. Jpn. Pharmacol. Ther. 2009, 37, 255–263. (In Japanese) [Google Scholar]
- Kato, M. Final development of the Brief Job Stress Questionnaire mainly used for assessment of the individuals. In The Ministry of Labour Sponsored Grant for the Prevention of Work-Related Illness; Tokyo Medical University: Tokyo, Japan, 2000; Available online: http://www.tmu-ph.ac/pdf/H11report.pdf (accessed on 12 December 2022). (In Japanese)
- Ministry of Education, Culture, Sports, Science and Technology: Standard Tables of Food Composition in Japan—2015—(Seventh Revised Edition). Available online: https://www.mext.go.jp/en/policy/science_technology/policy/title01/detail01/1374030.htm (accessed on 12 December 2022).
- R Core Team. R: A Language and Environment for Statistical Computing; R Core Team: Vienna, Austria, 2021; Available online: https://www.R-project.org/ (accessed on 6 February 2023).
- Revelle, W. psych: Procedures for Psychological, Psychometric, and Personality Research; Evanston, Illinois. 2021. Available online: https://cran.r-project.org/web/packages/psych/index.html (accessed on 6 February 2023).
- Rosseel, Y. Lavaan: An R package for structural equation modeling. J. Stat. Softw. 2012, 48, 1–36. [Google Scholar] [CrossRef]
- Rizopoulos, D. ltm: An R Package for Latent Variable Modeling and Item Response Analysis. J. Stat. Softw. 2006, 17, 1–25. [Google Scholar] [CrossRef]
- Partchev, I.; Maris, G. irtoys: A Collection of Functions Related to Item Response Theory (IRT). 2017. Available online: https://cran.r-project.org/web/packages/irtoys/index.html (accessed on 6 February 2023).
- Tousen, Y.; Mizushima, R.; Koitani, N.; Kurotani, K.; Nishihira, J.; Maeda-Yamamoto, M.; Takimoto, H. A literature review on the relationship between questionnaires for assessing minor health complaints and health status indices among Japanese people. Jpn. J. Public Health 2022, 69, 368–382. [Google Scholar]
- Ministry of Health, Labour, and Welfare. Manual for Implementation of Stress-Check System based on Industrial Safety and Health Act. 2022. Available online: https://www.mhlw.go.jp/content/000533925.pdf (accessed on 12 December 2022).
- Coppen, A.; Bailey, J. Enhancement of the antidepressant action of fluoxetine by folic acid: A randomised, placebo controlled trial. J. Affect. Disord. 2000, 60, 121–130. [Google Scholar] [CrossRef] [PubMed]
- Zeng, H.; Lazarova, D.L.; Bordonaro, M. Mechanisms linking dietary fiber, gut microbiota and colon cancer prevention. World J. Gastrointest Oncol. 2014, 6, 41–51. [Google Scholar] [CrossRef] [PubMed]
- Skonieczna-Żydecka, K.; Marlicz, W.; Misera, A.; Koulaouzidis, A.; Łoniewski, I. Microbiome—The Missing Link in the Gut-Brain Axis: Focus on Its Role in Gastrointestinal and Mental Health. J. Clin. Med. 2018, 7, 521. [Google Scholar] [CrossRef] [PubMed] [Green Version]
- Nakaji, S.; Tokunaga, S.; Sakamoto, J.; Todate, M.; Shimoyama, T.; Umeda, T.; Sugawara, K. Relationship between lifestyle factors and defecation in a Japanese population. Eur. J. Nutr. 2002, 41, 244–248. [Google Scholar] [CrossRef] [PubMed]
- Kinoshita, Y.; Shoji, S.; Hayashi, T.; Okumura, H. A cross-sectional analysis of the health-related quality of life and work productivity in Japanese subjects with self-reported chronic constipation using the National Health and Wellness Survey 2017. J. Jpn. Soc. Gastroenterol. 2020, 117, 504–513. (In Japanese) [Google Scholar]
- Kyo, H.; Hasebe, H.; Ishihara, K.; Ito, M.; Uebaba, K.; Suzuki, N. Effects of the Intake of Fruits Granola on Defecation and Quality of Life. Jpn. J. Complement. Altern. Med. 2017, 14, 23–26. (In Japanese) [Google Scholar]
- Sato, K. Why is vitamin B6 effective in alleviating the symptoms of autism? Med. Hypotheses 2018, 115, 103–106. [Google Scholar] [CrossRef] [PubMed]
- Iijima, Y.; Soeno, N.; Inomata, M.; Shioiri, T.; Saito, R.; Kimoto, K.; Tomabechi, K.; Mita, R.; Inoue, K.; Ikegami, S.; et al. Influence of β-carotene and Vitamin C on Physiologic and Psychologic Responses to Stress. Jpn. J. Nutr. 1995, 53, 93–102. (In Japanese) [Google Scholar] [CrossRef] [Green Version]


| Fiscal Year | Age Groups | Total | Male | Female | |||
|---|---|---|---|---|---|---|---|
| n | % | n | % | n | % | ||
| All | 20 to 29 | 42 | 5.3 | 13 | 5.5 | 29 | 5.2 |
| 30 to 39 | 118 | 14.9 | 40 | 16.8 | 78 | 14.0 | |
| 40 to 49 | 232 | 29.2 | 70 | 29.4 | 162 | 29.1 | |
| 50 to 59 | 262 | 33.0 | 66 | 27.7 | 196 | 35.3 | |
| 60 to 69 | 116 | 14.6 | 40 | 16.8 | 76 | 13.7 | |
| 70 and more | 24 | 3.0 | 9 | 3.8 | 15 | 2.7 | |
| all | 794 | - | 238 | - | 556 | - | |
| 2019 | 20 to 29 | 21 | 4.0 | 8 | 4.9 | 13 | 3.6 |
| 30 to 39 | 73 | 14.0 | 27 | 16.6 | 46 | 12.9 | |
| 40 to 49 | 148 | 28.5 | 45 | 27.6 | 103 | 28.9 | |
| 50 to 59 | 170 | 32.7 | 44 | 27.0 | 126 | 35.3 | |
| 60 to 69 | 86 | 16.5 | 30 | 18.4 | 56 | 15.7 | |
| 70 and more | 22 | 4.2 | 9 | 5.5 | 13 | 3.6 | |
| all | 520 | - | 163 | - | 357 | - | |
| 2020 | 20 to 29 | 21 | 7.7 | 5 | 6.7 | 16 | 8.0 |
| 30 to 39 | 45 | 16.4 | 13 | 17.3 | 32 | 16.1 | |
| 40 to 49 | 84 | 30.7 | 25 | 33.3 | 59 | 29.6 | |
| 50 to 59 | 92 | 33.6 | 22 | 29.3 | 70 | 35.2 | |
| 60 to 69 | 30 | 10.9 | 10 | 13.3 | 20 | 10.1 | |
| 70 and more | 2 | 0.7 | 0 | 0.0 | 2 | 1.0 | |
| all | 274 | - | 75 | - | 199 | - | |
| No. | Question | ML1 | ML2 | ML3 | ML4 | ML5 | |
|---|---|---|---|---|---|---|---|
| Lack of Vigor | Q01 | I have been very active | 0.86 | ||||
| Q02 | I have been full of energy | 0.88 | |||||
| Q03 | I have been lively | 0.91 | |||||
| Irritability | Q04 | I have felt angry | 0.86 | ||||
| Q05 | I have been inwardly annoyed or aggravated | 0.87 | |||||
| Q06 | I have felt irritable | 0.70 | |||||
| Fatigue | Q07 | I have felt extremely tired | 0.81 | ||||
| Q08 | I have felt exhausted | 0.84 | |||||
| Q09 | I have felt weary or listless | 0.52 | |||||
| Anxiety | Q10 | I have felt tense | 0.36 | ||||
| Q11 | I have felt worried or insecure | 0.74 | |||||
| Q12 | I have felt restless | 0.65 | |||||
| Depressed Mood | Q13 | I have been depressed | 0.71 | ||||
| Q14 | I have thought that doing anything was a hassle | 0.42 | |||||
| Q15 | I have been unable to concentrate | 0.57 | |||||
| Q16 | I have felt gloomy | 0.69 | |||||
| Q17 | I have been unable to handle work | 0.62 | |||||
| Q18 | I have felt sad | 0.59 | |||||
| Somatic Symptoms | Q19 | I have felt dizzy | 0.34 | ||||
| Q20 | I have experienced joint pains | 0.41 | |||||
| Q21 | I have experienced headaches | 0.52 | |||||
| Q22 | I have had a stiff neck and/or shoulders | 0.60 | |||||
| Q23 | I have had lower back pain | 0.54 | |||||
| Q24 | I have had eyestrain | 0.50 | |||||
| Q25 | I have experienced heart palpitations or shortness of breath | 0.34 | |||||
| Q26 | I have experienced stomach and/or intestine problems | 0.32 | |||||
| Q27 | I have lost my appetite | 0.32 | |||||
| Q28 | I have experienced diarrhea and/or constipation | 0.32 | |||||
| Q29 | I have not been able to sleep well | 0.29 |
| Lack of Vigor | Irritability | Fatigue | Somatic Symptoms | Cut-Off | |||||||||
|---|---|---|---|---|---|---|---|---|---|---|---|---|---|
| Low | High | p | Low | High | p | Low | High | p | Low | High | p | ||
| K (mg) | 2436.8 | 2538.5 | 0.007 | 2531.0 | 2349.1 | 0.000 | 2544.8 | 2353.8 | 0.000 | 2507.0 | 2441.6 | 0.129 | >2500 |
| Mg (mg) | 265.3 | 278.3 | 0.002 | 276.5 | 256.2 | 0.000 | 278.1 | 256.5 | 0.000 | 274.4 | 265.8 | 0.064 | >270 |
| P (mg) | 1071.4 | 1114.5 | 0.005 | 1106.9 | 1045.1 | 0.001 | 1107.4 | 1054.4 | 0.001 | 1100.1 | 1074.8 | 0.143 | >1100 |
| Fe (mg) | 8.07 | 8.38 | 0.006 | 8.36 | 7.80 | 0.004 | 8.34 | 7.93 | 0.000 | 8.22 | 8.16 | 0.611 | >8.1 |
| Zn (mg) | 8.29 | 8.72 | 0.014 | 8.59 | 8.16 | 0.006 | 8.58 | 8.26 | 0.035 | 8.57 | 8.34 | 0.775 | >8.5 |
| Cu (mg) | 1.14 | 1.18 | 0.034 | 1.18 | 1.10 | 0.002 | 1.18 | 1.11 | 0.000 | 1.17 | 1.14 | 0.207 | >1.18 |
| VA (μgRE) | 574.0 | 564.1 | 0.003 | 569.9 | 570.2 | 0.010 | 565.8 | 577.8 | 0.000 | 609.9 | 520.2 | 0.053 | >570 |
| β-Cx (μg) | 221.0 | 261.7 | 0.003 | 261.2 | 179.9 | 0.004 | 274.5 | 168.8 | 0.000 | 253.6 | 217.4 | 0.011 | >260 |
| β-Ct (μg) | 3045.1 | 3294.1 | 0.040 | 3240.8 | 2914.5 | 0.005 | 3272.1 | 2910.9 | 0.000 | 3173.0 | 3111.3 | 0.100 | >3200 |
| VB1 (mg) | 0.96 | 0.99 | 0.040 | 0.99 | 0.94 | 0.008 | 0.99 | 0.95 | 0.027 | 0.99 | 0.96 | 0.308 | >0.97 |
| Niacin (mgNE) | 31.86 | 33.53 | 0.001 | 33.22 | 30.89 | 0.000 | 33.27 | 31.18 | 0.000 | 33.23 | 31.67 | 0.025 | >33 |
| VB6 (mg) | 1.21 | 1.28 | 0.003 | 1.27 | 1.16 | 0.000 | 1.28 | 1.16 | 0.000 | 1.26 | 1.21 | 0.057 | >1.25 |
| FA (μg) | 295.1 | 316.1 | 0.001 | 311.8 | 283.6 | 0.000 | 311.9 | 288.1 | 0.000 | 311.2 | 294.1 | 0.026 | >300 |
| PA (mg) | 5.98 | 6.22 | 0.018 | 6.18 | 5.82 | 0.000 | 6.20 | 5.84 | 0.000 | 6.17 | 5.96 | 0.072 | >6.0 |
| TDF (g) | 18.06 | 18.90 | 0.009 | 18.84 | 17.32 | 0.000 | 18.78 | 17.68 | 0.000 | 18.69 | 18.03 | 0.038 | >18 |
| IDF (g) | 11.63 | 12.23 | 0.007 | 12.24 | 10.97 | 0.000 | 12.19 | 11.27 | 0.000 | 12.06 | 11.64 | 0.073 | >12 |
| Biotin (μg) | 40.60 | 42.66 | 0.003 | 42.07 | 39.88 | 0.003 | 42.23 | 39.93 | 0.000 | 42.48 | 40.12 | 0.065 | >42 |
Disclaimer/Publisher’s Note: The statements, opinions and data contained in all publications are solely those of the individual author(s) and contributor(s) and not of MDPI and/or the editor(s). MDPI and/or the editor(s) disclaim responsibility for any injury to people or property resulting from any ideas, methods, instructions or products referred to in the content. |
© 2023 by the authors. Licensee MDPI, Basel, Switzerland. This article is an open access article distributed under the terms and conditions of the Creative Commons Attribution (CC BY) license (https://creativecommons.org/licenses/by/4.0/).
Share and Cite
Kagami-Katsuyama, H.; Sato-Ueshima, M.; Satoh, K.; Tousen, Y.; Takimoto, H.; Maeda-Yamamoto, M.; Nishihira, J. The Relationship between Mental and Physical Minor Health Complaints and the Intake of Dietary Nutrients. Nutrients 2023, 15, 865. https://doi.org/10.3390/nu15040865
Kagami-Katsuyama H, Sato-Ueshima M, Satoh K, Tousen Y, Takimoto H, Maeda-Yamamoto M, Nishihira J. The Relationship between Mental and Physical Minor Health Complaints and the Intake of Dietary Nutrients. Nutrients. 2023; 15(4):865. https://doi.org/10.3390/nu15040865
Chicago/Turabian StyleKagami-Katsuyama, Hiroyo, Maremi Sato-Ueshima, Kouji Satoh, Yuko Tousen, Hidemi Takimoto, Mari Maeda-Yamamoto, and Jun Nishihira. 2023. "The Relationship between Mental and Physical Minor Health Complaints and the Intake of Dietary Nutrients" Nutrients 15, no. 4: 865. https://doi.org/10.3390/nu15040865