Article

Consumer Attitudes and Preferences for Healthy Boxed Meal Attributes in Taiwan: Evidence from a Choice Experiment

1
Department of Accounting, Jiaxing University, Jiaxing 314001, China
2
Department of Health Industry Technology Management, Chung Shan Medical University, Taichung City 40201, Taiwan
3
Department of Medical Management, Chung Shan Medical University Hospital, Taichung City 40201, Taiwan
*
Author to whom correspondence should be addressed.
Nutrients 2023, 15(4), 1032; https://doi.org/10.3390/nu15041032
Submission received: 28 December 2022 / Revised: 9 February 2023 / Accepted: 16 February 2023 / Published: 19 February 2023

Abstract

:
Consumers have realized the importance of a healthy diet, hoping to reduce the occurrence of obesity and chronic diseases. Therefore, healthy boxed meals with low calories and high protein are gaining attention. This study divided the attributes of healthy boxed meals into five categories, namely, taste, nutrition facts, traceability certification, carbon footprint label, and price, and investigated the relationship between consumer preferences and willingness to pay (WTP) using a choice experiment. A purposive sampling procedure was used to collect 495 valid questionnaires. The results indicate the following: (1) when purchasing healthy boxed meals, the respondents were most concerned with traceability certification and nutrition facts; (2) the respondents were willing to pay a premium for meals with traceability certification (NTD 4.6) and nutrition facts (NTD 4.4); (3) respondents > 40 years with an average monthly salary of > NTD 30,000 who worked out regularly and were in the process of muscle building, fat loss, or weight control had higher WTP for meals with nutrition labels; and (4) female respondents who were 30–39 years old with a college or university education or above had higher WTP for meals with traceable ingredients. The results may help healthy boxed meal companies understand and pay attention to consumer needs, which will, in turn, provide a reference for future product development and marketing strategies.

1. Introduction

The employment rate of women has increased in Taiwan with economic and social development, while the frequency of cooking at home has decreased and dietary habits have changed, leading to a yearly increase in the number of people who eat out. According to the 2019 Dining Trends in Taiwan published by Ipsos [1], as many as 70% of Taiwanese people eat outside the home or use takeout more than seven times a week, and more than 20% eat outside the home three meals a day. Ninety percent of Taiwanese food eaters choose to eat out with boxed meals, which has led to a booming bento industry in Taiwan [2]. Boxed meal means that the staple food is rice, noodles, or other staple food as the main raw material, accompanied by agricultural, livestock, aquatic products and other cooking dishes, which are combined (or mixed and stir-fried), properly packaged, and sold in a short time, for consumers to immediately eat food [3].
The convenience of food deliveries makes it possible for consumers to obtain delicious meals quickly. According to the Health Promotion Administration of the Ministry of Health and Welfare (MOHW) (2019) [4], generally, adult women require about 1500–1800 kcal a day, while men require about 2000–2300 kcal. People consume too many calories and fat in their daily diets, leading to a yearly rise in chronic diseases, such as obesity, diabetes, and cardiovascular disease. According to a survey on eating outside the home in Taiwan, about 80% of the respondents expect that the meals they buy should also be healthy, and up to 87% of them expect that takeout meals should be labeled with complete nutritional information [5]. In response to this market trend, some boxed meal companies have begun to focus on healthy boxed meals with simple cooking methods, low oil, and high fiber and disclose complete nutritional information on the boxes for people’s reference and choice.
Muscle Beach was the first company to enter the healthy boxed meal business in 2014. Subsequently, Miss Energy, The Protein Box, Health It, and other chain healthy boxed meals companies were established in response to market demand. In addition to taste, consumers were beginning to attach importance to whether the caloric and nutritional content of boxed meals met their needs.
As consumers’ requirements for eating out have increased significantly, caterers are paying more attention to the characteristics of meals that affect consumers’ willingness to purchase them, such as brand, service attitude, and nutrition of meals. Previous studies have been conducted on consumer food preferences, such as brand and price [6], nutrition facts [7], taste preference [8], and food safety [9]. In the past, studies related to boxed meals mainly focused on taste, nutrition facts, and price. There are still important research gaps that need further exploration. In the era of open and transparent food safety information, it is advantageous to advertise traceable ingredients; in addition, with increasing consumer awareness and global emphasis on energy conservation and carbon reduction, carbon footprint label is bound to be one of the trends for the future. Therefore, in addition to the above three attributes, this study adds the attributes of traceability certification and carbon footprint label to build a more complete integrated model, in order to find possible explanations and fill this important research gap. The results of this study can be used to analyze and explain the factors that influence consumers’ purchase of healthy boxed meals. More importantly, business managers in the catering industry can understand the key influencing factors for consumers’ purchases to formulate effective strategies, increasing the practical benefits and application value of marketing, which is an important contribution of this study.

2. Literature Review

The following explains the implications of various product attributes:

2.1. Taste

Li and Zhu [10] suggested that freshness, nutritional value, and taste serve as the intrinsic indicators of food consumption perceived quality. Petrescu et al. [11] indicated that consumers most frequently use freshness, taste, and appearance to evaluate food quality. Livingstone et al. [12] explored the dietary preferences of young adults in the USA by studying attributes such as nutritional content, cost, taste, familiarity, and preparation time. The results revealed that nutritional content was the most important influence on meal choices, followed by cost, taste, familiarity, and preparation time. In a Dutch study on food choice motivation, taste was found to be the dominant motivation across time, place, and social context [13].

2.2. Nutrition Facts

Nutrition facts provide consumers with nutritional information that helps them make informed and healthy food choices [14,15,16,17,18]. Wojcicki and Heyman [19] indicated that US adolescents made use of the information on the nutrition facts label, with the highest percentage using the total fat on the nutrition facts label. Crockett et al. [20] indicated that consumers can use nutrition facts to understand product information, choose foods, and organize their diet according to their needs. Shangguan et al. [21] indicated that consumers pay attention to the information on food labels before purchase, and their knowledge about nutrition facts affects their purchase intention.
According to Meijer et al. [22], if food products are clearly labeled with their nutritional content, consumers’ understanding of nutrition facts can be enhanced and their choice of unhealthy foods can be reduced, decreasing the incidence of obesity; in addition, food business operators can reduce the levels of added sugars, salt, and saturated fats in foods, and discontinue the use of partially hydrogenated oils and fats in response to market demand. The above studies indicate that nutrition facts of food products affect people’s choice of food and have positive effects on health promotion, disease prevention, and control.

2.3. Traceability Certification

As several food safety incidents have occurred around the world, several countries have established food traceability certification to provide information about the process from farm to fork, reducing uncertainty when purchasing food and enhancing consumers’ trust and willingness to pay (WTP) [23,24]. Hong et al. [25] mentioned that consumers’ primary considerations when shopping for boxed meals are hygiene, food safety, and freshness. Ortega et al. [26] applied the choice experiment method (CE) to assess Beijing consumers’ WTP for selected food quality attributes (food safety, animal welfare, green food, and organic certification), taking into account country of origin information. Results show that Beijing consumers place the highest value on food safety information and are willing to pay higher prices for Australian beef products than American or domestic (Chinese) beef. Wongprawmas and Canavari [27] noted that consumers in Thailand are willing to pay a premium for agricultural products with food safety labels.
According to Kumvenji et al. [28], the food traceability system enhances people’s confidence in food safety because of its clear records of traceability. Nguyen et al. [29] explored the preferences and willingness to pay (WTP) of consumers in the USA for high-end restaurant meals and found that consumers are willing to pay higher prices for meals that are sourced transparently. As it has become a trend in the food industry to make information transparent by disclosing the source of food ingredients, the use of traceability-certified ingredients not only enables consumers to trace the source of ingredients but also serves as a way for restaurants to manage food safety. Therefore, whether the WTP of consumers for healthy boxed meals will be affected when they are labeled and use traceable ingredients deserves further exploration.

2.4. Carbon Footprint Label

With the increasing awareness of environmental protection and the global trend toward energy conservation and carbon reduction, consumers are increasingly concerned about the daily environmental impact on their lives [30,31]. Smith et al. [32] specified that food production and consumption is one of the key factors in global climate change. In response to global climate change, the United Nations proposed the 2030 Sustainable Development Goals (SDGs) in 2015. Achieving net-zero emissions has become a common goal for all countries. In March 2022, “Taiwan’s Pathway to Net-Zero Emissions in 2050” was officially announced to implement the goal of net-zero transformation. In the same year, the Food and Agricultural Education Act was passed to support the development of sustainable agriculture, including local agriculture, food waste reduction, and eat local first.
Research in Egypt found that consumers who are accustomed to buying green products are willing to pay a premium for a carbon footprint label [33]. Grasso and Asioli [34] suggested that the use of a carbon footprint label on sustainable food can increase the WTP for consumers in the UK. However, Colantuoni et al. [35] indicated that on potatoes, the presence of a carbon footprint label reduced the German and Italian total WTP, while the ethical certification was considered very important. In addition, studies have found that gender, age, education, income, and region of origin affect consumer perceptions of foods with a carbon footprint label [36,37].

2.5. Choice Experiment

Consumer choices of products involve elements such as consumer perceptions, expectations, social and psychological factors, financial environment, and intrinsic or extrinsic product characteristics [38]; price is the determinant of extrinsic product characteristics affecting purchase intention [39]. When consumers have a positive concern for the environment, they are willing to pay a higher amount for goods that are less harmful to the environment and engage in environmentally friendly behaviors [40]. Rex and Baumann [41] pointed out that consumers are willing to pay higher prices for green products.
In exploring consumers’ WTP for green products, the choice experiment method (CE), with its ability to evaluate multiple attributes and levels, can combine different alternatives for important characteristics related to nonmarket goods or services, and enables respondents to state their preferences for hypothetical alternative scenarios. This method has been widely used in the fields of consumer behavior [42,43], sharing economy [44,45], green energy [46,47], tourism, and leisure [48,49]. In recent years, it has been gradually applied in the food industry [6,50,51,52].
Liu et al. [53] applied the choice experiment method (CE) to construct a utility model for coffee certification attributes. The results of their study indicate that respondents’ WTP for attributes ranked from highest to lowest includes traceability, organic, graded, environment friendly, and fair-trade certifications. Rusmevichientong et al. [52] applied the choice experiment method (CE) to explore the preferences of 11- to 13-year-old middle school students in California, USA, for snack choices. The attributes studied included price, nutrition, socialization, taste, and convenience. The findings indicate that price is the most important factor for respondents, while convenience is the least important. Chang et al. [50] applied the choice experiment method (CE) to explore Taiwanese consumers’ choices and WTP for yogurt. The attributes studied included the number of probiotic species, fermented milk sources, edible colloids, and healthy food labels. The results indicate that consumers placed the most importance on healthy food label, followed by the number of probiotic species.

3. Materials and Methods
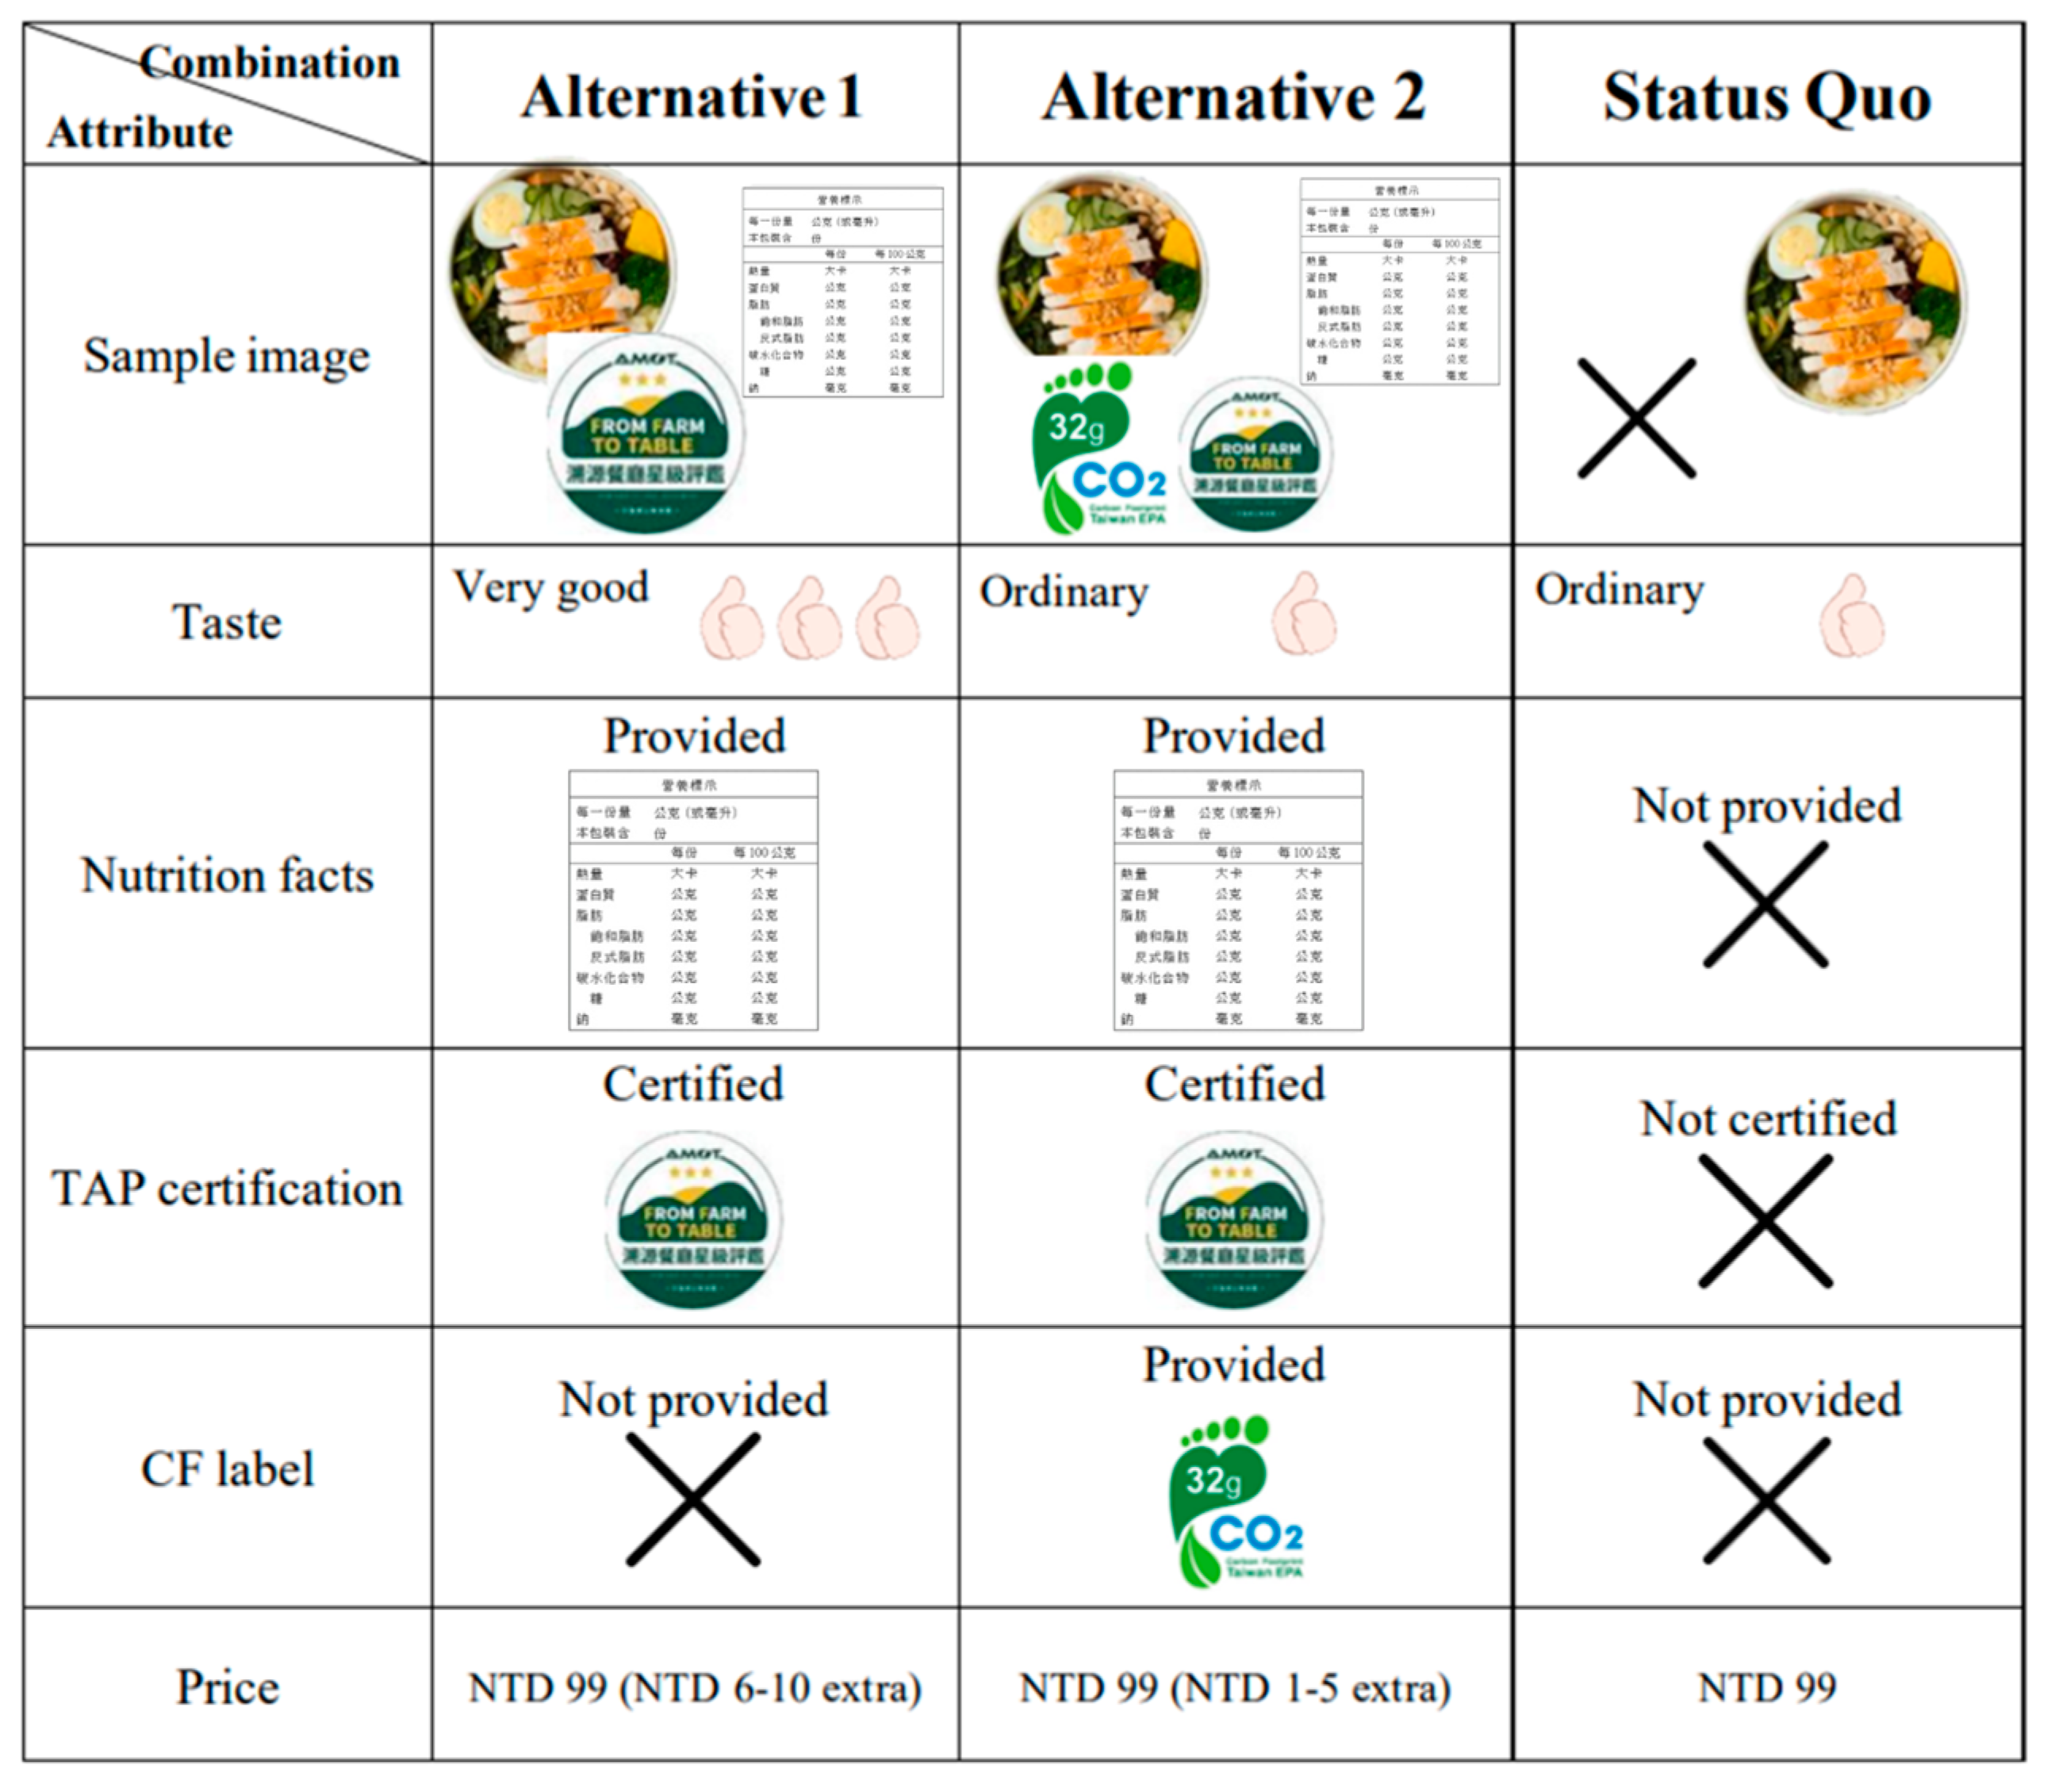
3.1. Survey Design

To avoid questionnaire errors and inaccurate analysis results, it’s important to choose attributes for healthy boxed meals that align with consumers’ purchase motivation. Some healthy boxed meal manufacturers in Taiwan have already incorporated attributes such as nutrition facts, traceability certification, and carbon footprint label. For this reason, after referring to and integrating previous literature, this study included consumers’ consideration of purchasing healthy-boxed-meals-related motivations into the main attributes of the discussion, namely, taste (consumers’ self-centered taste) and nutrition facts (providing nutrition facts for meals). In addition, add traceability certification (use- and non-use-related verification materials) and a carbon footprint label (restaurants with verification and no verification) to measure the willingness to pay the price. This study set the reference point of the carbon footprint label to 32 g CO2 for healthy boxed meals. Where to set these cut-off levels in practice is obviously an important question, which should be settled based on technical expertise. This study only provides evidence regarding the principle: whether adding information about the carbon footprint of healthy boxed meals, in addition to the amount of carbon emission through the healthy boxed meal, makes the label more intuitively understandable for common consumers and therefore more effective.
The price levels were determined based on the pricing (NTD 99) of healthy boxed meal companies, such as The Protein Box and Health It chain healthy boxes, reflecting a realistic price range in the studied market at the time of the study. The following items are provided in the pretest questionnaire: (1) If the healthy boxed meals provide complete nutrition facts, how much extra are you willing to pay? (2) If the healthy boxed meals use traceable ingredients, how much are you willing to pay extra? (3) If the healthy boxed meals provide carbon footprint certification, how much extra are you willing to pay? The above statistical results show how much extra they are willing to pay for the total amount (NTD 0 extra, NTD 1–5 extra, NTD 6–10 extra) with the highest proportion, so the three levels are provided for the respondents to fill in the formal questionnaire, as shown in Table 1.
Based on the above attributes and attribute levels, we obtained 72 (3 × 2 × 2 × 2 × 3) combinations. It is impossible for respondents to make a decision when facing too many options because of their bounded rationality. To address this problem, an available way is to extract representative ones by using an orthogonal design combined with the IBM SPSS Statistics 25.0 software. In this paper, 16 alternative options were produced by using the orthogonal experimental design. The 16 alternative options were mixed at random and then paired into 5 sets. Each choice set was made up of two alternative options and one status option. Respondents would belong to one of the three groups at random, and each of them was provided with 3 choice sets. Respondents were required to make a decision among every three options, and then they needed to answer some other questions in regard to their personal information. One example of the choice sets can be seen in Figure 1.
The formal questionnaire was divided into four parts. The first part was used to understand the respondents’ experience in purchasing healthy boxed meals, the number of times they purchased each week, and their exercise habits. The second part was used to find how much the respondents value each attribute of healthy boxed meals (all the questions were based on a 5-point Likert scale, according to the respondents’ perceptions or actual situations, with a score of 1 representing “strongly disagree” and 5 “strongly agree”). The third part investigated the respondents’ preferences for the attributes of healthy boxed meals, with each choice set containing three scenarios, one for the current situation and two for the filtered design (see Figure 1). The fourth part investigated the respondents’ socioeconomic background, including their gender, age, education level, average monthly income, number of times eating out per week, daily spending on eating out, and body mass index (BMI). According to the Health Promotion Administration, MOHW (2021) [55], the weight of adults over 18 years of age in Taiwan is classified into underweight (BMI < 18.5), healthy (18.5 ≤ BMI < 24), overweight (24 ≤ BMI < 27), and obese (BMI ≥ 27). For adult waist circumference, male waist circumferences are classified into healthy (<90 cm) and obese (≥90 cm), and female waist circumferences are classified into healthy (<80 cm) and obese (≥80 cm). Waist circumference is often used as a simple measure for the risk of developing metabolic syndrome and cardiovascular disease.

3.2. Choice Analysis: Conceptual Framework and Statistical Model

The choice experiment method (CE) is a hypothetical method of stating preferences derived from Lancaster’s consumer theory [56]. As the choice experiment method (CE) considers multiple attributes in decision making, it can be used to identify interactions between attributes and to compare the relative importance of attributes [57]; furthermore, it can present trade-offs between attributes that respondents must consider when making decisions [58]. First, we applied the choice experiment method (CE) to construct a utility model for healthy boxed meal attributes; second, we applied the random parameter logit (RPL) models to estimate the utility function of healthy boxed meals, and explored the differences in the WTP for each attribute from the perspective of the respondents’ perceptions and behaviors.
As respondents with the same socioeconomic characteristics may have different preferences for the attributes of healthy boxed meals, the random parameter logit (RPL) model needed to be estimated. It is generally believed that consumers prefer lower prices; therefore, price preferences remain isomorphic across consumers [59]. The formula for the random parameter logit (RPL) model is shown in Equation (1):
U i j = V i j + ε i j = V ( H j ) + ε i j
where U i j : the utility of the i-th respondent for the attribute combination 𝐻𝑗 of the j-th product; 𝑉𝑖𝑗: the measurable utility of the j-th product for the i-th respondent, which is observable; 𝐻𝑗: the vector of attribute in the choice set; and 𝜀𝑖𝑗: the random error, which is unobservable.
Assuming that the measurable utility for respondents is a linear additive model, Equation (2) is given as follows:
U i j = V i j + ε i j = k = 1 K   α k X j k + β P j + ε i j
where 𝑘 = 1, 2, …, 𝐾; 𝑋𝑗𝑘: the attribute k of the j-th product in the choice set; 𝑃𝑗: the price attribute of the j-th product; 𝛼𝑘, 𝛽: the coefficient of attribute/variable; and 𝜀𝑖𝑗: the random error, which is unobservable.
To compare the differences in product preferences among different groups of consumers, the product attributes in the indirect utility function should be cross-tabulated with the socioeconomic characteristics of the respondents. As the socioeconomic characteristics are fixed and do not change due to product selection, they cannot be added to the indirect utility function [60]. Therefore, Equation (3) is modified as follows:
U i j = k = 1 K   α k X j k + β P j + k = 1 K   m = 1 M   γ k m X j k D i m + m = 1 M   γ p m P j D i m + ε i j ,
where 𝑈𝑖𝑗: the utility of the i-th respondent for the attribute combination 𝐻𝑗 of the j-th product; 𝑃𝑗: the price attribute of the j-th product; 𝛼𝑘, 𝛽: the coefficient of attribute; 𝐷𝑖𝑚: the i-th respondent’s m-th socioeconomic characteristic; 𝛾𝑘𝑚 and 𝛾𝑝𝑚: the coefficients of the interaction term between the attribute with socioeconomic characteristics and price; 𝜀𝑖𝑗: the random error, which is unobservable; and 𝑖 = 1, 2, …, 𝐼; 𝑗 = 1, 2, …, 𝐽; 𝑘 = 1, 2, …, 𝐾; 𝑚 = 1, 2, …, 𝑀.
The above model can calculate the WTP at different attribute levels by dividing the marginal utility of each attribute by the marginal utility of price and taking the negative value of the marginal rate of substitution [61,62]. WTP is calculated as shown in Equation (4):
W T P = V X k V P = β k β P
where V is the measurable utility, k is the estimated coefficient value of the nonprice attribute, and p is the estimated coefficient value of the price attribute.

4. Results

4.1. Sample Size and Composition

In this study, we used the convenience sampling method for the survey questionnaire face-to-face in The Protein Box, Health It, and other chain healthy boxed meal companies in Taichung City, Taiwan. In consideration of research ethics, this study clearly informed the subjects on the front page of the questionnaire about the survey purpose of this study and participation in an anonymous form so that all subjects can provide their answers without worrying about privacy.
First, the study conducted a pretest questionnaire, with the aim of understanding consumers’ overall consumption preferences and WTP for healthy boxed meals. The questionnaires were issued from January 2022 to February 2022 to consumers who had purchased healthy boxed meals. A total of 92 effective samples were recovered in the pretest of the questionnaire. The formal questionnaire was distributed and remained available from March 2022 to April 2022; the main target population was “consumers who had purchased healthy boxed meals in the past 3 months.” A total of 495 valid questionnaires were collected, which are shown in Table 2.
From a demographic perspective, the majority of the respondents were female (54.9%). The age group was mainly concentrated among 20- to –29-year-olds (39.6%), followed by 30- to 39-year-olds (35.8%) and 40- to 49-year-olds (12.3%), indicating that consumers from younger age groups have more experience in purchasing healthy boxed meals than those from other groups. In terms of education level, the highest percentage of consumers were college or university educated (70.9%). The average personal monthly income mainly ranged from NTD 30,001 to 50,000 (45.5%). The number of times eating out per week was mainly 9 times or more (33.5%), followed by 3–5 times (29.7%). The average daily spending on eating out was mostly less than NTD 200 (45.1%), followed by NTD 201–300 (38.2%). This result is consistent with that of the survey report by the Insight Xplorer Marketing Research Company (2018), which stated that individuals spend about NTD 246 per day on eating out. Most respondents (41%) purchased healthy meals less than once a week, followed by 1–2 times (36.2%).
In terms of weight control and exercise habits, a higher percentage of respondents worked out regularly (56.6%); most of them were engaged in muscle building and fat loss or weight control (64.4%). The majority of respondents (54.1%) had a BMI in the 18.5 ≤ BMI < 24 range, followed by 24 ≤ BMI < 27 (24.6%), which is similar to the average BMI of 24.2 for adults over 19 years old in the Nutrition and Health Survey in Taiwan 2013–2016 reported by the Health Promotion Administration (2019).
In addition, the most important attributes of healthy boxed meals were taste (4.42), followed by price (4.29), nutrition facts (4.1), and traceability certification (4.03), and the least important was carbon footprint label (3.37), indicating that the respondents tend to choose foods that are tasty and reasonably priced.

4.2. Consumers’ Preferred Combinations for Healthy Boxed Meals

According to the analysis results, the respondents’ preferred combination of attributes was “very good taste, with nutrition label, with traceability certification, without carbon footprint label, and a price of NTD 99 (NTD 6–10 extra)” (29.8%). The next most popular attribute combination was “very good taste, without nutrition label, with traceability certification, without carbon footprint label, and a price of NTD 99 (NTD 1–5 extra)” (20.14%). The respondents’ least preferred combinations were “good taste, without nutrition label, without traceability certification, with carbon footprint label, and a price of NTD 99 (NTD 1–5 extra)” and “good taste, with nutrition label, with traceability certification, with carbon footprint label, and a price of NTD 99 (NTD 6–10 extra),” accounting for 10.9% and 13.9% of the respondents, respectively.
Based on the results of the study, consumers value healthy boxed meals with traceability certification, which is consistent with Nguyen et al.’s [29] findings that consumers are willing to pay more for meals that are transparent about the source of ingredients; consumers also value healthy boxed meals with nutrition labels, which is consistent with Kang et al.’s [63] findings that consumers are willing to pay more for nutritious foods and Macdiarmid et al.’s [64] findings that consumers are willing to pay significantly more for products with nutrition labels than those with a carbon footprint label.

4.3. Results of the RPL Models

The coefficient values of each attribute in the random parameter logit (RPL) models were calculated using NLOGIT 4.0. The empirical estimation results are shown in Table 3. In particular, the random parameter logit (RPL) model estimated respondents’ differential preference for the attributes of healthy boxed meals. The coefficient value of status quo (ASC) was negative and significant at the 5% level, indicating that consumers were not satisfied with the attributes of healthy boxed meals currently available on the market.
In the random parameter logit (RPL) model, the coefficient value of carbon footprint label (CF) was significantly negative, indicating that the respondents placed less importance on having carbon footprint labels on healthy boxed meals, while very good taste (VGD) and traceability certification were significantly positive, indicating that respondents preferred these attributes.
Then, by substituting the coefficient values derived from Equation (1) of the utility function into Equation (4) of the theoretical model, the respondents’ WTP for each attribute could be calculated. The WTP for each attribute in the random parameter logit (RPL) model was NTD 3 for good taste (GD), NTD 4.3 for very good taste (VGD), NTD 4.4 for nutrition facts (NF), NTD 4.6 for traceability certification (TAP), and NTD 3.3 for carbon footprint label (CF).

4.4. Exploring the Differences in Willingness to Pay Based on Respondents’ Socioeconomic Background and Attributes of Healthy Boxed Meals

According to the analysis results of the random parameter logit (RPL) model, there were random parameters in nutrition facts (NF) and traceability certification (TAP). Thus, this study compared WTP based on these attributes, and the respondents’ socioeconomic backgrounds are shown in Table 4. Compared with other age groups, the respondents aged 20–29 and 30–39 years old were less likely to prefer the “status quo.” The WTP for nutrition facts demonstrated significant differences in age, average personal monthly salary, muscle building, fat loss or weight control, and regular exercise, with higher WTP among respondents over 40 years of age, indicating that younger respondents were less willing to pay extra for healthy boxed meals that provided nutrition facts. This is consistent with Ollberding et al.’s [65] findings, which indicate that people pay more attention to nutrition labels as they become older. In addition, respondents with an average monthly salary of NTD 30,000 or more and those who were exercising regularly and were engaged in muscle building, fat loss, or weight control have higher WTP, indicating that those who have higher income, regular exercise, and health goals value products with nutrition labels and are willing to pay more for them. This is consistent with Bleich and Wolfson’s [66] findings, which indicate that consumers with health goals will choose products based on nutrition facts.
The WTP for traceability certification (TAP) manifested significant differences in gender, age, and education level, and the WTP was higher among the respondents who were female, between 30–39 years old, and had college or university education or above. According to the survey results, women, young and middle-aged people, and those who had received higher education attached more importance to the source of ingredients and were willing to pay more for healthy boxed meals with traceability certification. This is in line with Zhang et al. [67], who specified that women are more likely to purchase traceable products than men; in addition, young consumers are more willing to pay more for products with traceable ingredients.

5. Discussion

According to the estimation results of the random parameter logit (RPL) models, the respondents were willing to pay extra for healthy boxed meals with traceability certification at a markup of NTD 4.60. This is consistent with Liu et al.’s [68] findings, which indicate that consumers are willing to pay an extra premium of CNY¥1.42 (approximately NTD 6.29) for apples with traceability information, and are willing to pay higher amounts for traceable and safe foods [26,29]. Moreover, in terms of NF, the respondents were willing to pay an additional amount of NTD 4.4. Christoph et al. [7] indicated that people aiming to lose, gain, or control weight for health purposes focus on nutrition facts. Wojcicki and Heyman [19] found that consumers’ emphasis on nutrition facts is related to their healthy eating habits; therefore, nutrition facts can help consumers choose foods that meet their health goals, and consumers prefer healthy boxed meals with nutrition labels, which is consistent with the findings of this study.
In addition, consumers have a significant preference for very good taste and the use of a carbon footprint label. Respondents were most willing to pay extra for very good taste (NTD 4.3), followed by carbon footprint label (NTD 3.3). This is consistent with the literature that when choosing healthy foods, consumers will prefer those with good taste [69,70]. Kähkönen and Tuorila [71] pointed out that if healthy food is tasty and delicious, it can attract consumers and trigger positive emotions, such as pleasure and excitement.
This is consistent with Gadema and Oglethorpe’s [72] findings, which point out that consumers’ knowledge of product labeling affects their decision making. According to Rondoni and Grasso [73], consumers in the UK and Germany have the highest level of concern, understanding, and use of carbon footprint label on food products, while consumers in Poland, Spain, and Sweden have the lowest level of concern. This difference may be related to the timing of the introduction of carbon footprint label in each country.
The results indicate that Taiwanese consumers prefer healthy boxed meals with traceability certification and carbon footprint label. The second target of the SDGs is to “end hunger, achieve food security and improved nutrition, and promote sustainable agriculture.” Currently, Taiwan’s traceability certification system emphasizes the need to maintain environmental sustainability while producing healthy and safe agricultural products. Enterprises in Taiwan have been promoting carbon footprint label since 2009, expecting to strengthen the market competitiveness of low-carbon products with carbon labeling policy and increasing consumers’ awareness of purchasing carbon-labeled products. In addition, in 2022, Taiwan passed the Food and Agricultural Education Act, aiming to deepen the sustainable agricultural programs of food linking agriculture and eat local first. Therefore, it is suggested that the government advocate healthy boxed meal companies to actively obtain traceability certification and carbon footprint label to improve the safety of agricultural products, promote environmental sustainability, and achieve a sustainable consumption and production model in a low-carbon economy.

6. Conclusions

6.1. Management Implications

The results of this study indicate that consumers are more attracted to and are willing to pay extra for healthy boxed meals that have traceability certification and nutrition facts. Therefore, healthy boxed meal companies should not only focus on the health benefits but also emphasize the traceability certification and nutrition facts of boxed meals to increase the likelihood of consumer purchase. Presently, only a few healthy boxed meal companies in Taiwan use traceability-certified ingredients. Therefore, in order to enhance consumers’ WTP, it is recommended that healthy boxed meal companies introduce traceability certification to achieve consistent production and sales information of ingredients that is open, transparent, and traceable.
Furthermore, considering the growing threat of global warming, the carbon footprint label of products has become one of the tools for governments and enterprises to achieve the target of greenhouse gas reduction. It is suggested that the government should apply the concepts of environmental sustainability and carbon footprint label nationwide to enhance public awareness and encourage healthy boxed meal companies to use carbon footprint label.
The research results indicate that consumers over 40 years old, with an average monthly salary of more than NTD 30,000, who work out regularly, and are in the process of muscle building, fat loss, or weight control have stronger WTP for healthy boxed meals with nutrition labels. This indicates that most consumers who purchase healthy boxed meals are health-conscious individuals. Thus, it is suggested that healthy boxed meal companies cooperate with sports centers and gyms to develop suitable plans according to consumers’ health goals, enhancing the consumption motivation and increasing the turnover of healthy boxed meals.

6.2. Research Limitations and Future Research Directions

There are some limitations in the process of this study. The research framework would be more complete if we can expand the research scope in the future. First, this study focuses on five attributes of healthy boxed meals (i.e., taste, nutrition facts, traceability certification, carbon footprint label, and price). In the future, different attributes (e.g., hiring nutritionists to design meals and brand familiarity) can be added to better understand consumers’ preferences for different attributes of healthy boxed meals.
The main limitation of this study is the effects of different dishes and ingredients on the tastes of healthy boxed meals may not be the same, and are difficult to quantify. Moreover, different healthy boxed meal companies may use different magnitudes of ingredients even for the same healthy boxed meals, so such data will increase the systematic error of the statistical analysis.
Second, this study is limited to one type of healthy boxed meal with a small price range. Subsequent researchers should refer to this study to investigate the range of daily spending on eating out, which can be used as a basis for setting product sales prices and conducting product development. Furthermore, more types of boxed meals and products can be included for thematic research to provide more representative reference data for the bento industry.
Next, the participants were consumers who purchased healthy boxed meals in Taiwan; therefore, the extrapolation of the findings is limited. To improve the accuracy of the research results and obtain complete information, subsequent researchers can use this study as a basis and collect data from different countries and regions to understand the determinants of purchased healthy boxed meals across societies and cultures. Finally, the latent class model (LCM) may be used in future research to inspect whether the respondents have heterogeneous preferences for the attribute levels designed in the study to conduct a more comprehensive analysis and discussion of the healthy boxed meals issue.

Author Contributions

The three coauthors together contributed to the completion of this article. M.-Y.C. was the first author, who analyzed the data and drafted the manuscript; J.-C.L. contributed to reviewing and revising the literature, results, and conclusion; and H.-S.C. acted as the corresponding author on their behalf throughout the revision and submission process. All authors have read and agreed to the published version of the manuscript.

Funding

This research received no external funding.

Institutional Review Board Statement

Not applicable.

Informed Consent Statement

Not applicable.

Data Availability Statement

The data that support the findings of this study are available from the corresponding author, H.-S.C., upon reasonable request.

Acknowledgments

We would like to express our sincere appreciation to all the experts who have taken the time to review this article and provide their valuable comments.

Conflicts of Interest

The authors declare no conflict of interest.

References

  1. Ipsos. Dining Trends in Taiwan. 2019. Available online: https://reurl.cc/k1xQOG (accessed on 15 January 2022).
  2. Wang, C.C.; Hsu, J.L. A qualitative study of customer behavior in the box meal industry through the grounded theory approach. J. Market Sci. 2007, 3, 39–62. [Google Scholar]
  3. Taiwan Excellent Agricultural Products Development Association/CAS Ready Meals. 2016. Available online: http://www.cas.org.tw/ (accessed on 20 January 2022).
  4. Health Promotion Administration. Nutrition and Health Survey in Taiwan (NAHSIT) (2013–2016). 2019. Available online: https://www.hpa.gov.tw/Pages/Detail.aspx?nodeid=3999&pid=11145 (accessed on 12 January 2022).
  5. Insight Xplorer Marketing Research Company. Survey Report on Eating out Preferences. 2018. Available online: https://www.ixresearch.com/ (accessed on 16 January 2022).
  6. Monika, H. The Impact of Cultural Branding on Brand Equity—Exploratory Study. Handel Wewn. 2017, 370, 213–221. [Google Scholar]
  7. Christoph, M.J.; Larson, N.; Laska, M.N.; Neumark-Sztainer, D. Nutrition Facts Panels: Who Uses Them, What Do They Use, and How Does Use Relate to Dietary Intake? J. Acad. Nutr. Diet. 2018, 18, 217–228. [Google Scholar] [CrossRef] [PubMed]
  8. Jun, J.; Kang, J.; Arendt, S.W. The effects of health value on healthful food selection intention at restaurants: Considering the role of attitudes toward taste and healthfulness of healthful foods. Int. J. Hosp. Manag. 2014, 42, 85–91. [Google Scholar] [CrossRef] [Green Version]
  9. Cicia, G.; Colantuoni, F. Willingness to pay for traceablemeat attributes: A meta-analysis. Int. J. Food Syst. Dyn. 2010, 1, 252–263. [Google Scholar]
  10. Li, Z.J.; Zhu, Z.G. Chinese consumers’ local food purchase willingness: A perspective from perceived quality and perceived value. World Agric. 2017, 8, 210–216. [Google Scholar]
  11. Petrescu, D.C.; Vermeir, I.; Petrescu-Mag, R.M. Consumer Understanding of Food Quality, Healthiness, and Environmental Impact: A Cross-National Perspective. Int. J. Environ. Res. Public Health 2020, 17, 169. [Google Scholar] [CrossRef] [Green Version]
  12. Livingstone, K.M.; Lamb, K.E.; Abbott, G.; Worsley, T.; McNaughton, S.A. Ranking of meal preferences and interactions with demographic characteristics: A discrete choice experiment in young adults. Int. J. Behav. Nutr. Phys. Act. 2020, 1, 252–263. [Google Scholar] [CrossRef]
  13. Verain, M.C.; Snoek, H.M.; Onwezen, M.C.; Reinders, M.J.; Bouwman, E.P. Sustainable food choice motives: The development and cross-country validation of the Sustainable Food Choice Questionnaire (SUS-FCQ). Food Qual. Prefer. 2021, 93, 104267. [Google Scholar] [CrossRef]
  14. Hawley, K.L.; Roberto, C.A.; Bragg, M.A.; Liu, P.J.; Schwartz, M.B.; Brownell, K.D. The science on front-of-package food labels. Public Health Nutr. 2013, 16, 430–439. [Google Scholar] [CrossRef]
  15. Hieke, S.; Taylor, C.R.A. Critical Review of the Literature on Nutritional Labeling. J. Consum. Aff. 2012, 46, 120–156. [Google Scholar] [CrossRef]
  16. Kanter, R.; Vanderlee, L.; Vandevijvere, S. Front-of-package nutrition labelling policy: Global progress and future directions. Public Health Nutr. 2018, 21, 1399–1408. [Google Scholar] [CrossRef] [PubMed] [Green Version]
  17. Samant, S.S.; Seo, H.-S. Effects of label understanding level on consumers’ visual attention toward sustainability and process-related label claims found on chicken meat products. Food Qual. Prefer. 2016, 50, 48–56. [Google Scholar] [CrossRef]
  18. Taillie, L.S.; Hall, M.G.; Popkin, B.M.; Ng, S.W.; Murukutla, N. Experimental Studies of Front-of-Package Nutrient Warning Labels on Sugar-Sweetened Beverages and Ultra-Processed Foods: A Scoping Review. Nutrients 2020, 12, 569. [Google Scholar] [CrossRef] [PubMed] [Green Version]
  19. Wojcicki, J.M.; Heyman, M.B. Adolescent nutritional awareness and use of food labels: Results from the National Nutrition Health and Examination Survey. BMC Pediatr. 2012, 12, 55. [Google Scholar] [CrossRef] [PubMed] [Green Version]
  20. Crockett, R.A.; King, S.E.; Marteau, T.M.; Prevost, A.; Bignardi, G.; Roberts, N.W.; Stubbs, B.; Hollands, G.J.; Jebb, S.A. Nutritional labelling for healthier food or non-alcoholic drink purchasing and consumption. Cochrane Database Syst. Rev. 2018, 2, CD009315. [Google Scholar]
  21. Shangguan, S.; Afshin, A.; Shulkin, M.; Ma, W.; Marsden, D.; Smith, J.; Saheb-Kashaf, M.; Shi, P.; Micha, R.; Imamura, F.; et al. A Meta-Analysis of Food Labeling Effects on Consumer Diet Behaviors and Industry Practices. Am. J. Prev. Med. 2019, 56, 300–314. [Google Scholar] [CrossRef]
  22. Meijer, G.W.; Detzel, P.; Grunert, K.G.; Robert, M.C.; Stancu, V. Towards effective labelling of foods. An international perspective on safety nutrition. Trends Food Sci. Technol. 2021, 118, 45–56. [Google Scholar] [CrossRef]
  23. Menozzi, D.; Halawany-Darson, R.; Mora, C.; Giraud, G. Motives towards traceable food choice: A comparison between French and Italian consumers. Food Control. 2015, 49, 40–48. [Google Scholar] [CrossRef]
  24. Chen, M.-F.; Huang, C.-H. The impacts of the food traceability system and consumer involvement on consumers’ purchase intentions toward fast foods. Food Control. 2013, 33, 313–319. [Google Scholar] [CrossRef]
  25. Hong, H.C.; Chung, Y.Z.; Chung, S.T.; Chang, J.Z.; Chen, L.P.; Chiu, L.L. A study on the factors that influence the peoples’ take-out behavior. Chang Gung J. Sci. 2016, 25, 105–118. [Google Scholar]
  26. Ortega, D.L.; Hong, S.J.; Wang, H.H.; Wu, L. Emerging markets for imported beef in China: Results from a consumer choice experiment in Beijing. Meat Sci. 2016, 121, 317–323. [Google Scholar] [CrossRef] [PubMed]
  27. Wongprawmas, R.; Canavari, M. Consumers’ willingness-to-pay for food safety labels in an emerging market: The case of fresh produce in Thailand. Food Policy 2017, 69, 25–34. [Google Scholar] [CrossRef]
  28. Kumvenji, D.C.E.; Chamba, M.V.M.; Lungu, K. Effectiveness of food traceability system in the supply chain of local beef and beef sausages in Malawi: A food safety perspective. Food Control 2022, 137, 108839. [Google Scholar] [CrossRef]
  29. Nguyen, L.; Gao, Z.; Anderson, J.L.; Love, D.C. Consumers’ willingness to pay for information transparency at casual and fine dining restaurants. Int. J. Hosp. Manag. 2022, 100, 103104. [Google Scholar] [CrossRef]
  30. Wiedmann, T.; Minx, J.A. Definition of Carbon Footprint. Ecol. Econ. Res. Trends 2007, 1, 1–11. [Google Scholar]
  31. Liu, E.; Judd, B.; Mataraarachchi, S. Carbon Reduction Programs and Lower Income Households in Australian Cities. Procedia Eng. 2017, 180, 1541–1550. [Google Scholar] [CrossRef] [Green Version]
  32. Smith, S.B.; Gill, C.A.; Lunt, D.K.; Brooks, M.A. Regulation of Fat and Fatty Acid Composition in Beef Cattle. Asian-Australas. J. Anim. Sci. 2009, 22, 1225–1233. [Google Scholar] [CrossRef]
  33. Mostafa, M.M. Egyptian consumers’ willingness to pay for carbon-labeled products: A contingent valuation analysis of socio-economic factors. J. Clean. Prod. 2016, 135, 821–828. [Google Scholar] [CrossRef]
  34. Grasso, S.; Asioli, D. Consumer preferences for upcycled ingredients: A case study with biscuits. Food Qual. Prefer. 2020, 84, 103951. [Google Scholar] [CrossRef]
  35. Colantuoni, F.; Cicia, G.; Del Giudice, T.; Lass, D.; Caracciolo, F.; Lombardi, P. Heterogeneous Preferences for Domestic Fresh Produce: Evidence from German and Italian Early Potato Markets. Agribusiness 2016, 32, 512–530. [Google Scholar] [CrossRef]
  36. Canavari, M.; Coderoni, S. Green marketing strategies in the dairy sector: Consumer-stated preferences for carbon footprint labels. Strateg. Chang. 2019, 28, 233–240. [Google Scholar] [CrossRef]
  37. Wong EY, C.; Chan FF, Y.; So, S. Consumer per-ceptions on product carbon footprints and carbon labels ofbeverage merchandise in Hong Kong. J. Clean Prod. 2020, 242, 118404. [Google Scholar] [CrossRef]
  38. Hersleth, M.; Monteleone, E.; Segtnan, A.; Næs, T. Effects of evoked meal contexts on consumers’ responses to intrinsic and extrinsic product attributes in dry-cured ham. Food Qual. Prefer. 2015, 40, 191–198. [Google Scholar] [CrossRef]
  39. Ares, G.; Giménez, A.; Deliza, R. Influence of three non-sensory factors on consumer choice of functional yogurts over regular ones. Food Qual. Prefer. 2010, 21, 361–367. [Google Scholar] [CrossRef]
  40. Gleim, M.R.; Smith, J.S.; Andrews, D.; Cronin, J.J., Jr. Against the green: A multi-method examination of the barriers to green consumption. J. Retail. 2013, 89, 44–61. [Google Scholar] [CrossRef]
  41. Rex, E.; Baumann, H. Beyond ecolabels: What green marketing can learn from conventional marketing. J. Clean. Prod. 2007, 15, 567–576. [Google Scholar] [CrossRef] [Green Version]
  42. Aprile, M.C.; Punzo, G. How environmental sustainability labelsaffect food choices: Assessing consumer preferences in southern Italy. J. Clean. Prod. 2022, 332, 130046. [Google Scholar] [CrossRef]
  43. Cantillo, J.; Martín, J.C.; Román, C. Discrete choice experiments in the analysis of consumers’ preferences for finfish products: Asystematic literature review. Food Qual. Prefer. 2020, 84, 103–952. [Google Scholar] [CrossRef]
  44. Caspersen, E.; Navrud, S. The sharing economy and consumer preferences for environmentally sustainable last mile deliveries. Transp. Res. Part D: Transp. Environ. 2021, 95, 102863. [Google Scholar] [CrossRef]
  45. Sweet, M.N. User interest in on-demand, shared, and driverless mobility: Evidence from stated preference choice experiments in Southern Ontario. Travel Behav. Soc. 2021, 23, 120–133. [Google Scholar] [CrossRef]
  46. Chen, H.-S.; Kuo, H.-Y. Green Energy and Water Resource Management: A Case Study of Fishery and Solar Power Symbiosis in Taiwan. Water 2022, 14, 1299. [Google Scholar] [CrossRef]
  47. Neumann, R.; Mehlkop, G. Framing electricity plan choices to enhance green energy usage: A choice experiment with panel datafrom Germany. Energy Res. Soc. Sci. 2020, 70, 101741. [Google Scholar] [CrossRef]
  48. Chang, M.-Y.; Wang, C.-H.; Chen, H.-S. Exploring Cruise Tourists’ Preferences and Satisfaction: The Case of Taiwan. Water 2021, 13, 3183. [Google Scholar] [CrossRef]
  49. Chen, H.-S. The Construction and Validation of a Sustainable Tourism Development Evaluation Model. Int. J. Environ. Res. Public Health 2020, 17, 7306. [Google Scholar] [CrossRef] [PubMed]
  50. Chang, M.-Y.; Huang, C.-C.; Du, Y.-C.; Chen, H.-S. Choice Experiment Assessment of Consumer Preferences for Yogurt Products Attributes: Evidence from Taiwan. Nutrients 2022, 14, 3523. [Google Scholar] [CrossRef]
  51. Huang, W.-S.; Kuo, H.-Y.; Tung, S.-Y.; Chen, H.-S. Assessing Consumer Preferences for Suboptimal Food: Application of a Choice Experiment in Citrus Fruit Retail. Foods 2021, 10, 15. [Google Scholar] [CrossRef]
  52. Rusmevichientong, P.; Jaynes, J.; Chandler, L. UnderstandingInfluencing Attributes of Adolescent Snack Choices: Evidence from a Discrete Choice Experiment. Food Qual. Prefer. 2021, 92, 104171. [Google Scholar] [CrossRef]
  53. Liu, C.-C.; Chen, C.-W.; Chen, H.-S. Measuring Consumer Preferences and Willingness to Pay for Coffee Certification Labels in Taiwan. Sustainability 2019, 11, 1297. [Google Scholar] [CrossRef] [Green Version]
  54. Gracia, A.; Loureiro, M.L.; Nayga, R.M., Jr. Consumers’ valuation of nutritional information: A choice experiment study. Food Qual. Prefer. 2009, 20, 463–471. [Google Scholar] [CrossRef]
  55. Health Promotion Administration. Dietary Reference Intakes for Nutrients, 7th Edition. 2021. Available online: https://www.hpa.gov.tw/Pages/Detail.aspx?nodeid=544&pid=725 (accessed on 10 January 2022).
  56. Lancaster, K.J. A new approach to consumer theory. J. Political Econ. 1966, 74, 132–157. [Google Scholar] [CrossRef]
  57. Ryan, M.; Gerard, K. Using discrete choice experiments to value health care programmes: Current practice and future research reflections. Appl. Health Econ. Health Policy 2003, 2, 55–64. [Google Scholar]
  58. Marshall, H.S.; Chen, G.; Clarke, M.; Ratcliffe, J. Adolescent, parent and societal preferences and willingness to pay for meningococcal B vaccine: A Discrete Choice Experiment. Vaccine 2016, 34, 671–677. [Google Scholar] [CrossRef]
  59. Petrin, A.; Train, K. Omitted Product Attributes in Discrete Choice Models; National Bureau of Economic Research: Cambridge, MA, USA, 2003. [Google Scholar]
  60. Burton, M.; Rigby, D.; Young, T.; James, S. Consumer attitudes to genetically modified organisms in food in the UK. Eur. Rev. Agric. Econ. 2021, 28, 479–498. [Google Scholar] [CrossRef] [Green Version]
  61. Bechtold, K.-B.; Abdulai, A. Combining attitudinal statements with choice experiments to analyze preference heterogeneity for functional dairy products. Food Policy 2014, 47, 97–106. [Google Scholar] [CrossRef]
  62. Hensher, D.A.; Rose, J.M.; Greene, W.H. Applied choice analysis: A primer. In Applied Choice Analysis; Cambridge University Press: Cambridge, UK, 2005; pp. 197–217. [Google Scholar]
  63. Kang, J.; Jun, J.; Arendt, S.W. Understanding customers’ healthy food choices at casual dining restaurants: Using the Value–Attitude–Behavior model. Int. J. Hosp. Manag. 2015, 48, 12–21. [Google Scholar] [CrossRef]
  64. Macdiarmid, J.I.; Cerroni, S.; Kalentakis, D.; Reynold, C. How important is healthiness. carbon footprint meat content when purchasing a ready meal? Evidence from a non-hypothetical discrete choice experiment. J. Clean. Prod. 2020, 282, 1–11. [Google Scholar] [CrossRef]
  65. Ollberding, N.J.; Wolf, R.L.; Contento, I. Food label use and its relation to dietary intake among US adults. J. Am. Dietetic Assoc. 2011, 111, 47–51. [Google Scholar] [CrossRef] [PubMed]
  66. Bleich, S.N.; Wolfson, J.A. U.S. adults and child snacking patterns among sugar-sweetened beverage drinkers and non-drinkers. Prev. Med. 2015, 72, 8–14. [Google Scholar] [CrossRef] [PubMed] [Green Version]
  67. Zhang CBai, J.; Wahl, T.I. Consumers’ willingness to pay for traceable pork, milk, and cooking oil in Nanjing, China. Food Control 2012, 27, 21–28. [Google Scholar] [CrossRef]
  68. Liu, R.; Gao, Z.; Nayga, R.M.; Snell, H.A.; Ma, H. Consumers’ valuation for food traceability in China: Does trust matter? Food Policy 2019, 88, 101768. [Google Scholar] [CrossRef]
  69. House, J. Consumer acceptance of insect-based foods in the Netherlands: Academic and commercial implications. Appetite 2016, 107, 47–58. [Google Scholar] [CrossRef] [Green Version]
  70. Newson, R.S.; Maas, R.V.; Beijersbergen, A.; Carlson, L.; Rosenbloom, C. International consumer insights into the desires and barriers of diners in choosing healthy restaurant meals. Food Qual. Prefer. 2015, 43, 63–70. [Google Scholar] [CrossRef] [Green Version]
  71. Kähkönen, P.; Tuorila, H. Consumer responses to reduced and regular fat content in different products: Effects of gender, involvement and health concern. Food Qual. Prefer. 1999, 10, 83–91. [Google Scholar] [CrossRef]
  72. Gadema, Z.; Oglethorpe, D. The Use and Usefulness of Carbon Labelling Food: A Policy Perspective from a Survey of UK Supermarket Shoppers. Food Policy 2011, 36, 815–822. [Google Scholar] [CrossRef]
  73. Rondoni, A.; Grasso, S. Consumers behaviour towards carbon footprint labels on food: A review of the literature and discussion of industry implications. J. Clean. Prod. 2021, 301, 127031. [Google Scholar] [CrossRef]
Figure 1. Example questionnaire choice set.
Nutrients 15 01032 g001
Table 1. Attributes and attribute levels of healthy boxed meals.
AttributeLevelsVariable Name Variable Value Expected Sign Literature
Taste (1) Ordinary
(2) Good
(3) Very good
GD“−1” means “ordinary”
“1” means “good”
“0” means “very good”
+Livingstone et al. [12]
VGD“−1” means “ordinary”
“1” means “very good”
“0” means “good”
+
Nutrition facts(1) Not provided
(2) Provided
NF“1” means “provided”
“−1” means “not certified”
+Gracia et al. [54]
Traceability certification(1) Not certified
(2) Certified
TAP“1” means “certified”
“−1” means “not provided”
+Kumvenji et al. [28]
Carbon footprint label(1) Not provided
(2) Provided
CF“1” means “provided”
“−1” means “not provided”
+Wong et al. [37]
Price(1) NTD 99
(2) NTD 99 (NTD 1–5 extra)
(3) NTD 99 (NTD 6–10 extra)
FUND“99” means “NTD 99”
“99 + 1” means” NTD 99 (NTD 1–5 extra)”
“99 + 6” means “NTD 99 (NTD 6–10 extra)”
The Protein Box and Health It chain healthy boxed meal companies
Note: NTD, new Taiwan dollar (1 NTD = 0.033 USD); TAP, traceable agricultural products; CF, carbon footprint.
Table 2. Demographic information.
VariableDescriptionSample SizePercentageVariableDescriptionSample SizePercentage
GenderMale22345.1%Eating out per weekLess than 26513.2%
Female27254.9%3–514729.7%
Age20–29 19639.6%6–811723.6%
30–3917735.8%Above 916633.5%
40–496112.3%Average spending on eating out per day
(NTD)
Less than NT$20022345.1%
50–59 428.5%NT$201–30018938.2%
60 or above 193.8%NT$301–4005210.5%
Education levelJunior high school or below 408.1%Above
NT$400
316.2%
University and college 35170.9%Purchased healthy per week 020341%
Master 9619.4%1–217936.2%
PhD 81.6%3–48517.1%
Average personal monthly income (NTD)Less than NT$10,000 7014.1%Above 5285.7%
NT$10,001–30,000 10120.4%BMI (kg/m2)<18.5285.7%
NT$30,001–50,00022545.5%18.5 ≤ BMI < 2426854.1%
NT$50,001–70,0007715.6%24 ≤ BMI < 2712224.6%
NT$70,001–90,000102.0%27≤5711.4%
Above NT$90,000122.4%Unknown204.0%
Table 3. Estimation results of the RPL models.
Attribute and VariableRPL
Coefficientt-ValueStandard Errort-ValueWTP (NTD)
GD0.489−1.35 *0.4041.353
VGD0.7138.16 ***0.4483.84 ***4.3
NF0.7236.0 **0.4295.13 ***4.4
TAP0.74711.1 ***0.4157.974.6
CF0.551−5.44 **0.3215.623.3
FUND0.163−7.6 *
Number of choice sets990
Log-likelihood ratio−589.744
***, **, and * are significant at 1%, 5%, and 10%, respectively; NTD: new Taiwan dollar (1 NTD = 0.033 USD); RPL: random parameter logit; WTP: willingness to pay.
Table 4. Comparison of respondents’ socioeconomic background and WTP for the attributes of healthy boxed meals.
Socioeconomic BackgroundSample SizeASCNFTAP
Averaget-ValueAverage t-ValueAverage t-Value
GenderMale223−22567−2.37 *2.71.823.91.39 ***
Female272−262423.45.6
Age20–29 years old196−26266−3.61 *2.61.67 **2.92.49 **
30–39 years old177−268712.85.3
40–49 years old61−240814.64.4
50–59 years old42−251443.03.7
Over 60 years old19−245243.13.0
Education
level
Senior high/vocational school (inclusive) or below40−225341.282.40.863.22.14 ***
College or university351−263293.24.4
Master’s96−261663.45.1
Doctorate8−265623.04.5
Average personal monthly incomeLess than NTD 10,000 (inclusive)70−20349−4.72 **2.52.45 ***2.72.47
NTD 10,000–30,000 (inclusive)101−186632.03.2
NTD 30,000–50,000 (inclusive)225−264773.23.5
NTD 50,000–70,000 (inclusive)77−261194.24.1
NTD 70,000–90,000 (inclusive)10−265634.14.5
Above NTD 90,00012−268704.14.7
Muscle building, fat loss, or weight controlYes319−261650.754.71.02 ***3.41.88
No176−260593.13.2
Regular exerciseYes280−261640.754.51.02 **3.71.88
No215−230812.73.3
***, **, and * are significant at 1%, 5%, and 10%, respectively.
Disclaimer/Publisher’s Note: The statements, opinions and data contained in all publications are solely those of the individual author(s) and contributor(s) and not of MDPI and/or the editor(s). MDPI and/or the editor(s) disclaim responsibility for any injury to people or property resulting from any ideas, methods, instructions or products referred to in the content.

