
Association of Serum Metabolites and Salt Sensitivity of Blood Pressure in Chinese Population: The EpiSS Study
 , ,
, ,
Abstract
:1. Introduction
2. Materials and Methods
2.1. Participants
2.2. Determination of SS
2.3. Data and Sample Collection
2.4. Metabolomics Profiling
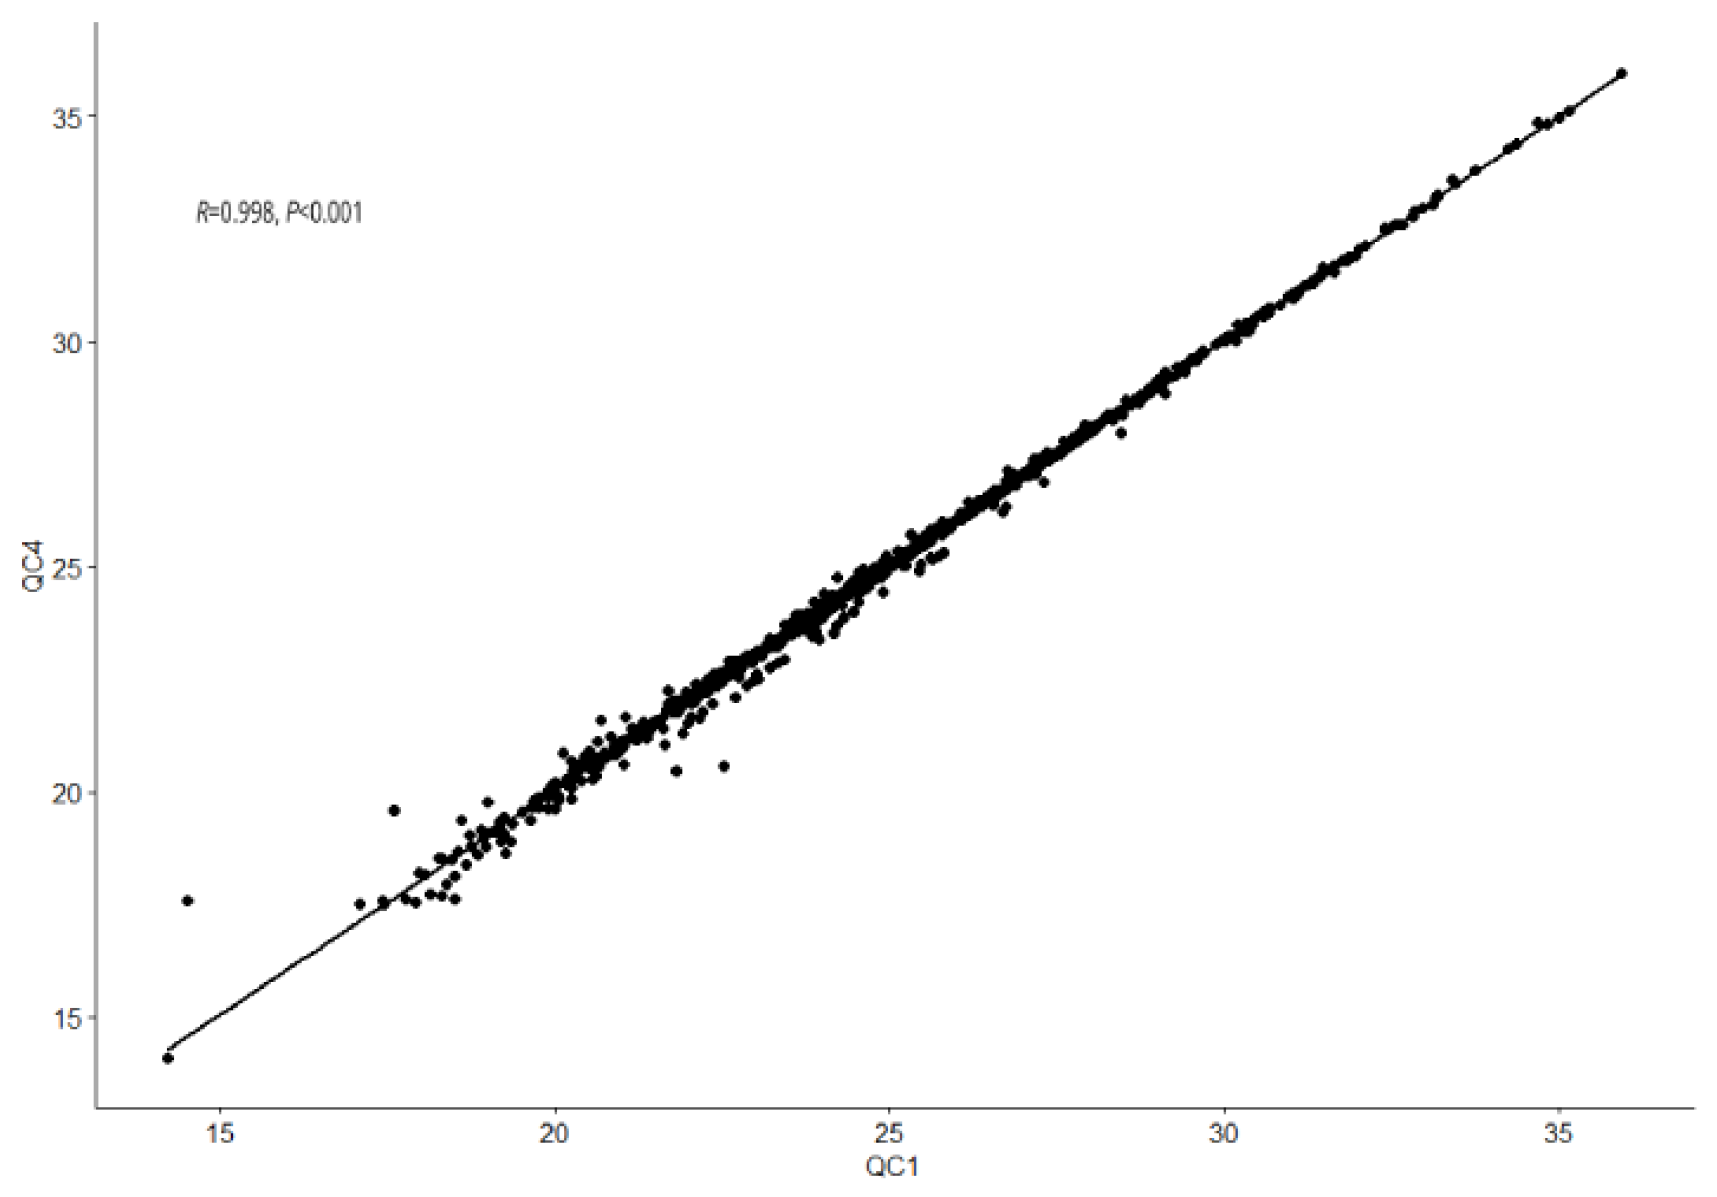
2.5. Quality Control
2.6. Statistical Methods
3. Results
3.1. Characteristics of Participants
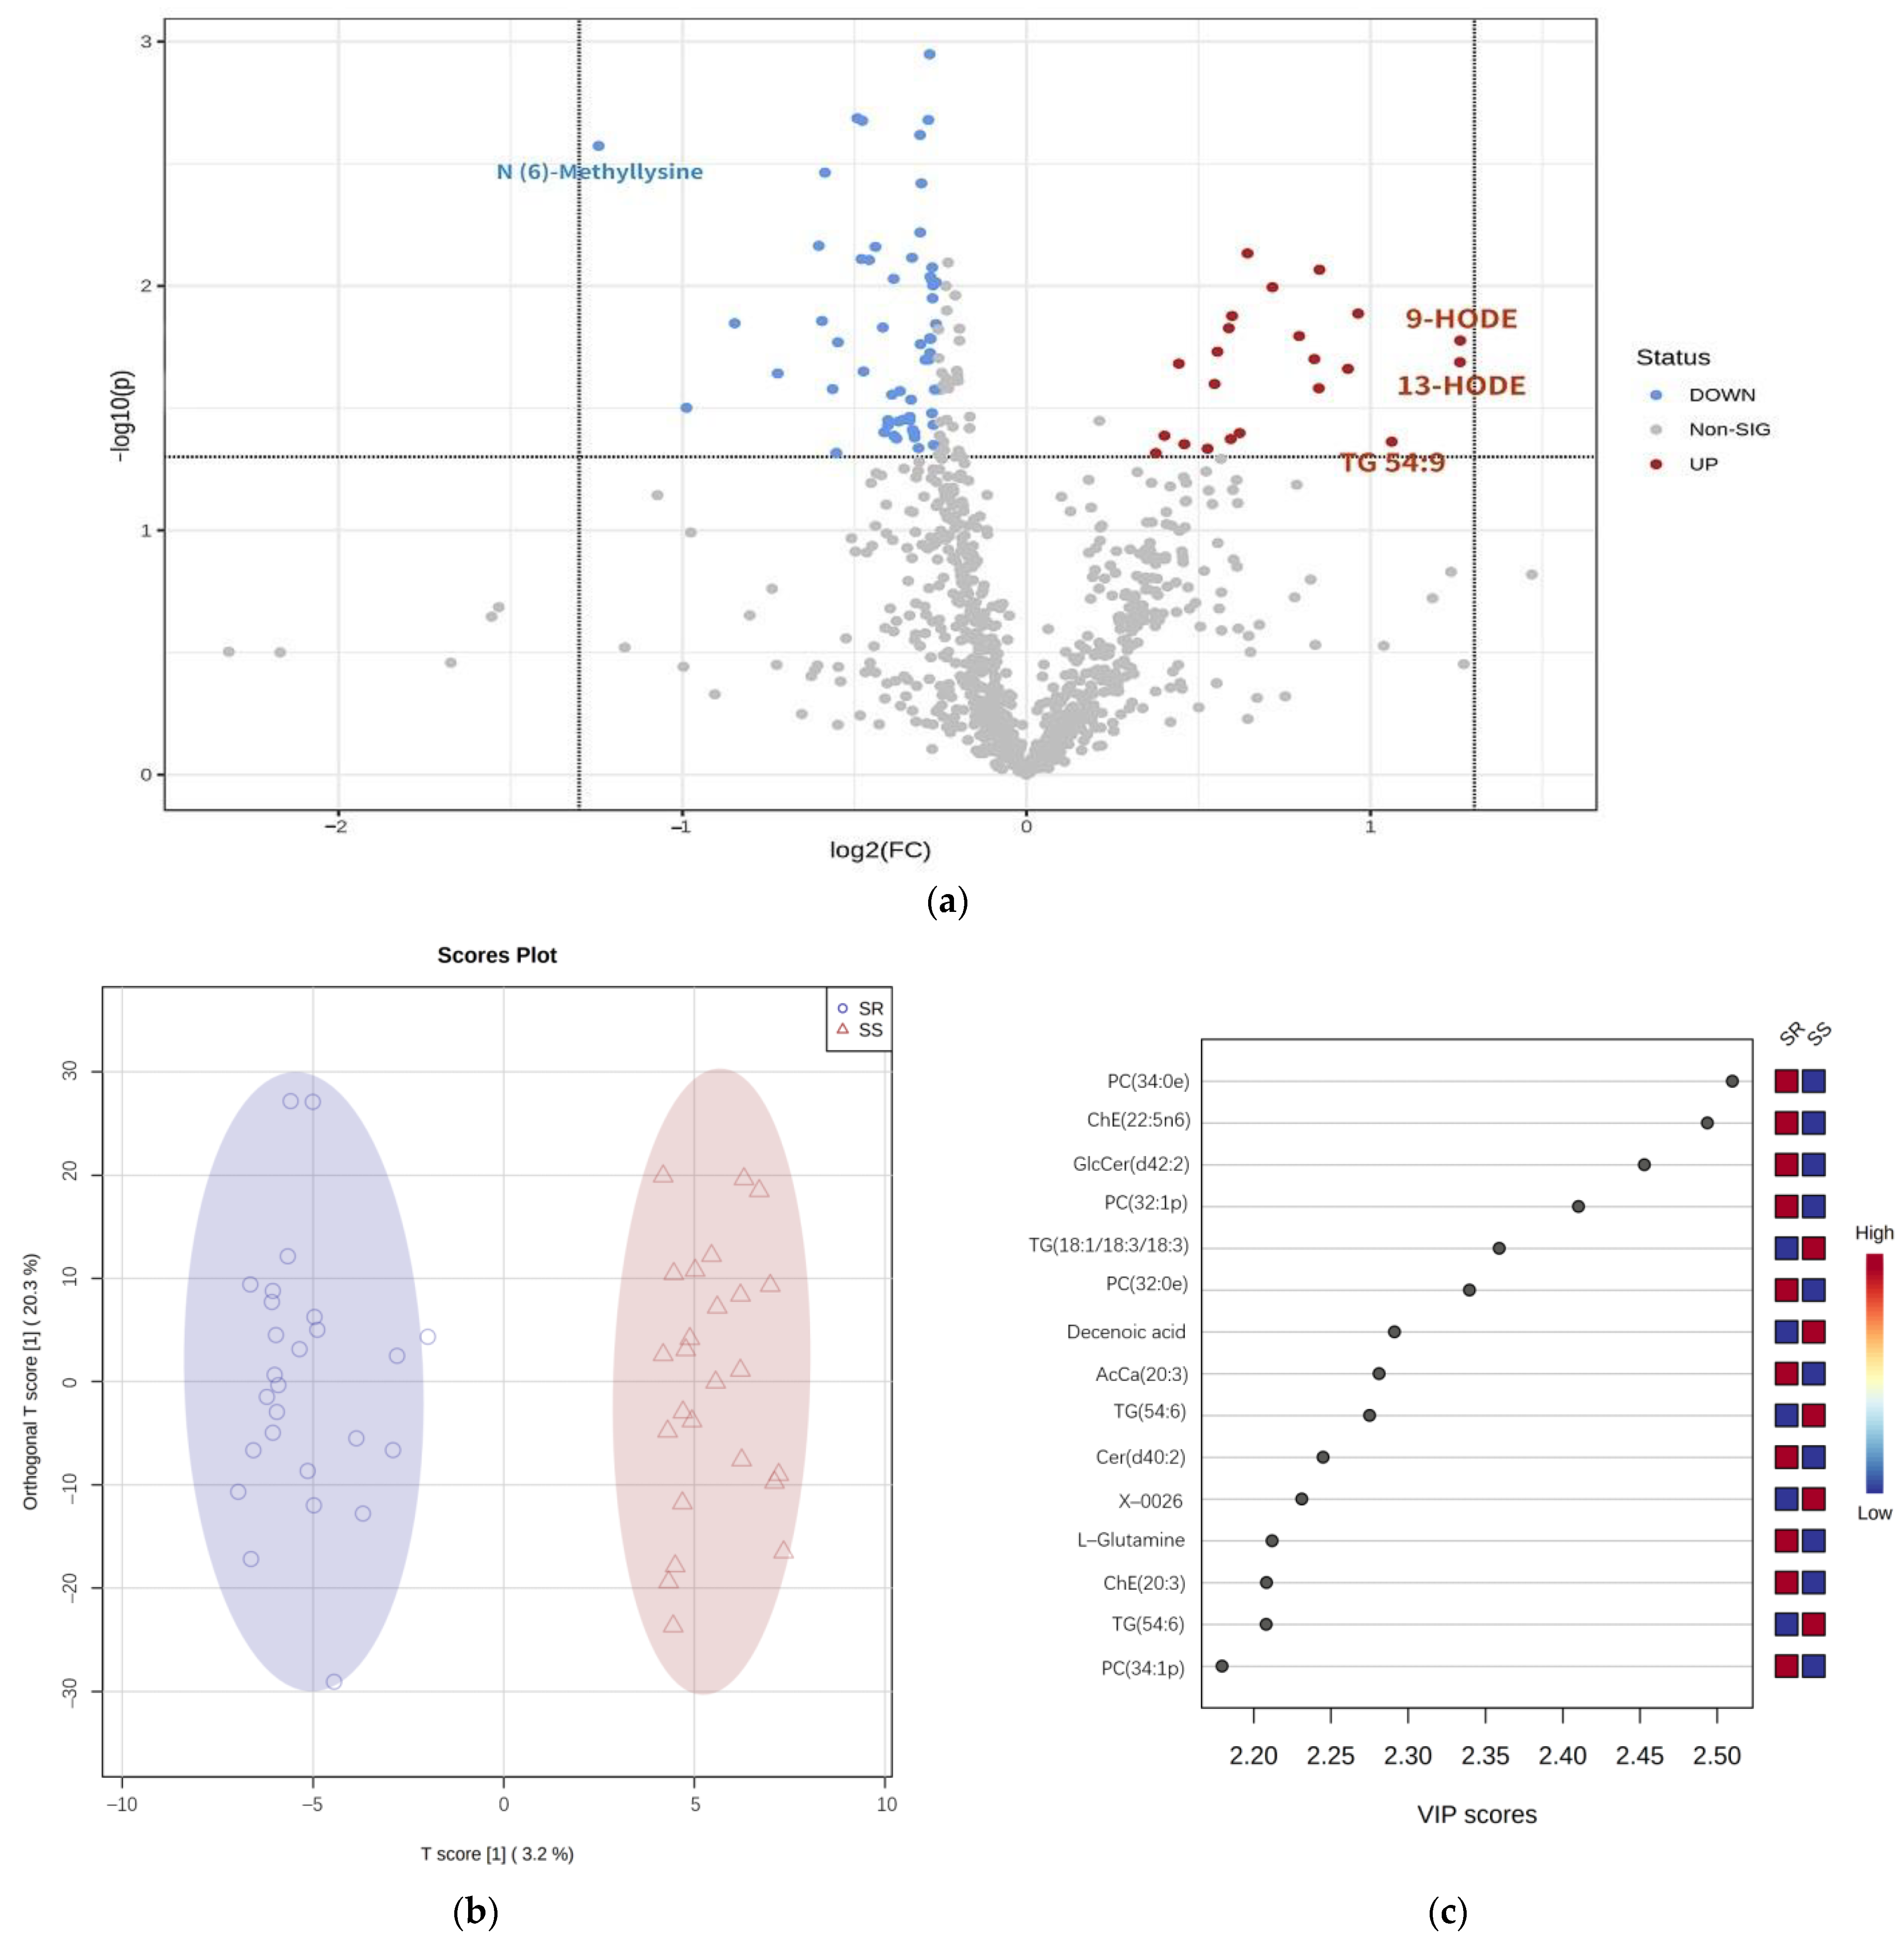
3.2. Serum Metabolite Levels in SS and SR
3.2.1. Metabolites Nominally Associated with SS
3.2.2. Pathway Analysis
3.3. Multiple Logistic Regression Analysis
3.4. Metabolites Diagnostic Performance by ROC Analysis
3.4.1. Single-Metabolite Diagnostic Performance by ROC Analysis
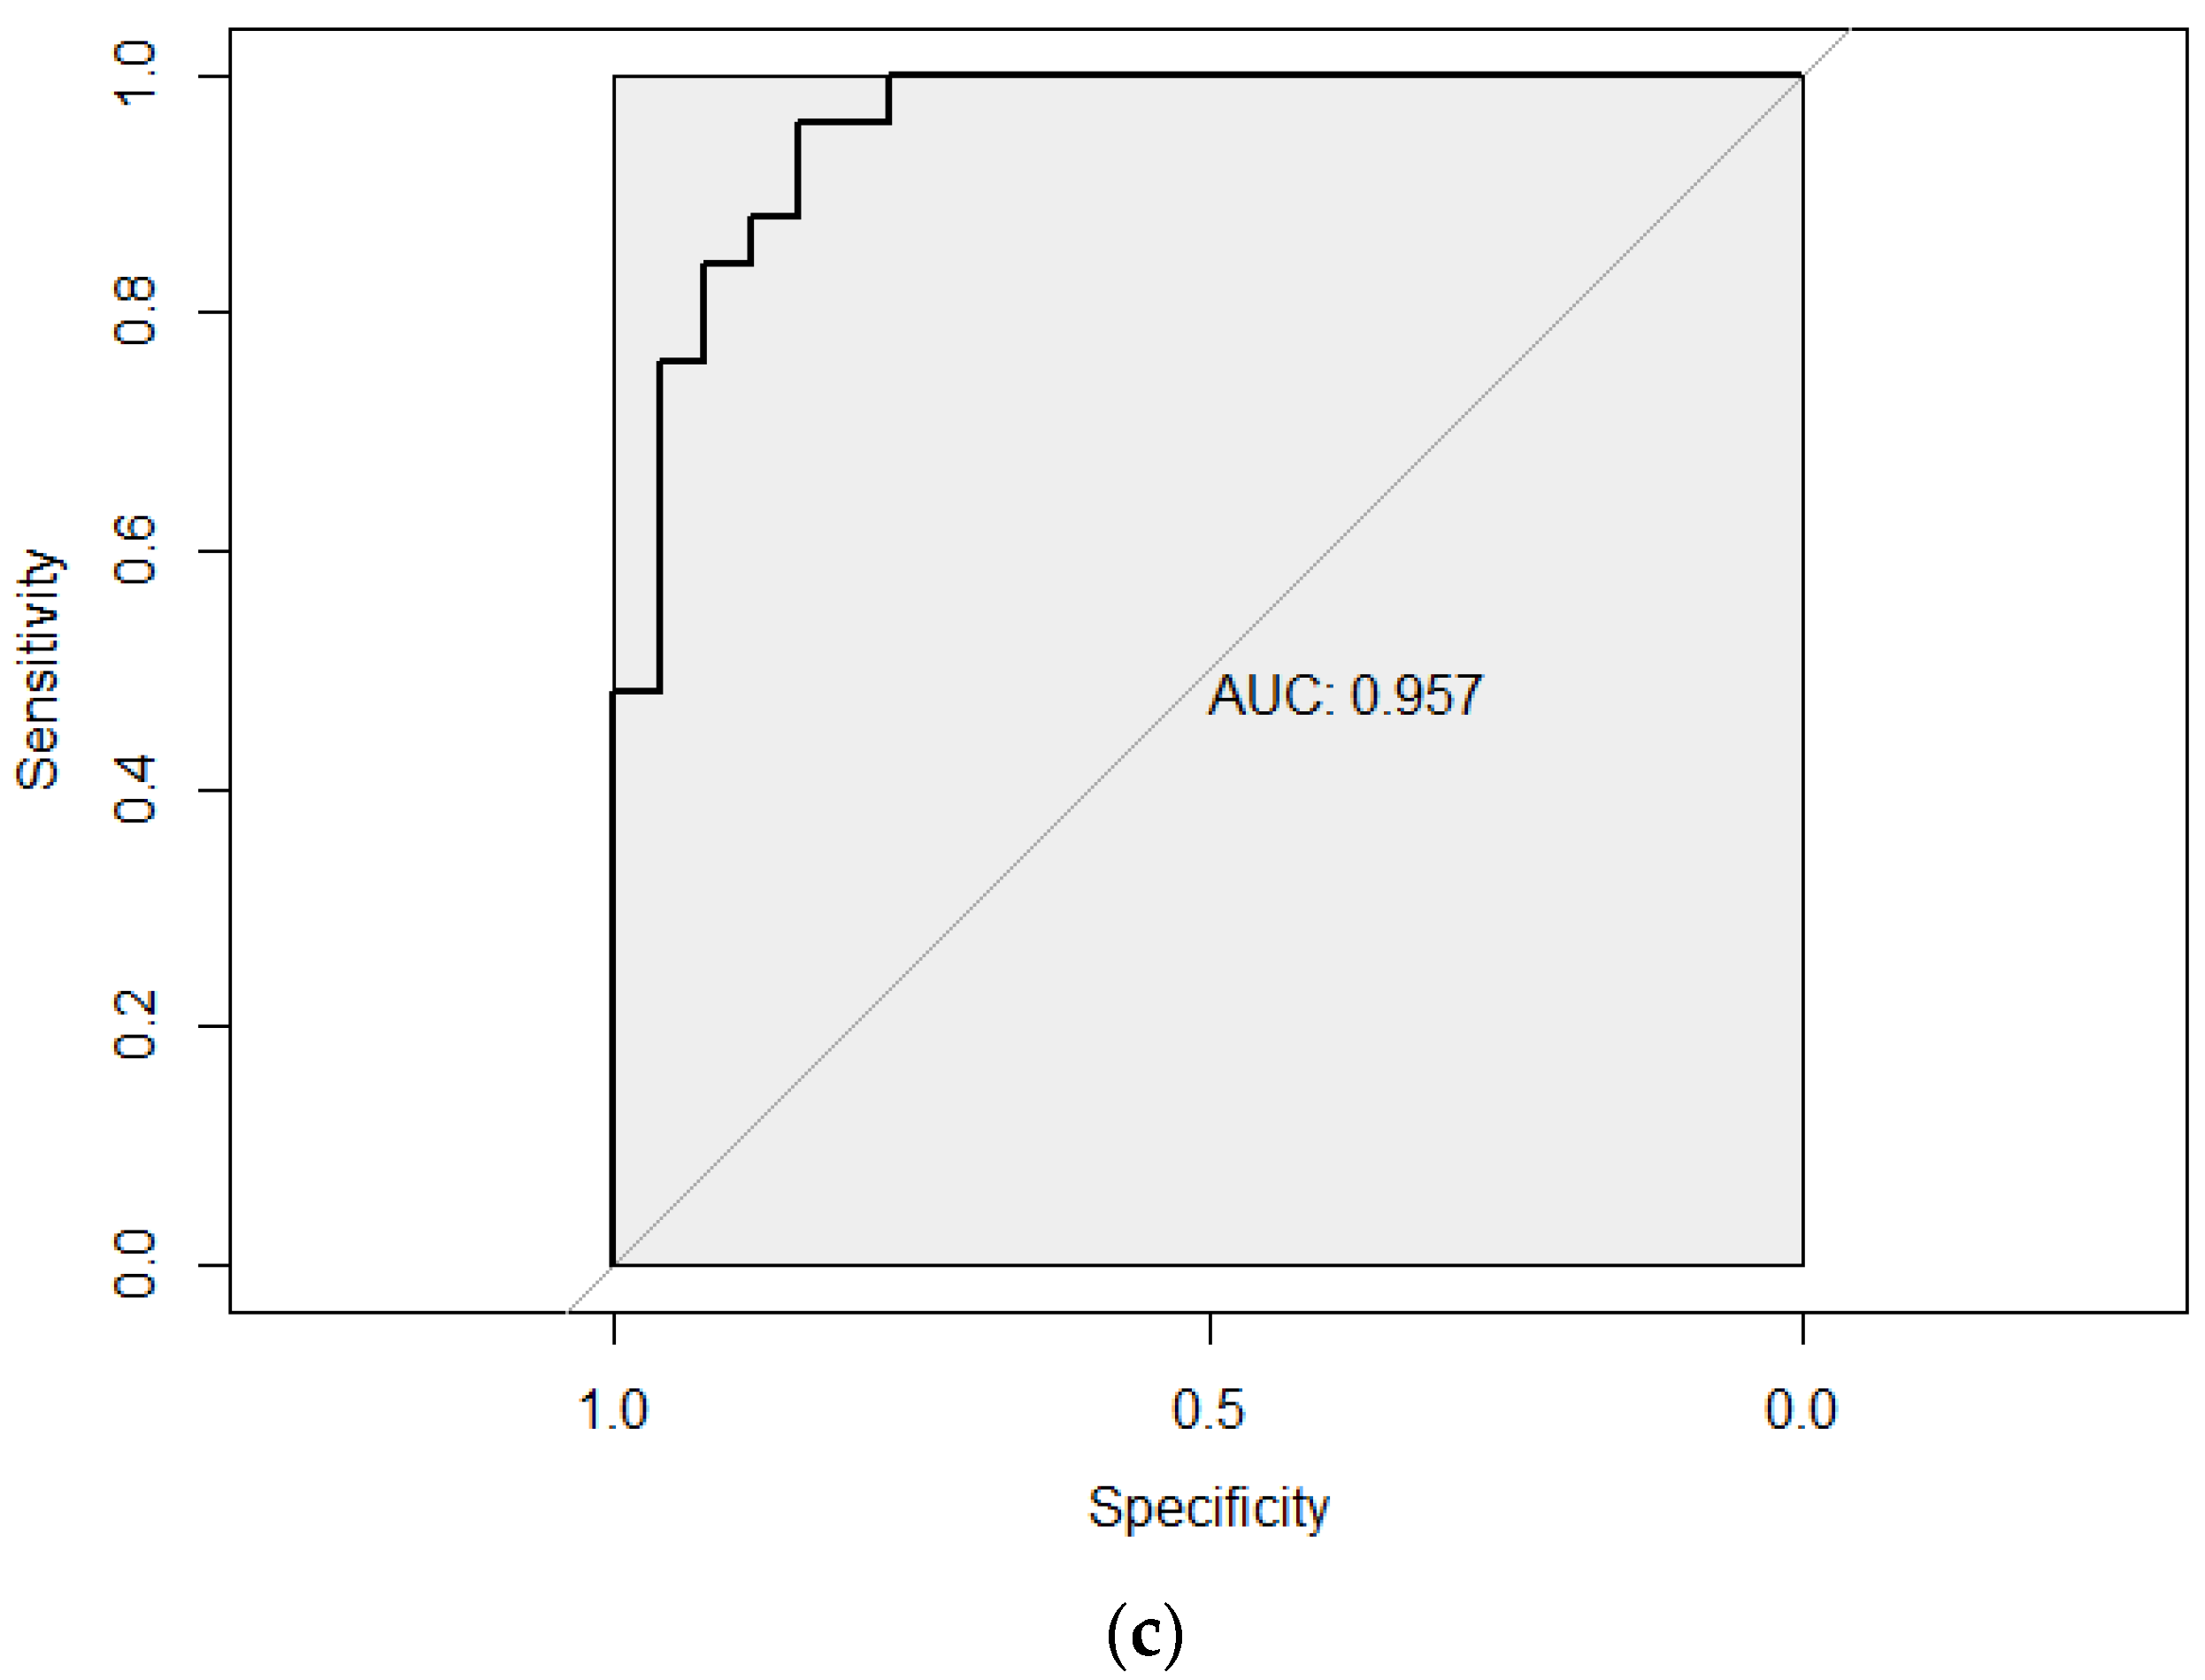
3.4.2. Added Value of Metabolites in the Prediction of SS
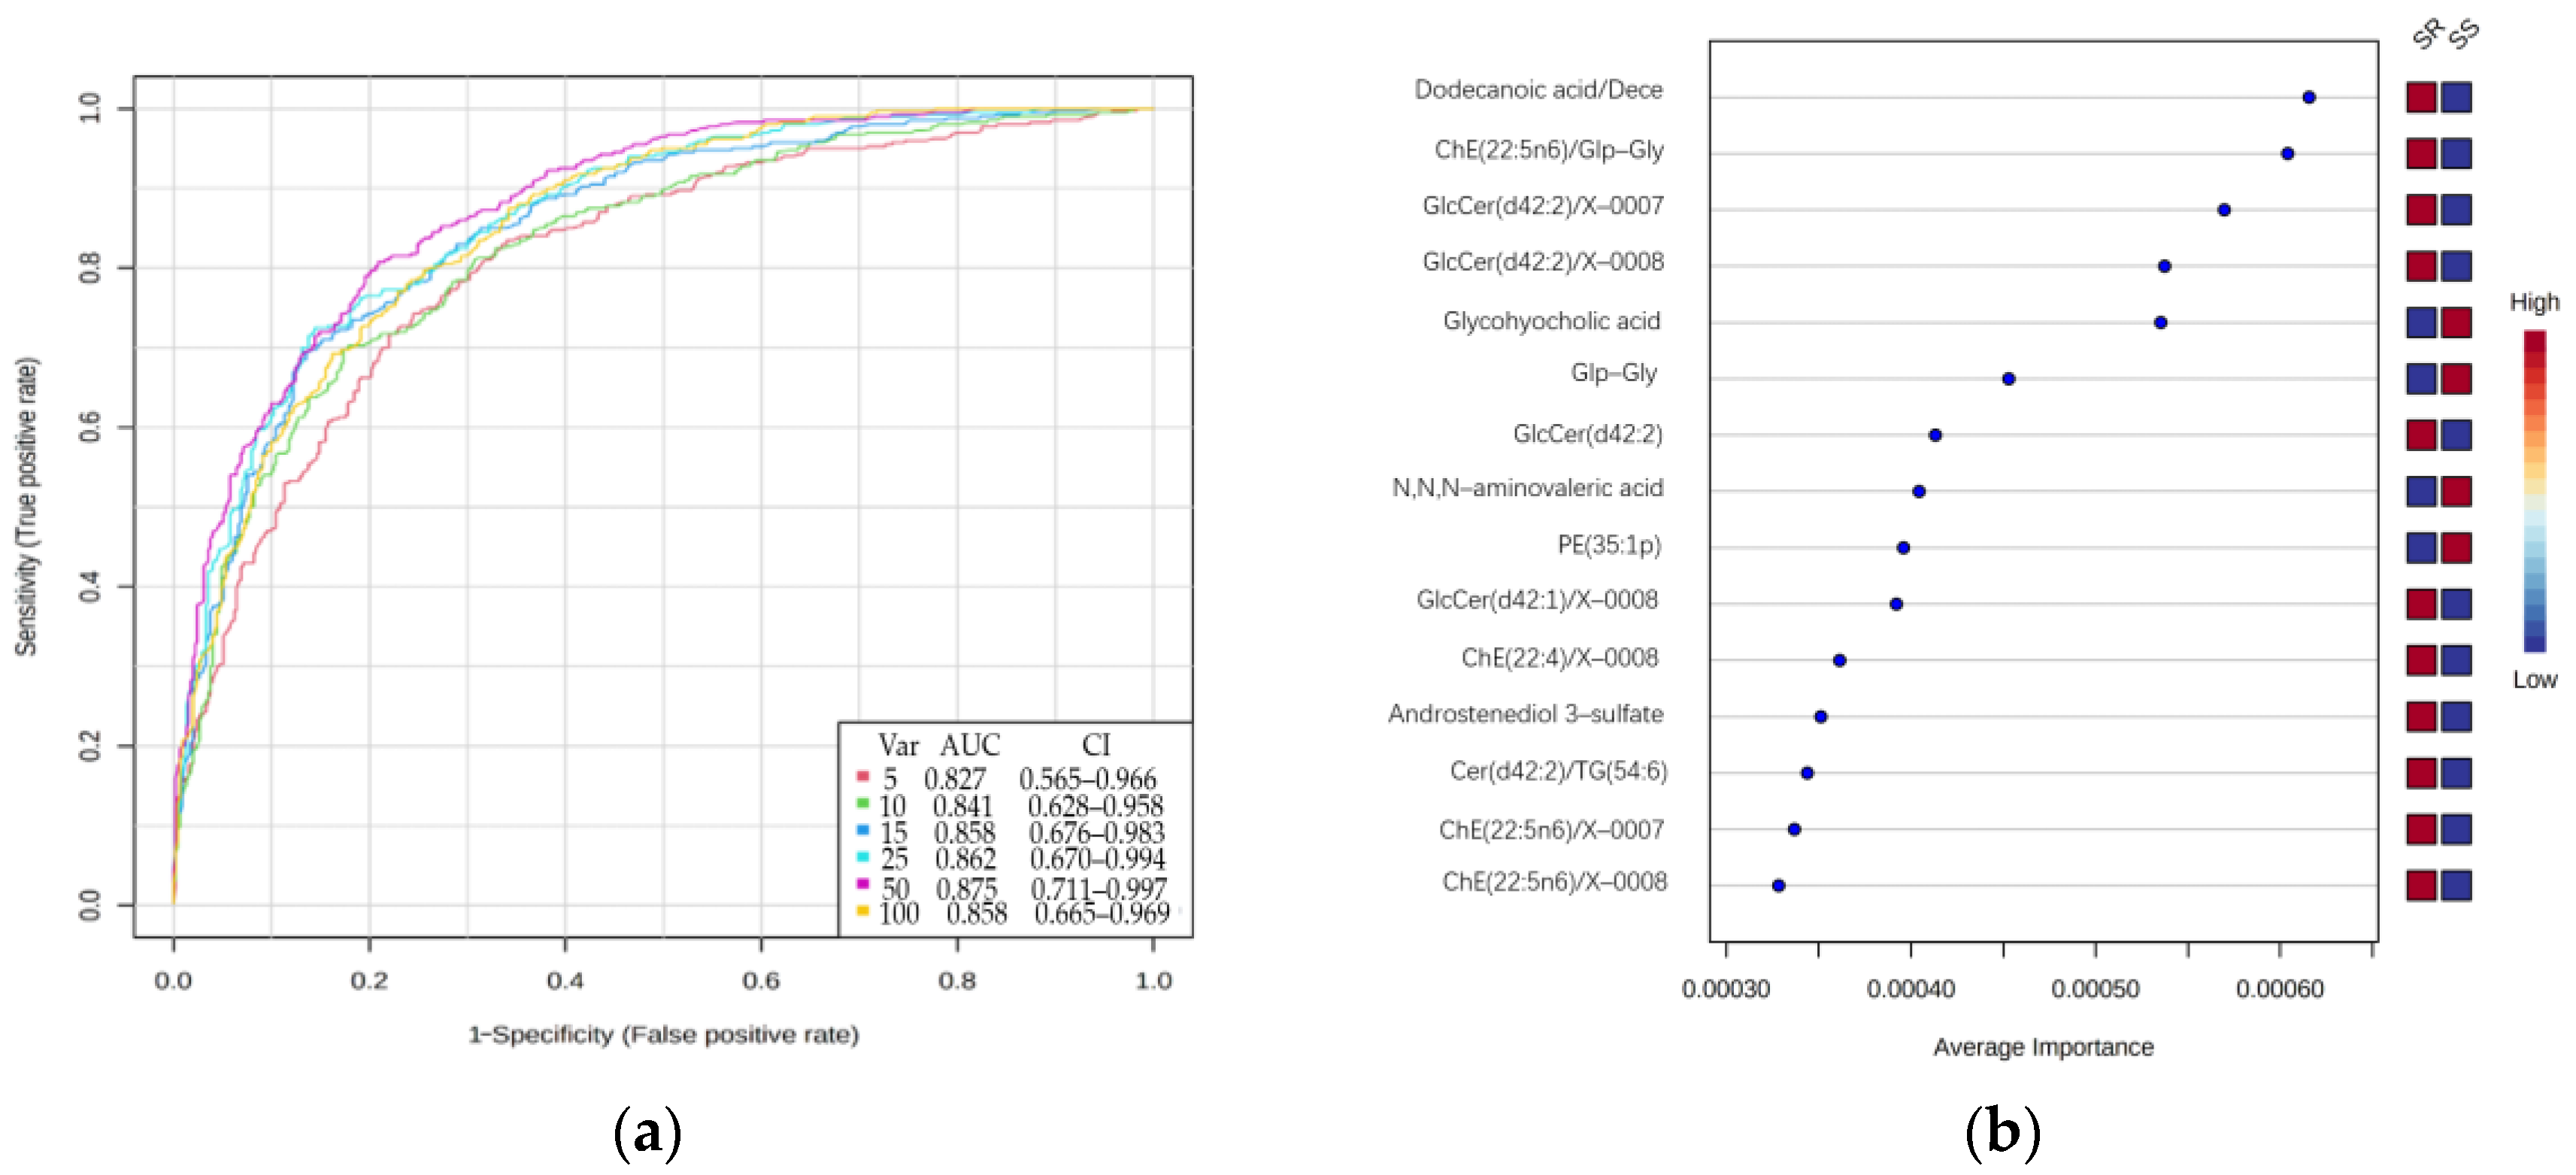
3.4.3. ROC Analysis of Metabolites Based on Monte Carlo Models
4. Discussion
5. Conclusions
Supplementary Materials
Author Contributions
Funding
Institutional Review Board Statement
Informed Consent Statement
Data Availability Statement
Acknowledgments
Conflicts of Interest
References
- Mels, C.M.; Delles, C.; Louw, R.; Schutte, A.E. Central systolic pressure and a nonessential amino acid metabolomics profile: The African Prospective study on the Early Detection and Identification of Cardiovascular disease and Hypertension. J. Hypertens. 2019, 37, 1157–1166. [Google Scholar] [CrossRef]
- Zhang, M.; Wu, J.; Zhang, X.; Hu, C.H.; Zhao, Z.P.; Li, C.; Huang, Z.J.; Zhou, M.G.; Wang, L.M. Study on Prevalence and Control of Hypertension among Chinese Adult Residents in 2018. J. Chin. Epidemiol. 2021, 42, 1780–1789. [Google Scholar]
- He, F.J.; Li, J.; Macgregor, G.A. Effect of longer term modest salt reduction on blood pressure: Cochrane systematic review and meta-analysis of randomised trials. BMJ 2013, 346, f1325. [Google Scholar] [CrossRef] [Green Version]
- Newberry, S.J.; Chung, M.; Anderson, C.A.M.; Chen, C.; Fu, Z.; Tang, A.; Zhao, N.; Booth, M.; Marks, J.; Hollands, S.; et al. AHRQ Comparative effectiveness reviews. In Sodium and Potassium Intake: Effects on Chronic Disease Outcomes and Risks; Agency for Healthcare Research and Quality (US): Rockville, MD, USA, 2018. [Google Scholar]
- Elijovich, F.; Weinberger, M.H.; Anderson, C.A.; Appel, L.J.; Bursztyn, M.; Cook, N.R.; Dart, R.A.; Newton-Cheh, C.H.; Sacks, F.M.; Laffer, C.L. Salt Sensitivity of Blood Pressure: A Scientific Statement From the American Heart Association. Hypertension 2016, 68, e7–e46. [Google Scholar] [CrossRef] [Green Version]
- He, J.; Kelly, T.N.; Zhao, Q.; Li, H.; Huang, J.; Wang, L.; Jaquish, C.E.; Sung, Y.J.; Shimmin, L.C.; Lu, F.; et al. Genome-wide association study identifies 8 novel loci associated with blood pressure responses to interventions in Han Chinese. Circ. Cardiovasc. Genet. 2013, 6, 598–607. [Google Scholar] [CrossRef] [Green Version]
- Barba, G.; Galletti, F.; Cappuccio, F.P.; Siani, A.; Venezia, A.; Versiero, M.; Della Valle, E.; Sorrentino, P.; Tarantino, G.; Farinaro, E.; et al. Incidence of hypertension in individuals with different blood pressure salt-sensitivity: Results of a 15-year follow-up study. J. Hypertens. 2007, 25, 1465–1471. [Google Scholar] [CrossRef] [Green Version]
- Sharma, A.M. Salt sensitivity as a phenotype for genetic studies of human hypertension. Nephrology, dialysis, transplantation: Official publication of the European Dialysis and Transplant Association—European Renal Association. Nephrol. Dial. Transplant. 1996, 11, 927–929. [Google Scholar] [CrossRef]
- Mou, J.J.; Chu, C. Research progress and prospect of salt sensitive hypertension. Chin. J. Hypertens. 2016, 24, 706–708. [Google Scholar] [CrossRef]
- Liu, Y.; Shi, M.; Dolan, J.; He, J. Sodium sensitivity of blood pressure in Chinese populations. J. Hum. Hypertens. 2020, 34, 94–107. [Google Scholar] [CrossRef]
- Weinberger, M.H.; Fineberg, N.S.; Fineberg, S.E.; Weinberger, M. Salt sensitivity, pulse pressure, and death in normal and hypertensive humans. Hypertension 2001, 37, 429–432. [Google Scholar] [CrossRef] [Green Version]
- Ussher, J.R.; Elmariah, S.; Gerszten, R.E.; Dyck, J.R. The Emerging Role of Metabolomics in the Diagnosis and Prognosis of Cardiovascular Disease. J. Am. Coll. Cardiol. 2016, 68, 2850–2870. [Google Scholar] [CrossRef] [PubMed]
- Zhou, B.; Xiao, J.F.; Tuli, L.; Ressom, H.W. LC-MS-based metabolomics. Mol. Biosyst. 2012, 8, 470–481. [Google Scholar] [CrossRef] [PubMed] [Green Version]
- Menni, C.; Graham, D.; Kastenmüller, G.; Alharbi, N.H.; Alsanosi, S.M.; McBride, M.; Mangino, M.; Titcombe, P.; Shin, S.Y.; Psatha, M.; et al. Metabolomic identification of a novel pathway of blood pressure regulation involving hexadecanedioate. Hypertension 2015, 66, 422–429. [Google Scholar] [CrossRef] [PubMed] [Green Version]
- He, W.J.; Li, C.; Mi, X.; Shi, M.; Gu, X.; Bazzano, L.A.; Razavi, A.C.; Nierenberg, J.L.; Dorans, K.; He, H.; et al. An untargeted metabolomics study of blood pressure: Findings from the Bogalusa Heart Study. J. Hypertens. 2020, 38, 1302–1311. [Google Scholar] [CrossRef]
- Xiong, X. A Study on the Association of Metabolites with Risk of Incident Hypertension. Master’s Thesis, Hubei Medical College, Shiyan, China, 2020. [Google Scholar]
- Emwas, A.H. The strengths and weaknesses of NMR spectroscopy and mass spectrometry with particular focus on metabolomics research. Methods Mol. Biol. 2015, 1277, 161–193. [Google Scholar] [CrossRef]
- Colaco, K.; Lee, K.A.; Akhtari, S.; Winer, R.; Welsh, P.; Sattar, N.; McInnes, I.B.; Chandran, V.; Harvey, P.; Cook, R.J.; et al. Targeted metabolomic profiling and prediction of cardiovascular events: A prospective study of patients with psoriatic arthritis and psoriasis. Ann. Rheum. Dis. 2021, 80, 1429–1435. [Google Scholar] [CrossRef]
- Cheng, Y.; Song, H.; Pan, X.; Xue, H.; Wan, Y.; Wang, T.; Tian, Z.; Hou, E.; Lanza, I.R.; Liu, P.; et al. Urinary Metabolites Associated with Blood Pressure on a Low- or High-Sodium Diet. Theranostics 2018, 8, 1468–1480. [Google Scholar] [CrossRef] [Green Version]
- Shi, M.; He, J.; Li, C.; Lu, X.; He, W.J.; Cao, J.; Chen, J.; Chen, J.C.; Bazzano, L.A.; Li, J.X.; et al. Metabolomics study of blood pressure salt-sensitivity and hypertension. Nutr. Metab. Cardiovasc. Dis. NMCD 2022, 32, 1681–1692. [Google Scholar] [CrossRef]
- Dietrich, S.; Floegel, A.; Weikert, C.; Prehn, C.; Adamski, J.; Pischon, T.; Boeing, H.; Drogan, D. Identification of Serum Metabolites Associated with Incident Hypertension in the European Prospective Investigation into Cancer and Nutrition-Potsdam Study. Hypertension 2016, 68, 471–477. [Google Scholar] [CrossRef]
- Müller, J.; Bertsch, T.; Volke, J.; Schmid, A.; Klingbeil, R.; Metodiev, Y.; Karaca, B.; Kim, S.H.; Lindner, S.; Schupp, T.; et al. Narrative review of metabolomics in cardiovascular disease. J. Thorac. Dis. 2021, 13, 2532–2550. [Google Scholar] [CrossRef]
- Qi, H.; Liu, B.; Guo, C.; Liu, Z.; Cao, H.; Liu, K.; Sun, W.; Zhang, L. Effects of environmental and genetic risk factors for salt sensitivity on blood pressure in northern China: The systemic epidemiology of salt sensitivity (EpiSS) cohort study. BMJ Open 2018, 8, e023042. [Google Scholar] [CrossRef] [PubMed]
- Weinberger, M.H.; Miller, J.Z.; Luft, F.C.; Grim, C.E.; Fineberg, N.S. Definitions and characteristics of sodium sensitivity and blood pressure resistance. Hypertension 1986, 8, Ii127–Ii134. [Google Scholar] [CrossRef] [Green Version]
- Li, Y.M.; Liu, Z.Q.; Yang, D.Y. The distribution of salt sensitivity in hypertensives and the screen of salt sensitive markers. Chin. J. Cardiol. 1994, 89, 89. [Google Scholar]
- Liu, K.; Xi, B.; Liu, Z.; Qi, H.; Liu, B.; Zhang, J.; Cao, H.; Yan, Y.; Zhao, M.; He, Y.; et al. Genetic Predisposition and Salt Sensitivity in a Chinese Han Population: The EpiSS Study. Int. J. Hypertens. 2020, 2020, 3167875. [Google Scholar] [CrossRef] [Green Version]
- Guidelines for the Prevention and Treatment of Hypertension in China (revised in 2018). Chin. J. Cardiovasc. Med. 2019, 24, 24–56.
- World Health Organization. Regional Consultation on Strategies to Reduce Salt Intake. Available online: http://www.wpro.who.int/noncommunicable_diseases/documents/RCStratReduce_Salt_Intake/en/ (accessed on 3 June 2010).
- Sumner, L.W.; Amberg, A.; Barrett, D.; Beale, M.H.; Beger, R.; Daykin, C.A.; Fan, T.W.; Fiehn, O.; Goodacre, R.; Griffin, J.L.; et al. Proposed minimum reporting standards for chemical analysis Chemical Analysis Working Group (CAWG) Metabolomics Standards Initiative (MSI). Metab. Off. J. Metab. Soc. 2007, 3, 211–221. [Google Scholar] [CrossRef] [Green Version]
- Hu, C.; Wang, T.; Zhuang, X.; Sun, Q.; Wang, X.; Lin, H.; Feng, M.; Zhang, J.; Cao, Q.; Jiang, Y. Metabolic analysis of early nonalcoholic fatty liver disease in humans using liquid chromatography-mass spectrometry. J. Transl. Med. 2021, 19, 152. [Google Scholar] [CrossRef]
- Castañé, H.; Iftimie, S.; Baiges-Gaya, G.; Rodríguez-Tomàs, E.; Jiménez-Franco, A.; López-Azcona, A.F.; Garrido, P.; Castro, A.; Camps, J.; Joven, J. Machine learning and semi-targeted lipidomics identify distinct serum lipid signatures in hospitalized COVID-19-positive and COVID-19-negative patients. Metab. Clin. Exp. 2022, 131, 155197. [Google Scholar] [CrossRef]
- Zhang, X.; Yang, X.; Lin, Y.; Suo, M.; Gong, L.; Chen, J.; Hui, R. Anti-hypertensive effect of Lycium barbarum L. with down-regulated expression of renal endothelial lncRNA sONE in a rat model of salt-sensitive hypertension. Int. J. Clin. Exp. Pathol. 2015, 8, 6981–6987. [Google Scholar]
- He, J.; Huang, J.F.; Li, C.; Chen, J.; Lu, X.; Chen, J.C.; He, H.; Li, J.X.; Cao, J.; Chen, C.S.; et al. Sodium Sensitivity, Sodium Resistance, and Incidence of Hypertension: A Longitudinal Follow-Up Study of Dietary Sodium Intervention. Hypertension 2021, 78, 155–164. [Google Scholar] [CrossRef]
- Durante, W. The Emerging Role of l-Glutamine in Cardiovascular Health and Disease. Nutrients 2019, 11, 2092. [Google Scholar] [CrossRef] [PubMed] [Green Version]
- Cheng, S.; Rhee, E.P.; Larson, M.G.; Lewis, G.D.; McCabe, E.L.; Shen, D.; Palma, M.J.; Roberts, L.D.; Dejam, A.; Souza, A.L.; et al. Metabolite profiling identifies pathways associated with metabolic risk in humans. Circulation 2012, 125, 2222–2231. [Google Scholar] [CrossRef] [PubMed] [Green Version]
- Wu, G.; Morris, S.M., Jr. Arginine metabolism: Nitric oxide and beyond. Biochem. J. 1998, 336, 1–17. [Google Scholar] [CrossRef] [PubMed]
- Leo, F.; Suvorava, T.; Heuser, S.K.; Li, J.; LoBue, A.; Barbarino, F.; Piragine, E.; Schneckmann, R.; Hutzler, B.; Good, M.E.; et al. Red Blood Cell and Endothelial eNOS Independently Regulate Circulating Nitric Oxide Metabolites and Blood Pressure. Circulation 2021, 144, 870–889. [Google Scholar] [CrossRef]
- Boelens, P.G.; van Leeuwen, P.A.; Dejong, C.H.; Deutz, N.E. Intestinal renal metabolism of L-citrulline and L-arginine following enteral or parenteral infusion of L-alanyl-L-[2,15N]glutamine or L-[2,15N]glutamine in mice. Am. J. Physiol. Gastrointest. Liver Physiol. 2005, 289, G679–G685. [Google Scholar] [CrossRef]
- Wang, D.; Strandgaard, S.; Borresen, M.L.; Luo, Z.; Connors, S.G.; Yan, Q.; Wilcox, C.S. Asymmetric dimethylarginine and lipid peroxidation products in early autosomal dominant polycystic kidney disease. Am. J. Kidney Dis. 2008, 51, 184–191. [Google Scholar] [CrossRef] [PubMed]
- Leghmar, K.; Cenac, N.; Rolland, M.; Martin, H.; Rauwel, B.; Bertrand-Michel, J.; Le Faouder, P.; Bénard, M.; Casper, C.; Davrinche, C.; et al. Cytomegalovirus Infection Triggers the Secretion of the PPARγ Agonists 15-Hydroxyeicosatetraenoic Acid (15-HETE) and 13-Hydroxyoctadecadienoic Acid (13-HODE) in Human Cytotrophoblasts and Placental Cultures. PloS ONE 2015, 10, e0132627. [Google Scholar] [CrossRef]
- Osborn, J.W.; Olson, D.M.; Guzman, P.; Toney, G.M.; Fink, G.D. The neurogenic phase of angiotensin II-salt hypertension is prevented by chronic intracerebroventricular administration of benzamil. Physiol. Rep. 2014, 2, e00245. [Google Scholar] [CrossRef]
- Qi, J.; Yu, X.J.; Shi, X.L.; Gao, H.L.; Yi, Q.Y.; Tan, H.; Fan, X.Y.; Zhang, Y.; Song, X.A.; Cui, W.; et al. NF-κB Blockade in Hypothalamic Paraventricular Nucleus Inhibits High-Salt-Induced Hypertension Through NLRP3 and Caspase-1. Cardiovasc. Toxicol. 2016, 16, 345–354. [Google Scholar] [CrossRef]
- Meng, S.; Cason, G.W.; Gannon, A.W.; Racusen, L.C.; Manning, R.D., Jr. Oxidative stress in Dahl salt-sensitive hypertension. Hypertension 2003, 41, 1346–1352. [Google Scholar] [CrossRef] [Green Version]
- Tian, N.; Moore, R.S.; Phillips, W.E.; Lin, L.; Braddy, S.; Pryor, J.S.; Stockstill, R.L.; Hughson, M.D.; Manning, R.D., Jr. NADPH oxidase contributes to renal damage and dysfunction in Dahl salt-sensitive hypertension. Am. J. Physiol. Regul. Integr. Comp. Physiol. 2008, 295, R1858–R1865. [Google Scholar] [CrossRef] [PubMed] [Green Version]
- Felder, R.A.; White, M.J.; Williams, S.M.; Jose, P.A. Diagnostic tools for hypertension and salt sensitivity testing. Curr. Opin. Nephrol. Hypertens. 2013, 22, 65–76. [Google Scholar] [CrossRef] [Green Version]
- Schulman, I.H.; Aranda, P.; Raij, L.; Veronesi, M.; Aranda, F.J.; Martin, R. Surgical menopause increases salt sensitivity of blood pressure. Hypertension 2006, 47, 1168–1174. [Google Scholar] [CrossRef] [PubMed] [Green Version]
- Nichols, J.; Elijovich, F.; Laffer, C.L. Lack of validation of a same-day outpatient protocol for determination of salt sensitivity of blood pressure. Hypertension 2012, 59, 390–394. [Google Scholar] [CrossRef] [PubMed]
- Peng, W.; Xie, Y.; Xia, J.; Li, B.; Zhang, F.; Wen, F.; Liu, K.; Cao, H.; Qi, H.; Zhang, L. Association of Circulating Biomarkers of lnc-IGSF3-1:1, SCOC-AS1, and SLC8A1-AS1 with Salt Sensitivity of Blood Pressure in Chinese Population. J. Cardiovasc. Transl. Res. 2021, 15, 906–917. [Google Scholar] [CrossRef] [PubMed]
- Peng, W.; Xie, Y.; Cao, H.; Qi, H.; Liu, K.; Xia, J.; Liu, Z.; Liu, X.; Li, B.; Wen, F.; et al. Association study of fasting blood glucose and salt sensitivity of blood pressure in community population: The EpiSS study. Nutr. Metab. Cardiovasc. Dis. NMCD 2021, 31, 2366–2375. [Google Scholar] [CrossRef]
- Playdon, M.C.; Sampson, J.N.; Cross, A.J.; Sinha, R.; Guertin, K.A.; Moy, K.A.; Rothman, N.; Irwin, M.L.; Mayne, S.T.; Stolzenberg-Solomon, R.; et al. Comparing metabolite profiles of habitual diet in serum and urine. Am. J. Clin. Nutr. 2016, 104, 776–789. [Google Scholar] [CrossRef] [Green Version]
- Lau, C.E.; Siskos, A.P.; Maitre, L.; Robinson, O.; Athersuch, T.J.; Want, E.J.; Urquiza, J.; Casas, M.; Vafeiadi, M.; Roumeliotaki, T.; et al. Determinants of the urinary and serum metabolome in children from six European populations. BMC Med. 2018, 16, 202. [Google Scholar] [CrossRef]


| Variable | Total (n = 51) | SS (n = 25) | SR (n = 26) | p |
|---|---|---|---|---|
| Age (years) | 57.72 ± 5.42 | 57.71 ± 5.77 | 57.74 ± 5.06 | 0.980 |
| Male (%) | 15 (29.4) | 8 (32.0) | 7 (26.9) | 0.691 |
| BMI (kg/m2) | 26.24 ± 3.48 | 26.56 ± 3.41 | 25.94 ± 3.53 | 0.536 |
| Waist (cm) | 88.76 ± 10.87 | 89.47 ± 10.15 | 88.08 ± 11.48 | 0.655 |
| Hip (cm) | 98.90 ± 7.96 | 100.63 ± 8.16 | 97.23 ± 7.39 | 0.132 |
| FBG (mmol/L) | 5.42 ± 0.57 | 5.48 ± 0.61 | 5.36 ± 0.52 | 0.460 |
| TC (mmol/L) | 5.47 ± 1.04 | 5.29 ± 1.08 | 5.64 ± 0.97 | 0.227 |
| TG (mmol/L) | 1.77 ± 0.89 | 1.94 ± 1.10 | 1.60 ± 0.58 | 0.174 |
| LDL-C (mmol/L) | 2.40 ± 0.96 | 2.06 ± 0.84 | 2.72 ± 0.98 | 0.012 |
| HDL-C (mmol/L) | 1.87 ± 1.11 | 2.00 ± 1.25 | 1.74 ± 0.93 | 0.417 |
| Salt intake (g/day) | 7.06 ± 4.48 | 6.74 ± 4.28 | 7.36 ± 4.64 | 0.626 |
| Smoke (yes, %) | 8 (15.7) | 5 (20.0) | 3 (11.5) | 0.406 |
| Drink (yes, %) | 23 (45.1) | 14 (56.0) | 9 (34.6) | 0.125 |
| Hypertension (n, %) | 26 (51.0) | 14 (56.0) | 12 (46.2) | 0.482 |
| Family history of Hypertension (n, %) | 30 (58.8) | 17 (68.0) | 13 (50.0) | 0.192 |
| Anti-hypertension medication (n, %) | 19 (37.2) | 11 (44.0) | 8 (30.8) | 0.329 |
| SBP (mmHg) | 124.49 ± 21.61 | 114.60 ± 22.29 | 133.99 ± 16.29 | 0.001 |
| DBP (mmHg) | 79.65 ± 12.56 | 72.48 ± 10.93 | 86.54 ± 10.00 | 0.001 |
| Metabolites | Salt Sensitivity | ||
|---|---|---|---|
| OR | 95% CI | p | |
| TG 54:6 | 2.91 | 1.32–6.43 | 0.008 |
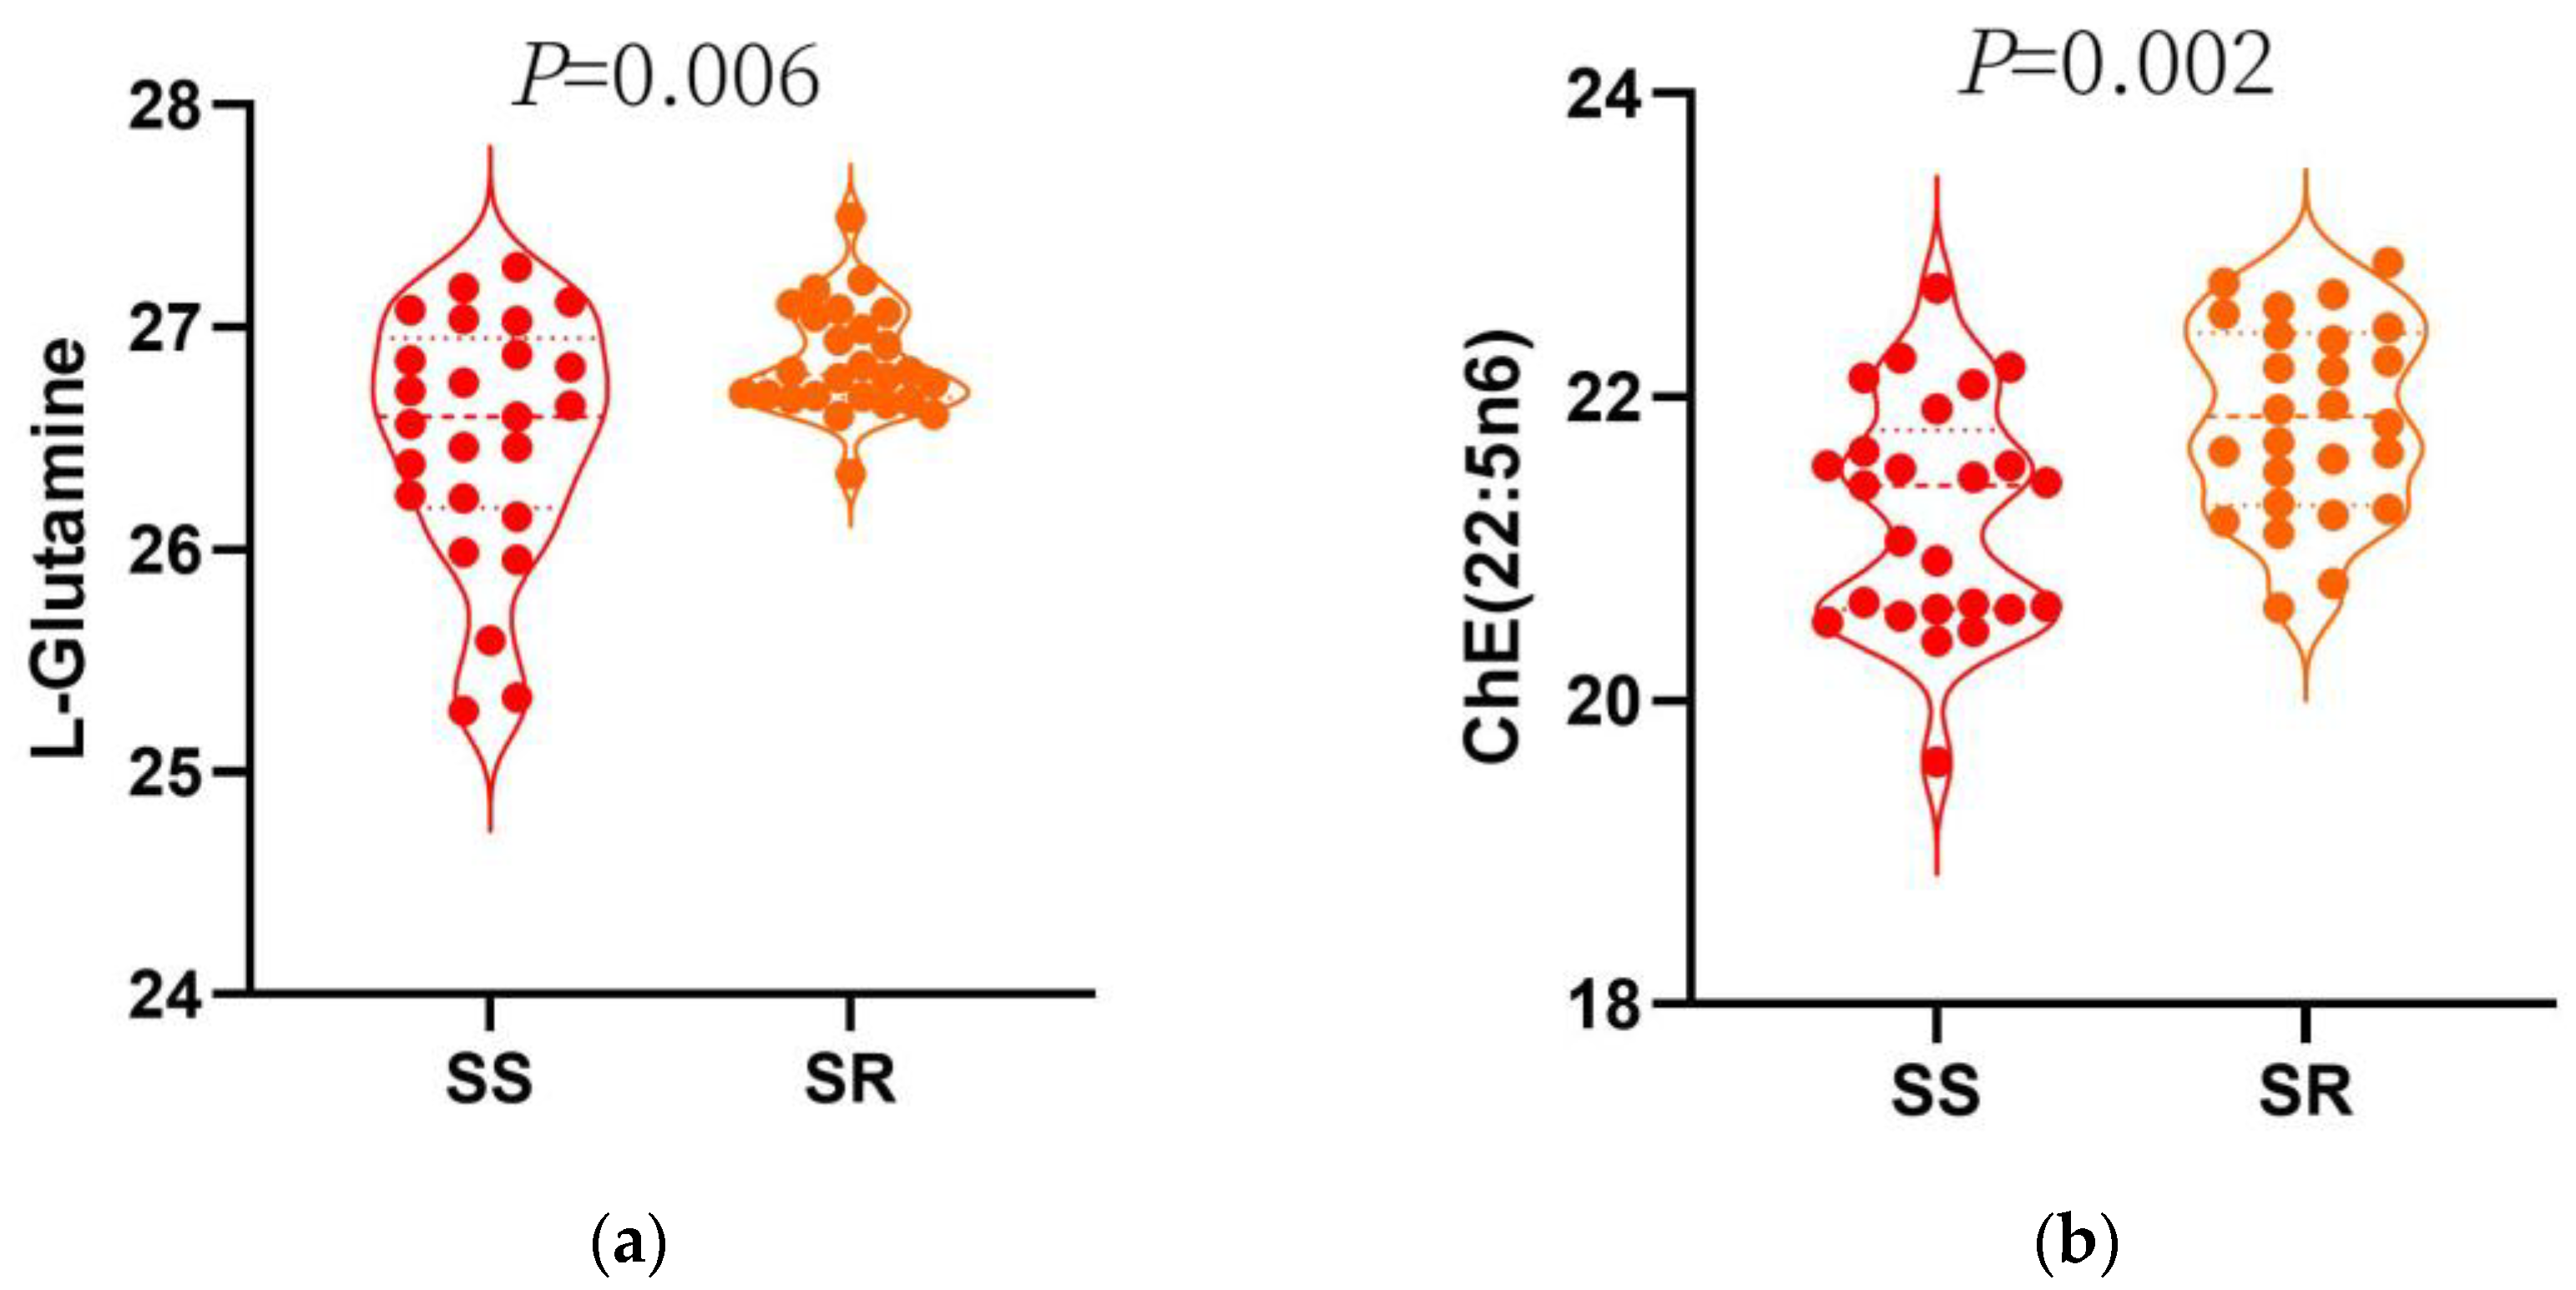
| ChE 22:5n6 | 0.09 | 0.01–0.59 | 0.013 |
| ChE 20:3 | 0.07 | 0.01–0.76 | 0.029 |
| ChE 22:4 | 0.12 | 0.02–0.83 | 0.032 |
| PC 32:1p | 0.05 | 0.00–0.61 | 0.019 |
| PC 16:1/14:0 | 0.43 | 0.19–0.97 | 0.043 |
| PC 38:3e | 0.05 | 0.01–0.48 | 0.009 |
| Sphingosine 1-phosphate | 4.17 | 1.46–1.90 | 0.008 |
| AcCa 20:3 | 0.07 | 0.01–0.44 | 0.005 |
| AcCa 20:2 | 0.20 | 0.04–0.89 | 0.035 |
| AcCa 20:4 | 0.27 | 0.07–0.98 | 0.047 |
| 13S-hydroxyoctadecadienoic acid | 2.74 | 1.23–6.09 | 0.014 |
| Alpha-dimorphcolic acid | 2.27 | 1.14–4.53 | 0.020 |
| L-Glutamine | 0.01 | 0.00–0.21 | 0.003 |
| N (6)-Methyllysine | 0.54 | 0.31–0.95 | 0.031 |
| L-Lactic acid | 0.12 | 0.02–0.63 | 0.012 |
| L-Malic acid | 0.07 | 0.01–0.58 | 0.013 |
| Metabolites | ΔMAP1 | ΔMAP2 | ||||
|---|---|---|---|---|---|---|
| Beta a | SE | p | Beta b | SE | p | |
| TG 54:6 | 5.92 | 1.92 | 0.004 | −4.65 | 1.38 | 0.002 |
| ChE 22:5n6 | −10.94 | 3.90 | 0.008 | 9.68 | 2.73 | 0.001 |
| ChE 20:3 | −12.01 | 5.95 | 0.050 | 9.53 | 4.33 | 0.033 |
| ChE 22:4 | −10.87 | 5.49 | 0.054 | 9.22 | 3.96 | 0.025 |
| PC 32:1p | −14.44 | 6.42 | 0.030 | 10.85 | 4.69 | 0.026 |
| PC 16:1/14:0 | −1.87 | 1.40 | 0.189 | 1.96 | 1.00 | 0.057 |
| PC 38:3e | −11.36 | 5.21 | 0.035 | 9.61 | 3.75 | 0.014 |
| Sphingosine 1-phosphate | 7.27 | 2.40 | 0.004 | −3.26 | 1.88 | 0.089 |
| AcCa 20:3 | −13.94 | 3.91 | 0.001 | 6.81 | 3.10 | 0.034 |
| AcCa 20:2 | −10.72 | 4.46 | 0.021 | 3.88 | 3.44 | 0.265 |
| AcCa 20:4 | −8.19 | 3.43 | 0.022 | 3.57 | 2.62 | 0.182 |
| 13S-hydroxyoctadecadienoic acid | 5.52 | 1.88 | 0.005 | −2.83 | 1.45 | 0.057 |
| Alpha-dimorphcolic acid | 4.75 | 1.81 | 0.012 | −2.56 | 1.38 | 0.070 |
| L-Glutamine | −17.08 | 5.07 | 0.002 | 9.26 | 3.94 | 0.024 |
| N (6)-Methyllysine | −3.85 | 1.60 | 0.021 | 2.30 | 1.20 | 0.063 |
| L-Lactic acid | −9.21 | 3.94 | 0.024 | 4.62 | 2.99 | 0.130 |
| L-Malic acid | −12.27 | 5.13 | 0.021 | 8.42 | 3.79 | 0.032 |
| Metabolite | R2 | C-Statistics |
|---|---|---|
| Model1 a | 0.176 | 0.75 |
| Model1 a + L−Glutamine + ChE 22:5n6 | 0.559 | 0.96 |
| Difference | 0.383 | 0.21 |
| p | <0.001 | <0.001 |
Disclaimer/Publisher’s Note: The statements, opinions and data contained in all publications are solely those of the individual author(s) and contributor(s) and not of MDPI and/or the editor(s). MDPI and/or the editor(s) disclaim responsibility for any injury to people or property resulting from any ideas, methods, instructions or products referred to in the content. |
© 2023 by the authors. Licensee MDPI, Basel, Switzerland. This article is an open access article distributed under the terms and conditions of the Creative Commons Attribution (CC BY) license (https://creativecommons.org/licenses/by/4.0/).
Share and Cite
Zhang, F.; Xie, Y.; Yang, X.; Peng, W.; Qi, H.; Li, B.; Wen, F.; Li, P.; Sun, Y.; Zhang, L. Association of Serum Metabolites and Salt Sensitivity of Blood Pressure in Chinese Population: The EpiSS Study. Nutrients 2023, 15, 690. https://doi.org/10.3390/nu15030690
Zhang F, Xie Y, Yang X, Peng W, Qi H, Li B, Wen F, Li P, Sun Y, Zhang L. Association of Serum Metabolites and Salt Sensitivity of Blood Pressure in Chinese Population: The EpiSS Study. Nutrients. 2023; 15(3):690. https://doi.org/10.3390/nu15030690
Chicago/Turabian StyleZhang, Fengxu, Yunyi Xie, Xiaojun Yang, Wenjuan Peng, Han Qi, Bingxiao Li, Fuyuan Wen, Pandi Li, Yuan Sun, and Ling Zhang. 2023. "Association of Serum Metabolites and Salt Sensitivity of Blood Pressure in Chinese Population: The EpiSS Study" Nutrients 15, no. 3: 690. https://doi.org/10.3390/nu15030690