
Nutritional Biomarkers as Predictors of Dysphonia Severity in Patients with Ischemic Stroke


Abstract
:1. Introduction
2. Methods
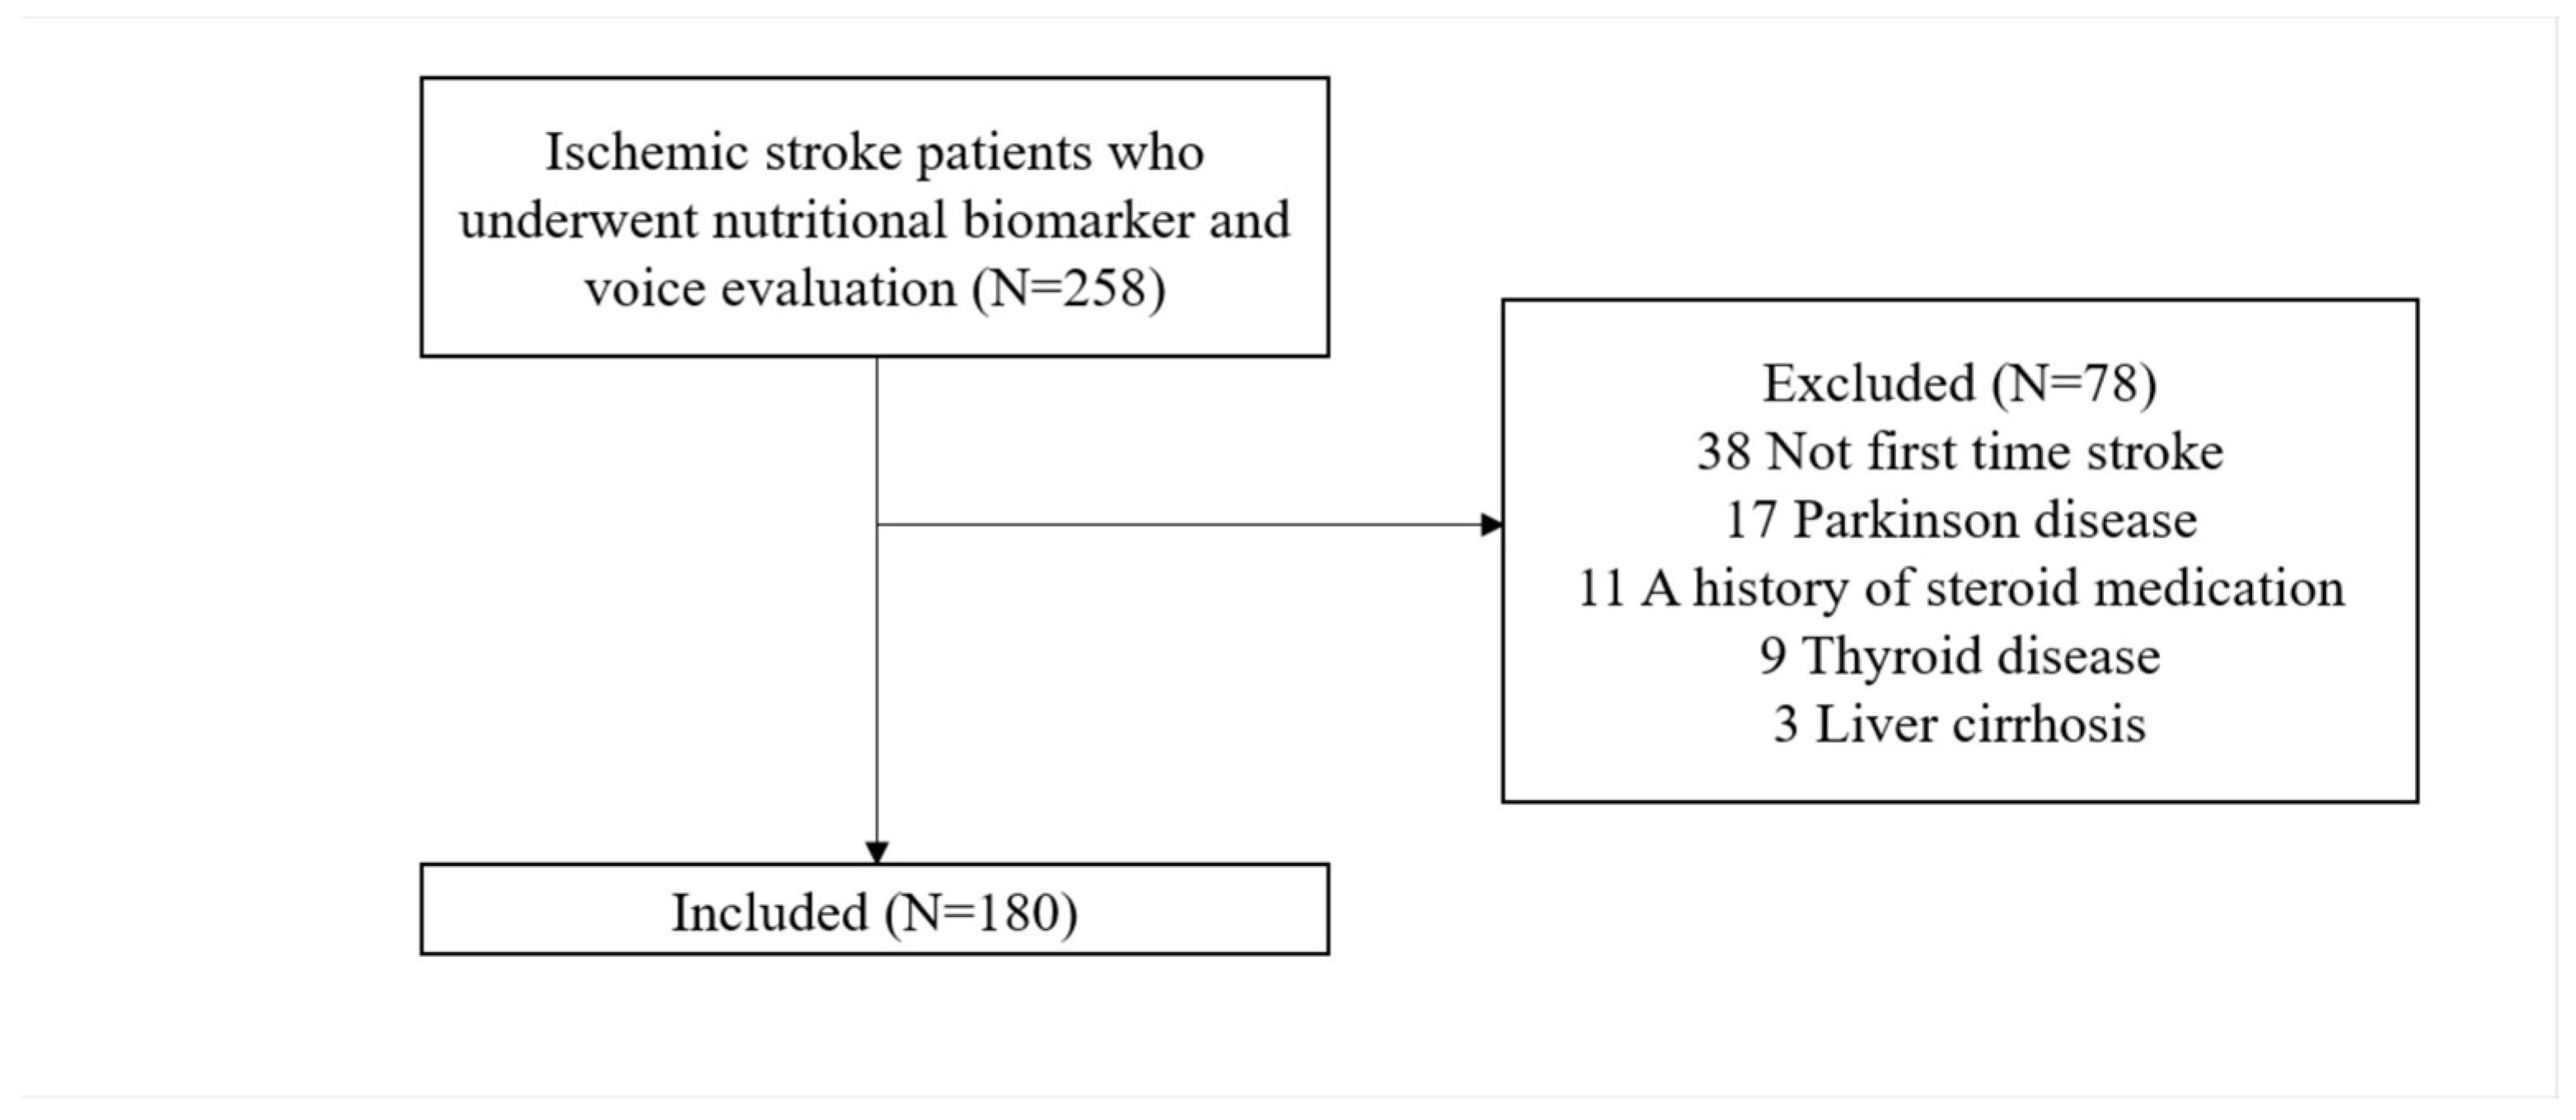
2.1. Participants
2.2. Nutritional Biomarkers
2.3. Maximum Phonation Time
2.4. Dysphonia Severity Index
2.5. Statistical Analysis
3. Results
3.1. Demographic Characteristics of the Study Participants
3.2. Comparison of Characteristics between Low Transferrin Group and Normal Value Group
3.3. Comparison of Characteristics between the Low Albumin Group and the Normal Value Group
3.4. Comparison of Characteristics between the Low Prealbumin Group and the Normal Value Group
3.5. Association of Serum Transferrin, Albumin, and Prealbumin Level with DSI and MPT
4. Discussion
5. Conclusions
Author Contributions
Funding
Institutional Review Board Statement
Informed Consent Statement
Data Availability Statement
Acknowledgments
Conflicts of Interest
References
- Feigin, V.L.; Brainin, M.; Norrving, B.; Martins, S.; Sacco, R.L.; Hacke, W.; Fisher, M.; Pandian, J.; Lindsay, P. World stroke organization (wso): Global stroke fact sheet 2022. Int. J. Stroke 2022, 17, 18–29. [Google Scholar] [CrossRef]
- Tulics, M.G.; Vicsi, K. The automatic assessment of the severity of dysphonia. Int. J. Speech Technol. 2019, 22, 341–350. [Google Scholar] [CrossRef] [Green Version]
- Venketasubramanian, N.; Seshadri, R.; Chee, N. Vocal cord paresis in acute ischemic stroke. Cerebrovasc. Dis. 1999, 9, 157–162. [Google Scholar] [CrossRef]
- Naunheim, M.R.; Goldberg, L.; Dai, J.B.; Rubinstein, B.J.; Courey, M.S. Measuring the impact of dysphonia on quality of life using health state preferences. Laryngoscope 2020, 130, E177–E182. [Google Scholar] [CrossRef] [PubMed]
- Evitts, P.M.; Starmer, H.; Teets, K.; Montgomery, C.; Calhoun, L.; Schulze, A.; MacKenzie, J.; Adams, L. The impact of dysphonic voices on healthy listeners: Listener reaction times, speech intelligibility, and listener comprehension. Am. J. Speech Lang. Pathol. 2016, 25, 561–575. [Google Scholar] [CrossRef] [PubMed]
- Park, E.J.; Kim, J.H.; Choi, Y.H.; Son, J.E.; Lee, S.A.; Yoo, S.D. Association between phonation and the vowel quadrilateral in patients with stroke: A retrospective observational study. Medicine 2020, 99, e22236. [Google Scholar] [CrossRef] [PubMed]
- Dos Santos, K.W.; da Cunha Rodrigues, E.; Rech, R.S.; da Ros Wendland, E.M.; Neves, M.; Hugo, F.N.; Hilgert, J.B. Using voice change as an indicator of dysphagia: A systematic review. Dysphagia 2022, 37, 736–748. [Google Scholar] [CrossRef]
- Weinreb, S.F.; Piersiala, K.; Hillel, A.T.; Akst, L.M.; Best, S.R. Dysphonia and dysphagia as early manifestations of autoimmune inflammatory myopathy. Am. J. Otolaryngol. 2021, 42, 102747. [Google Scholar] [CrossRef]
- Feng, M.C.; Lin, Y.C.; Chang, Y.H.; Chen, C.H.; Chiang, H.C.; Huang, L.C.; Yang, Y.H.; Hung, C.H. The mortality and the risk of aspiration pneumonia related with dysphagia in stroke patients. J. Stroke Cerebrovasc. Dis. 2019, 28, 1381–1387. [Google Scholar] [CrossRef]
- Banda, K.J.; Chu, H.; Kang, X.L.; Liu, D.; Pien, L.C.; Jen, H.J.; Hsiao, S.S.; Chou, K.R. Prevalence of dysphagia and risk of pneumonia and mortality in acute stroke patients: A meta-analysis. BMC Geriatr. 2022, 22, 420. [Google Scholar] [CrossRef] [PubMed]
- Al-Yahya, S.N.; Mohamed Akram, M.H.H.; Vijaya Kumar, K.; Mat Amin, S.N.A.; Abdul Malik, N.A.; Mohd Zawawi, N.A.; Nik Mahmood, N.R.K.; Mustafa, N.; Azman, M.; Mat Baki, M. Maximum phonation time normative values among malaysians and its relation to body mass index. J. Voice 2022, 36, 457–463. [Google Scholar] [CrossRef]
- Sawaya, Y.; Sato, M.; Ishizaka, M.; Shiba, T.; Kubo, A.; Urano, T. Maximum phonation time is a useful assessment for older adults requiring long-term care/support. Phys. Ther. Res. 2022, 25, 35–40. [Google Scholar] [CrossRef]
- Wuyts, F.L.; De Bodt, M.S.; Molenberghs, G.; Remacle, M.; Heylen, L.; Millet, B.; Van Lierde, K.; Raes, J.; Van de Heyning, P.H. The dysphonia severity index: An objective measure of vocal quality based on a multiparameter approach. J. Speech Lang. Hear Res. 2000, 43, 796–809. [Google Scholar] [CrossRef] [PubMed]
- Naufel de Felippe, A.C.; Grillo, M.H.; Grechi, T.H. Standardization of acoustic measures for normal voice patterns. Braz. J. Otorhinolaryngol. 2006, 72, 659–664. [Google Scholar] [CrossRef] [PubMed] [Green Version]
- Teixeira, J.P.; Oliveira, C.; Lopes, C. Vocal acoustic analysis—Jitter, shimmer and hnr parameters. Procedia Technol. 2013, 9, 1112–1122. [Google Scholar] [CrossRef] [Green Version]
- Wertzner, H.F.; Schreiber, S.; Amaro, L. Analysis of fundamental frequency, jitter, shimmer and vocal intensity in children with phonological disorders. Braz. J. Otorhinolaryngol. 2005, 71, 582–588. [Google Scholar] [CrossRef] [Green Version]
- Zhang, Z. Mechanics of human voice production and control. J. Acoust. Soc. Am. 2016, 140, 2614–2635. [Google Scholar] [CrossRef] [PubMed] [Green Version]
- Titze, I.R. Regulation of laryngeal resistance and maximum power transfer with semi-occluded airway vocalization. J. Acoust. Soc. Am. 2021, 149, 4106–4118. [Google Scholar] [CrossRef]
- Foley, N.C.; Salter, K.L.; Robertson, J.; Teasell, R.W.; Woodbury, M.G. Which reported estimate of the prevalence of malnutrition after stroke is valid? Stroke 2009, 40, e66–e74. [Google Scholar] [CrossRef] [Green Version]
- Gomes, F.; Emery, P.W.; Weekes, C.E. Risk of malnutrition is an independent predictor of mortality, length of hospital stay, and hospitalization costs in stroke patients. J. Stroke Cerebrovasc. Dis. 2016, 25, 799–806. [Google Scholar] [CrossRef] [Green Version]
- Huppertz, V.; Guida, S.; Holdoway, A.; Strilciuc, S.; Baijens, L.; Schols, J.; van Helvoort, A.; Lansink, M.; Muresanu, D.F. Impaired nutritional condition after stroke from the hyperacute to the chronic phase: A systematic review and meta-analysis. Front. Neurol. 2021, 12, 780080. [Google Scholar] [CrossRef] [PubMed]
- Keller, U. Nutritional laboratory markers in malnutrition. J. Clin. Med. 2019, 8, 775. [Google Scholar] [CrossRef] [Green Version]
- Cabrerizo, S.; Cuadras, D.; Gomez-Busto, F.; Artaza-Artabe, I.; Marín-Ciancas, F.; Malafarina, V. Serum albumin and health in older people: Review and meta analysis. Maturitas 2015, 81, 17–27. [Google Scholar] [CrossRef]
- Ohwada, H.; Nakayama, T.; Kanaya, Y.; Tanaka, Y. Serum albumin levels and their correlates among individuals with motor disorders at five institutions in japan. Nutr. Res. Pract. 2017, 11, 57–63. [Google Scholar] [CrossRef] [PubMed] [Green Version]
- Takeda, H.; Ishihama, K.; Fukui, T.; Fujishima, S.; Orii, T.; Nakazawa, Y.; Shu, H.J.; Kawata, S. Significance of rapid turnover proteins in protein-losing gastroenteropathy. Hepatogastroenterology 2003, 50, 1963–1965. [Google Scholar]
- Zinellu, A.; Mangoni, A.A. Serum prealbumin concentrations, covid-19 severity, and mortality: A systematic review and meta-analysis. Front. Med. 2021, 8, 638529. [Google Scholar] [CrossRef]
- Dellière, S.; Cynober, L. Is transthyretin a good marker of nutritional status? Clin. Nutr. 2017, 36, 364–370. [Google Scholar] [CrossRef]
- Jennifer, B.; Berg, V.; Modak, M.; Puck, A.; Seyerl-Jiresch, M.; Künig, S.; Zlabinger, G.J.; Steinberger, P.; Chou, J.; Geha, R.S.; et al. Transferrin receptor 1 is a cellular receptor for human heme-albumin. Commun. Biol. 2020, 3, 621. [Google Scholar] [CrossRef]
- Ambrosius, W.; Michalak, S.; Kazmierski, R.; Andrzejewska, N.; Kozubski, W. Predictive value of serum transthyretin for outcome in acute ischemic stroke. PLoS ONE 2017, 12, e0179806. [Google Scholar] [CrossRef] [PubMed] [Green Version]
- Bharadwaj, S.; Ginoya, S.; Tandon, P.; Gohel, T.D.; Guirguis, J.; Vallabh, H.; Jevenn, A.; Hanouneh, I. Malnutrition: Laboratory markers vs nutritional assessment. Gastroenterol. Rep. 2016, 4, 272–280. [Google Scholar] [CrossRef] [Green Version]
- Fletcher, J.P.; Little, J.M.; Guest, P.K. A comparison of serum transferrin and serum prealbumin as nutritional parameters. JPEN J. Parenter Enteral. Nutr. 1987, 11, 144–147. [Google Scholar] [CrossRef] [PubMed]
- Briassoulis, G.; Zavras, N.; Hatzis, T. Malnutrition, nutritional indices, and early enteral feeding in critically ill children. Nutrition 2001, 17, 548–557. [Google Scholar] [CrossRef]
- Mor, N.; Simonyan, K.; Blitzer, A. Central voice production and pathophysiology of spasmodic dysphonia. Laryngoscope 2018, 128, 177–183. [Google Scholar] [CrossRef]
- Sawalha, K.; Abd Elazim, A.; Hussein, O. Ipsilateral vocal cord paralysis after acute anterior ischemic stroke. Perm. J. 2020, 25, 1. [Google Scholar] [CrossRef] [PubMed]
- Lengelé, L.; Bruyère, O.; Beaudart, C.; Reginster, J.Y.; Locquet, M. Impact of malnutrition status on muscle parameter changes over a 5-year follow-up of community-dwelling older adults from the sarcophage cohort. Nutrients 2021, 13, 407. [Google Scholar] [CrossRef]
- Pierik, V.D.; Meskers, C.G.M.; Van Ancum, J.M.; Numans, S.T.; Verlaan, S.; Scheerman, K.; Kruizinga, R.C.; Maier, A.B. High risk of malnutrition is associated with low muscle mass in older hospitalized patients—A prospective cohort study. BMC Geriatr. 2017, 17, 118. [Google Scholar] [CrossRef] [Green Version]
- Sartori, R.; Romanello, V.; Sandri, M. Mechanisms of muscle atrophy and hypertrophy: Implications in health and disease. Nat. Commun. 2021, 12, 330. [Google Scholar] [CrossRef]
- Pourhassan, M.; Rommersbach, N.; Lueg, G.; Klimek, C.; Schnatmann, M.; Liermann, D.; Janssen, G.; Wirth, R. The impact of malnutrition on acute muscle wasting in frail older hospitalized patients. Nutrients 2020, 12, 1387. [Google Scholar] [CrossRef] [PubMed]
- Jain, R.; Coss, C.; Whooley, P.; Phelps, M.; Owen, D.H. The role of malnutrition and muscle wasting in advanced lung cancer. Curr. Oncol. Rep. 2020, 22, 54. [Google Scholar] [CrossRef]
- Miyashita, T.; Kikutani, T.; Nagashima, K.; Igarashi, K.; Tamura, F. The effects of sarcopenic dysphagia on the dynamics of swallowing organs observed on videofluoroscopic swallowing studies. J. Oral Rehabil. 2020, 47, 584–590. [Google Scholar] [CrossRef] [Green Version]
- Wakabayashi, H.; Kishima, M.; Itoda, M.; Fujishima, I.; Kunieda, K.; Ohno, T.; Shigematsu, T.; Oshima, F.; Mori, T.; Ogawa, N.; et al. Prevalence of hoarseness and its association with severity of dysphagia in patients with sarcopenic dysphagia. J. Nutr. Health Aging 2022, 26, 266–271. [Google Scholar] [CrossRef] [PubMed]
- Ogawa, N.; Mori, T.; Fujishima, I.; Wakabayashi, H.; Itoda, M.; Kunieda, K.; Shigematsu, T.; Nishioka, S.; Tohara, H.; Yamada, M.; et al. Ultrasonography to measure swallowing muscle mass and quality in older patients with sarcopenic dysphagia. J. Am. Med. Dir. Assoc. 2018, 19, 516–522. [Google Scholar] [CrossRef] [PubMed]
- Morisawa, T.; Kunieda, Y.; Koyama, S.; Suzuki, M.; Takahashi, Y.; Takakura, T.; Kikuchi, Y.; Matsuda, T.; Fujino, Y.; Sawa, R.; et al. The relationship between sarcopenia and respiratory muscle weakness in community-dwelling older adults. Int. J. Environ. Res. Public Health 2021, 18, 13257. [Google Scholar] [CrossRef] [PubMed]
- Bhimani, R.; Bhimani, F.; Singh, P. Relation between level of serum transferrin and postoperative wound drainage in closed long bone fractures. Adv. Med. 2018, 2018, 8612828. [Google Scholar] [CrossRef] [Green Version]
- Yuwen, P.; Chen, W.; Lv, H.; Feng, C.; Li, Y.; Zhang, T.; Hu, P.; Guo, J.; Tian, Y.; Liu, L.; et al. Albumin and surgical site infection risk in orthopaedics: A meta-analysis. BMC Surg. 2017, 17, 7. [Google Scholar] [CrossRef] [Green Version]
- Wang, W.; Pan, Y.; Tang, X.; Hao, G.; Xie, Y.; Ma, S.; Luo, J.; Guo, D.; Ding, F. Serum prealbumin and its changes over time are associated with mortality in acute kidney injury. Sci. Rep. 2017, 7, 41493. [Google Scholar] [CrossRef] [Green Version]
- Maryn, Y.; Morsomme, D.; De Bodt, M. Measuring the dysphonia severity index (dsi) in the program praat. J. Voice 2017, 31, 644.e29–644.e40. [Google Scholar] [CrossRef]
- Sobol, M.; Sielska-Badurek, E.M. The dysphonia severity index (dsi)-normative values. Systematic review and meta-analysis. J. Voice 2022, 36, 143.e9–143.e13. [Google Scholar] [CrossRef]
- Caccialanza, R.; Palladini, G.; Klersy, C.; Cereda, E.; Bonardi, C.; Quarleri, L.; Vadacca, G.; Albertini, R.; Merlini, G. Serum prealbumin: An independent marker of short-term energy intake in the presence of multiple-organ disease involvement. Nutrition 2013, 29, 580–582. [Google Scholar] [CrossRef]
- Collins, N. The difference between albumin and prealbumin. Adv. Skin Wound Care 2001, 14, 235–236. [Google Scholar] [CrossRef]
- Ko, K.R.; Park, H.J.; Hyun, J.K.; Seo, I.H.; Kim, T.U. Effect of laryngopharyngeal neuromuscular electrical stimulation on dysphonia accompanied by dysphagia in post-stroke and traumatic brain injury patients: A pilot study. Ann. Rehabil. Med. 2016, 40, 600–610. [Google Scholar] [CrossRef] [PubMed]
- Kent, R.D.; Vorperian, H.K.; Kent, J.F.; Duffy, J.R. Voice dysfunction in dysarthria: Application of the multi-dimensional voice program. J. Commun. Disord. 2003, 36, 281–306. [Google Scholar] [CrossRef]
- El Sharkawi, A.; Ramig, L.; Logemann, J.A.; Pauloski, B.R.; Rademaker, A.W.; Smith, C.H.; Pawlas, A.; Baum, S.; Werner, C. Swallowing and voice effects of lee silverman voice treatment (lsvt): A pilot study. J. Neurol. Neurosurg. Psychiatry 2002, 72, 31–36. [Google Scholar] [CrossRef]
- Fowler, L.P.; Gorham-Rowan, M.; Hapner, E.R. An exploratory study of voice change associated with healthy speakers after transcutaneous electrical stimulation to laryngeal muscles. J. Voice 2011, 25, 54–61. [Google Scholar] [CrossRef]
- Kim, C.M.; Dewan, K. Vocal fold paralysis and dysphagia. Curr. Otorhinolaryngol. Rep. 2021, 9, 101–106. [Google Scholar] [CrossRef]
- Burnett, T.A.; Mann, E.A.; Cornell, S.A.; Ludlow, C.L. Laryngeal elevation achieved by neuromuscular stimulation at rest. J. Appl. Physiol. 2003, 94, 128–134. [Google Scholar] [CrossRef] [PubMed]
- Levitt, D.G.; Levitt, M.D. Human serum albumin homeostasis: A new look at the roles of synthesis, catabolism, renal and gastrointestinal excretion, and the clinical value of serum albumin measurements. Int. J. Gen. Med. 2016, 9, 229–255. [Google Scholar] [CrossRef] [Green Version]
- Shetty, P.S.; Watrasiewicz, K.E.; Jung, R.T.; James, W.P. Rapid-turnover transport proteins: An index of subclinical protein-energy malnutrition. Lancet 1979, 2, 230–232. [Google Scholar] [CrossRef]
- Li, Y.; Cheng, J.X.; Yang, H.H.; Chen, L.P.; Liu, F.J.; Wu, Y.; Fan, M.; Wu, H.T. Transferrin receptor 1 plays an important role in muscle development and denervation-induced muscular atrophy. Neural Regen. Res. 2021, 16, 1308–1316. [Google Scholar]
- Schalk, B.W.; Deeg, D.J.; Penninx, B.W.; Bouter, L.M.; Visser, M. Serum albumin and muscle strength: A longitudinal study in older men and women. J. Am. Geriatr. Soc. 2005, 53, 1331–1338. [Google Scholar] [CrossRef] [Green Version]
- van Atteveld, V.A.; Van Ancum, J.M.; Reijnierse, E.M.; Trappenburg, M.C.; Meskers, C.G.M.; Maier, A.B. Erythrocyte sedimentation rate and albumin as markers of inflammation are associated with measures of sarcopenia: A cross-sectional study. BMC Geriatr. 2019, 19, 233. [Google Scholar] [CrossRef] [Green Version]
- Kim, H.; Suzuki, T.; Kim, M.; Kojima, N.; Yoshida, Y.; Hirano, H.; Saito, K.; Iwasa, H.; Shimada, H.; Hosoi, E.; et al. Incidence and predictors of sarcopenia onset in community-dwelling elderly japanese women: 4-year follow-up study. J. Am. Med. Dir. Assoc. 2015, 16, 85.e1–85.e8. [Google Scholar] [CrossRef] [PubMed]
- Chen, K.C.; Lee, T.M.; Wu, W.T.; Wang, T.G.; Han, D.S.; Chang, K.V. Assessment of tongue strength in sarcopenia and sarcopenic dysphagia: A systematic review and meta-analysis. Front. Nutr. 2021, 8, 684840. [Google Scholar] [CrossRef] [PubMed]
- Nagano, A.; Wakabayashi, H.; Maeda, K.; Kokura, Y.; Miyazaki, S.; Mori, T.; Fujiwara, D. Respiratory sarcopenia and sarcopenic respiratory disability: Concepts, diagnosis, and treatment. J. Nutr. Health Aging 2021, 25, 507–515. [Google Scholar] [CrossRef] [PubMed]
- Byeon, H.; Cha, S. Evaluating the effects of smoking on the voice and subjective voice problems using a meta-analysis approach. Sci. Rep. 2020, 10, 4720. [Google Scholar] [CrossRef] [Green Version]


| Characteristic | Value |
|---|---|
| Sociodemographic characteristics | |
| Age (years) | 61.46 ± 14.31 |
| Male | 86 (47.80) |
| Female | 94 (52.20) |
| Lifestyle characteristics | |
| BMI (kg/m2) | 22.41 ± 2.60 |
| Smoking | 61 (33.90) |
| Regular alcohol use | 49 (27.20) |
| Brain lesion location | |
| Brain stem | 103 (57.20) |
| Non-brain stem | 77 (42.80) |
| Right hemisphere | 73 (40.60) |
| Left hemisphere | 107 (59.40) |
| Comorbidities | |
| Hypertension | 102 (56.70) |
| Arrhythmia | 70 (38.90) |
| Diabetes mellitus | 77 (42.80) |
| Dyslipidemia | 145 (80.60) |
| Heart failure | 42 (23.30) |
| Coronary artery disease | 27 (15.00) |
| MMSE | 22.29 ± 3.11 |
| MBI | 40.04 ± 18.02 |
| Nutritional biomarkers | |
| Albumin (g/dL) | 2.97 ± 0.58 |
| Prealbumin (mg/dL) | 19.59 ± 3.77 |
| Transferrin (mg/dL) | 238.66 ± 99.66 |
| DSI | −0.85 ± 2.20 |
| MPT (s) | 11.58 ± 4.12 |
| Low Transferrin Group (n=75) | Normal Value Group (n = 105) | p-Value | |
|---|---|---|---|
| Age (years) | 61.59 ± 13.93 | 61.37 ± 14.64 | 0.921 |
| Sex | 0.960 | ||
| Male | 36 (48.00) | 50 (47.60) | |
| Female | 39 (52.00) | 55 (52.40) | |
| BMI (kg/m2) | 22.43 ± 2.66 | 22.39 ± 2.57 | 0.924 |
| Smoking | 24 (32.00) | 37 (35.20) | 0.651 |
| Regular alcohol use | 17 (22.70) | 32 (30.50) | 0.246 |
| Brain lesion location | |||
| Brain stem | 46 (61.30) | 57 (54.30) | 0.346 |
| Non-brain stem | 29 (38.70) | 48 (45.70) | |
| Right hemisphere | 31 (41.30) | 42 (40.00) | 0.857 |
| Left hemisphere | 44 (58.70) | 63 (60.00) | |
| MMSE | 22.29 ± 3.20 | 22.29 ± 3.06 | 0.987 |
| MBI | 39.80 ± 17.32 | 40.22 ± 18.58 | 0.878 |
| DSI | −1.66 ± 1.77 | −0.27 ± 2.30 | 0.002 * |
| MPT (s) | 9.95 ± 4.21 | 12.75 ± 3.65 | 0.043 * |
| Low Albumin Group (n = 131) | Normal Value Group (n = 49) | p-Value | |
|---|---|---|---|
| Age (years) | 61.58 ± 14.24 | 61.14 ± 14.63 | 0.856 |
| Sex | 0.843 | ||
| Male | 62 (47.30) | 24 (49.00) | |
| Female | 69 (52.70) | 25 (51.00) | |
| BMI (kg/m2) | 22.29 ± 2.56 | 22.74 ± 2.70 | 0.302 |
| Smoking | 50 (38.20) | 11 (22.40) | 0.047 * |
| Regular alcohol use | 34 (26.00) | 15 (30.60) | 0.532 |
| Brain lesion location | |||
| Brain stem | 76 (58.00) | 27 (55.10) | 0.725 |
| Non-brain stem | 55 (42.00) | 22 (44.90) | |
| Right hemisphere | 55 (42.00) | 18 (36.70) | 0.523 |
| Left hemisphere | 76 (58.00) | 31 (63.30) | |
| MMSE | 22.24 ± 3.16 | 22.43 ± 2.97 | 0.714 |
| MBI | 39.89 ± 17.99 | 40.45 ± 18.28 | 0.854 |
| DSI | −1.51 ± 0.93 | 1.81 ± 2.17 | 0.013 * |
| MPT (s) | 10.88 ± 3.55 | 13.44 ± 4.93 | 0.017 * |
| Low Prealbumin Group (n = 96) | Normal Value Group (n = 84) | p-Value | |
|---|---|---|---|
| Age (years) | 61.80 ± 13.62 | 61.07 ± 15.13 | 0.734 |
| Sex | 0.391 | ||
| Male | 43 (44.80) | 43 (51.20) | |
| Female | 53 (55.20) | 41 (48.80) | |
| BMI (kg/m2) | 22.35 ± 2.55 | 22.47 ± 2.68 | 0.756 |
| Smoking | 27 (28.10) | 34 (40.50) | 0.081 |
| Regular alcohol use | 24 (25.00) | 25 (29.80) | 0.474 |
| Brain lesion location | |||
| Brain stem | 60 (62.50) | 43 (51.20) | 0.126 |
| Non-brain stem | 36 (37.50) | 41 (48.80) | |
| Right hemisphere | 40 (41.70) | 33 (39.30) | 0.746 |
| Left hemisphere | 56 (58.30) | 51 (60.70) | |
| MMSE | 22.18 ± 3.21 | 22.42 ± 3.00 | 0.608 |
| MBI | 38.81 ± 17.82 | 41.45 ± 18.24 | 0.328 |
| DSI | −1.61 ± 1.57 | 0.02 ± 2.49 | <0.001 ** |
| MPT (s) | 10.17 ± 3.75 | 13.20 ± 3.95 | 0.004 * |
| Albumin | Prealbumin | Transferrin | |
|---|---|---|---|
| DSI | r = 0.396 | r = 0.389 | r = 0.416 |
| p = 0.04 * | p < 0.001 ** | p = 0.002 * | |
| MPT | r = 0.386 | r = 0.389 | r = 0.387 |
| p = 0.03 * | p < 0.001 ** | p = 0.008 * |
| Dependent Variable | Independent Variable | Standardized β | B | 95% CI | p-Value | Adjusted R2 |
|---|---|---|---|---|---|---|
| DSI | Constant | 35.639 | 0.335 | |||
| Transferrin | 6.677 | 0.148 | (0.106, 0.189) | <0.001 ** | ||
| Prealbumin | 6.274 | 3.663 | (2.563, 4.762) | 0.002* | ||
| MPT | Constant | 3.267 | 0.147 | |||
| Prealbumin | 0.389 | 0.425 | (0.276, 0.573) | <0.001 ** |
Disclaimer/Publisher’s Note: The statements, opinions and data contained in all publications are solely those of the individual author(s) and contributor(s) and not of MDPI and/or the editor(s). MDPI and/or the editor(s) disclaim responsibility for any injury to people or property resulting from any ideas, methods, instructions or products referred to in the content. |
© 2023 by the authors. Licensee MDPI, Basel, Switzerland. This article is an open access article distributed under the terms and conditions of the Creative Commons Attribution (CC BY) license (https://creativecommons.org/licenses/by/4.0/).
Share and Cite
Kim, J.M.; Yoo, S.D.; Park, E.J. Nutritional Biomarkers as Predictors of Dysphonia Severity in Patients with Ischemic Stroke. Nutrients 2023, 15, 652. https://doi.org/10.3390/nu15030652
Kim JM, Yoo SD, Park EJ. Nutritional Biomarkers as Predictors of Dysphonia Severity in Patients with Ischemic Stroke. Nutrients. 2023; 15(3):652. https://doi.org/10.3390/nu15030652
Chicago/Turabian StyleKim, Ji Min, Seung Don Yoo, and Eo Jin Park. 2023. "Nutritional Biomarkers as Predictors of Dysphonia Severity in Patients with Ischemic Stroke" Nutrients 15, no. 3: 652. https://doi.org/10.3390/nu15030652