

Dietary Factors and Endometrial Cancer Risk: A Mendelian Randomization Study

Abstract
:1. Introduction
2. Materials and Methods
2.1. Endometrial Cancer Data
2.2. Relative Intake of Macronutrients (Dietary Composition) Data
2.3. Micronutrients Data
2.4. Mendelian Randomization Analysis
3. Results
4. Discussion
Supplementary Materials
Author Contributions
Funding
Institutional Review Board Statement
Informed Consent Statement
Data Availability Statement
Acknowledgments
Conflicts of Interest
References
- Sung, H.; Ferlay, J.; Siegel, R.L.; Laversanne, M.; Soerjomataram, I.; Jemal, A.; Bray, F. Global Cancer Statistics 2020: GLOBOCAN Estimates of Incidence and Mortality Worldwide for 36 Cancers in 185 Countries. CA Cancer J. Clin. 2021, 71, 209–249. [Google Scholar] [CrossRef]
- Gaber, C.; Meza, R.; Ruterbusch, J.J.; Cote, M.L. Endometrial Cancer Trends by Race and Histology in the USA: Projecting the Number of New Cases from 2015 to 2040. J. Racial Ethn. Health Disparit. 2017, 4, 895–903. [Google Scholar] [CrossRef]
- Crosbie, E.J.; Kitson, S.J.; McAlpine, J.N.; Mukhopadhyay, A.; Powell, M.E.; Singh, N. Endometrial cancer. Lancet 2022, 399, 1412–1428. [Google Scholar] [CrossRef]
- Painter, J.N.; O’Mara, T.A.; Marquart, L.; Webb, P.M.; Attia, J.; Medland, S.E.; Cheng, T.; Dennis, J.; Holliday, E.G.; McEvoy, M.; et al. Genetic Risk Score Mendelian Randomization Shows that Obesity Measured as Body Mass Index, but not Waist:Hip Ratio, Is Causal for Endometrial Cancer. Cancer Epidemiol. Biomark. Prev. 2016, 25, 1503–1510. [Google Scholar] [CrossRef] [Green Version]
- Kaaks, R.; Lukanova, A.; Kurzer, M.S. Obesity, endogenous hormones, and endometrial cancer risk: A synthetic review. Cancer Epidemiology Biomarkers Prev. 2002, 11, 1531–1543. [Google Scholar]
- Biel, R.K.; Csizmadi, I.; Cook, L.S.; Courneya, K.S.; Magliocco, A.M.; Friedenreich, C.M. Risk of endometrial cancer in relation to individual nutrients from diet and supplements. Public Health Nutr. 2011, 14, 1948–1960. [Google Scholar] [CrossRef] [Green Version]
- O’Connor, L.J.; Price, A.L. Distinguishing genetic correlation from causation across 52 diseases and complex traits. Nat. Genet. 2018, 50, 1728–1734. [Google Scholar] [CrossRef]
- Schatzkin, A.; Kipnis, V. Could Exposure Assessment Problems Give Us Wrong Answers to Nutrition and Cancer Questions? J. Natl. Cancer Inst. 2004, 96, 1564–1565. [Google Scholar] [CrossRef] [Green Version]
- Lawlor, D.A.; Harbord, R.M.; Sterne, J.A.C.; Timpson, N.; Smith, G.D. Mendelian randomization: Using genes as instruments for making causal inferences in epidemiology. Stat. Med. 2008, 27, 1133–1163. [Google Scholar] [CrossRef]
- Smith, G.D.; Ebrahim, S. “Mendelian randomization”: Can genetic epidemiology contribute to understanding environmental determinants of disease? Int. J. Epidemiol. 2003, 32, 1–22. [Google Scholar] [CrossRef] [Green Version]
- Xu, W.; Dai, Q.; Xiang, Y.-B.; Zhao, G.-M.; Ruan, Z.-X.; Cheng, J.-R.; Zheng, W.; Shu, X.O. Nutritional factors in relation to endometrial cancer: A report from a population-based case-control study in Shanghai, China. Int. J. Cancer 2007, 120, 1776–1781. [Google Scholar] [CrossRef] [Green Version]
- O’Mara, T.A.; Glubb, D.M.; Amant, F.; Annibali, D.; Ashton, K.; Attia, J.; Auer, P.L.; Beckmann, M.W.; Black, A.; Bolla, M.K.; et al. Identification of nine new susceptibility loci for endometrial cancer. Nat. Commun. 2018, 9, 3166. [Google Scholar] [CrossRef] [Green Version]
- Kho, P.F.; Mortlock, S.; Endometrial Cancer Association, C.; International Endometriosis Genetics, C.; Rogers, P.A.W.; Nyholt, D.R.; Montgomery, G.W.; Spurdle, A.B.; Glubb, D.M.; O’Mara, T.A. Genetic analyses of gynecological disease identify genetic relationships between uterine fibroids and endometrial cancer, and a novel endometrial cancer genetic risk region at the WNT4 1p36.12 locus. Hum. Genet. 2021, 140, 1353–1365. [Google Scholar] [CrossRef]
- Cheng, T.H.T.; Thompson, D.J.; O’Mara, T.; Painter, J.N.; Glubb, D.M.; Flach, S.; Lewis, A.; French, J.D.; Freeman-Mills, L. Five endometrial cancer risk loci identified through genome-wide association analysis. Nat. Genet. 2016, 48, 667–674. [Google Scholar] [CrossRef]
- Meddens, S.F.W.; de Vlaming, R.; Bowers, P.; Burik, C.A.P.; Linnér, R.K.; Lee, C.; Okbay, A.; Turley, P.; Rietveld, C.A.; Fontana, M.A.; et al. Genomic analysis of diet composition finds novel loci and associations with health and lifestyle. Mol. Psychiatry 2021, 26, 2056–2069. [Google Scholar] [CrossRef]
- Mondul, A.M.; Yu, K.; Wheeler, W.; Zhang, H.; Weinstein, S.J.; Major, J.M.; Cornelis, M.C.; Männistö, S.; Hazra, A.; Hsing, A.W.; et al. Genome-wide association study of circulating retinol levels. Hum. Mol. Genet. 2011, 20, 4724–4731. [Google Scholar] [CrossRef] [Green Version]
- Grarup, N.; Sulem, P.; Sandholt, C.H.; Thorleifsson, G.; Ahluwalia, T.S.; Steinthorsdottir, V.; Bjarnason, H.; Gudbjartsson, D.; Magnusson, O.T.; Sparsø, T.; et al. Genetic Architecture of Vitamin B12 and Folate Levels Uncovered Applying Deeply Sequenced Large Datasets. PLoS Genet. 2013, 9, e1003530. [Google Scholar] [CrossRef] [Green Version]
- Hazra, A.; Kraft, P.; Lazarus, R.; Chen, C.; Chanock, S.J.; Jacques, P.; Selhub, J.; Hunter, D.J. Genome-wide significant predictors of metabolites in the one-carbon metabolism pathway. Hum. Mol. Genet. 2009, 18, 4677–4687. [Google Scholar] [CrossRef]
- Zheng, J.-S.; Luan, J.; Sofianopoulou, E.; Imamura, F.; Stewart, I.D.; Day, F.R.; Pietzner, M.; Wheeler, E.; Lotta, L.A.; Gundersen, T.E.; et al. Plasma Vitamin C and Type 2 Diabetes: Genome-Wide Association Study and Mendelian Randomization Analysis in European Populations. Diabetes Care 2021, 44, 98–106. [Google Scholar] [CrossRef]
- Ong, J.-S.; Dixon-Suen, S.C.; Han, X.; An, J.; Liyanage, U.; Dusingize, J.-C.; Schumacher, J.; Gockel, I.; Böhmer, A.; Jankowski, J.; et al. A comprehensive re-assessment of the association between vitamin D and cancer susceptibility using Mendelian randomization. Nat. Commun. 2021, 12, 246. [Google Scholar] [CrossRef] [PubMed]
- Major, J.M.; Yu, K.; Wheeler, W.; Zhang, H.; Cornelis, M.C.; Wright, M.E.; Yeager, M.; Snyder, K.; Weinstein, S.J.; Mondul, A.; et al. Genome-wide association study identifies common variants associated with circulating vitamin E levels. Hum. Mol. Genet. 2011, 20, 3876–3883. [Google Scholar] [CrossRef]
- Ferrucci, L.; Perry, J.R.; Matteini, A.; Perola, M.; Tanaka, T.; Silander, K.; Rice, N.; Melzer, D.; Murray, A.; Cluett, C.; et al. Common Variation in the β-Carotene 15,15′-Monooxygenase 1 Gene Affects Circulating Levels of Carotenoids: A Genome-wide Association Study. Am. J. Hum. Genet. 2009, 84, 123–133. [Google Scholar] [CrossRef] [Green Version]
- O’Seaghdha, C.M.; Wu, H.; Yang, Q.; Kapur, K.; Guessous, I.; Zuber, A.M.; Köttgen, A.; Stoudmann, C.; Teumer, A.; Kutalik, Z.; et al. Meta-Analysis of Genome-Wide Association Studies Identifies Six New Loci for Serum Calcium Concentrations. PLoS Genet. 2013, 9, e1003796. [Google Scholar] [CrossRef] [PubMed] [Green Version]
- Jäger, S.; Cabral, M.; Kopp, J.F.; Hoffmann, P.; Ng, E.; Whitfield, J.B.; Morris, A.P.; Lind, L.; Schwerdtle, T.; Schulze, M.B. Blood copper and risk of cardiometabolic diseases: A Mendelian randomization study. Hum. Mol. Genet. 2022, 31, 783–791. [Google Scholar] [CrossRef]
- Bell, S.; Rigas, A.S.; Magnusson, M.K.; Ferkingstad, E.; Allara, E.; Bjornsdottir, G.; Ramond, A.; Sørensen, E.; Halldorsson, G.H.; Paul, D.S.; et al. A genome-wide meta-analysis yields 46 new loci associating with biomarkers of iron homeostasis. Commun. Biol. 2021, 4, 156. [Google Scholar] [CrossRef]
- Meyer, T.E.; Verwoert, G.C.; Hwang, S.-J.; Glazer, N.L.; Smith, A.V.; van Rooij, F.J.A.; Ehret, G.B.; Boerwinkle, E.; Felix, J.F.; Leak, T.S.; et al. Genome-Wide Association Studies of Serum Magnesium, Potassium, and Sodium Concentrations Identify Six Loci Influencing Serum Magnesium Levels. PLoS Genet. 2010, 6, e1001045. [Google Scholar] [CrossRef] [Green Version]
- Kestenbaum, B.; Glazer, N.; Koettgen, A.; Felix, J.; Hwang, S.-J.; Liu, Y.; Lohman, K.; Kritchevsky, S.; Hausman, D.B.; Petersen, A.-K.; et al. Common Genetic Variants Associate with Serum Phosphorus Concentration. J. Am. Soc. Nephrol. 2010, 21, 1223–1232. [Google Scholar] [CrossRef] [Green Version]
- Cornelis, M.C.; Fornage, M.; Foy, M.; Xun, P.; Gladyshev, V.N.; Morris, S.; Chasman, D.I.; Hu, F.B.; Rimm, E.B.; Kraft, P.; et al. Genome-wide association study of selenium concentrations. Hum. Mol. Genet. 2015, 24, 1469–1477. [Google Scholar] [CrossRef] [Green Version]
- Evans, D.M.; Zhu, G.; Dy, V.; Heath, A.C.; Madden, P.A.F.; Kemp, J.P.; McMahon, G.; St Pourcain, B.; Timpson, N.J.; Golding, J.; et al. Genome-wide association study identifies loci affecting blood copper, selenium and zinc. Hum. Mol. Genet. 2013, 22, 3998–4006. [Google Scholar] [CrossRef] [Green Version]
- Peng, H.; Wu, X.; Wen, Y. Plasma Circulating Vitamin C Levels and Risk of Endometrial Cancer: A Bi-Directional Mendelian Randomization Analysis. Front. Med. 2022, 9, 792008. [Google Scholar] [CrossRef]
- Kho, P.F.; Glubb, D.M.; Thompson, D.J.; Spurdle, A.B.; O’Mara, T.A. Assessing the Role of Selenium in Endometrial Cancer Risk: A Mendelian Randomization Study. Front. Oncol. 2019, 9, 182. [Google Scholar] [CrossRef]
- Skrivankova, V.W.; Richmond, R.C.; Woolf, B.A.R.; Davies, N.M.; Swanson, S.A.; VanderWeele, T.J.; Timpson, N.J.; Higgins, J.P.T.; Dimou, N.; Langenberg, C.; et al. Strengthening the reporting of observational studies in epidemiology using mendelian randomisation (STROBE-MR): Explanation and elaboration. BMJ 2021, 375, n2233. [Google Scholar] [CrossRef] [PubMed]
- Emdin, C.A.; Khera, A.V.; Kathiresan, S. Mendelian randomization. JAMA 2017, 318, 1925–1926. [Google Scholar] [CrossRef] [PubMed]
- Yarmolinsky, J.; Bonilla, C.; Haycock, P.C.; Langdon, R.J.Q.; Lotta, L.A.; Langenberg, C.; Relton, C.L.; Lewis, S.J.; Evans, D.M.; Smith, G.D.; et al. Circulating Selenium and Prostate Cancer Risk: A Mendelian Randomization Analysis. Gynecol. Oncol. 2018, 110, 1035–1038. [Google Scholar] [CrossRef] [Green Version]
- Brion, M.-J.A.; Shakhbazov, K.; Visscher, P. Calculating statistical power in Mendelian randomization studies. Leuk. Res. 2013, 42, 1497–1501. [Google Scholar] [CrossRef] [PubMed] [Green Version]
- Hemani, G.; Zheng, J.; Elsworth, B.; Wade, K.H.; Haberland, V.; Baird, D.; Laurin, C.; Burgess, S.; Bowden, J.; Langdon, R.; et al. The MR-Base platform supports systematic causal inference across the human phenome. Elife 2018, 7, e34408. [Google Scholar] [CrossRef] [PubMed]
- Burgess, S.; Thompson, S.G. Interpreting findings from Mendelian randomization using the MR-Egger method. Eur. J. Epidemiol. 2017, 32, 377–389. [Google Scholar] [CrossRef] [Green Version]
- Bowden, J.; Smith, G.D.; Haycock, P.C.; Burgess, S. Consistent Estimation in Mendelian Randomization with Some Invalid Instruments Using a Weighted Median Estimator. Genet. Epidemiol. 2016, 40, 304–314. [Google Scholar] [CrossRef] [Green Version]
- Verbanck, M.; Chen, C.-Y.; Neale, B.; Do, R. Detection of widespread horizontal pleiotropy in causal relationships inferred from Mendelian randomization between complex traits and diseases. Nat. Genet. 2018, 50, 693–698. [Google Scholar] [CrossRef]
- M, F.D.G.; Minelli, C.; Sheehan, N.A.; Thompson, J.R. Detecting pleiotropy in Mendelian randomisation studies with summary data and a continuous outcome. Stat. Med. 2015, 34, 2926–2940. [Google Scholar] [CrossRef] [Green Version]
- Freuer, D.; Meisinger, C.; Linseisen, J. Causal relationship between dietary macronutrient composition and anthropometric measures: A bidirectional two-sample Mendelian randomization analysis. Clin. Nutr. 2021, 40, 4120–4131. [Google Scholar] [CrossRef] [PubMed]
- Coleman, H.G.; Kitahara, C.M.; Murray, L.J.; Dodd, K.W.; Black, A.; Stolzenberg-Solomon, R.Z.; Cantwell, M.M. Dietary Carbohydrate Intake, Glycemic Index, and Glycemic Load and Endometrial Cancer Risk: A Prospective Cohort Study. Am. J. Epidemiol. 2014, 179, 75–84. [Google Scholar] [CrossRef] [Green Version]
- Littman, A.J.; Beresford, S.A.; White, E. The association of dietary fat and plant foods with endometrial cancer (United States). Cancer Causes Control. 2001, 12, 691–702. [Google Scholar] [CrossRef]
- Cohen, C.W.; Fontaine, K.R.; Arend, R.C.; Alvarez, R.D.; Iii, C.A.L.; Huh, W.K.; Bevis, K.S.; Kim, K.H.; Straughn, J.M.; Gower, B.A. A Ketogenic Diet Reduces Central Obesity and Serum Insulin in Women with Ovarian or Endometrial Cancer. J. Nutr. 2018, 148, 1253–1260. [Google Scholar] [CrossRef] [Green Version]
- Cohen, C.W.; Fontaine, K.R.; Arend, R.C.; Soleymani, T.; Gower, B.A. Favorable Effects of a Ketogenic Diet on Physical Function, Perceived Energy, and Food Cravings in Women with Ovarian or Endometrial Cancer: A Randomized, Controlled Trial. Nutrients 2018, 10, 1187. [Google Scholar] [CrossRef] [PubMed] [Green Version]
- Bandera, E.V.; Gifkins, D.M.; Moore, D.F.; McCullough, M.L.; Kushi, L.H. Antioxidant vitamins and the risk of endometrial cancer: A dose–response meta-analysis. Cancer Causes Control. 2009, 20, 699–711. [Google Scholar] [CrossRef] [Green Version]
- Aschard, H.; Vilhjálmsson, B.J.; Joshi, A.D.; Price, A.L.; Kraft, P. Adjusting for Heritable Covariates Can Bias Effect Estimates in Genome-Wide Association Studies. Am. J. Hum. Genet. 2015, 96, 329–339. [Google Scholar] [CrossRef] [PubMed] [Green Version]
- Lucenteforte, E.; Talamini, R.; Montella, M.; Maso, L.D.; Tavani, A.; Deandrea, S.; Pelucchi, C.; Greggi, S.; Zucchetto, A.; Barbone, F.; et al. Macronutrients, fatty acids and cholesterol intake and endometrial cancer. Ann. Oncol. 2008, 19, 168–172. [Google Scholar] [CrossRef]


| Exposure | Reference | Sample Size | Number of IVs | R2 | F-Statistic | Consortia |
|---|---|---|---|---|---|---|
| Macronutrients | ||||||
| Relative intake of carbohydrates | [5] | 268,922 | 12 | 0.18% | 39.5 | UKBB, Netherlands (Lifelines, RSI/II/III), UK (ALSPAC, Fenland), USA (FHS, HRS, WHI-GARNET, WHI-HIPFX, WHIMS+), EPIC-InterAct, and DietGen |
| Relative intake of fat | [5] | 268,922 | 6 | 0.13% | 58.8 | |
| Relative intake of protein | [5] | 268,922 | 7 | 0.14% | 53.7 | |
| Relative intake of sugar | [5] | 235,391 | 9 | 0.19% | 49.8 | UKBB, Netherlands (Lifelines, RSI/II/III), UK (ALSPAC, Fenland), USA (FHS, HRS, WHI-GARNET, WHI-HIPFX, WHIMS+), and EPIC-InterAct |
| Micronutrients: Vitamins | ||||||
| Vitamin A (retinol) 1 | [17] | 8902 | 2 | 0.63% | 28.4 | ATBC, PLCO, NHS-CHD, NHS-T2D, NHS-CGEMS, InCHIANTI |
| B vitamin: folate | [18] | 37,341 | 2 | 0.76% | 142.6 | Icelandic, Danish-Inter99, Danish-Health2006 |
| B vitamin: vitamin B12 | [18] | 45,576 | 11 | 5.13% | 224 | |
| B vitamin: vitamin B6 | [19] | 4763 | 1 | 1.02% | 49 | NHS-CGEMS, FHS-SHARe |
| Vitamin C | [20] | 52,018 | 11 | 1.79% | 86 | Fenland, EPIC-Norfolk, InterAct, EPIC-CVD |
| Vitamin D | [21] | 438,870 | 76 | 3.68% | 201.8 | UKBB |
| Vitamin E 1 | [22] | 8781 | 3 | 0.39% | 11.4 | ATBC, PLCO, and NHS |
| β-carotene | [23] | 3881 | 1 | 2.48% | 98.6 | InCHIANTI, WHAS I and WHAS II, and ATBC |
| Micronutrients: Minerals | ||||||
| Calcium | [24] | 61,079 | 7 | 0.84% | 74 | AGES, ARIC, BLSA, CHS, CoLaus, CROATIA-Korcula, CROATIA-Split, CROATIA-Vis, FHS, HABC, InCHIANTI, LBC1936, LOLIPOP EW A, LOLIPOP EW P, LOLIPOP EW610, OGP Talana, ORCADES, RS, SHIP, BRIGHT, Bus Santé, INGI-Carlantino, INGI-FVG, INGI-CILENTO, KORA-F3, KORA-F4, LURIC, PIVUS, SHIP-Trend, TwinsUK |
| Copper | [25] | 5594 | 2 | 1.94% | 55.4 | EIPC-Potsdam, PIVUS, QIMR |
| Iron | [27] | 246,139 | 14 | 2.63% | 314.9 | deCODE genetics, INTERVAL study, Danish Blood Donor Study |
| Magnesium | [28] | 23,829 | 6 | 1.45% | 58.5 | ARIC, FHS, RS |
| Phosphorus | [29] | 16,264 | 5 | 0.75% | 41.1 | CHS, FHS, ARIC, RS, KORA-F3, KORA-F4, Health ABC, CROATIA-Vis |
| Selenium | [30] | 9639 | 2 | 2.12% | 104.3 | CARDIA, JoCo, NHS, HPFS, QIMR, and ALSPAC |
| Zinc | [31] | 2603 | 2 | 4.59% | 62.6 | QIMR and ALSPAC |
| Exposure | Number of IVs | EC (All Histological Subtypes) | Endometrioid EC | Non-Endometrioid EC | |||
|---|---|---|---|---|---|---|---|
| OR (95% CI) | p-Value | OR (95% CI) | p-Value | OR (95% CI) | p-Value | ||
| Macronutrients | |||||||
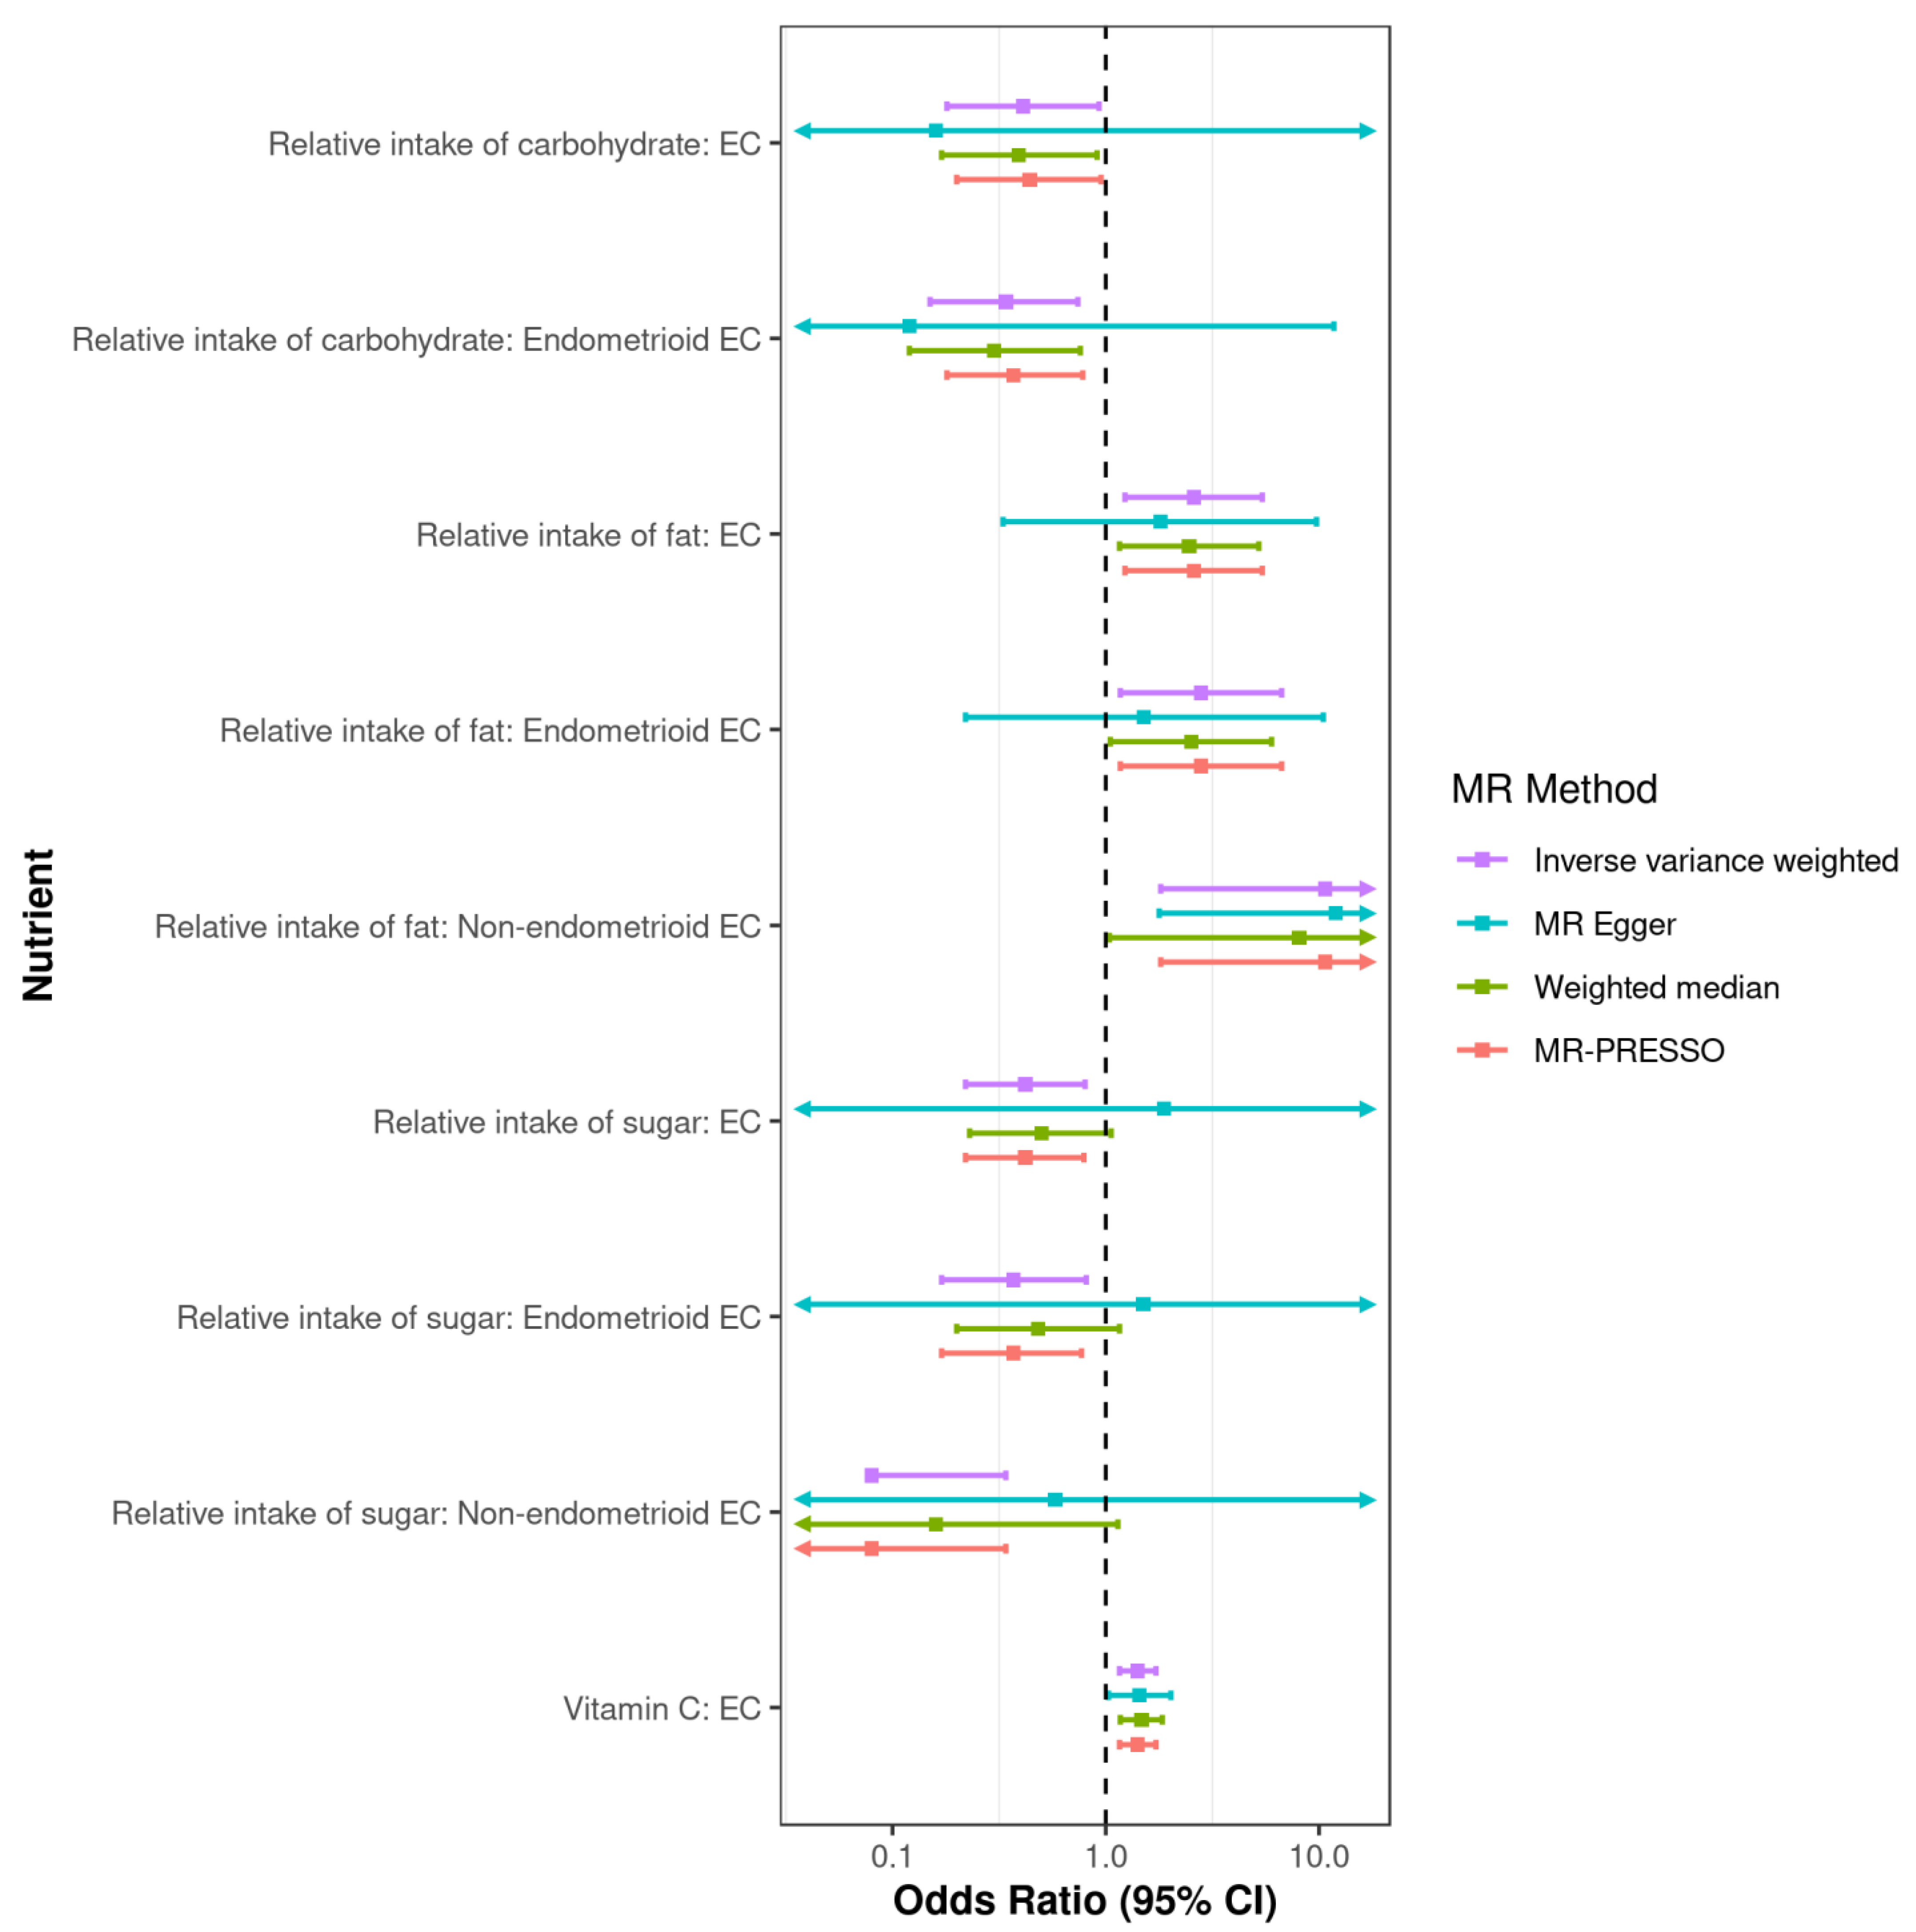
| Relative intake of carbohydrate | 12 | 0.41 (0.18, 0.93) | 0.03 | 0.34 (0.15, 0.74) | 0.006 | 0.25 (0.04, 1.57) | 0.14 |
| Relative intake of fat | 6 | 2.59 (1.23, 5.42) | 0.01 | 2.8 (1.17, 6.68) | 0.02 | 10.69 (1.81, 63.1) | 0.009 |
| Relative intake of protein | 7 | 1.26 (0.47, 3.38) | 0.64 | 1.4 (0.47, 4.14) | 0.55 | 3.5 (0.43, 28.48) | 0.24 |
| Relative intake of sugar | 9 | 0.42 (0.22, 0.8) | 0.009 | 0.37 (0.17, 0.81) | 0.01 | 0.08 (0.02, 0.34) | 6 × 10⁻⁴ |
| Micronutrients: Vitamins | |||||||
| Vitamin A (retinol) | 2 | 0.63 (0.16, 2.39) | 0.49 | 0.63 (0.11, 3.67) | 0.61 | 4.98 (0.23, 109.47) | 0.31 |
| B vitamin: Folate | 2 | 1.11 (0.85, 1.44) | 0.43 | 1.12 (0.8, 1.57) | 0.50 | 1.31 (0.63, 2.71) | 0.47 |
| B vitamin: Vitamin B12 | 10 | 1.03 (0.93, 1.13) | 0.58 | 1 (0.9, 1.12) | 0.99 | 0.99 (0.72, 1.36) | 0.94 |
| B vitamin: Vitamin B6 1 | 1 | 0.93 (0.71, 1.22) | 0.60 | 0.95 (0.7, 1.3) | 0.76 | 0.88 (0.42, 1.85) | 0.73 |
| Vitamin C | 11 | 1.41 (1.16, 1.72) | 7 × 10⁻⁴ | 1.32 (0.96, 1.83) | 0.09 | 1.39 (0.87, 2.22) | 0.16 |
| Vitamin D | 75 | 0.93 (0.8, 1.09) | 0.40 | 0.92 (0.79, 1.08) | 0.32 | 1.01 (0.73, 1.41) | 0.94 |
| Vitamin E | 3 | 1.27 (0.62, 2.61) | 0.51 | 1.66 (0.58, 4.75) | 0.35 | 0.9 (0.12, 6.89) | 0.92 |
| β-carotene 1 | 1 | 1.04 (0.85, 1.29) | 0.68 | 0.97 (0.77, 1.23) | 0.79 | 1.63 (0.92, 2.87) | 0.09 |
| Micronutrients: Minerals | |||||||
| Calcium | 7 | 0.96 (0.55, 1.66) | 0.87 | 1.06 (0.61, 1.86) | 0.83 | 1.29 (0.33, 5.11) | 0.72 |
| Copper | 2 | 1.11 (0.92, 1.34) | 0.27 | 1.17 (1.01, 1.35) | 0.04 | 0.9 (0.63, 1.28) | 0.55 |
| Iron | 14 | 1.1 (0.9, 1.33) | 0.35 | 1.07 (0.85, 1.34) | 0.59 | 1.2 (0.87, 1.65) | 0.26 |
| Magnesium | 6 | 0.21 (0.02, 2.69) | 0.23 | 0.11 (0.01, 1.96) | 0.13 | 0.31 (0, 85.93) | 0.68 |
| Phosphorus | 5 | 1.25 (0.83, 1.88) | 0.29 | 1.35 (0.85, 2.15) | 0.21 | 0.93 (0.3, 2.92) | 0.90 |
| Selenium | 2 | 1.03 (0.77, 1.38) | 0.84 | 1.08 (0.85, 1.38) | 0.52 | 1.08 (0.46, 2.51) | 0.86 |
| Zinc | 2 | 0.89 (0.78, 1.02) | 0.09 | 0.89 (0.74, 1.08) | 0.24 | 0.89 (0.66, 1.2) | 0.44 |
Disclaimer/Publisher’s Note: The statements, opinions and data contained in all publications are solely those of the individual author(s) and contributor(s) and not of MDPI and/or the editor(s). MDPI and/or the editor(s) disclaim responsibility for any injury to people or property resulting from any ideas, methods, instructions or products referred to in the content. |
© 2023 by the authors. Licensee MDPI, Basel, Switzerland. This article is an open access article distributed under the terms and conditions of the Creative Commons Attribution (CC BY) license (https://creativecommons.org/licenses/by/4.0/).
Share and Cite
Wang, X.; Glubb, D.M.; O’Mara, T.A. Dietary Factors and Endometrial Cancer Risk: A Mendelian Randomization Study. Nutrients 2023, 15, 603. https://doi.org/10.3390/nu15030603
Wang X, Glubb DM, O’Mara TA. Dietary Factors and Endometrial Cancer Risk: A Mendelian Randomization Study. Nutrients. 2023; 15(3):603. https://doi.org/10.3390/nu15030603
Chicago/Turabian StyleWang, Xuemin, Dylan M. Glubb, and Tracy A. O’Mara. 2023. "Dietary Factors and Endometrial Cancer Risk: A Mendelian Randomization Study" Nutrients 15, no. 3: 603. https://doi.org/10.3390/nu15030603