
Relationship of Glucose, C-peptide, Leptin, and BDNF in Maternal and Umbilical Vein Blood in Type-1 Diabetes

 , ,
, ,
Abstract
:1. Introduction
2. Materials and Methods
2.1. Ethical Statements
2.2. Study Participants
2.2.1. Inclusion Criteria
2.2.2. Exclusion Criteria
2.3. Data Collection
2.4. Blood Sample Analyses
2.5. Sample Size
2.6. Statistical Analyses
3. Results
3.1. Demographic, Obstetric, and Neonatal Data
3.1.1. Neonatal Clinical and Laboratory Data
3.1.2. Linear Regression of Glucose Concentration between Maternal and Umbilical Vein Serum
3.2. Nonparametric Correlation between Glucose Concentration in Maternal Vein and C-peptide Concentration in Umbilical Vein
3.3. Nonparametric Correlation between BMI, Neonatal Weight, and Leptin Concentration
4. Discussion
4.1. Excessive Fetal Growth despite Optimal Glycemic Control
4.2. Leptin in Maternal and Fetal Blood
4.3. CRP in T1DM Pregnant Women
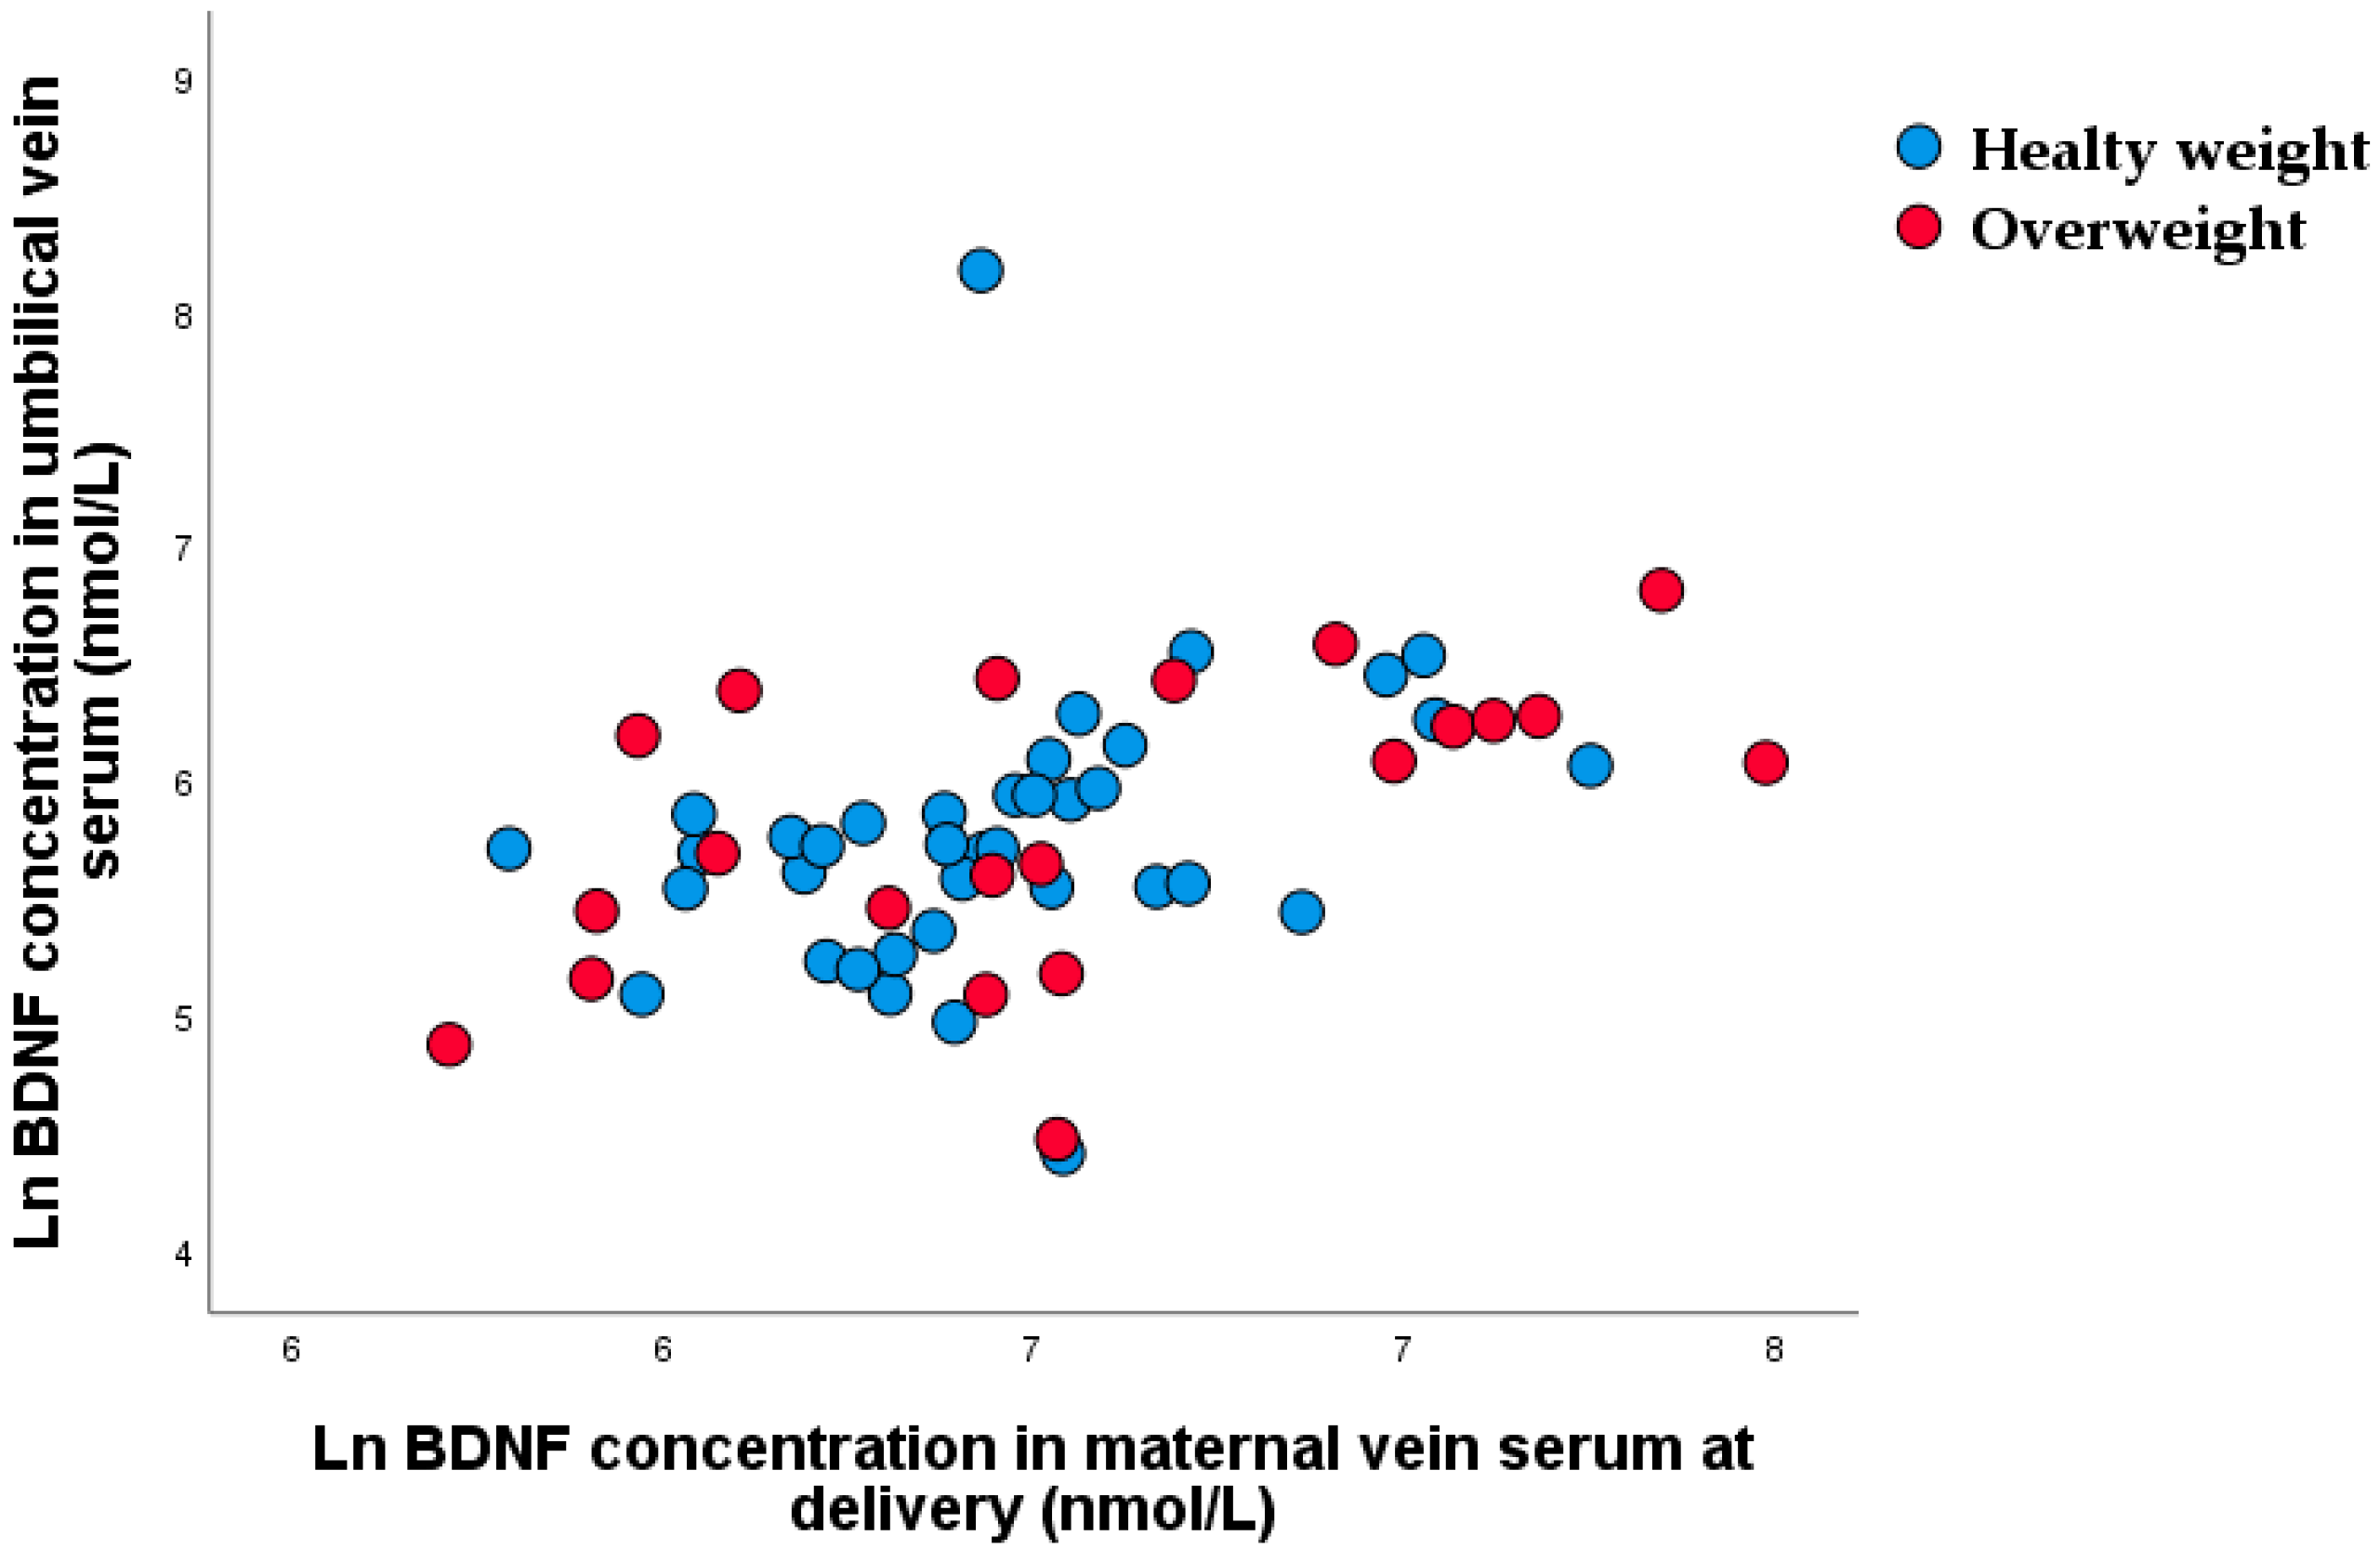
4.4. A BDNF during Pregnancy
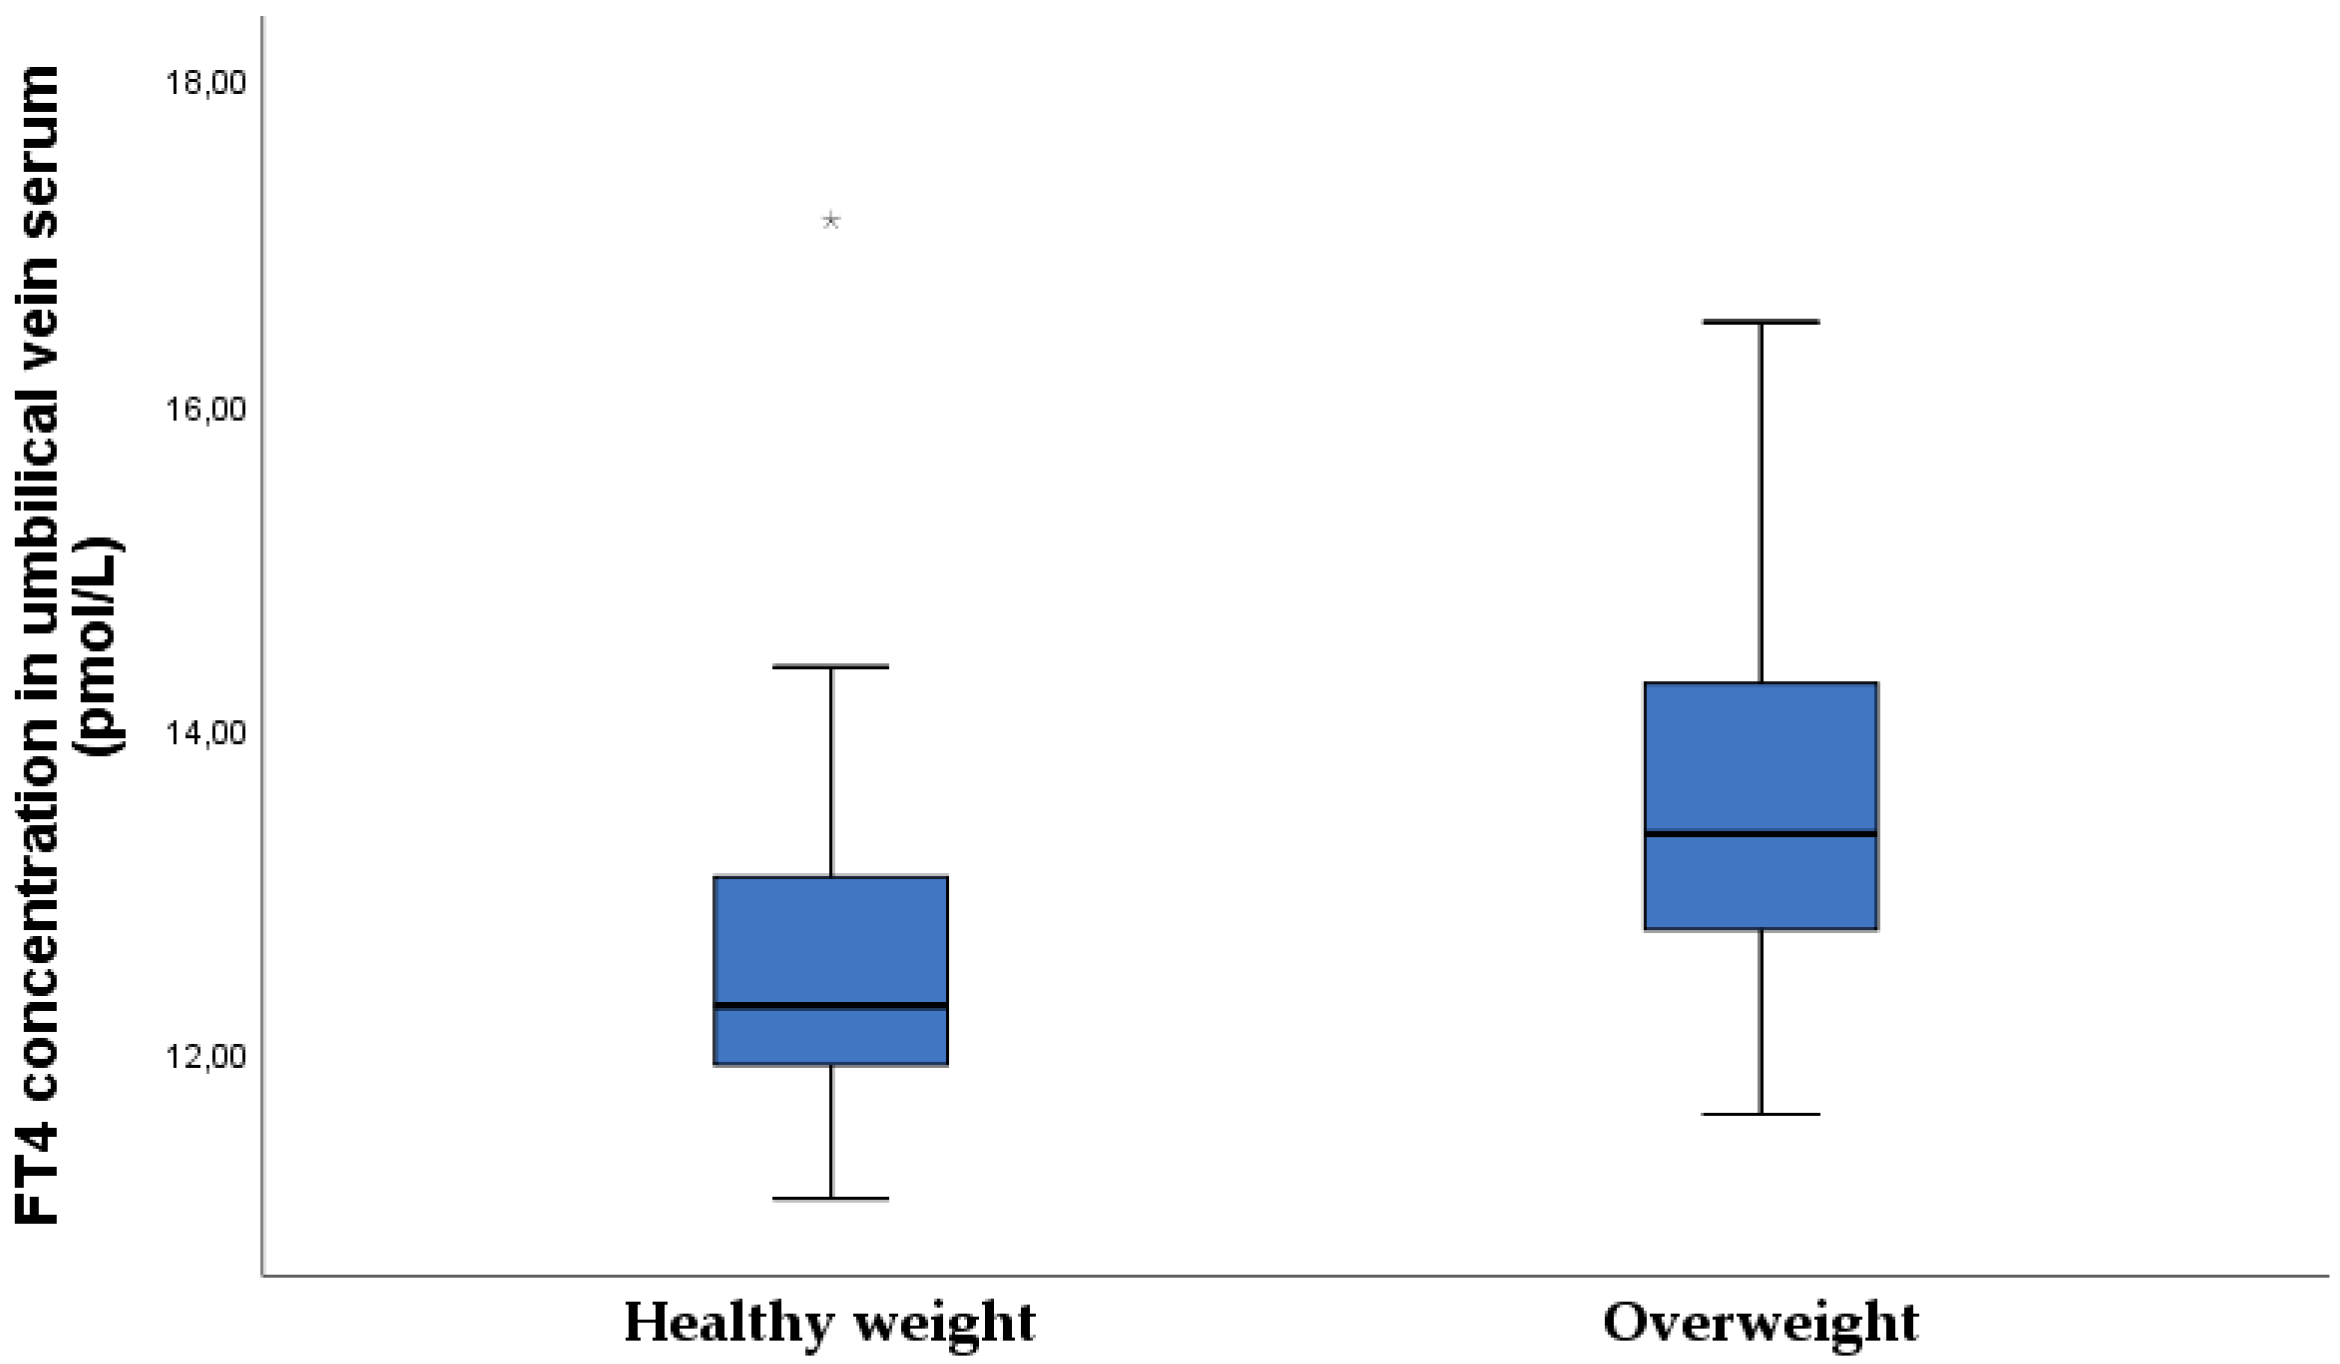
4.5. Subclinical Hypothyroidism in Type-1 Diabetic Pregnant Women
4.6. Strengths of the Study
5. Conclusions
Author Contributions
Funding
Institutional Review Board Statement
Informed Consent Statement
Data Availability Statement
Acknowledgments
Conflicts of Interest
References
- Holt, R.I.G.; DeVries, J.H.; Hess-Fischl, A.; Hirsch, I.B.; Kirkman, M.S.; Klupa, T.; Ludwig, B.; Nørgaard, K.; Pettus, J.; Renard, E.; et al. The Management of Type 1 Diabetes in Adults. A Consensus Report by the American Diabetes Association (ADA) and the European Association for the Study of Diabetes (EASD). Diabetes Care. 2021, 44, 2589–2625. [Google Scholar] [CrossRef]
- Atkinson, M.A.; Eisenbarth, G.S. Type 1 diabetes: New perspectives on disease pathogenesis and treatment. Lancet 2001, 358, 221–229. [Google Scholar] [CrossRef]
- Kruit, H.; Mertsalmi, S.; Rahkonen, L. Planned vaginal and planned cesarean delivery outcomes in pregnancies complicated with pregestational type 1 diabetes - A three-year academic tertiary hospital cohort study. BMC Pregnancy Childbirth. 2022, 22, 173. [Google Scholar] [CrossRef]
- Garey, C.; Lynn, J.; Floreen Sabino, A.; Hughes, A.; McAuliffe-Fogarty, A. Preeclampsia and other pregnancy outcomes in nulliparous women with type 1 diabetes: A retrospective survey. Gynecol. Endocrinol. 2020, 36, 982–985. [Google Scholar] [CrossRef]
- Xu, Q.; Lu, J.; Hu, J.; Ge, Z.; Zhu, D.; Bi, Y. Perinatal outcomes in pregnancies complicated by type 1 diabetes mellitus. Gynecol. Endocrinol. 2020, 36, 879–884. [Google Scholar] [CrossRef]
- Persson, M.; Norman, M.; Hanson, U. Obstetric and perinatal outcomes in type 1 diabetic pregnancies: A large, population-based study. Diabetes Care. 2009, 32, 2005–2009. [Google Scholar] [CrossRef] [Green Version]
- Joshi, N.P.; Mane, A.R.; Sahay, A.S.; Sundrani, D.P.; Joshi, S.R.; Yajnik, C.S. Role of placental glucose transporters in determing fetal growth. Reprod. Sci. 2021, 29, 2744–2759. [Google Scholar] [CrossRef]
- Sibiak, R.; Ozegowska, K.; Wender-Ozegowska, E.; Gutaj, P.; Mozdziak, P.; Kempisty, B. Fetomaternal Expression of Glucose Transporters (GLUTs)-Biochemical, Cellular and Clinical Aspects. Nutrients 2022, 14, 2025. [Google Scholar] [CrossRef]
- Djelmis, J.; Ivanisevic, M.; Desoye, G.; van Poppel, M.; Berberovic, E.; Soldo, D.; Oreskovic, S. Higher cord blood levels of fatty acids in pregnant women with type 1 diabetes mellitus. J. Clin. Endocrinol. Metab. 2018, 103, 2620–2629. [Google Scholar] [CrossRef]
- Desoye, G.; Herrera, E. Adipose tissue development and lipid metabolism in the human fetus: The 2020 perspective focusing on maternal diabetes and obesity. Prog. Lipid Res. 2021, 81, 101082. [Google Scholar] [CrossRef]
- Kabaran, S.; Besler, T. Do fatty acids affect fetal programming? J. Health Popul. Nutr. 2015, 33, 14–23. [Google Scholar] [CrossRef] [PubMed] [Green Version]
- Ivanisevic, M.; Delmis, K.; Herman, M.; Horvaticek, M.; Berberovic, E.; Djelmis, J. Concentrations of fatty acids among macrosomic neonates delivered by healthy women and women with type 1 diabetes mellitus. Int. J. Gynaecol. Obstet. 2020, 149, 309–317. [Google Scholar] [CrossRef] [PubMed]
- Vaughan, O.R.; Rosario, F.J.; Powell, T.L.; Jansson, T. Regulation of placental amino acid transport and fetal growth. Prog. Mol. Biol. Transl. Sci. 2017, 145, 217–251. [Google Scholar]
- Pedersen, J. The Pregnant Diabetic and Her Newborn: Problems and Management; Wiliam & Wilkins: Baltimore, MD, USA, 1967; pp. 128–137. [Google Scholar]
- Eom, Y.S.; Wilson, J.R.; Bernet, V.J. Links between thyroid disorders and glucose homeostasis. Diabetes Metab. J. 2022, 46, 239–256. [Google Scholar] [CrossRef]
- Binder, D.K.; Scharfman, H.E. Brain-derived neurotrophic factor. Growth Factors. 2020, 22, 123–131. [Google Scholar] [CrossRef] [Green Version]
- Briana, D.D.; Malamitsi-Puchner, A. Developmental origins of adult health and disease: The metabolic role of BDNF from early life to adulthood. Metabolism 2018, 81, 45–51. [Google Scholar] [CrossRef]
- D’Souza, V.; Patil, V.; Pisal, H.; Randhir, K.; Joshi, A.; Mehendale, S.; Wagh, G.; Gupte, S.; Joshi, S. Levels of brain derived neurotrophic factors across gestation in women with preeclampsia. Int. J. Dev. Neurosci. 2014, 37, 36–40. [Google Scholar] [CrossRef]
- Trajkovska, V.; Marcussen, A.B.; Vinberg, M.; Hartvig, P.; Aznar, S.; Knudsen, G.M. Measurements of brain-derived neurotrophic factor: Methodological aspects and demographical data. Brain Res. Bull. 2007, 73, 143–149. [Google Scholar] [CrossRef]
- Guzzardi, M.A.; Sanguinetti, E.; Bartoli, A.; Kemeny, A.; Panetta, D.; Salvadori, P.A.; Burchielli, S.; Iozzo, P. Elevated glycemia and brain glucose utilization predict BDNF lowering since early life. J. Cereb. Blood Flow Metab. 2018, 38, 447–455. [Google Scholar] [CrossRef]
- Jequier, E. Leptin signaling, adiposity, and energy balance. Ann. N. Y. Acad Sci. 2002, 967, 379–388. [Google Scholar] [CrossRef]
- Hauguel-de Mouzon, S.; Lepercq, J.; Catalano, P. The known and unknown of leptin in pregnancy. Am. J. Obstet. Gynacol. 2006, 194, 1537–1545. [Google Scholar] [CrossRef]
- Du, M.; Basu, A.; Fu, D.; Wu, M.; Centola, M.; Jenkins, A.J.; Hanssen, K.F.; Garg, S.K.; Hammad, S.M.; Scardo, J.A.; et al. Serum inflammatory markers and pre-eclampsia in type 1 diabetes: A prospective study. Diabetes Care 2013, 36, 2054–2061. [Google Scholar] [CrossRef] [Green Version]
- Sudhakar, M.; Silambanan, S.; Chandran, A.S.; Prabhakaran, A.A.; Ramakrishnan, R. C-Reactive Protein (CRP) and Leptin Receptor in Obesity: Binding of Monomeric CRP to Leptin Receptor. Front. Immunol. 2018, 9, 1167. [Google Scholar] [CrossRef] [Green Version]
- Drazancic, A. Fetal growth chart, fetal growth restriction and fetal dysmaturity. Gynaecol. Perinatol. 2009, 18, 1–12. [Google Scholar]
- World Health Organization. WHO Multicenter Growth Reference Study: WHO Child Growth Standards: Length/Height-for-Age, Weight-for-Age, Weight-for Lengths, Weight-for Height and Body Mass Index-for Age: Methods and Development; WHO: Geneva, Switzerland, 2002. [Google Scholar]
- Brans, Y.W.; Summers, J.E.; Dweck, H.S.; Cassady, G. A noninvasive approach to body composition in the neonate: Dynamic skinfold measurements. Pediatr. Res. 1974, 8, 215–222. [Google Scholar] [CrossRef] [PubMed] [Green Version]
- Slaughter, M.H.; Lohman, T.G.; Boileau, R.A.; Horswill, C.A.; Stillman, R.J.; Van Loan, M.D.; Bemben, D.A. Skinfold equations for estimation of body fatness in children and youth. Hum. Biol. 1988, 60, 709–723. [Google Scholar] [PubMed]
- Desoye, G.; Nolan, C.J. The fetal glucose steal: An underappreciated phenomenon in diabetic pregnancy. Diabetology 2016, 59, 1089–1094. [Google Scholar] [CrossRef] [PubMed] [Green Version]
- Reiher, H.; Fuhrmann, K.; Noack, S.; Woltanski, K.P.; Jutzi, E.; Hahn von Dorsche, H.; Hahn, H.J. Age-dependent insulin secretion of the endocrine pancreas in vitro from fetuses of diabetic and nondiabetic patients. Diabetes Care. 1983, 6, 446–451. [Google Scholar] [CrossRef]
- Kalhan, S.; Parimi, P. Glugoneogenesis in the fetus and neonate. Semin. Perinatol. 2000, 24, 94–106. [Google Scholar] [CrossRef] [PubMed]
- Catalano, P.M.; Thomas, A.J.; Avallone, D.A.; Amini, S.M. Anthropometric estimation of neonatal body composition. Am. J. Obstet Gynecol. 1995, 173, 1176–1181. [Google Scholar] [CrossRef] [PubMed]
- Higgins, M.F.; Russell, N.M.; Brazil, D.P.; Firth, R.G.; McAuliffe, F.M. Fetal and maternal leptin in pre-gestational diabetic pregnancy. Int. J. Gynaecol. Obstet. 2013, 120, 169–172. [Google Scholar] [CrossRef]
- Czupryniak, L. Determinants of C-reactive protein concentrations in pregnant women with type 1 diabetes. Pol. Arch. Med. Wewn. 2016, 126, 230–236. [Google Scholar] [CrossRef] [Green Version]
- Chouthai, N.S.; Sampers, J.; Desai, N.; Smith, G.M. Changes in neurotrophin levels in umbilical cord blood from infants with different gestational ages and clinical conditions. Pediatr. Res. 2003, 53, 965–969. [Google Scholar] [CrossRef] [Green Version]
- Christian, L.M.; Mitchell, A.M.; Gillespie, S.L.; Palettas, M. Serum brain-derived neurotrophic factor (BDNF) across pregnancy and postpartum: Associations with race, depressive symptoms, and low birth weight. Psychoneuroendocrinology 2016, 74, 69–76. [Google Scholar] [CrossRef] [Green Version]
- Malamitsi-Puchner, A.; Ecocomou, E.; Rigopoulou, O.; Boutsikou, T. Perinatal changes of brain-derived neurotrophic factor in pre-and full-term neonates. Early Hum. Dev. 2004, 76, 17–22. [Google Scholar] [CrossRef]
- Kodomari, I.; Wada, E.; Nakamura, S.; Wada, K. Maternal supply of BDNF to mouse fetal brain through the placenta. Neurochem. Int. 2009, 54, 95–98. [Google Scholar] [CrossRef]
- Flöck, A.; Weber, S.K.; Ferrari, N.; Fietz, C.; Graf, C.; Fimmers, R.; Gembruch, U.; Merz, W.M. Determinants of brain-derived neurotrophic factor (BDNF) in umbilical cord and maternal serum. Psychoneuroendocrinology 2016, 63, 191–197. [Google Scholar] [CrossRef]
- Marosi, K.; Mattson, M.P. BDNF mediates adaptive brain and body responses to energetic challenges. Trends. Endocrinol. Metab. 2014, 25, 89–98. [Google Scholar] [CrossRef] [Green Version]
- Fargali, S.; Sadahiro, M.; Jiang, C.; Frick, A.L.; Indall, T.; Cogliani, V.; Welagen, J.; Lin, W.J.; Salton, S.R. Role of neurotrophins in the development and function of neural circuits that regulate energy homeostasis. J. Mol. Neurosci. 2012, 48, 654–659. [Google Scholar] [CrossRef] [Green Version]
- Shields, B.M.; Knight, B.A.; Hill, A.; Hattersley, A.T.; Vaidya, B. Fetal thyroid hormone level at birth is associated with fetal growth. J. Clin. Endocrinol. Metab. 2011, 96, E934–E938. [Google Scholar] [CrossRef] [Green Version]
- Josefson, J.L.; Zeiss, D.M.; Rademaker, A.W.; Metzger, B.E. Maternal leptin predicts adiposity of the neonate. Horm. Res. Paediatr. 2014, 81, 13–19. [Google Scholar] [CrossRef] [Green Version]
- Catalano, P.M.; Presley, L.; Minium, J.; Hauguelde Mouzon, S. Fetuses of obese mothers develop insulin resistance in utero. Diabetes Care. 2009, 32, 1076–1080. [Google Scholar] [CrossRef] [Green Version]


| Demographic Data | N | Minimum | Maximum | Mean ± SD, n (%) or Median and IQR |
|---|---|---|---|---|
| Age (years) | 66 | 19 | 38 | 30.5 ± 5.3 |
| Duration of T1DM | 66 | 2.0 | 36 | 14.3 ± 9.4 |
| Less than 8 years | 22 | 2.0 | 8.0 | 4.6 ± 2.1 |
| More than 8 years | 44 | 9.0 | 36 | 19.1 ± 6.5 |
| Years of onset of T1DM | 66 | 2.0 | 36 | 16.2 ± 9.2 |
| Before 10 years | 24 | 2.0 | 10.0 | 7.0 ± 2.7 |
| After 10 years | 42 | 11.0 | 36.0 | 21.5 ± 7.6 |
| Height (cm) | 66 | 156 | 180 | 166.3 ± 5.3 |
| BMI before pregnancy (kg/m2) | 66 | 17.3 | 39.8 | 23.9 ± 4.8 |
| BMI < 25 n (%) | 45 (68.2) | 18.7 | 24.6 | 21.5 ± 1.7 |
| BMI 25–29.9 n (%) | 13 (19.7) | 25.5 | 29.4 | 27.1 ± 3.6 |
| BMI > 30 n (%) | 8 (12.1) | 30.4 | 39.8 | 33.2 ± 3.0 |
| Obstetrical data | ||||
| Nulliparous n (%) Multiparous n (%) | 38 (57.6) 28 (42.4) | |||
| Gestational age at delivery | 66 | 34 | 39 | 38.1 ± 0.9 |
| Gestational weight gain (kg) | 66 | 0 | 22 | 13.0 ± 4.6 |
| BMI at delivery (kg/m2) | 66 | 21.7 | 43 | 28.4 ± 4.7 |
| BMI < 25 n (%) | 17 (25.8) | 21.7 | 24.9 | 23.3 ± 1.1 |
| BMI 25–29.9 n (%) | 28 (42.4) | 25.3 | 29.9 | 27.4 ± 1.5 |
| BMI > 30 n (%) | 21 (31.8) | 30.0 | 43.0 | 33.9 ± 3.5 |
| Maternal laboratory data | ||||
| HbA1c (%) in first trimester | 66 | 5.4 | 8.0 | 6.8±1.1 a |
| HbA1c ≤ 6.5 n (%) first trimester | 32 (48.5) | |||
| HbA1c ≥ 6.6 n (%) first trimester | 34 (51.5) | |||
| HbA1c (%) in second trimester | 65 | 4.6 | 8.5 | 6.3 ± 0.9 |
| HbA1c ≤ 6.5 n (%) second trimester | 47 (72.3) | |||
| HbA1c ≥ 6.6 n (%) second trimester | 18 (27.3) | |||
| HbA1c (%) in third trimester | 65 | 4.2 | 8.6 | 6.0 ± 0.9 a |
| HbA1c ≤ 6.5 n (%) third trimester | 37 (56.9) | |||
| HbA1c ≥ 6.6 n (%) third trimester | 28 (43.1) | |||
| TSH in first trimester (mIU/L) | 63 | 0.02 | 5.0 | 2.5 ± 1.2 2.5 (1.7–3.1) |
| Subclinical hypothyroidism NO n (%) YES n (%) | 31 (49.2) 32 (50.8) | |||
| FT3 in first trimester (pmol/L) | 63 | 0.86 | 5.5 | 3.8 ± 0.6 |
| FT4 in first trimester (pmol/L) | 63 | 8.7 | 15.2 | 11.7 ± 1.3 |
| Mean glucose in first in capillary plasma (mmol/L) | 64 | 2.9 | 10.1 | 5.8 ± 1.4 |
| Mean glucose in second in capillary plasma (mmol/L) | 61 | 3.3 | 7.9 | 5.3 ± 1.2 |
| Mean glucose in third in capillary plasma (mmol/L) | 62 | 3.5 | 7.5 | 5.5 ± 1.0 |
| Glucose concentration in maternal vein serum at the time of delivery (mmol/L) | 63 | 2.0 | 10.2 | 5.4 ± 1.8 5.2 (4.0–6.2) |
| CRP (mg/L) in first trimester (mg/L) | 54 | 0.1 | 19 | 2.3 (1.1–4.8) b |
| CRP (mg/L) in second trimester | 34 | 0.2 | 54 | 2.9 (1.6–8.3) |
| CRP (mg/L) in third trimester | 35 | 0.3 | 34 | 3.5 (1.7–9.6) b |
| BDNF in first trimester (ng/L) | 61 | 377.9 | 2472.0 | 779.4 (571.9–1055.6) c |
| BDNF in second trimester (ng/L) | 61 | 213.2 | 1783.0 | 632.8 (502.6–803.0) |
| BDNF in third trimester (ng/L) | 54 | 24.3 | 1887.0 | 619.8 (474.4–999.0) |
| BDNF at the time of delivery (ng/L) | 60 | 19.9 | 2558.0 | 592.3 (419.0–908.9) c |
| Leptin in first trimester (ng/L) | 58 | 3.2 | 119.7 | 14.7 (9.6–25.7) d |
| Leptin in second trimester (ng/L) | 62 | 3.7 | 150.0 | 22.6 (13.8–34.6) |
| Leptin in third trimester (ng/L) | 58 | 2.1 | 131.5 | 18.6 (11.6–39.1) |
| Leptin at the time of delivery (ng/L) | 60 | 1.7 | 150.0 | 21.0 (11.8–43.5) d |
| Neonatal Data | N (%) | Minimum | Maximum | Mean ± SD or Median and IQR |
|---|---|---|---|---|
| Male n (%) Female n (%) | 29 (43.9) 37 (56.1) | |||
| Term birth n (%) Preterm birth n (%) | 59 (89.4) 7 (10.6) | |||
| Birthweight (g) | 66 | 2500.0 | 4840 | 3614.7 ± 584.0 |
| Length (cm) | 66 | 45 | 54 | 49.6 ± 2.3 |
| Z-score neonatal weight | 66 | −1.0 | 3.2 | 0.9 (0.4-1.6) |
| Percentile of neonatal z-score | 66 | 15.2 | 99.9 | 76.4 ± 21.0 |
| Healthy-weight neonate n (%) | 42 (63.6%) | 2500 | 4420 | 3414.8 ± 550.2 |
| Overweight neonate n (%) | 24 (36.4%) | 3230 | 4840 | 3964 ± 472.9 |
| Neonatal macrosomia (≥4000 g) YES n (%) NO n (%) | 17 (25.8) 49 (74.2) | |||
| LGA (≥90 percentile) YES n (%) NO (%) | 47 (71.2) 19 (28.8) | |||
| Head circumference (cm) | 66 | 31.5 | 43.5 | 34.8 ± 1.5 |
| Abdominal circumference (cm) | 66 | 25 | 38 | 33.3 ± 2.7 |
| Apgar index at 1 min | 66 | 8 | 10 | 9.88 ± 0.37 |
| Apgar index at 5 min | 66 | 9 | 10 | 9.95 ± 0.21 |
| Neonatal skinfold thickness on third day after delivery | ||||
| Subscapular (cm) | 66 | 3.2 | 8.6 | 5.6 ± 1.2 |
| Abdomen (cm) | 66 | 2.4 | 8.5 | 4.0 ± 1.0 |
| Biceps (cm) | 66 | 2.5 | 6.2 | 4.0 ± 0.8 |
| Triceps (cm) | 66 | 3.1 | 7.6 | 5.2 ± 1.0 |
| Femur (cm) | 66 | 3.9 | 10.4 | 6.8 ± 1.4 |
| Sum of skinfold thicknesses (cm) | 66 | 16.1 | 35.9 | 25.6 ± 3.8 |
| Fat mass percentage (%) | 66 | 8.0 | 17.9 | 12.6 ± 1.8 |
| Fat body mass (g) | 66 | 200.8 | 780.7 | 459.3 ± 119.8 |
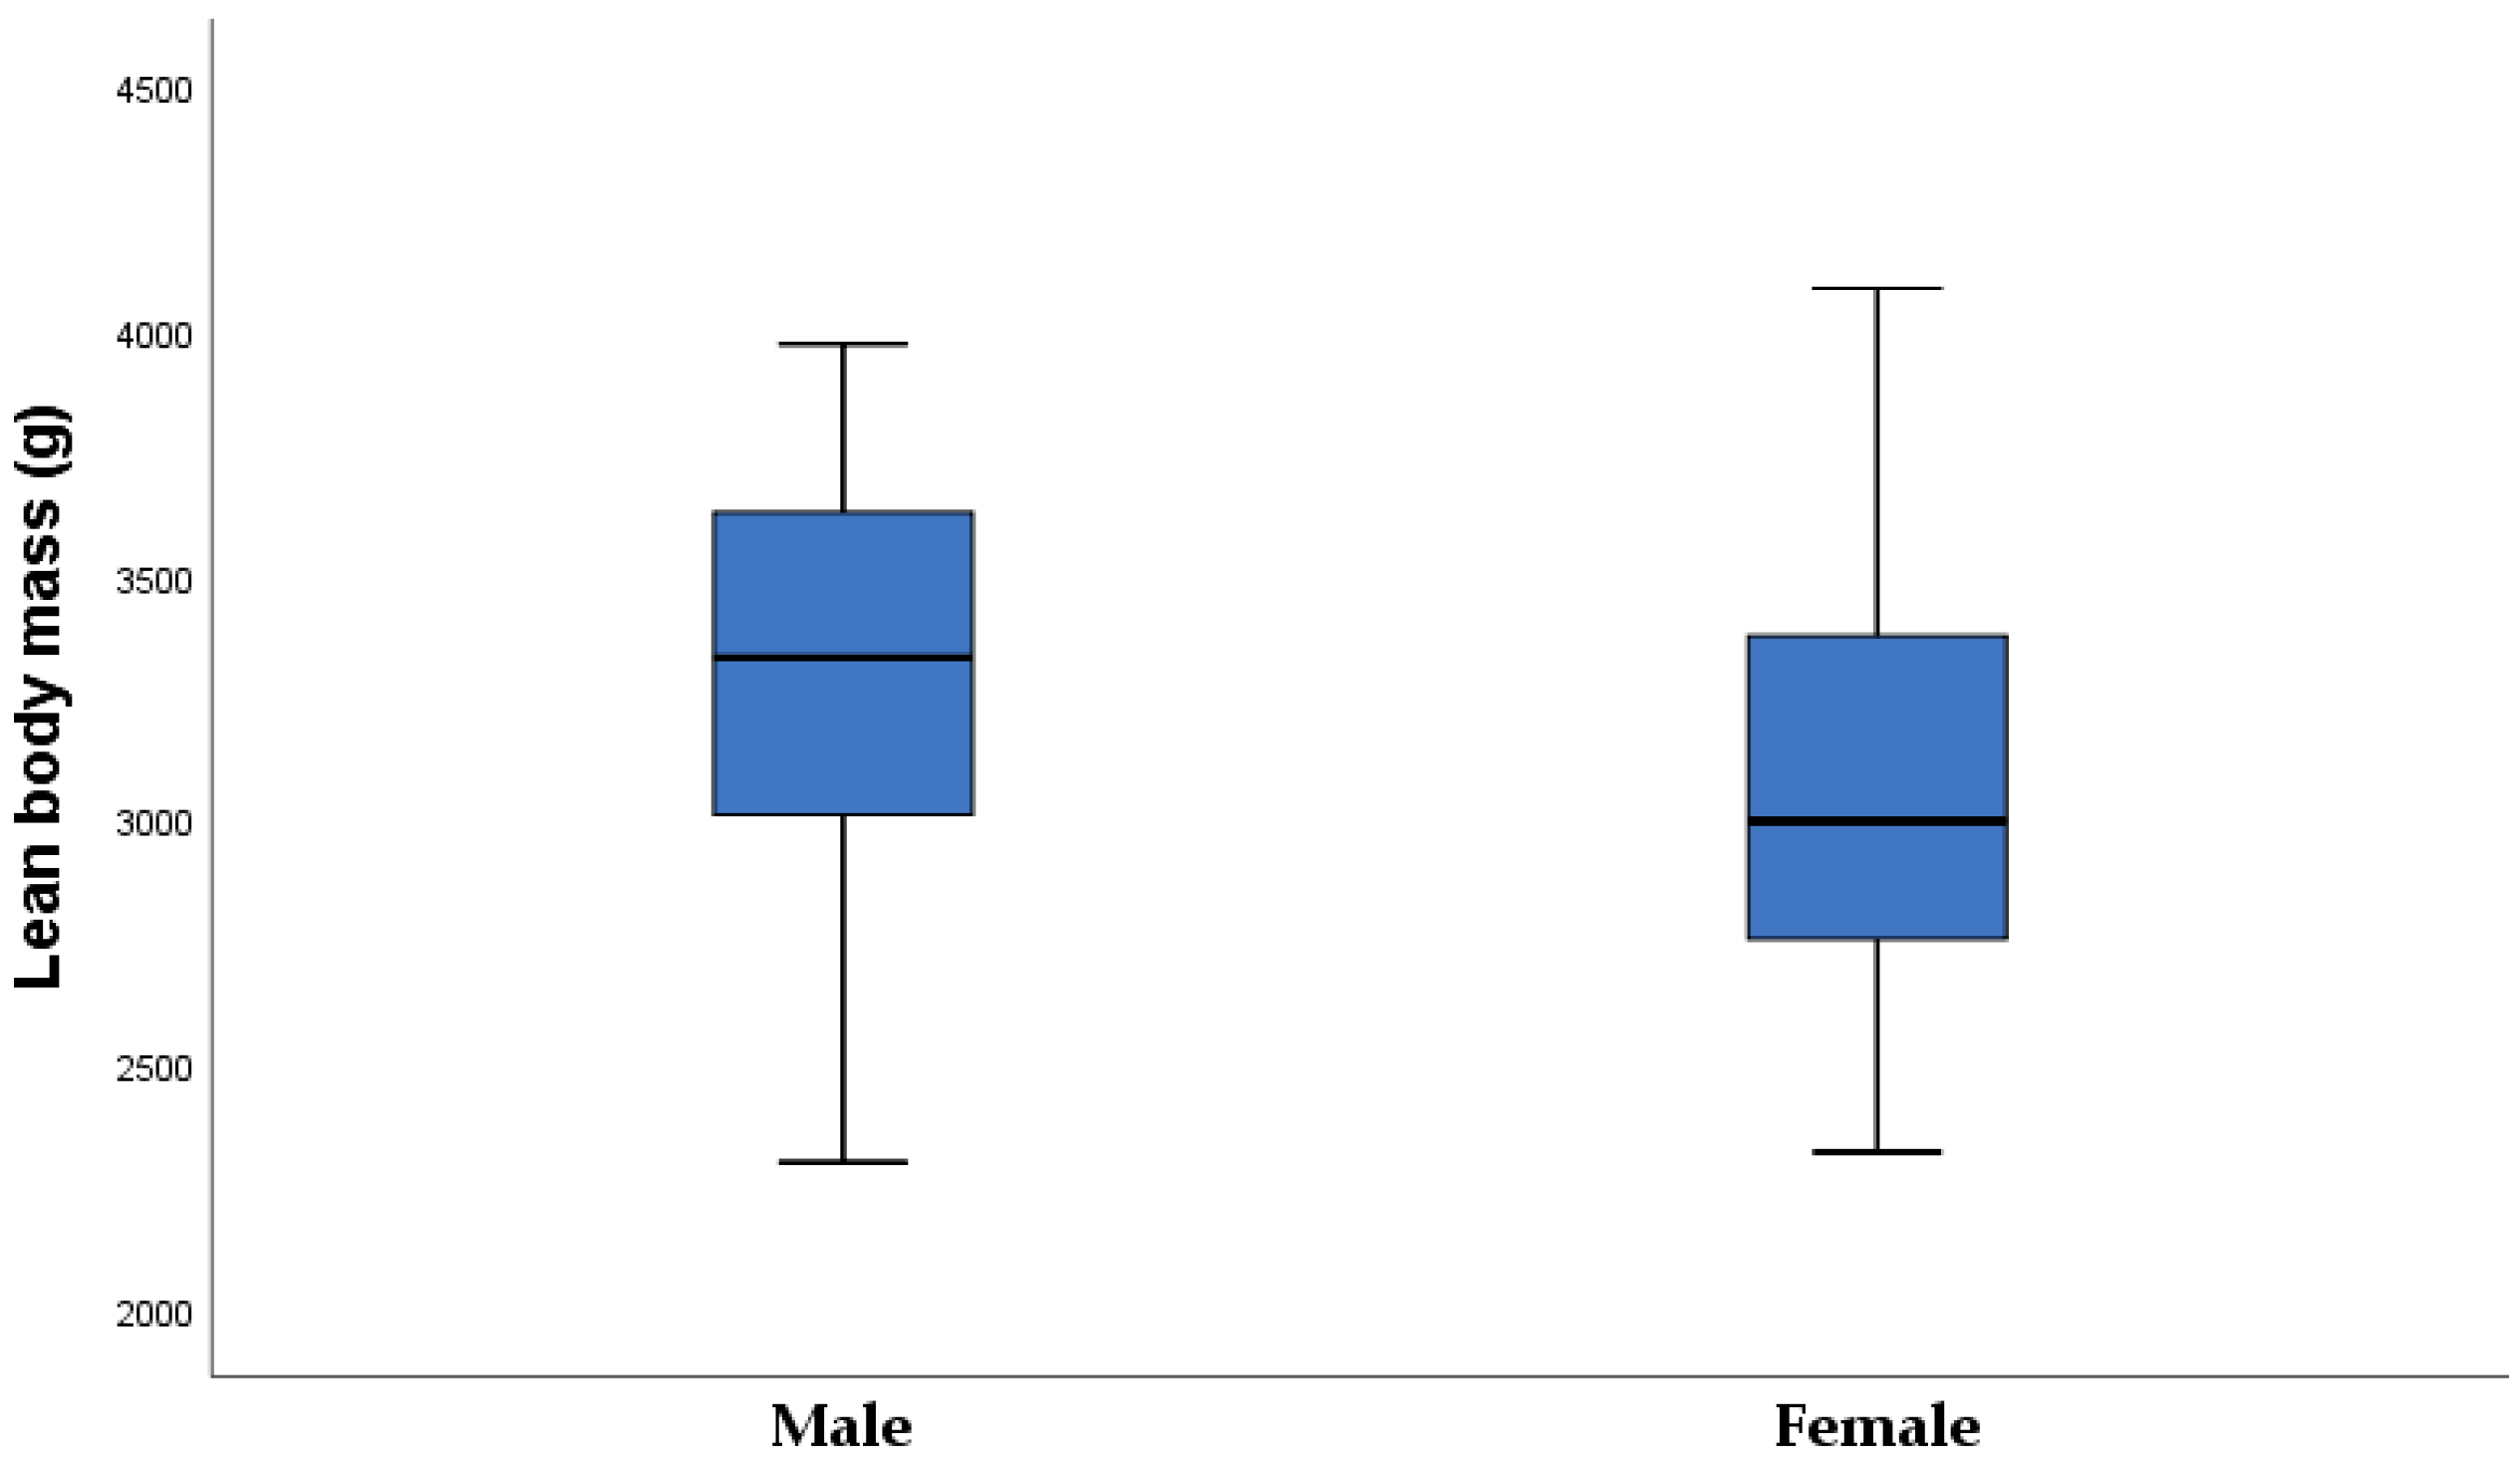
| Lean body mass (g) | 66 | 2299.2 | 4087.6 | 3155.4 ± 484.2 |
| Neonatal laboratory data | ||||
| pH in umbilical vein blood | 38 | 6.90 | 7.36 | 7.21 ± 0.08 |
| TSH in umbilical vein (mIU/L) | 59 | 1.44 | 14.52 | 5.6 ± 2.9 4.9 (3.7–6.6) |
| FT3 in umbilical vein (pmol/L) | 52 | 1.64 | 4.21 | 2.6 ± 0.6 |
| FT4 in umbilical vein (pmol/L) | 50 | 11.09 | 17.13 | 13.0 ± 1.3 |
| Glucose concentration in umbilical vein serum (mmol/L) | 60 | 1.1 | 11.6 | 4.6 ± 2.0 4.5 (3.1–5.3) |
| The ratio between maternal and umbilical vein serum glucose concentration (mmol/L) | 58 | 0.65 | 2.41 | 1.25 ± 0.37 1.2 (1.0–1.5) |
| C-peptide in umbilical vein serum (pmol/L) | 53 | 37 | 1015 | 820 (570–1380) |
| IR HOMA 2 in umbilical vein serum | 53 | 0.5 | 7.0 | 1.7 (1.1–3.2) |
| BDNF in umbilical vein serum (ng/L) | 60 | 81.8 | 903.3 | 304.7 (231.6–458.3) |
| Leptin in umbilical vein serum (ng/L) | 60 | 0.3 | 125.5 | 13.5 (8.9–27.1) |
| Variable | n | Healthy-Weight Neonates | n | Overweight Neonates | p |
|---|---|---|---|---|---|
| Age (years) | 42 | 31.4 ± 4.8 | 24 | 28.8 ± 5.7 | 0.049 |
| <30 years | 14 | 33.3% | 12 | 50.0% | 0.202 # |
| >30 years | 28 | 66.7% | 12 | 50.0% | |
| Duration of T1DM | 42 | 13.9 ± 9.8 | 24 | 15.0 ± 7.6 | 0.652 |
| Less than 8 years | 16 | 38.1% | 5 | 21.7% | 0.172 # |
| More than 8 years | 24 | 61.9% | 18 | 78.3% | |
| Years of onset of T1DM (years) | 42 | 15 (10–26) | 24 | 12 (8.5–17.0) | 0.142 |
| Before 10 years n% | 13 | 31.0% | 11 | 45.8% | 0.290 # |
| After 10 years n% | 29 | 69.0% | 13 | 54.2% | |
| Height (cm) | 42 | 166.9 ± 5.6 | 24 | 165.3 ± 4.7 | 0.253 |
| BMI before pregnancy (kg/m2) | 42 | 23.6 ± 5.0 | 24 | 24.4 ± 4.4 | 0.498 |
| BMI < 25 n (%) | 31 | 73.8% | 14 | 58.3% | 0.117 # |
| BMI 25–29.9 n (%) | 5 | 11.9% | 8 | 33.3% | |
| BMI ≥ 30 n (%) | 6 | 14.3% | 2 | 8.3% | |
| Obstetrical data | |||||
| Primiparous n (%) | 26 | 61.9% | 12 | 50.0% | 0.439 # |
| Multiparous n (%) | 16 | 38.1% | 12 | 50.0% | |
| Gestational age at delivery | 42 | 38.0 ± 1.0 | 24 | 38.1 ± 0.6 | 0.719 |
| Gestational weight gain (kg) | 42 | 12.4 ± 4.7 | 24 | 14.1 ± 4.2 | 0.151 |
| HbA1c first trimester (%) | 42 | 6.6 ± 1.0 | 24 | 7.1 ± 1.3 | 0.073 |
| HbA1c 1. trimester ≤6.5 (%) | 25 | 59.5% | 7 | 29.2% | 0.023 # |
| HbA1c 1. trimester ≥6.6 (%) | 17 | 40.5% | 17 | 70.9% | |
| Hypothyroidism NO | 19 | 47.5% | 12 | 52.2% | 0.797 # |
| Hypothyroidism YES | 21 | 52.5% | 11 | 47.8% | |
| TSH in first trimester (mIU/L) | 39 | 2.2 (1.4–3.0) | 23 | 2.7 (1.7–3.9) | 0.255 |
| FT3 in first trimester | 39 | 3.8 ± 0.5 | 23 | 3.9 ± 0.8 | 0.536 |
| FT4 in first trimester | 39 | 11.9 ± 1.3 | 23 | 11.5 ± 1.2 | 0.248 |
| BDNF first trimester (ng/L) | 40 | 752.8 (551.1–953.9) | 21 | 850.4 (626.4–1199.0) | 0.139 |
| Leptin first trimester (µg/L) | 39 | 15.1 (10.5–29.8) | 19 | 12.5 (8.5–25.7) | 0.278 |
| Variable | n | Healthy-Weight Neonates | n | Overweight Neonates | p |
|---|---|---|---|---|---|
| Male n (%) | 17 | 40.5% | 12 | 50.0% | 0.697 # |
| Female n (%) | 25 | 59.5% | 12 | 50.0% | |
| Term birth n (%) | 36 | 85.7% | 23 | 95.8% | 0.408 # |
| Preterm birth n (%) | 6 | 14.3% | 1 | 4.2% | |
| Birthweight (g) | 43 | 3414.8 ± 550.2 | 23 | 3964.6 ± 472.9 | <0.001 |
| Length (cm) | 43 | 49.5 ± 2.5 | 23 | 49.8 ± 1.8 | 0.670 |
| Z-score | 42 | 0.6 (0.1–0.8) | 24 | 1.8 (1.6–2.3) | <0.001 |
| Percentile (%) | 42 | 65.2 ± 18.5 | 24 | 99.1 ± 1.1 | <0.001 |
| Head circumference (cm) | 42 | 34.6 ± 1.8 | 24 | 35.2 ± 1.0 | 0.117 |
| Abdominal circumference (cm) | 42 | 32.8 ± 2.8 | 24 | 34.2 ± 2.1 | 0.038 |
| Apgar index at 1 min | 42 | 9.9 ± 0.3 | 24 | 9.9 ± 0.2 | 0.458 |
| Apgar index at 5 min | 42 | 9.8 ± 0.5 | 24 | 9.9 ± 0.3 | 0.342 |
| pH in umbilical vein blood | 25 | 7.19 ± 0.09 | 13 | 7.25 ± 0.04 | 0.052 |
| Skinfold thickness | |||||
| Subscapular (cm) | 42 | 5.3 ± 0.9 | 24 | 6.3 ± 1.3 | <0.001 |
| Abdomen (cm) | 42 | 3.8 ± 0.8 | 24 | 4.5 ± 1.1 | 0.006 |
| Biceps (cm) | 42 | 3.8 ± 0.8 | 24 | 44 ± 0.9 | 0.008 |
| Triceps (cm) | 42 | 4.9 ± 0.9 | 24 | 5.5 ± 0.9 | 0.011 |
| Femur (cm) | 42 | 6.4 ± 1.2 | 24 | 7.5 ± 1.4 | 0.002 |
| Sum skinfold thickness (cm) | 42 | 24.2 ± 3.4 | 24 | 28.2 ± 3.3 | <0.001 |
| Fat body mass percentage (%) | 42 | 12.0 ± 1.6 | 24 | 13.6 ± 1.7 | <0.001 |
| Fat body mass (g) | 42 | 410.7 ± 91.5 | 24 | 544.4 ± 117.4 | <0.001 |
| Lean body mass (g) | 42 | 3004.1 ± 477.2 | 24 | 3420.2 ± 378.2 | <0.001 |
| Umbilical vein serum laboratory data | |||||
| TSH in the umbilical vein | 37 | 5.1 (3.7–6.2) | 22 | 4.8 (3.9–6.6) | 0.913 |
| FT3 in umbilical vein | 33 | 2.4 (2.2–2.7) | 19 | 2.8 (2.1–3.3) | 0.093 |
| FT4 in umbilical vein | 31 | 12.3 (11.9–13.2) | 19 | 13.3 (12.7–14.5) | 0.002 |
| Glucose concentration in umbilical vein serum (mmol/L) | 35 | 4.6 (3.2–5.9) | 24 | 4.0 (3.5–4.9) | 0.254 |
| Maternal–umbilical vein serum glucose ratio concentration (mmol/L) | 34 | 1.0 (0.9–1.4) | 24 | 1.3 (1.1–1.5) | 0.013 |
| C-peptide in umbilical vein serum (nmol/L) | 35 | 0.78 (0.6–1.2) | 18 | 0.9 (0.5–1.6) | 0.735 |
| The ratio between glucose and C-peptide in umbilical vein serum | 31 | 5.3 (4.2–7.2) | 18 | 3.9 (2.9–5.9) | 0.062 |
| IR HOMA 2 in umbilical vein | 35 | 1.7 (1.4–2.6) | 18 | 1.8 (1.0–3.2) | 0.985 |
| BDNF in umbilical vein serum (ng/L) | 39 | 303.6 (253.2–388.2) | 21 | 433.0 (230.0–528.0) | 0.443 |
| Leptin in umbilical vein serum (ng/L) | 38 | 13.5 (8.5–22.9) | 22 | 13.2 (9.4–29.2) | 0.510 |
| First Trimester of Pregnancy | |||
|---|---|---|---|
| OR | 95% CI | p Value | |
| Age of patients (y) | 0.875 | 0.717–1.067 | 0.186 |
| Duration of type-1 diabetes (y) | 0.905 | 0.765–1.070 | 0.242 |
| Primiparous/multiparous | 0.227 | 0.031–1674 | 0.146 |
| HbA1c (%) in first trimester | 1.146 | 0.571–2.300 | 0.702 |
| BMI before pregnancy | 2.171 | 1.120–4.209 | 0.022 |
| Leptin in first trimester | 0.760 | 0.603–0.957 | 0.020 |
| BDNF in first trimester | 1.003 | 1.001–1.006 | 0.025 |
| TSH in first trimester | 2.467 | 1007–6.004 | 0.048 |
Disclaimer/Publisher’s Note: The statements, opinions and data contained in all publications are solely those of the individual author(s) and contributor(s) and not of MDPI and/or the editor(s). MDPI and/or the editor(s) disclaim responsibility for any injury to people or property resulting from any ideas, methods, instructions or products referred to in the content. |
© 2023 by the authors. Licensee MDPI, Basel, Switzerland. This article is an open access article distributed under the terms and conditions of the Creative Commons Attribution (CC BY) license (https://creativecommons.org/licenses/by/4.0/).
Share and Cite
Delmis, J.; Oreskovic, S.; Elvedji Gasparovic, V.; Starcevic, M.; Herman, M.; Dessardo, N.; Starcevic, V.; Ivanisevic, M. Relationship of Glucose, C-peptide, Leptin, and BDNF in Maternal and Umbilical Vein Blood in Type-1 Diabetes. Nutrients 2023, 15, 600. https://doi.org/10.3390/nu15030600
Delmis J, Oreskovic S, Elvedji Gasparovic V, Starcevic M, Herman M, Dessardo N, Starcevic V, Ivanisevic M. Relationship of Glucose, C-peptide, Leptin, and BDNF in Maternal and Umbilical Vein Blood in Type-1 Diabetes. Nutrients. 2023; 15(3):600. https://doi.org/10.3390/nu15030600
Chicago/Turabian StyleDelmis, Josip, Slavko Oreskovic, Vesna Elvedji Gasparovic, Mirta Starcevic, Mislav Herman, Nada Dessardo, Vito Starcevic, and Marina Ivanisevic. 2023. "Relationship of Glucose, C-peptide, Leptin, and BDNF in Maternal and Umbilical Vein Blood in Type-1 Diabetes" Nutrients 15, no. 3: 600. https://doi.org/10.3390/nu15030600