
Non-Traditional Cardiovascular Risk Factors in Adolescents with Obesity and Metabolic Syndrome May Predict Future Cardiovascular Disease
 , , , , ,
  , , and
Abstract
:1. Introduction
2. Aim
3. Subjects and Methods
3.1. Study Design
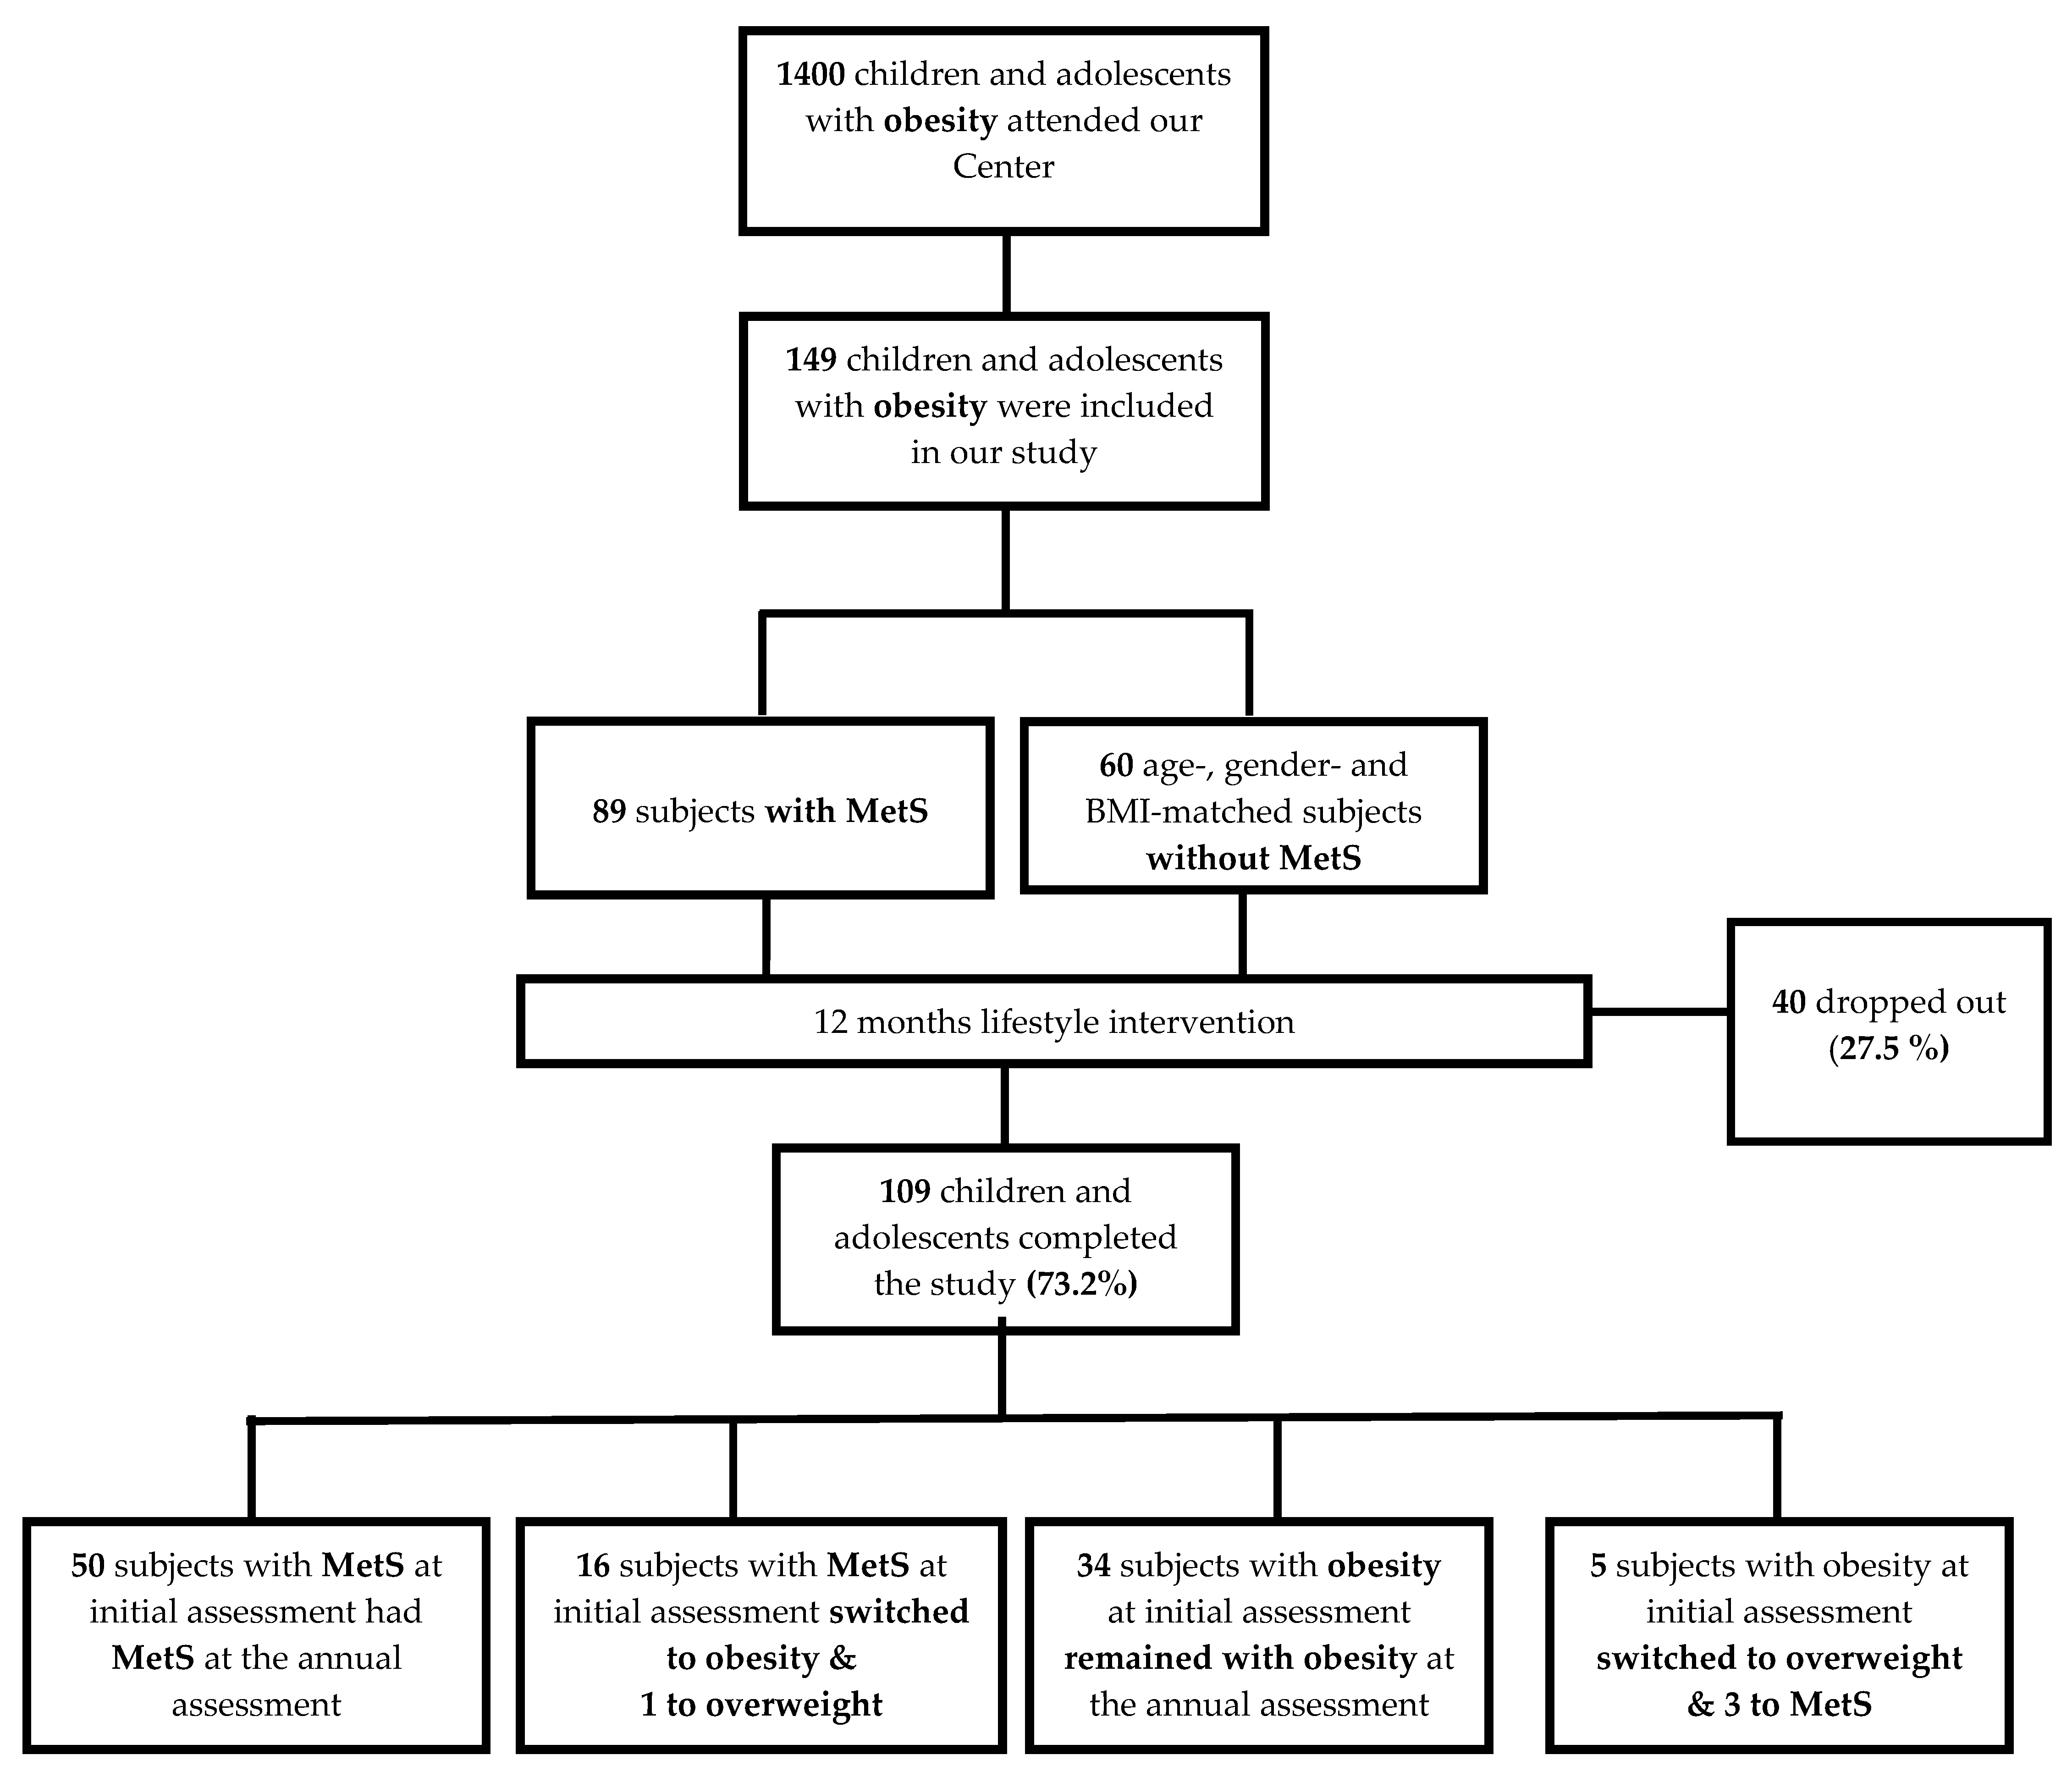
3.2. Participants
3.3. Study Protocol
3.3.1. Initial Assessment
3.3.2. Intervention
3.3.3. Annual Assessment
3.4. Assays
3.5. Echocardiography
3.6. Statistical Analysis
4. Results
4.1. Clinical Characteristics, Anthropometric Parameters, and Hematologic, Biochemical, and Endocrinologic Investigations
4.2. Traditional Cardiovascular Risk Factors
4.3. Non-Traditional Cardiovascular Risk Factors
4.4. Echocardiography and Ultrasonography
4.5. Predictors of Carotid Intima-Media Thickness (Table 7)
4.6. Limitations
5. Discussion
6. Conclusions
Author Contributions
Funding
Institutional Review Board Statement
Informed Consent Statement
Data Availability Statement
Acknowledgments
Conflicts of Interest
References
- Benjamin, E.J.; Virani, S.S.; Callaway, C.W.; Chamberlain, A.M.; Chang, A.R.; Cheng, S.; Chiuve, S.E.; Cushman, M.; Delling, F.N.; Deo, R.; et al. Heart Disease and Stroke Statistics-2018 Update: A Report From the American Heart Association. Circulation 2018, 12, 67–492. [Google Scholar] [CrossRef]
- Berenson, G.S.; Srinivasan, S.R.; Bao WBerenson, G.S.; Srinivasan, S.R.; Bao, W. Precursors of cardiovascular risk in young adults from a biracial (black-white) population: The Bogalusa Heart Study. Ann. N. Y. Acad. Sci. 1997, 817, 189–198. [Google Scholar] [CrossRef]
- Strong, J.P.; Malcom, G.T.; McMahan, C.A.; Tracy, R.E.; Newman, W.P.; Herderick, E.E.; Cornhill, J.F. Prevalence and extent of atherosclerosis in adolescents and young adults: Implications for prevention from the Pathobiological Determinants of Atherosclerosis in Youth Study. JAMA 1999, 281, 727–735. [Google Scholar] [CrossRef] [PubMed]
- McGill HCJr McMahan, C.A.; Herderick, E.E.; Malcom, G.T.; Tracy, R.E.; Strong, J. Origin of atherosclerosis in childhood and adolescence. Am. J. Clin. Nutr. 2000, 72 (Suppl. 5), 1307S–1315S. [Google Scholar] [CrossRef] [PubMed]
- Valle, M.; Martos, R.; Gascón, F.; Cañete, R.; Zafra, M.A.; Morales, R. Low-grade systemic inflammation, hypoadiponectinemia and a high concentration of leptin are present in very young obese children, and correlate with metabolic syndrome. Diabetes Metab. 2005, 31, 55–62. [Google Scholar] [CrossRef] [PubMed]
- Desideri, G.; De Simone, M.; Iughetti, L.; Rosato, T.; Iezzi, M.L.; Marinucci, M.C.; Cofini, V.; Croce, G.; Passacquale, G.; Necozione, S.; et al. Early activation of vascular endothelial cells and platelets in obese children. J. Clin. Endocrinol. Metab. 2005, 90, 3145–3152. [Google Scholar] [CrossRef]
- Lamprokostopoulou, A.; Moschonis, G.; Manios, Y.; Critselis, E.; Nicolaides, N.C.; Stefa, A.; Koniari, E.; Gagos, S.; Charmandari, E. Childhood obesity and leucocyte telomere length. Eur. J. Clin. Investig. 2019, 49, e13178. [Google Scholar] [CrossRef]
- Toupance, S.; Karampatsou, S.I.; Labat, C.; Genitsaridi, S.M.; Tragomalou, A.; Kassari, P.; Soulis, G.; Hollander, A.; Charmandari, E.; Benetos, A. Longitudinal Association of Telomere Dynamics with Obesity and Metabolic Disorders in Young Children. Nutrients 2022, 14, 5191. [Google Scholar] [CrossRef]
- Alberti, K.G.; Eckel, R.H.; Grundy, S.M.; Zimmet, P.Z.; Cleeman, J.I.; Donato, K.A.; Fruchart, J.C.; James, W.P.; Loria, C.M.; Smith, S.C. Harmonizing the metabolic syndrome: A joint interim statement of the international diabetes federation task force on epidemiology and prevention; national heart, lung, and blood institute; American heart association; world heart federation; international atherosclerosis society; and international association for the study of obesity. Circulation 2009, 120, 1640–1645. [Google Scholar]
- Esser, N.; Legrand-Poels, S.; Piette, J.; Scheen, A.J.; Paquot, N. Inflammation as a link between obesity, metabolic syndrome and type 2 diabetes. Diabetes Res. Clin. Pract. 2014, 105, 141–150. [Google Scholar] [CrossRef]
- Heymsfield, S.B.; Wadden, T.A. Mechanisms, pathophysiology, and management of obesity. N. Engl. J. Med. 2017, 373, 254–266. [Google Scholar] [CrossRef] [PubMed]
- Miller, J.M.; Kaylor, M.B.; Johannsson, M.; Bay, C.; Churilla, J.R. Prevalence of metabolic syndrome and individual criterion in US adolescents: 2001-2010 National Health and Nutrition Survey. Metab. Syndr. Relat. Disord. 2014, 12, 527–532. [Google Scholar] [CrossRef] [PubMed]
- Sperling, L.S.; Mechanick, J.I.; Neeland, I.J.; Herrick, C.J.; Després, J.P.; Ndumele, C.E.; Vijayaraghavan, K.; Handelsman, Y.; Puckrein, G.A.; Araneta, M.R.G. The cardiometabolic health alliance working toward a new care model for the metabolic syndrome. Cardiology 2015, 66, 1050–1067. [Google Scholar]
- Zimmet, P.; Alberti, K.G.; Kaufman, F.; Tajima, N.; Silink, M.; Arslanian, S.; IDF Consensus Group. The metabolic syndrome in children and adolescents—An IDF consensus. The metabolic syndrome in children and adolescents—An IDF consensus report. Pediatr. Diabetes 2007, 8, 299–306. [Google Scholar] [CrossRef]
- Wang, Y.; Ma, X.L.; Lau, W.B. Cardiovascular Adiponectin Resistance: The Critical Role of Adiponectin Receptor Modification. Trends Endocrinol. Metab. 2017, 28, 519–530. [Google Scholar] [CrossRef]
- Walldius, G.; Jungner, I.; Aastveit, A.H.; Holme, I.; Furberg, C.D.; Sniderman, A.D. The apoB/apoA-I ratio is better than the cholesterol ratios to estimate the balance between plasma proatherogenic and antiatherogenic lipoproteins and to predict coronary risk. Clin. Chem. Lab. Med. 2004, 42, 1355–1363. [Google Scholar] [CrossRef]
- Buturak, A.; Değirmencioğlu, A.; Bayrak, F.; Kırış, T.; Karakurt, H.; Demir, A.R.; Sürgit, Ö.; Ertürk, M. Elective percutaneous coronary intervention leads to significant changes in serum resistin, leptin, and adiponectin levels regardless of periprocedural myocardial injury: An observational study. Anatol. J.Cardiol. 2016, 16, 940–946. [Google Scholar] [CrossRef]
- Cheung, C.Y.; Hui, E.Y.; Cheung, B.M.; Woo, Y.C.; Xu, A.; Fong, C.H.; Ong, K.L.; Yeung, C.Y.; Janus, E.D.; Tse, H.F.; et al. Adiponectin gene variants and the risk of coronary heart disease: A 16-year longitudinal study. Eur. J. Endocrinol. 2014, 171, 107–115. [Google Scholar] [CrossRef]
- Blüher, M.; Fasshauer, M.; Tönjes, A.; Kratzsch, J.; Schön, M.R.; Paschke, R. Association of interleukin-6, C-reactiveprotein, IL-10 & adiponectin plasma concentrations with measures of obesity, insulin sensitivity and glucose metabolism. Exp. Clin. Endocrinol. Diabetes 2005, 113, 534–537. [Google Scholar]
- Genitsaridi, S.M.; Giannios, C.; Karampatsou, S.; Papageorgiou, I.; Papadopoulos, G.; Farakla, I.; Koui, E.; Georgiou, A.; Romas, S.; Terzioglou, E.; et al. A Comprehensive Multidisciplinary Management Plan Is Effective in Reducing the Prevalence of Overweight and Obesity in Childhood and Adolescence. Horm. Res. Paediatr. 2020, 93, 94–107. [Google Scholar] [CrossRef]
- Karampatsou, S.I.; Genitsaridi, S.M.; Michos, A.; Kourkouni, E.; Kourlaba, G.; Kassari, P.; Manios, Y.; Charmandari, E. The Effect of a Life-Style Intervention Program of Diet and Exercise on Irisin and FGF-21 Concentrations in Children and Adolescents with Overweight and Obesity. Nutrients 2021, 13, 1274. [Google Scholar] [CrossRef] [PubMed]
- Paltoglou, G.; Raftopoulou, C.; Nicolaides, N.; Genitsaridi, S.M.; Karampatsou, S.I.; Papadopoulou, M.; Kassari, P.; Charmandari, E. A Comprehensive, Multidisciplinary, Personalized, Lifestyle Intervention Program Is Associated with Increased Leukocyte Telomere Length in Children and Adolescents with Overweight and Obesity. Nutrients 2021, 13, 2682. [Google Scholar] [CrossRef]
- Kassari, P.; Papaioannou, P.; Billiris, A.; Karanikas, H.; Eleftheriou, S.; Thireos, E.; Manios, Y.; Chrousos, G.P.; Charmandari, E. Electronic registry for the management of childhood obesity in Greece. Eur. J. Clin. Investig. 2018, 48, e12887. [Google Scholar] [CrossRef] [PubMed]
- Tragomalou, A.; Moschonis, G.; Kassari, P.; Papageorgiou, I.; Genitsaridi, S.M.; Karampatsou, S.; Manios, Y.; Charmandari, E. A National e-Health Program for the Prevention and Management of Overweight and Obesity in Childhood and Adolescence in Greece. Nutrients 2020, 12, 2858. [Google Scholar] [CrossRef] [PubMed]
- World Health Organisation (WHO). Waist Circumference and Waist–Hip Ratio: Report of a WHO Expert Consultation, Geneva, 8–11 December 2008. World Health Organ 2008, 64, 8–11. [Google Scholar]
- Conway, J.M.; Ingwersen, L.A.; Moshfegh, A.J. Accuracy of dietary recall using the USDA fivestep multiple-pass method in men: An observational validation study. J. Am. Diet. Assoc. 2004, 104, 595–603. [Google Scholar] [CrossRef]
- Paruthi, S.; Brooks, L.J.; Ambrosio, C.; Hall, W.A.; Kotagal, S.; Lloyd, R.M.; Malow, B.A.; Maski, K.; Nichols, C.; Quan, S.F.; et al. Consensus Statement of the American Academy of Sleep Medicine on the Recommended Amount of Sleep for Healthy Children: Methodology and Discussion. J. Clin. Sleep Med. 2016, 12, 1549–1561. [Google Scholar] [CrossRef]
- Kastorini, C.-M.; Critselis, E.; Zota, D.; Coritsidis, A.; Nagarajan, M.; Papadimitriou, E.; Belogianni, K.; Benetou, V.; Linos, A. Greek National Dietary Guidelines Scientific Team National Dietary Guidelines of Greece for children and adolescents: A tool for promoting healthy eating habits. Public. Health Nutr. 2019, 14, 2688–2699. [Google Scholar] [CrossRef]
- Stavrou, S.; Nicolaides, N.C.; Papageorgiou, I.; Papadopoulou, P.; Terzioglou, E.; Chrousos, G.P.; Darviri, C.; Charmandari, E. The effectiveness of a stress-management intervention program in the management of overweight and obesity in childhood and adolescence. J. Mol. Biochem. 2016, 5, 63–70. [Google Scholar]
- Moschonis, G.; Michalopoulou, M.; Tsoutsoulopoulou, K.; Vlachopapadopoulou, E.; Michalacos, S.; Charmandari, E.; Chrousos, G.P.; Manios, Y. Assessment of the Effectiveness of a Computerised Decision-Support Tool for Health Professionals for the Prevention and Treatment of Childhood Obesity. Results from a Randomised Controlled Trial. Nutrients 2019, 11, 706. [Google Scholar] [CrossRef]
- Birmpilis, A.I.; Karachaliou, C.E.; Samara, P.; Ioannou, K.; Selemenakis, P.; Kostopoulos, I.V.; Kavrochorianou, N.; Kalbacher, H.; Livaniou, E.; Haralambous, S.; et al. Antitumor reactive T-cell responses are enhanced in Vivo by DAMP prothymosin alpha and its C-terminal decapeptide. Cancers 2019, 11, 1764. [Google Scholar] [CrossRef] [PubMed]
- Bozkurt, B.; Aguilar, D.; Deswal, A.; Dunbar, S.B.; Francis, G.S.; Horwich, T.; Yancy, C. Contributory risk and management of comorbidities of hypertension, obesity, diabetes mellitus, hyperlipidemia and metabolic syndrome in chronic heart failure: A scientific statement from the American Heart Association. Circulation 2016, 134, 535–578. [Google Scholar] [CrossRef]
- Flynn, J.T.; Daniels, S.R.; Hayman, L.L.; Maahs, D.M.; McCrindle, B.W.; Mitsnefes, M.; Zachariah, J.P.; Urbina, E.M.; On Behalf of the American Heart Association. Atherosclerosis, Hypertension and Obesity in Youth Committee of the Council on Cardiovascular Disease in the Young (2014) Update: Ambulatory Blood Pressure Monitoring in Children and Adolescents: A Scientific Statement From the American Heart Association. Hypertension 2014, 63, 1116–1135. [Google Scholar] [CrossRef]
- McLaughlin, T.; Reaven, G.; Abbasi, F.; Lamendola, C.; Saad, M.; Waters, D.; Simon, J.; Krauss, R.M. Is there a simple way to identify insulin-resistant individuals atincreased risk of cardiovascular disease? Am. J. Cardiol. 2005, 96, 399–404. [Google Scholar] [CrossRef]
- Grover, S.A.; Levington, C.; Paquet, S. Identifying adults at low risk for significant hyperlipidemia: A validated clinical index. J. Clin. Epidemiol. 1999, 52, 49–55. [Google Scholar] [CrossRef] [PubMed]
- Musso, C.; Graffigna, M.; Soutelο, J.; Honfi, M.; Ledesma, L.; Miksztowicz, V.; Pazos, M.; Migliano, M.; Schreier, L.E.; Berg, G.A. Cardiometabolic risk factors as apolipoprotein B, triglyceride/HDL-cholesterol ratio and C-reactive protein, in adolescents with and without obesity: Cross-sectional study in middle class suburban children. Pediatr. Diabetes 2011, 12, 229–234. [Google Scholar] [CrossRef]
- Sellers, E.A.; Singh, G.R.; Sayers, S.M. Apo-B/AI ratio identifies cardiovascular risk in childhood: The Australian Aboriginal Birth Cohort study. Diabetes Vasc. Dis. Res. 2009, 2, 94–99. [Google Scholar] [CrossRef] [PubMed]
- Okamoto, M.; Ohara-Imaizumi, M.; Kubota, N.; Hashimoto, S.; Eto, K.; Kanno, T.; Kubota, T.; Wakui, M.; Nagai, R.; Noda, M.; et al. Adiponectin induces insulin secretion in vitro and in vivo at a low glucose concentration. Diabetologia 2008, 51, 827–835. [Google Scholar] [CrossRef]
- Rabe, K.; Lehrke, M.; Parhofer, K.G.; Broedl, U.C. Adipokines and insulin resistance. Mol. Med. 2008, 14, 741–751. [Google Scholar] [CrossRef]
- Hidekatsu, Y.; Hiroshi, Y. Beneficial Effects of Adiponectin on Glucose and Lipid Metabolism and Atherosclerotic Progression: Mechanisms and Perspectives. Int. J. Mol. Sci. 2019, 20, 1190. [Google Scholar]
- Bittencourt, C.; Piveta, V.M.; Oliveira, C.S.; Crispim, F.; Meira, D.; Saddi-Rosa, P.; Giuffrida, F.; Reis, A.F. Association of classical risk factors and coronary artery disease in type 2 diabetic patients submitted to coronary angiography. Diabetol. Metab. Syndr. 2014, 6, 46. [Google Scholar] [CrossRef] [PubMed]
- Javier, A.; Magaña, G.; Daniela, M.-M.; Carla, E.; Angulo Rojo, G.; de la Peña, D. Association of Total and High Molecular Weight Adiponectin with Components of Metabolic Syndrome in Mexican Children. J. Clin. Res. Peadiatric Endocrinol. 2020, 3, 180–188. [Google Scholar]
- Francisco, V.; Pino, J.; Campos-Cabaleiro, V.; Ruiz-Fernández, C.; Mera, A.; Gonzalez-Gay, M.A.; Gualillo, O. Obesity, Fat Mass and Immune System: Role for Leptin. Front. Physiol. 2018, 9, 640. [Google Scholar] [CrossRef] [PubMed]
- Ghadge, A.A.; Khaire, A.A. Leptin as a predictive marker for metabolic syndrome. Cytokine 2019, 121, 154735. [Google Scholar] [CrossRef]
- Madeira, I.; Bordallo, M.A.; Rodrigues, N.C.; Carvalho, C.; Gazolla, F.; Collett-Solberg, P.; Medeiros Cl Bordallo, A.P.; Borges, M.; Monteiro, C.; Ribeiro, R. Leptin as a predictor of metabolic syndrome in prepupertal children. Arch. Endocrinol. Metab. 2017, 61, 7–13. [Google Scholar] [CrossRef]
- Ge, L.; Linxin, X.; Yanglu, Z.; Lujiao, L.; Junling, F.; Qian, Z.; Naishi, L.; Xinhua, X.; Changhong, L.; Jie, M.; et al. Leptin-adiponectin imbalance as a marker of metabolic syndrome among Chinese childrenand adolescents: The BCAMS study. PLoS ONE 2017, 12, e0186222. [Google Scholar]
- Budak, N.; Yazici, C.; Oztürk, A.; Bayram, F.; Mazicioğlu, M.M.; Kurtoglu, S. Is plasma homocysteine level associated with metabolic syndrome components in adolescents? Metab. Syndr. Relat. Disord. 2009, 7, 357–362. [Google Scholar] [CrossRef]
- Soriano-Guille, L.; Hernandez-Garcı, B.; Pita, J.; Domınguez-Garrido, N.; Del Rıo-Camacho, G.; Rovira, A. High-sensitivity C-reactive protein is a good marker of cardiovascular risk in obese children and adolescents. Eur. Endocrinol. 2008, 159, R1–R4. [Google Scholar] [CrossRef]
- Kim, J.H.; Lim, J.S. The association between C-reactive protein, metabolic syndrome, and prediabetes in Korean children and adolescents. Ann. Pediatr. Endocrinol. Metabol. 2022, 4, 273–280. [Google Scholar] [CrossRef]
- Paltoglou, G.; Schoina, M.; Valsamakis, G.; Salakos, N.; Avloniti, A.; Chatzinikolaou, A.; Margeli, A.; Skevaki, C.; Papagianni, M.; Kanaka-Gantenbein, C.; et al. Interrelations among the adipocytokines leptin and adiponectin, oxidative stress and aseptic inflammation markers in pre- andearly-pubertal normal-weight and obese boys. Sci. Bus. Media N. Y. 2017, 55, 925–933. [Google Scholar]
- Roberts, J.; Fallon, P.; Hams, E. The Pivotal Role of Macrophages in Metabolic Distress. In Macrophage Activation-Biology and Disease; IntechOpen: London, UK, 2019. [Google Scholar]
- Pozza, R.; Ehringer-Schetitska, D.; Fritsch, P.; Jokinen, E.; Petropoulos, A.; Oberhoffer, R. Intima media thickness measurement in children: A statement from the Association for European Paediatric Cardiology (AEPC) Working Group on Cardiovascular Prevention endorsed by the Association for European Paediatric Cardiology. Atherosclerosis 2015, 238, 380–387. [Google Scholar] [CrossRef] [PubMed]
- Stein, J.H.; Korcarz, C.E.; Hurst, R.T.; Lonn, E.; Kendall, C.B.; Mohler, E.R.; Najjar, S.S.; Rembold, C.M.; Post, W.S. Use of carotid ultrasound to identify subclinical vascular disease and evaluate cardiovascular disease risk: A consensus statement from the American Society of Echocardiography Carotid Intima-Media Thickness Task Force endorsed by the Society for Vascular Medicine. J. Am. Soc. Echocardiogr. 2008, 2, 93–111. [Google Scholar]
- Younossi, Z.M. Non-alcoholic fatty liver disease—A global public health perspective. J. Hepatol. 2019, 70, 531–544. [Google Scholar] [CrossRef] [PubMed]
- Pacifico, L.; Perla, F.M.; Roggini, M.; Andreoli, G.; D’Avanzo, M.; Chiesa, C. A Systematic Review of NAFLD-Associated Extrahepatic Disorders in Youths. J. Clin. Med. 2019, 18, 868. [Google Scholar] [CrossRef]


| A. Anthropometry | Initial Assessment (n = 149) | Annual Assessment (n = 109) | PBetween Time-Points | ||||
| Obesity without MetS | Obesity with MetS | Pwithin Baseline | Obesity without MetS at Initial Assessment | Obesity with MetS at Initial Assessment | Pwithin Follow-Up | ||
| Age (years) | 12.05 ± 0.28 | 13.19 ± 0.20 | NS | 13.39 ± 0.33 * | 14.30± 0.23 * | NS | <0.01/<0.01 |
| Body weight (kg) | 77.13 ± 1.77 | 96.50 ± 1.98 | <0.01 | 83.15 ± 2.20 * | 100.81 ± 2.10 * | <0.01 | <0.01/<0.01 |
| Height (cm) | 155.57 ± 1.25 | 163.74 ± 1.12 | <0.01 | 161.40 ± 1.36 * | 167.61 ± 1.22 * | <0.01 | <0.01/<0.01 |
| BMI (kg/m2) | 31.65 ± 0.43 | 35.32 ± 0.62 | <0.01 | 31.77 ± 0.58 | 35.62 ± 0.53 * | <0.01 | NS/<0.05 |
| Waist (cm) | 93.56 ± 0.9 | 107.15 ± 1.35 | <0.01 | 92.82 ± 1.71 | 107.22 ± 1.48 | <0.01 | NS/NS |
| Hip (cm) | 103.84 ± 1.27 | 113.19 ± 1.00 | <0.01 | 106.10 ± 1.86 | 115.41 ± 1.14 * | <0.01 | NS/<0.01 |
| Waist to Hip ratio (WHR) | 0.90 ± 0.01 | 0.95 ± 0.01 | <0.01 | 0.88 ± 0.01 * | 0.93 ± 0.01 * | <0.01 | <0.01/<0.01 |
| Waist to Height ratio (WHtR) | 0.60 ± 0.01 | 0.65 ± 0.01 | <0.01 | 0.58 ± 0.01 * | 0.64 ± 0.01 | <0.01 | <0.05/NS |
| B. Hematology | Initial Assessment (n = 149) | Annual Assessment (n = 109) | PBetween time-points | ||||
| Obesity without MetS | Obesity with MetS | Pwithin baseline | Obesity without MetS at Initial Assessment | Obesity with MetS at Initial Assessment | Pwithin follow-up | ||
| White Blood Cells (WBC) × 103/μL | 7.98 ± 0.27 | 8.09 ± 0.21 | NS | 8.18 ± 0.29 | 7.90 ± 0.24 | NS | NS/NS |
| Red Blood Cells (RBC) × 1003/μL | 4.98 ± 0.06 | 5.09 ± 0.05 | NS | 4.98 ± 0.07 | 5.22 ± 0.17 | NS | NS/NS |
| Hemoglobin (Hb) g/dL | 13.07 ± 0.12 | 13.10 ± 0.13 | NS | 13.08 ± 0.15 | 13.75 ± 0.52 | NS | NS/NS |
| Hematocrit (Hct)% | 40.61 ± 0.34 | 40.63 ± 0.37 | NS | 41.00 ± 0.48 | 42.11 ± 0.81 * | NS | NS/<0.05 |
| Platelets (PLT) × 103/μL | 306.29 ± 9.10 | 336.18 ± 28.52 | NS | 309.46 ± 13.59 | 299.06 ± 9.13 | NS | NS/NS |
| C. Biochemistry | Initial Assessment (n = 149) | Annual Assessment (n = 109) | PBetween time-points | ||||
| Obesity without MetS | Obesity with MetS | Pwithin baseline | Obesity without MetS at Initial Assessment | Obesity with MetS at Initial Assessment | Pwithin follow-up | ||
| Urea (mg/dL) | 27.32 ± 0.77 | 26.34 ± 0.70 | NS | 26.99 ± 1.06 | 27.02 ± 0.69 | NS | NS/NS |
| Creatinine (mg/dL) | 0.57 ± 0.01 | 0.81 ± 0.20 | NS | 0.64 ± 0.02 * | 0.68 ± 0.02 * | NS | <0.01/<0.01 |
| Uric Acid (mg/dL) | 5.22 ± 0.14 | 5.62 ± 0.12 | NS | 5.45 ± 0.19 | 5.82 ± 0.15 | NS | NS/NS |
| Potassium (K) (mmol/L) | 4.41 ± 0.07 | 4.39 ± 0.03 | NS | 4.60 ± 0.06 * | 4.59 ± 0.04 * | NS | <0.01/<0.01 |
| Sodium (Na) (mmol/L) | 140.39 ± 0.18 | 140.65 ± 0.17 | NS | 140.28 ± 0.27 | 140.61 ± 0.19 | NS | NS/NS |
| Aspartate Transaminase (AST) (U/L) | 20.54 ± 1.16 | 21.17 ± 0.74 | NS | 19.26 ± 0.69 | 21.55 ± 1.28 | NS | NS/NS |
| Alanine Transaminase (ALT) (U/L) | 23.59 ± 2.20 | 28.82 ± 2.05 | NS | 20.50 ± 1.55 | 29.33 ± 3.72 | <0.05 | NS/NS |
| γ- aminobutyrate Transaminase (γ-GT) (U/L) | 14.81 ± 0.69 | 20.22 ± 2.29 | NS | 15.42 ± 1.16 | 18.85 ± 1.43 | NS | NS/NS |
| Albumin (g/dL) | 4.67 ± 0.05 | 4.61 ± 0.03 | NS | 4.61 ± 0.03 | 4.67 ± 0.03 | NS | NS/NS |
| Alkaline Phosphatase (U/L) | 212.36 ± 11.71 | 200.62 ± 9.45 | NS | 174.95 ± 14.86 * | 178.56 ± 10.38 * | NS | <0.01/<0.01 |
| Phosphate (mg/dL) | 4.66 ± 0.07 | 4.53 ± 0.08 | NS | 4.55 ± 0.09 | 0.49 ± 0.07 | NS | NS/NS |
| Calcium (Ca) (mg/dL) | 9.79 ± 0.04 | 9.77 ± 0.03 | NS | 9.78 ± 0.05 | 9.75 ± 0.03 | NS | NS/NS |
| Ferritin (μg/L) | 51.37 ± 3.83 | 59.75 ± 4.52 | NS | 40.53 ± 4.05 | 61.30 ± 6.81 | <0.05 | NS/NS |
| D. Endocrinology | Initial Assessment (n = 149) | Annual Assessment (n = 109) | PBetween time-points | ||||
| Obesity without MetS | Obesity with MetS | Pwithin baseline | Obesity without MetS at Initial Assessment | Obesity with MetS at Initial Assessment | Pwithin follow-up | ||
| Thyroid stimulating hormone (TSH) (μUI/mL) | 3.48 ± 0.20 | 3.42 ± 0.019 | NS | 2.83 ± 0.19 * | 3.22 ± 0.27 | NS | <0.05/NS |
| Free thyroxine (FT4) (ng/dL) | 1.12 ± 0.02 | 1.07 ± 0.02 | NS | 1.30 ± 0.02 | 1.28 ± 0.03 | NS | <0.01/<0.01 |
| Triiodothyronine (T3) (ng/dL) | 141.27 ± 3.89 | 139.33 ± 3.06 | NS | 124.92 ± 4.18 | 123.88 ± 2.97 | NS | <0.01/<0.01 |
| Anti-TG (IU/mL) | 20.53 ± 0.44 | 48.32 ± 14.25 | NS | 18.44 ± 1.09 | 26.72 ± 6.85 | NS | NS/NS |
| Anti-TPO (IU/mL) | 43.76 ± 21.17 | 43.10 ± 16.11 | NS | 13.22 ± 1.42 | 25.60 ± 7.31 | NS | NS/NS |
| Insulin-like growth factor I (IGF-I) (ng/mL) | 268.97 ± 15.61 | 273.50 ± 11.68 | NS | 295.65 ± 35.09 | 312.02 ± 18.09 * | NS | NS/<0.01 |
| Prolactin (PRL) (ng/mL) | 11.97 ± 0.83 | 11.73 ± 0.55 | NS | 10.74 ± 0.75 | 11.31 ± 0.70 | NS | NS/NS |
| Luteinizing hormone (LH) (mUI/mL) | 3.39 ± 0.59 | 8.57 ± 4.79 | NS | 5.56 ± 1.10 | 3.68 ± 0.28 | NS | NS/NS |
| Follicle-stimulating hormone (FSH) (mUI/mL) | 3.16 ± 0.38 | 3.35 ± 0.23 | NS | 4.13 ± 0.47 | 3.51 ± 0.25 | NS | <0.05/NS |
| Estradiol (pg/mL) | 27.67 ± 5.48 | 23.10 ± 3.47 | NS | 39.18 ± 5.95 | 35.21 ± 3.08 | NS | NS/<0.05 |
| Testosterone (ng/mL) | 64.83 ± 15.09 | 97.71 ± 12.63 | NS | 177.21 ± 23.15 | 176.43 ± 17.33 | NS | <0.01/<0.01 |
| Cortisol (μg/dL) | 12.85 ± 0.72 | 12.55 ± 0.54 | NS | 13.96 ± 0.92 | 13.42 ± 0.75 | NS | NS/NS |
| Androstenedione (ng/dL) | 1.25 ± 0.13 | 1.67 ± 0.25 | NS | 1.76 ± 0.20 | 1.83 ± 0.16 | NS | NS/NS |
| Dehydroepiandrosterone (μg/dL) | 142.03 ± 12.82 | 171.44 ± 10.76 | NS | 193.04 ± 22.17 | 246.44 ± 29.72 | NS | <0.01/<0.01 |
| Parathyroid hormone (PTH) (pg/dL) | 40.78 ± 2.08 | 43.51 ± 2.07 | NS | 28.08 ± 1.63 | 45.36 ± 21.26 | NS | NS/NS |
| Vitamin D (25-OHVitD) (ng/mL) | 21.28 ± 0.64 | 19.48 ± 1.04 | NS | 27.25 ± 1.36 | 21.81 ± 1.19 | NS | NS/NS |
| Traditional CVD Risk Factors | Initial Assessment (n = 149) | Annual Assessment (n = 109) | PBetween Time-Points | ||||
|---|---|---|---|---|---|---|---|
| Obesity without MetS | Obesity with MetS | Pwithin Baseline | Obesity without MetS at Initial Assessment | Obesity with MetS at Initial Assessment | Pwithin Follow-Up | ||
| Systolic Blood Pressure (SBP, mmHg) | 114.30 ± 1.09 | 127.04 ± 1.28 | <0.01 | 114.46 ± 1.45 | 122.07 ± 1.2 * | <0.01 | NS/<0.01 |
| Diastolic Blood Pressure (DBP, mmHg) | 68.35 ± 1.13 | 74.91 ± 1.02 | <0.01 | 74.55 ± 1.44 * | 78.30 ± 1.23 * | <0.01 | <0.01/<0.01 |
| Cholesterol (mg/dL) | 159.33 ± 3.53 | 158.41 ± 3.28 | NS | 165.59 ± 7.99 | 156.27 ± 3.17 | NS | NS/NS |
| High-Density lipoprotein (HDL) (mg/dL) | 45.22 ± 0.96 | 40.51 ± 0.96 | <0.05 | 49.97 ± 3.37 * | 41.91 ± 0.98 | <0.01 | <0.05/NS |
| Low-Density lipoprotein (LDL) (mg/dL) | 94.73 ± 3.52 | 90.99 ± 2.94 | NS | 93.56 ± 4.51 | 89.97 ± 2.98 | NS | NS/NS |
| Lipoprotein Lp(a) (mg/dL) | 14.24 ± 2.61 | 17.12 ± 2.60 | NS | 14.10 ± 3.21 | 19.70 ± 3.81 | NS | NS/NS |
| Triglycerides (TG) (mg/dL) | 97.72 ± 4.46 | 138.34 ± 7.59 | <0.01 | 104.26 ± 6.98 | 126.88 ± 9.53 | ΝA | NS/NS |
| Apolipoprotein (ApoA1) (mg/dL) | 134.95 ± 2.14 | 125.45 ± 1.88 | <0.01 | 136.06 ± 2.79 | 126.82 ± 2.04 | <0.01 | NS/NS |
| Apolipoprotein (ApoB) (mg/dL) | 86.73 ± 2.60 | 89.03 ± 2.35 | NS | 86.46 ± 3.46 * | 85.50 ± 2.36 * | NS | <0.05/<0.05 |
| Glucose (mg/dL) | 87.97 ± 1.06 | 86.81 ± 1.18 | NS | 88.79 ± 1.00 | 90.99 ± 0.78 * | NS | NS/<0.01 |
| Insulin (μUI/mL) | 23.65 ± 1.26 | 32.63 ± 1.68 | <0.01 | 21.38 ± 1.20 | 31.53 ± 1.92 | <0.01 | NS/NS |
| HbA1C% | 5.28 ± 0.03 | 5.31 ± 0.02 | NS | 5.23 ± 0.08 | 5.28 ± 0.03 | NS | NS/NS |
| Homa-IR | 5.16 ± 0.31 | 6.91 ± 0.38 | <0.01 | 4.70 ± 0.26 | 7.11 ± 0.44 | <0.01 | NS/NS |
| Non-traditional CVD Risk Factors | Initial Assessment (n = 149) | Annual Assessment (n = 109) | PBetween Time-Points | ||||
|---|---|---|---|---|---|---|---|
| Obesity without MetS | Obesity with MetS | Pwithin Baseline | Obesity without MetS at Initial Assessment | Obesity with MetS at Initial Assessment | Pwithin Follow-Up | ||
| Triglycerides/HDL | 2.26 ± 0.14 | 3.74 ± 0.25 | <0.01 | 2.25 ± 0.18 | 3.34 ± 0.32 * | <0.05 | NS/<0.05 |
| ApoB/ApoA1 | 0.65 ± 0.02 | 0.72 ± 0.02 | NS | 0.64 ± 0.03 | 0.69 ± 0.02 * | NS | NS/<0.01 |
| High-sensitivity C-Reactive Protein (hs-CRP, mg/L) | 3.92 ± 0.66 | 4.23 ± 0.62 | NS | 3.35 ± 0.53 | 3.94 ± 0.61 | NS | NS/NS |
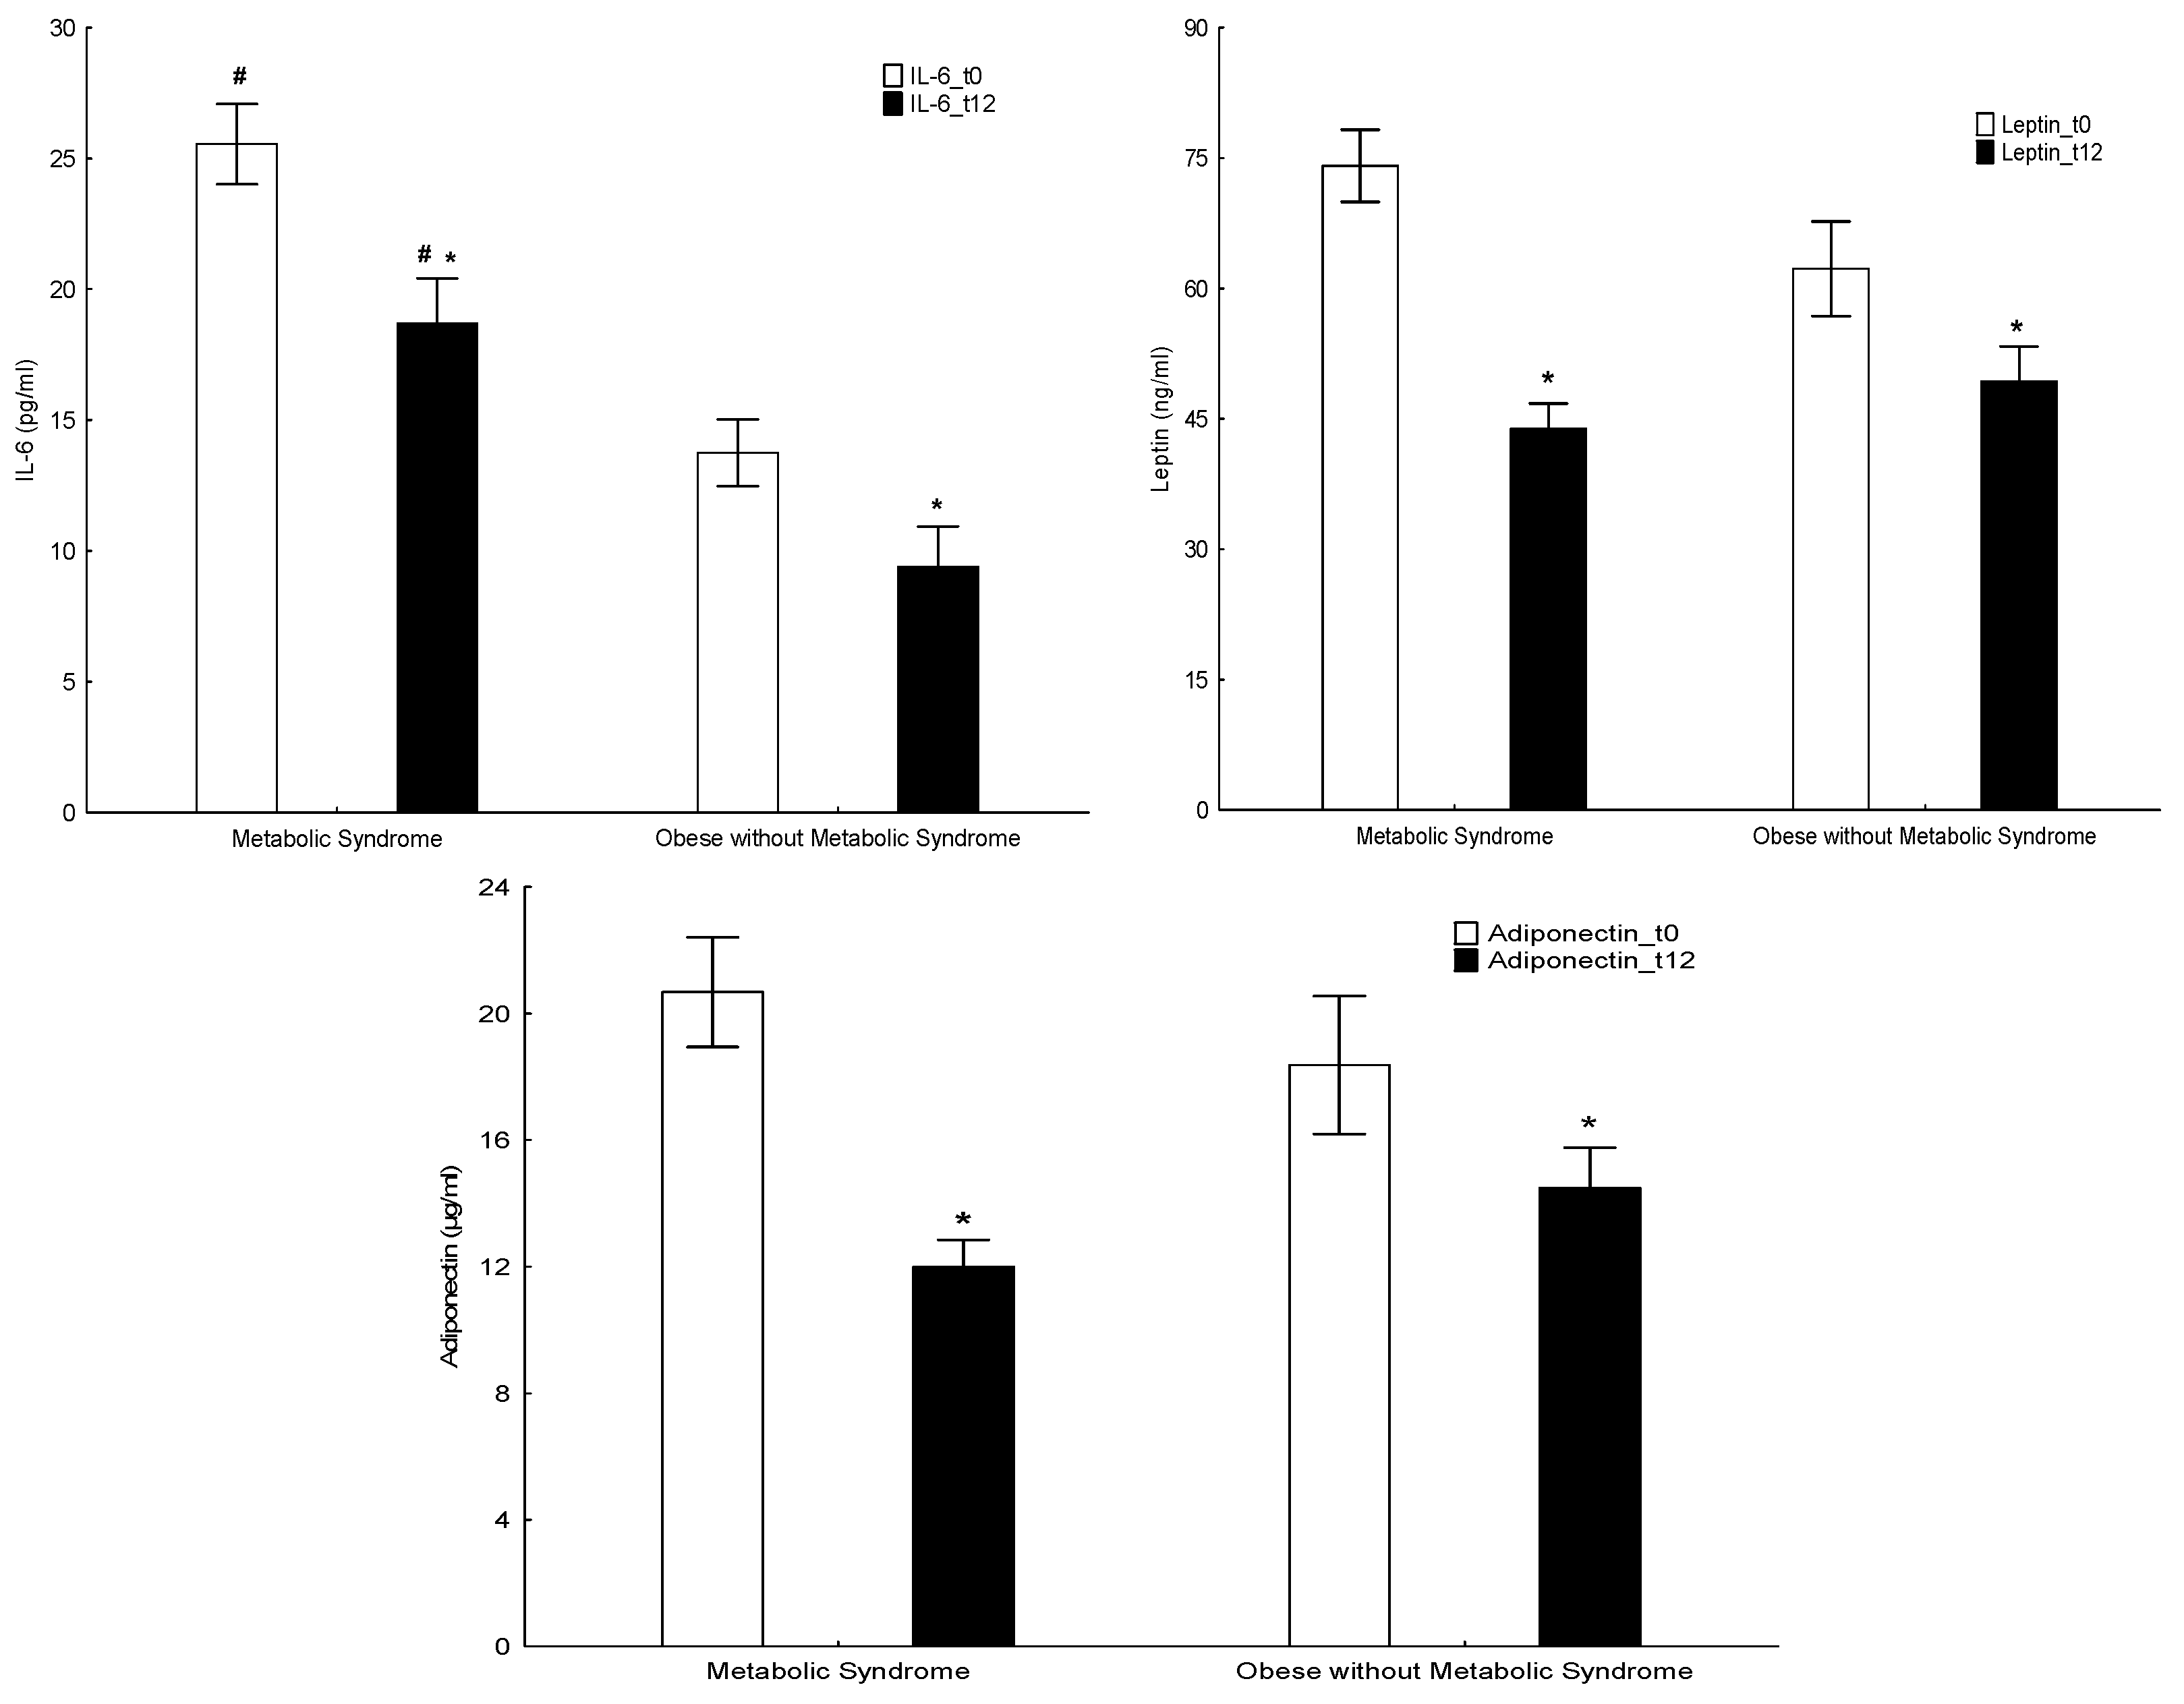
| Adiponectin (μg/mL) | 18.37 ± 2.18 | 20.68 ± 1.73 | NS | 14.48 ± 1.28 * | 12.00 ± 0.84 * | NS | <0.01/<0.01 |
| Homocysteine μmoL/L | 9.90 ± 0.38 | 10.66 ± 0.31 | NS | 10.13 ± 0.41 | 11.38 ± 0.41 | NS | NS/NS |
| Leptin (ng/mL) | 62.28 ± 5.45 | 74.11 ± 4.17 | NS | 49.34 ± 3.96 * | 43.89 ± 2.89 * | NS | <0.05/<0.01 |
| Interleukin IL-2 (pg/mL) | 7.71 ± 1.82 | 17.83 ± 1.96 | <0.05 | 12.21 ± 2.41 | 16.82 ± 2.27 | NS | NS/NS |
| Interleukin IL-4 (pg/mL) | 2.65 ± 0.58 | 3.64 ± 0.42 | NS | 2.62 ± 1.12 | 3.77 ± 0.77 | NS | NS/NS |
| Interleukin IL-6 (pg/mL) | 13.75 ± 1.28 | 26.56 ± 1.54 | <0.01 | 9.38 ± 1.55 * | 18.71 ± 1.71 * | <0.01 | <0.05/<0.01 |
| Interleukin IL-10 (pg/mL) | 8.73 ± 1.20 | 11.50 ± 1.06 | NS | 7.07 ± 1.29 | 12.25 ± 1.28 | <0.05 | NS/NS |
| Interleukin IL-17A (pg/mL) | 7.55 ± 1.88 | 23.51 ± 2.86 | <0.01 | 5.67 ± 1.52 | 19.21 ± 4.58 | <0.05 | NS/NS |
| Tumor Necrosis Factor (TNF) pg/mL | 15.86 ± 2.39 | 23.89 ± 2.59 | NS | 10.65 ± 1.90 | 21.34 ± 3.55 | <0.05 | NS/NS |
| Interferon-γ (INF-γ) pg/mL | 14.21 ± 1.72 | 21.19 ± 1.79 | <0.01 | 10.84 ± 1.51 | 17.72 ± 1.51 | <0.05 | NS/NS |
| Echocardiography and Ultrasonography | Initial Assessment (n = 149) | Annual Assessment (n = 109) | PBetween Time-Points | ||||
|---|---|---|---|---|---|---|---|
| Obesity without MetS | Obesity with MetS | Pwithin Baseline | Obesity without MetS at Initial Assessment | Obesity with MetS at Initial Assessment | Pwithin Follow-Up | ||
| Doppler 2D ECHO IVSd (mm) | 8.01 ± 0.21 | 9.60 ± 1.01 | NS | 7.98 ± 0.21 | 8.63 ± 0.17 | NS | NS/NS |
| Doppler 2D ECHO IVSs (mm) | 8.47 ± 0.25 | 9.67 ± 0.30 | <0.01 | 8.58 ± 0.24 | 9.63 ± 0.28 | <0.05 | NS/NS |
| Doppler 2D ECHOLVIDd (mm) | 44.56 ± 0.73 | 46.84 ± 0.44 | NS | 46.62 ± 0.83 | 47.00 ± 0.63 | NS | NS/NS |
| Doppler 2D ECHO LVIDs (mm) | 26.23 ± 0.89 | 28.67 ± 0.56 | NS | 28.48 ± 0.82 | 29.17 ± 0.54 | NS | NS/NS |
| Ejection Fraction EF (%) | 66.30 ± 0.92 | 67.11 ± 0.66 | NS | 63.04 ± 1.32 | 67.06 ± 0.87 | NS | NS/NS |
| Carotid Ultrasound Right Common Carotid Artery RCCA (mm) | 0.50 ± 0.02 | 0.65 ± 0.02 | <0.01 | 0.47 ± 0.02 | 0.55 ± 0.02 * | NS | NS/<0.01 |
| Carotid Ultrasound Left Common Carotid Artery LCCA (mm) | 0.50 ± 0.02 | 0.65 ± 0.03 | <0.01 | 0.48 ± 0.02 | 0.57 ± 0.03 * | NS | NS/<0.01 |
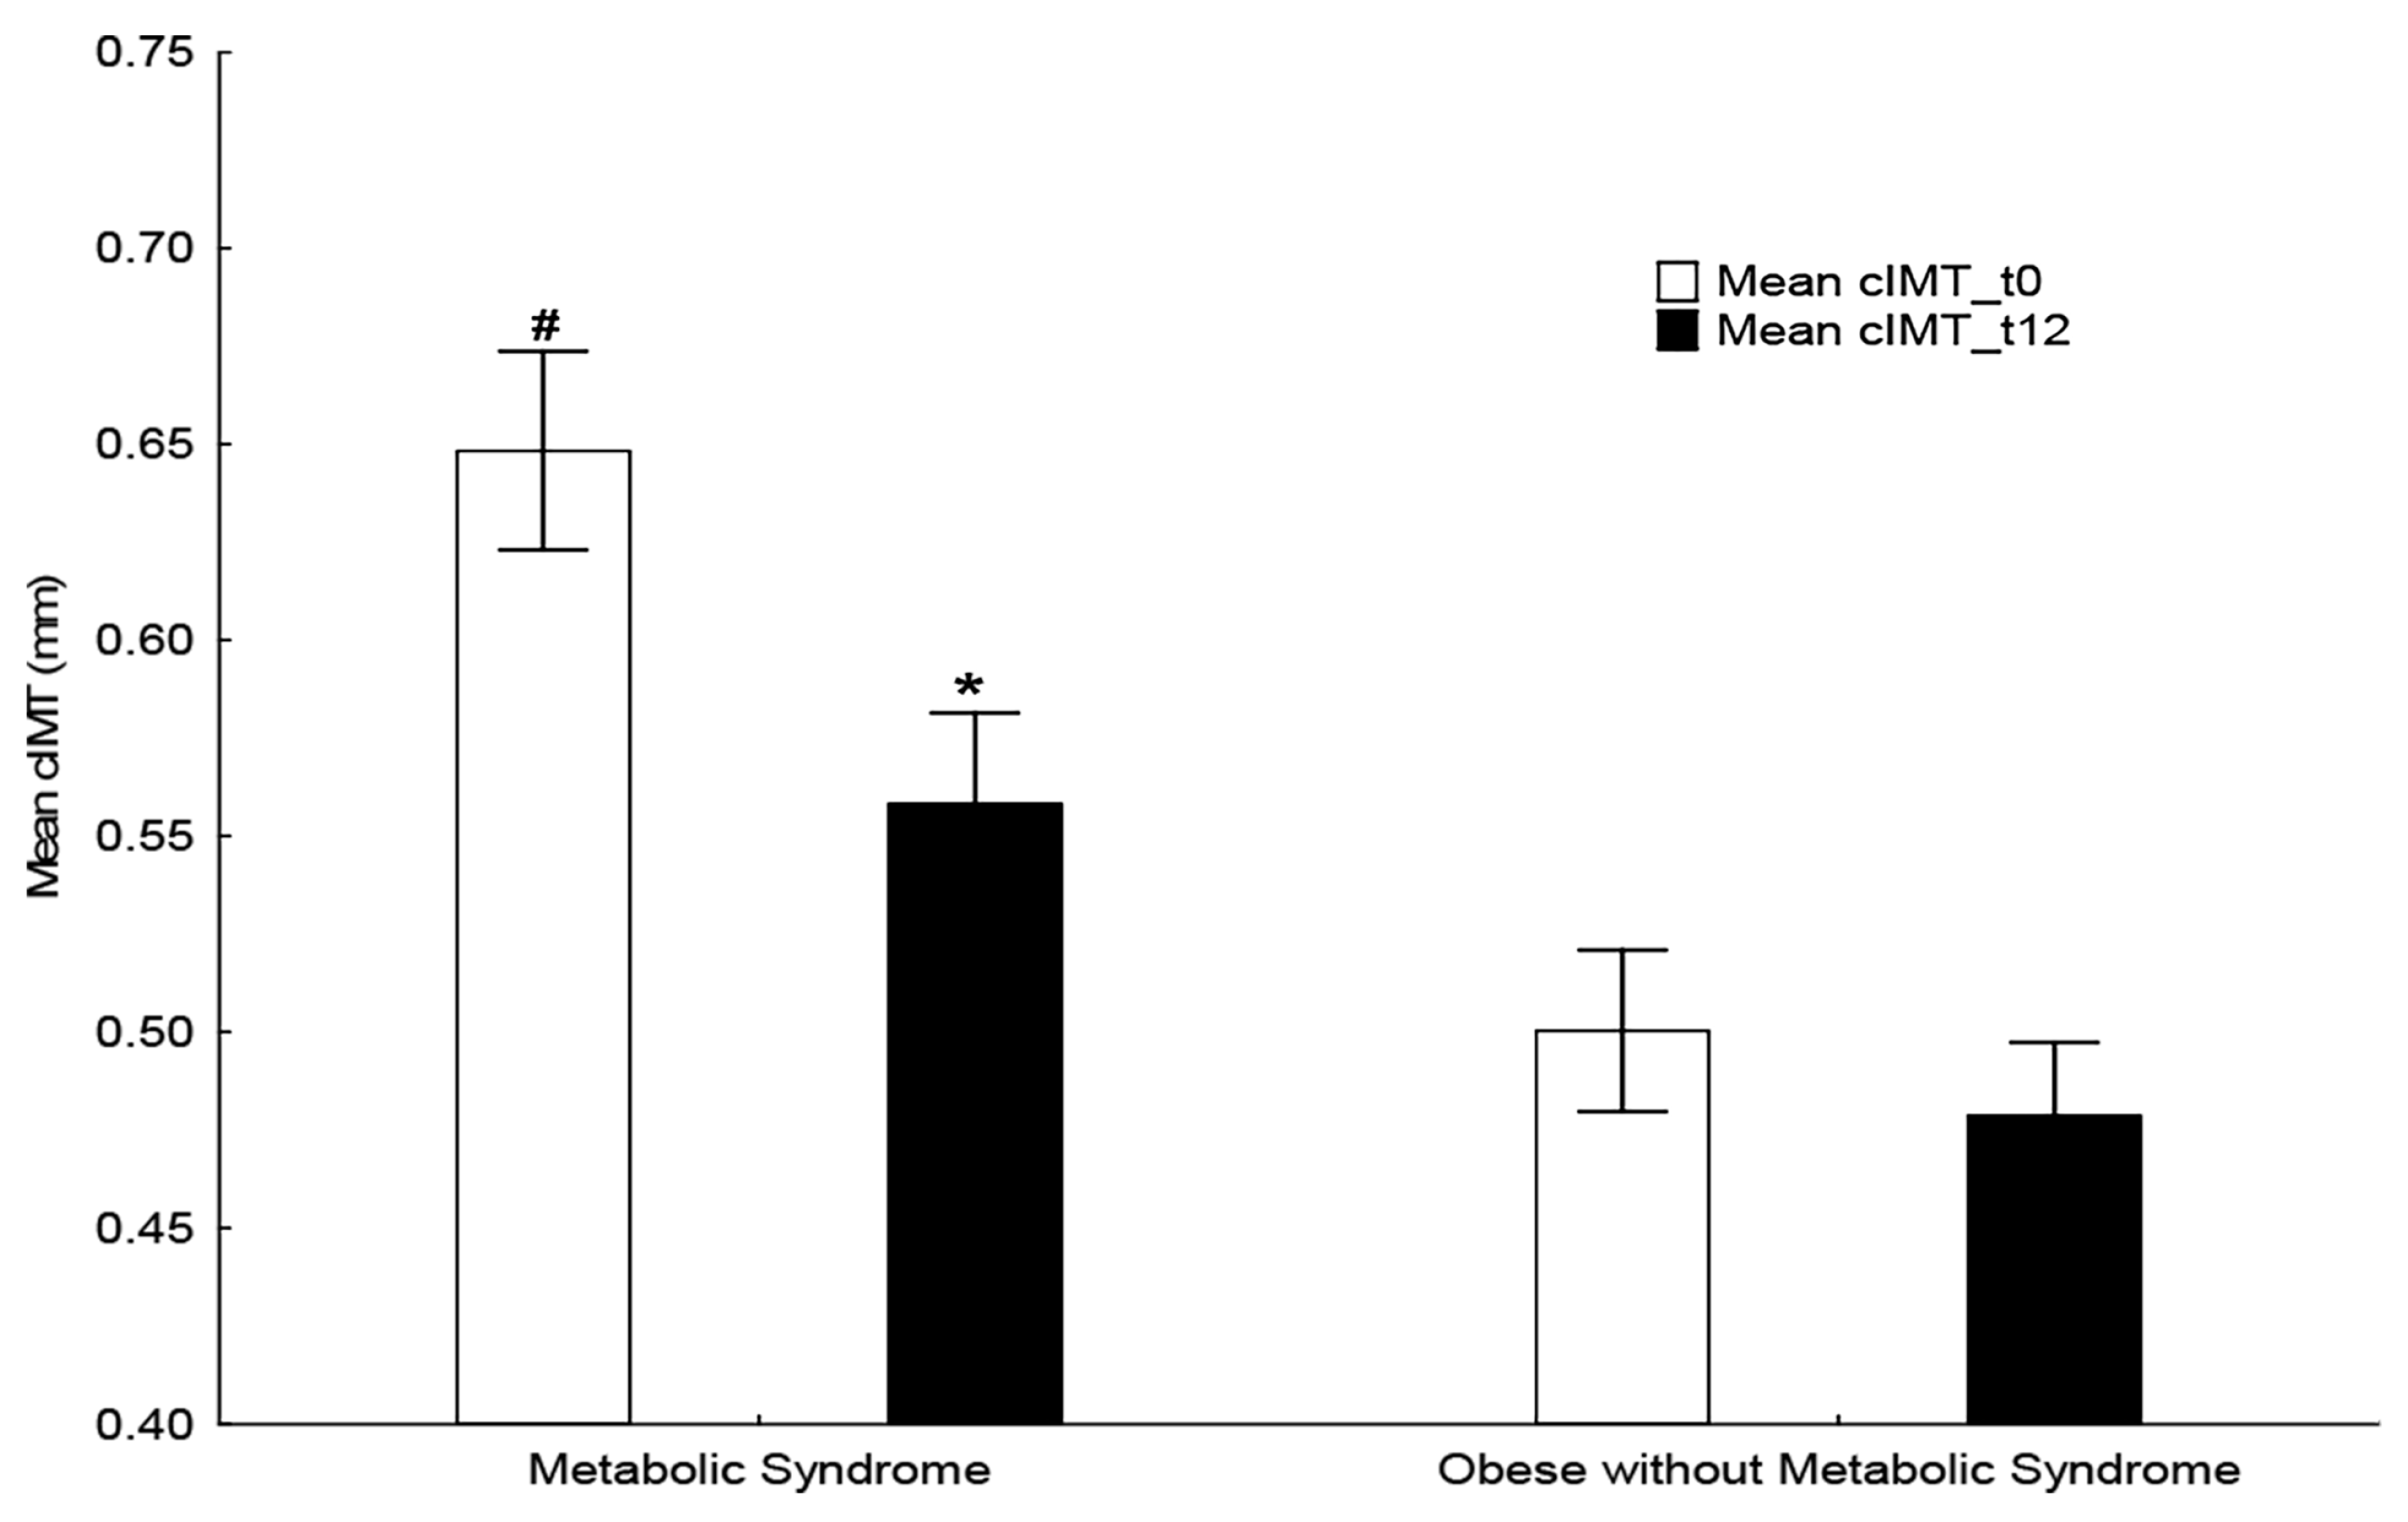
| Mean Common Carotid Artery intima-media thickness c-IMT (mm) | 0.50 ± 0.02 | 0.65 ± 0.03 | <0.01 | 0.48 ± 0.02 | 0.56 ± 0.02 * | NS | NS/<0.01 |
| Initial Assessment | p Value | Annual Assessment | p Value | |||
|---|---|---|---|---|---|---|
| Obesity without MetS | Obesity with MetS | Obesity without MetS | Obesity with MetS | |||
| NAFLD | 35 (25.3%) | 71 (51.5%) | <0.05 | 21 (25%) | 41 (48.8%) | NS |
| No NAFLD | 18 (13.1%) | 14 (10.1%) | NS | 13 (15.5%) | 9 (10.7%) | NS |
| Initial Assessment | Annual Assessment | PBetween Time Points | |
|---|---|---|---|
| cIMT(mm)t0 | cIMT(mm)t12 | ||
| NAFLD | 0.60 ± 0.02 | 0.54 ± 0.02 * | <0.01 |
| No NAFLD | 0.56 ± 0.03 | 0.49 ± 0.03 | NS |
| IL-6 t0 | IL-6 t12 | ||
| NAFLD | 22.59 ± 1.44 | 15.21 ± 1.44 * | <0.01 |
| No NAFLD | 16.94 ± 1.99 | 15.12 ± 3.19 * | <0.05 |
| HOMA-IR t0 | HOMA-IR t12 | ||
| NAFLD | 6.49 ± 0.33 | 6.44 ± 0.38 | NS |
| No NAFLD | 5.65 ± 0.56 | 5.52 ± 0.62 | NS |
| Independent Variables | Dependent Variable (b) | p Value |
|---|---|---|
| Anthropometric parameters at initial assessment (Wt, Ht, BMI, waist and hip circumference, WHR, WHtR) | ||
| Height 0′ | cIMT 0′ (b = 0.284) cIMT 12′ (b = 0.271) | p < 0.05 |
| Metabolic syndrome parameters at initial assessment (SBP, WC, glucose concentration, TG, HDL) | ||
| ΝA | ||
| Glucose metabolism and insulin sensitivity parameters at initial assessment (glucose, insulin, HbA1C, HOMA-IR) | ||
| HOMA-IR 0′ | cIMT 0′ (b = 0.365) | p < 0.05 |
| Adiposity parameters at initial assessment (adiponectin and leptin concentrations, WC, WHtR, IL-6) | ||
| IL-6 0′ | cIMT 0′ (b = 0.254) cIMT 12′ (b = 0.441) | |
Disclaimer/Publisher’s Note: The statements, opinions and data contained in all publications are solely those of the individual author(s) and contributor(s) and not of MDPI and/or the editor(s). MDPI and/or the editor(s) disclaim responsibility for any injury to people or property resulting from any ideas, methods, instructions or products referred to in the content. |
© 2023 by the authors. Licensee MDPI, Basel, Switzerland. This article is an open access article distributed under the terms and conditions of the Creative Commons Attribution (CC BY) license (https://creativecommons.org/licenses/by/4.0/).
Share and Cite
Tragomalou, A.; Paltoglou, G.; Manou, M.; Kostopoulos, I.V.; Loukopoulou, S.; Binou, M.; Tsitsilonis, O.E.; Bacopoulou, F.; Kassari, P.; Papadopoulou, M.; et al. Non-Traditional Cardiovascular Risk Factors in Adolescents with Obesity and Metabolic Syndrome May Predict Future Cardiovascular Disease. Nutrients 2023, 15, 4342. https://doi.org/10.3390/nu15204342
Tragomalou A, Paltoglou G, Manou M, Kostopoulos IV, Loukopoulou S, Binou M, Tsitsilonis OE, Bacopoulou F, Kassari P, Papadopoulou M, et al. Non-Traditional Cardiovascular Risk Factors in Adolescents with Obesity and Metabolic Syndrome May Predict Future Cardiovascular Disease. Nutrients. 2023; 15(20):4342. https://doi.org/10.3390/nu15204342
Chicago/Turabian StyleTragomalou, Athanasia, George Paltoglou, Maria Manou, Ioannis V. Kostopoulos, Sofia Loukopoulou, Maria Binou, Ourania E. Tsitsilonis, Flora Bacopoulou, Penio Kassari, Marina Papadopoulou, and et al. 2023. "Non-Traditional Cardiovascular Risk Factors in Adolescents with Obesity and Metabolic Syndrome May Predict Future Cardiovascular Disease" Nutrients 15, no. 20: 4342. https://doi.org/10.3390/nu15204342