Review

The Effect of Probiotic Supplementation on Glucolipid Metabolism in Patients with Type 2 Diabetes: A Systematic Review and Meta-Analysis

1
State Key Laboratory of Food Science and Resources, Jiangnan University, Wuxi 214122, China
2
School of Food Science and Technology, Jiangnan University, Wuxi 214122, China
3
National Engineering Research Center for Functional Food, Jiangnan University, Wuxi 214122, China
4
(Yangzhou) Institute of Food Biotechnology, Jiangnan University, Yangzhou 225004, China
5
Department of Anesthesiology and Pain Medicine, Jiangnan University Medical Center, Wuxi 214002, China
*
Authors to whom correspondence should be addressed.
Nutrients 2023, 15(14), 3240; https://doi.org/10.3390/nu15143240
Submission received: 29 June 2023 / Revised: 15 July 2023 / Accepted: 18 July 2023 / Published: 21 July 2023

Abstract

:
Purpose: Type 2 diabetes mellitus (T2DM) is a persistent metabolic condition with an unknown pathophysiology. Moreover, T2DM remains a serious health risk despite advances in medication and preventive care. Randomised controlled trials (RCTs) have provided evidence that probiotics may have positive effects on glucolipid metabolism. Therefore, we performed a meta-analysis of RCTs to measure the effect of probiotic therapy on glucolipid metabolism in patients with T2DM. Methods: With no constraints on the language used in the literature, Excerpta Medica Database, PubMed, the Cochrane Library, and the Web of Science were searched for pertinent RCTs published between the date of creation and 18 August 2022. Stringent inclusion and exclusion criteria were applied by two reviewers to independently examine the literature. The risk of bias associated with the inclusion of the original studies was assessed using the Cochrane risk-of-bias tool, and Stata 15.0 was used to perform the meta-analysis. Results: Thirty-seven publications containing a total of 2502 research participants were included in the meta-analysis. The results showed that after a probiotic intervention, the experimental group showed a significant decrease in body mass index (standardised mean difference (SMD) = −0.42, 95% confidence interval (CI) [−0.76, −0.08]), fasting glucose concentration (SMD = −0.73, 95% CI [−0.97, −0.48]), fasting insulin concentration (SMD = −0.67, 95% CI [−0.99, −0.36]), glycated haemoglobin concentration (SMD = −0.55, 95% CI [−0.75, −0.35]), Homeostatic Model Assessment for Insulin Resistance score (SMD = −0.88, 95% CI [−1.17, −0.59]), triglyceride concentration (SMD = −0.30, 95% CI [−0.43, −0.17]), total cholesterol concentration (SMD = −0.27, 95% CI [−0.43, −0.11]), and low-density lipoprotein concentration (SMD = −0.20, 95% CI [−0.37, −0.04]), and an increase in high-density lipoprotein concentration (SMD = 0.31, 95% CI [0.08, 0.54]). Moreover, subgroup analyses showed that patients with a longer intervention time, or those who were treated with multiple strains of probiotics, may benefit more than those with a shorter intervention time or those who were treated with a single probiotic strain, respectively. Conclusion: Probiotic supplementation improves glucolipid metabolism in patients with T2DM, offering an alternative approach for the treatment of these patients.

1. Introduction

It is estimated that more than 700 million people aged from 20 to 79 will have diabetes by 2045, with 90% of cases being type 2 diabetes mellitus (T2DM) [1]. Low-grade inflammation, B-cell depletion, and insulin resistance are the hallmarks of T2DM, which is a serious metabolic condition [2]. The main drugs used in the treatment of T2D at this stage are traditional insulin sensitizers such as biguanides and glitazones, traditional insulinotropic agents such as sulfonylureas and non-sulfonylureas, and newer insulinotropic agents such as glucagon-like peptide-1 receptor agonists and dipeptidyl peptidase-4 (DPP-4) inhibitors [3]. However, these medications have adverse effects. For instance, metformin may result in nausea, bloating, abdominal pain, vomiting, a deficiency of vitamin B12, and an unsettled stomach. Similar side effects, including indigestion, constipation, bloating, nausea, and vomiting, have been reported for liraglutide. These adverse effects are more likely to be caused by combination therapies than monotherapies [4]. Therefore, a safe monotherapy with few side effects is urgently needed to treat patients with T2DM.
An increased understanding of how gut microbiota influences metabolism has led to growing interest in the role that gut microbiota plays in the aetiology of T2DM [5,6]. Changes in the gut microbiota frequently accompany the onset and development of T2DM. For instance, compared with healthy individuals, patients with T2DM often have lower alpha diversity in their gut microbiota [7,8], in addition to a greater relative abundance of Gram-positive bacteria and actinomycetes, and a lower relative abundance of Gram-negative bacteria [9]. Given the strong relationship between host metabolism and gut bacteria, the composition of the gut microbiota offers an alternative target to guide the development of new anti-diabetic drugs. Probiotic supplementation has been shown to have beneficial effects regarding T2DM in numerous animal studies and randomised controlled trials (RCTs). For example, Ke et al. demonstrated that synbiotic interventions significantly decreased bodyweight and concentrations of fasting glucose, lipids, and other markers in mice with diet-induced obesity [10]. An RCT conducted by Sabico et al. showed that supplementation with a multi-strain probiotic decreased the insulin resistance index and concentrations of glycated haemoglobin and fasting glucose in individuals with T2DM [11]. Additionally, Kassaian et al. demonstrated that probiotics or synbiotics dramatically decreased concentrations of glycated haemoglobin in prediabetic patients [12].
Although several meta-analyses have found that probiotics alleviate the symptoms of T2DM, their clinical efficacy remains unclear because of the reviewed studies’ small sample sizes, high heterogeneity, high risk of bias, and suboptimal analytical methods [13,14,15,16].
Therefore, we followed the guidelines outlined in the Cochrane Handbook for Systematic Reviews of Interventions to perform a careful meta-analysis of how probiotics can be used to treat T2DM, with a focus on RCTs that were carried out in adults. Our aim was to identify the characteristics of potentially practical interventions—such as the number of strains used, the route of administration, the length of a course of therapy, and the probiotics’ ability to adapt to different physiological states of a host—and to assess the general clinical efficacy of probiotic supplementation for the treatment of T2DM.

2. Materials and Methods

The current inquiry was conducted in accordance with the Cochrane Handbook for the Systematic Review of Interventions and the Preferred Reporting Items for Systematic Reviews and Meta-Analyses. The PROSPERO database has this study protocol listed as ID CRD42023415503.

2.1. Inclusion Criteria

2.1.1. Research Type

Randomised controlled trials.

2.1.2. Research Subjects

(1) Aged 18 or older; (2) diagnosed with type 2 diabetes; (3) no allergy to probiotic components.

2.1.3. Intervention Measures

Interventions: the test group received probiotics and the control group received a placebo.

2.1.4. Outcome Indicators

The outcome indicators are HbA1c, fasting insulin, fasting glucose, HOMA-insulin resistance, TG, TC, LDL, and HDL.

2.2. Exclusion Criteria

(1) Non-related diseases; (2) study data could not be obtained; (3) non-randomized controlled trials, reviews, case reports, animal experiments, dissertations, or conference abstracts.

2.3. Retrieval Strategies

We incorporated mesh phrases and free keywords into our search strategy, in accordance with PICOS philosophy.
(1)
Population (P): patients with T2DM.
(2)
Intervention (I): probiotic supplementation.
(3)
Comparison (C): placebo.
(4)
Outcome (O): BMI, fasting glucose, fasting insulin, HbA1c, HOMA-insulin resistance, TG, TC, HDL, LDL.
(5)
Study design (S): randomized clinical trials (RCTs).
For RCTs, regarding the impact of probiotics on T2DM, a thorough search of Web of Science, PubMed, Cochrane Library, and Embase was conducted. The data were retrieved, and they were published between the databases’ creation and 18 August 2022. The search strategy used a combination of subject terms and free words, with search terms including (“probiotic” OR “probiotics” OR “lactobacillus “ OR “ bifidobacterial “) AND (“diabetes” OR “glycemia” OR “glucose” OR “Fasting blood sugar” OR “FBS” OR “ Glycosylated haemoglobin A1c” OR “HbA1c” OR “insulin” OR insulin resistance “ OR “HOMA-IR” OR “cholesterol” OR “lipids” OR “Total cholesterol” OR “TC” OR “Triglyceride” OR “TG “ OR “High density lipoprotein cholesterol” OR “HDL-C” OR “Low density lipoprotein cholesterol” OR “LDL-C”, etc. There were no restrictions on language or region. The search strategy is detailed in Supplementary S1.

2.4. Literature Screening and Data Extraction

We used Endnote software, X9 edition, to manage all the documentation. We imported the literature into Endnote X9, and we filtered the original research so that it complied with the aims of this systematic evaluation. Then, we extracted information from the literature and double-checked it using unified quantity units. The subjects, first authors, publication year, nation, study type, sample size, and patient gender, in addition to the intervention method, intervention duration, and end indicators, comprise the bulk of the data gathered.

2.5. Risk of Bias Assessment

The included studies were assessed using the bias assessment tools suggested in the Cochrance Manual, including random sequence generation (selective bias), hidden bias distribution (selected biases), blinding of researchers and subjects (implemented bias), blind assessment of study results (measured biases), integrity of end data (follow-up bias), outcomes of selective reporting (report bias), and other sources (other bias).

2.6. Statistical Methods

Stata 15.0 software was used to statistically evaluate the included literature, and it also performed sensitivity analysis, publication bias analysis, and heterogeneity testing. Since the included data are continuous variables, and different qualitative pairings were used to measure the data in each study, the 95% confidence interval (CI) and standard mean difference (SMD) are combined. If p > 0.1 and I2 ≤ 50%, inter-study heterogeneity is accepted, and a fixed-effect model for meta-analysis is practicable. If p ≤ 0.1 or I2 > 50%, there is greater heterogenicity, and a random effect model for meta-analysis is practicable. All of the results are statistically significant, with a difference of p < 0.05 when the “metabias” command was used to publish the bias of the inclusion study.

3. Results

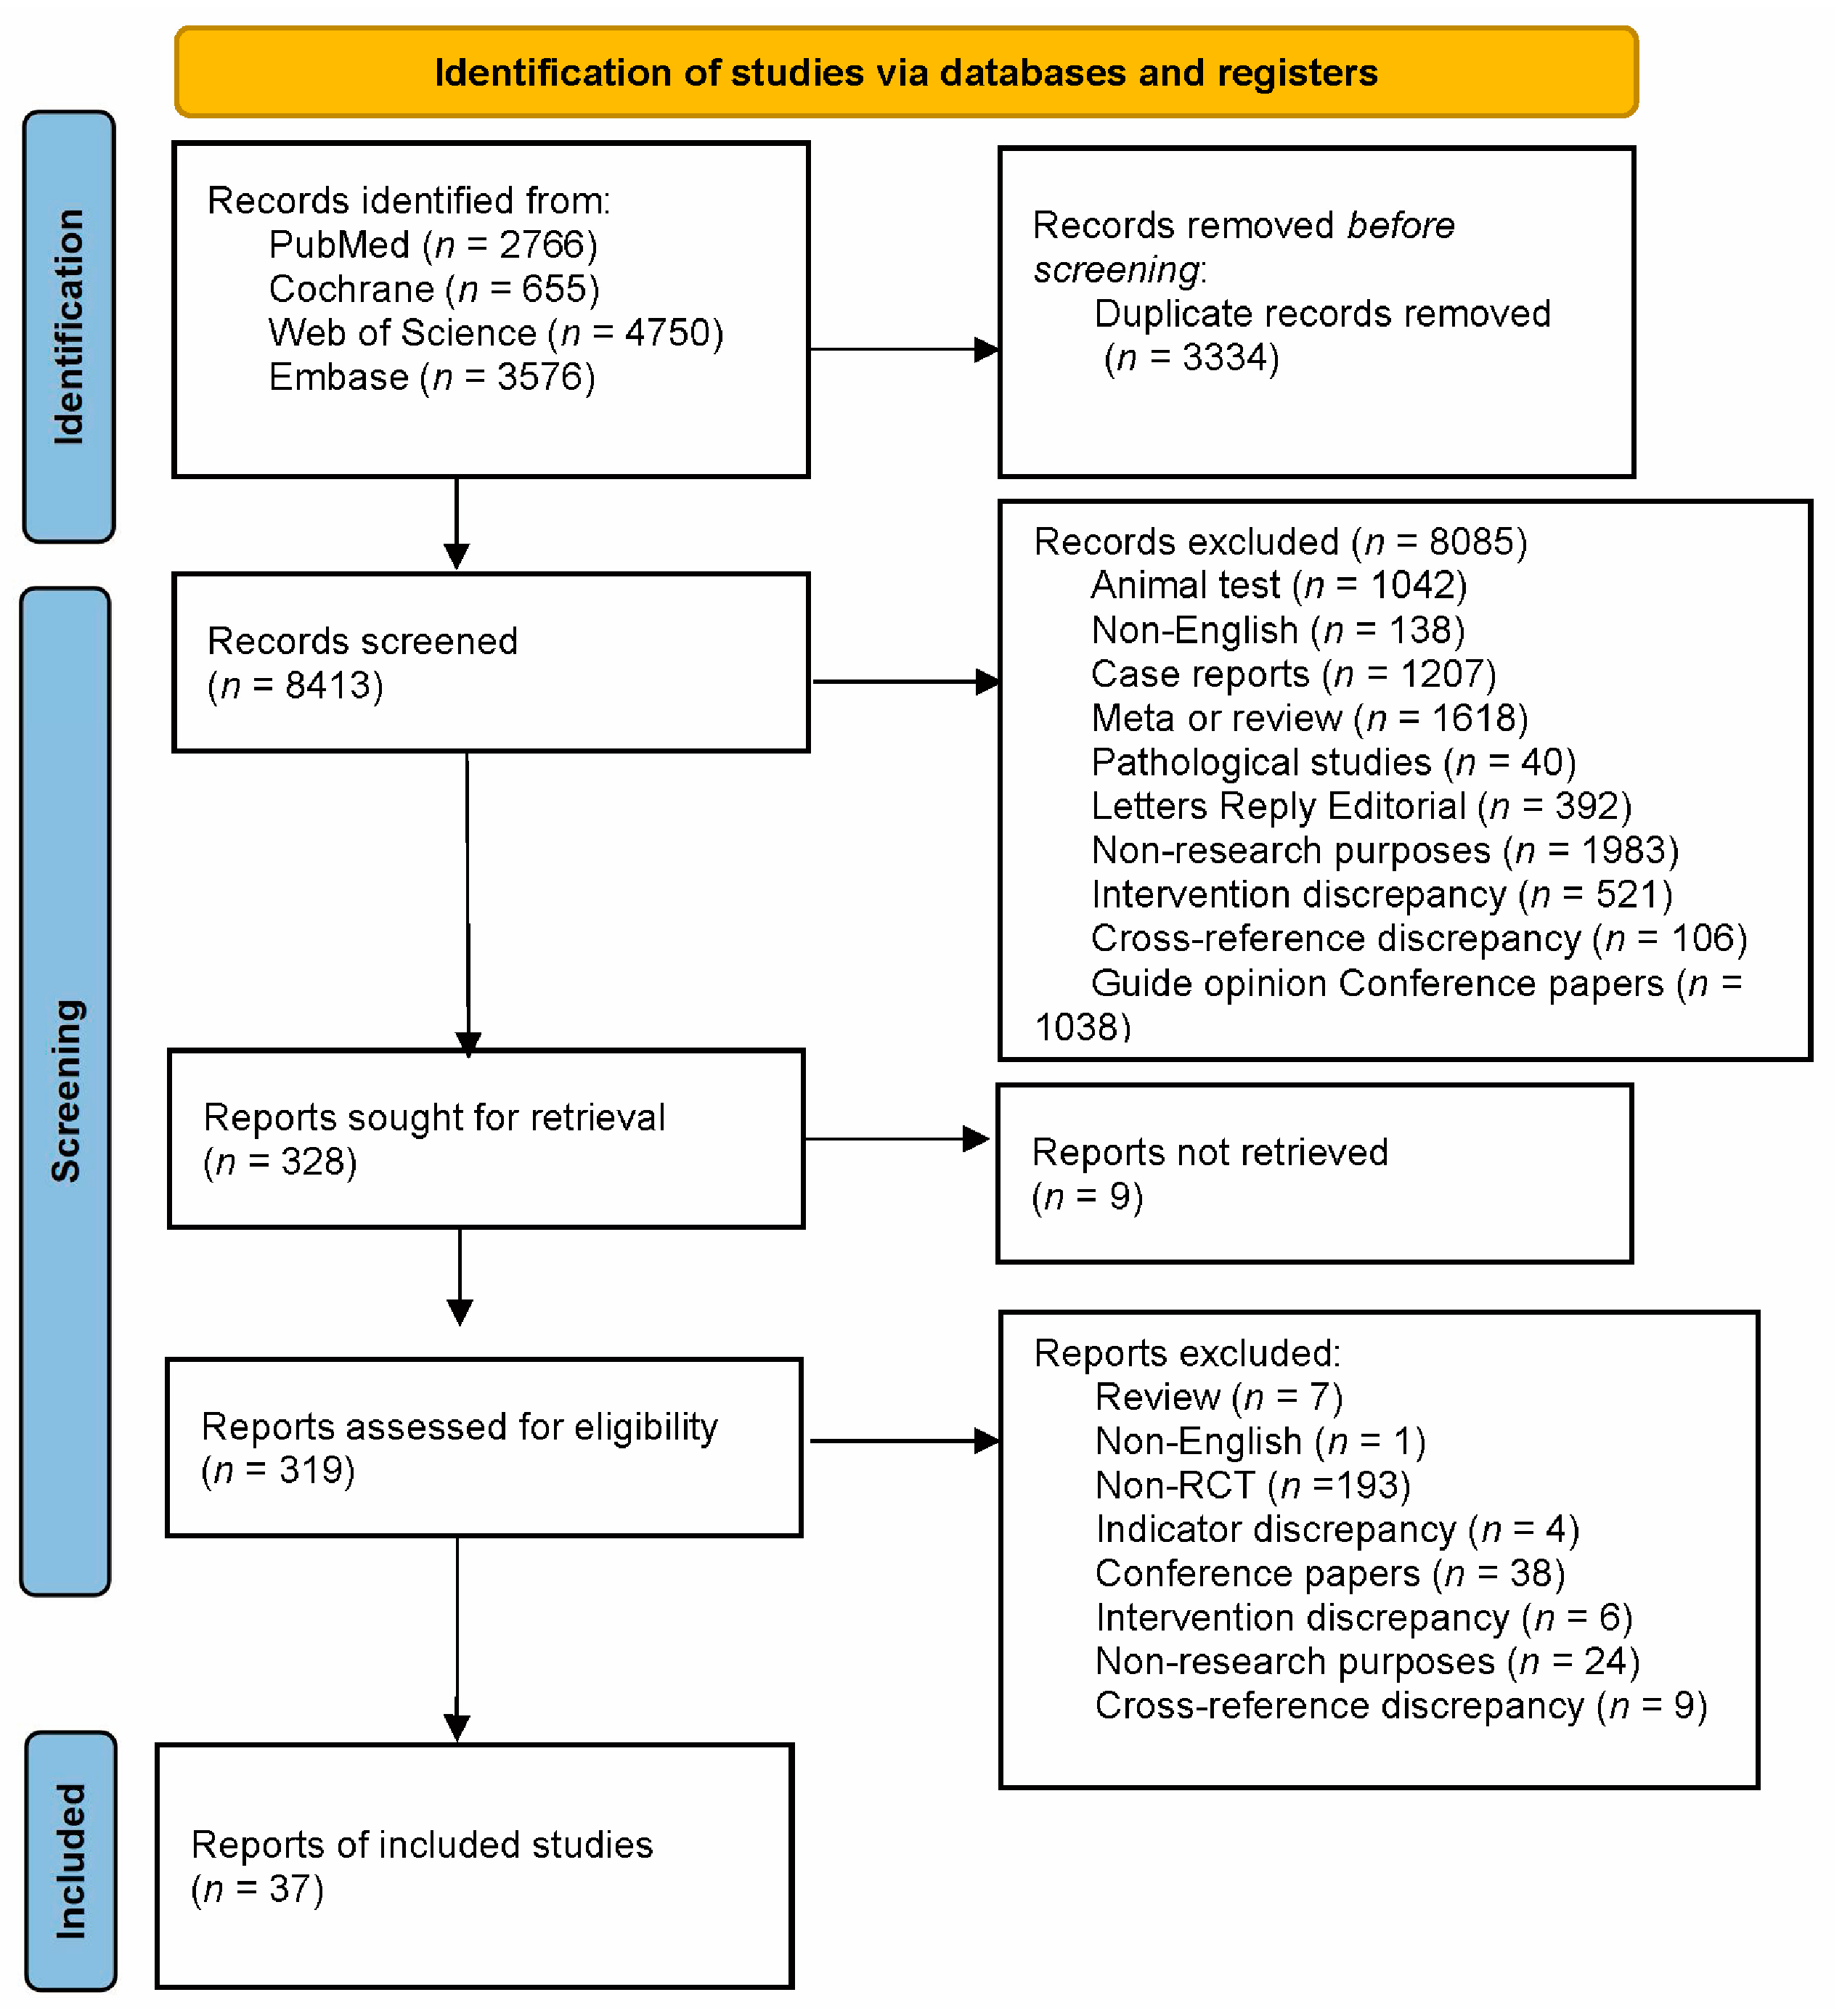
3.1. Literature Search Results

The flowchart in Figure 1 shows the outcomes of the study selection procedure. In the original and additional searches, the aforementioned databases yielded 11,747 studies. The retrieved literature was imported into EndNote X9 for management, after which 3334 duplicate publications were eliminated, 8085 irrelevant publications were eliminated after reading the titles and abstracts, and 291 publications that did not meet the inclusion criteria were eliminated after reading the full text. This process yielded 37 studies for inclusion in this meta-analysis.

3.2. Basic Characteristics of the Included Studies

The 37 studies had English as their primary language and included 2502 patients (1262 in experimental groups and 1240 in control groups). Table 1 displays the key characteristics of these studies.

3.3. Quality Assessment of the Included Studies

The included studies were all randomised, double-blind studies. Three of the included studies [34,35,40] did not mention whether random numbers were used for group allocation; two [34,35] did not mention whether allocation concealment was used; two [20,22] did not clarify whether blinding was used; eight [11,20,23,24,28,29,49,51] did not clarify whether there was measurement bias; and two [11,20] did not provide trial pre-registration or publication, therefore, it was not clear which outcome indicators should be reported. Moreover, five [20,26,29,34,35] studies had missing visit bias, and therefore, high reporting bias, but none of the other studies had reporting bias or any other biases. The results of the evaluation concerning the risk of bias in the included studies are shown in Figure 2.

3.4. Meta-Analysis Results

3.4.1. Effects of Probiotic Therapy on Body Mass Index

Nineteen studies [11,17,18,19,21,27,29,31,32,34,35,37,38,40,42,45,47,52], with a total of 813 cases in the experimental group and 691 in the control group, examined the effects of probiotic therapy on body mass index (BMI) in patients with T2DM. Effect sizes were combined using a random effects model (I2 = 89.6%, p = 0.000), and the analysis revealed that the experimental group had a lower BMI than the control group (standardised mean difference (SMD) = −0.42, 95% confidence interval (CI) [−0.76, −0.08]; Figure 3).
We also conducted subgroup analyses on two intervention parameters, the duration of probiotic treatment (Figure 3a) and the bacterial strains used (Figure 3b), to further investigate whether probiotics have an effect on BMI in patients with T2DM. The subgroups had periods of probiotic treatment of equal to, or less than, 2 months (SMD = −0.64, 95% CI [−1.40, 0.13]), 2 months to 3 months (SMD = −0.30, 95% CI [−0.71, 0.10]), and 3 months to 6 months (SMD = −0.43, 95% CI [−0.43, 0.10]). It was found that none of the three periods of probiotic treatment were significantly different in terms of their effects on BMI (SMD = −0.43, 95% CI [−1.29, 0.43]). In the subgroup analysis based on different strains, the experimental interventions were more effective than the control interventions in reducing BMI when the former comprised multi-strain probiotics (SMD = −0.62, 95% CI (−1.13, −0.11]), but not when they comprised single-strain probiotics (SMD = −0.21, 95% CI [−0.70, 0.27]). Therefore, it can be inferred that treatment with multi-strain probiotics is superior to treatment with single-strain probiotics in terms of improving BMI in patients with T2DM.

3.4.2. Effects of Probiotic Therapy on Fasting Blood Glucose Concentration

Thirty-seven studies [11,17,18,19,20,21,22,23,24,26,27,28,29,30,31,32,33,34,35,36,37,38,39,40,41,42,43,44,45,46,47,48,49,50,51,52] reported the effect of a probiotic intervention on fasting glucose concentration in patients with T2DM, and they were included in this analysis. After summarization, 1262 cases were included in the experimental group and 1240 cases were included in the control group. After combining effect sizes with a random-effects model (I2 = 89.5%, p = 0.000), it was revealed that compared with the control interventions, the experimental interventions significantly lowered fasting blood glucose concentrations (SMD = −0.73, 95% CI [−0.97, −0.48]; Figure 4).
Next, we performed subgroup analyses based on the duration of probiotic treatment (Figure 4a) and the strains used (Figure 4b). The subgroup analysis, based on the duration of probiotic treatment, showed that there were significant differences between probiotic treatment durations of less than or equal to 2 months (SMD = −0.52, 95% CI [−0.83, −0.21]), 2 to 3 months (SMD = −0.71, 95% CI [−1.02, −0.40]), and 3 to 6 months (SMD = −1.40, 95% CI [−2.48, −0.33]). It was evident that the longer the duration of administration, the more significantly probiotics decreased fasting blood glucose concentrations. The subgroup analysis based on the strains used showed that both multi-strain and single-strain probiotic treatments resulted in a significant reduction in fasting blood glucose concentrations compared with the control group, but multi-strain probiotic treatments (SMD = −0.91, 95% CI [−1.24, −0.57]) were more effective than single-strain probiotic treatments (SMD = −0.44, 95% CI [−0.81, −0.06]).

3.4.3. Effects of Probiotic Therapy on Fasting Insulin Concentration

Twenty-five studies [11,17,18,19,20,22,23,24,25,26,27,29,30,32,33,35,36,39,44,45,47,49,50,51], with a total of 845 cases in the experimental group and 824 cases in the control group, reported the effect of probiotics on fasting insulin concentrations in patients with T2DM. A random-effects model (I2 = 89.4%, p = 0.000) was used to combine effect sizes, and the analysis showed that the experimental interventions had a more significant effect than the control interventions in terms of decreasing fasting insulin concentrations (SMD = −0.67, 95% CI [−0.99, −0.36]; Figure 5).
We also conducted subgroup analyses based on treatment duration (Figure 5a) and the probiotic strains used (Figure 5b). This revealed that intervention durations of less than or equal to 2 months (SMD = −0.80, 95% CI [−1.41, −0.19]), 2 to 3 months (SMD = −0.43, 95% CI [−0.65, −0.22]), and 3 to 6 months (SMD = −2.30, 95% CI [−0.99, −0.36]) resulted in significant reductions in fasting insulin concentrations. Multi-strain probiotics (SMD = −0.73, 95% CI [−1.09, −0.37]), but not single-strain probiotics (SMD = −0.55, 95% CI [−1.19, 0.08]), were found to be effective in reducing fasting insulin concentrations. This implies that multi-strain probiotics are superior to single-strain probiotics at lowering fasting insulin concentration in patients with T2DM.

3.4.4. Effects of Probiotic Therapy on Glycated Haemoglobin Concentration

Twenty-six studies [17,18,21,22,25,26,29,31,32,33,34,35,37,39,42,43,44,45,46,47,48,49,51,52], with a total of 987 cases in the experimental group and 862 cases in the control group, reported the effect of a probiotic intervention on glycated haemoglobin concentration in patients with T2DM. The application of a random-effects model (I2 = 75.2%, p = 0.000) to combine effect sizes revealed that the experimental interventions were more efficacious than the control interventions in reducing glycated haemoglobin concentration (SMD = −0.55, 95% CI [−0.75, −0.35]; Figure 6).
We also conducted subgroup analyses based on the duration of probiotic treatment (Figure 6a) and the probiotic strains used (Figure 6b). Experimental intervention times of less than or equal to 2 months (SMD = −1.27, 95% CI [−1.27, 0.56]), 2 to 3 months (SMD = −0.42, 95% CI [−0.68, −0.17]), and 3 to 6 months (SMD = −0.22, 95% CI [−0.75, 0.32]) led to statistically significant differences in glycated haemoglobin concentration. Compared with the control interventions, both multi-strain and single-strain probiotic treatments resulted in significant reductions in glycated haemoglobin concentration, but multi-strain probiotic treatments (SMD = −0.69, 95% CI [−1.01, −0.38]) were more effective than single-strain probiotic treatments (SMD = −0.38, 95% CI [−0.59, −0.18]).

3.4.5. Effects of Probiotic Therapy on Homeostatic Model Assessment for Insulin Resistance Score

Twenty-six studies [17,18,19,20,22,23,24,25,27,30,32,33,36,37,39,44,45,47,49,50,51,52], with a total of 1055 cases in the experimental group and 958 cases in the control group, examined the effect of probiotic interventions on the Homeostatic Model Assessment for Insulin Resistance (HOMA-IR) score in patients with T2DM. Combining effect sizes using a random-effects model (I2 = 89.1%, p = 0.000) revealed that the experimental interventions were more effective than the control interventions in lowering the HOMA-IR score (SMD = −0.88, 95% CI [−1.17, −0.59]; Figure 7).
We also conducted subgroup analyses based on the duration of probiotic treatment (Figure 7a) and the probiotic strains used (Figure 7b). Intervention durations of less than or equal to 2 months (SMD = −0.78, 95% CI [−1.26, 0.30]) and 2 to 3 months (SMD = −0.88, 95% CI [−1.26, −0.50]), but not 3 to 6 months (SMD = −1.47, 95% CI [−3.96, 1.02]), resulted in statistically significant effects on HOMA-IR scores. Compared with the control interventions, both multi-strain and single-strain probiotic treatments resulted in significant reductions in HOMA-IR scores, but multi-strain probiotic treatments (SMD = −0.96, 95% CI [−1.35, −0.57]) were superior to single-strain probiotic treatments (SMD = −0.72, 95% CI [−1.17, −0.26]).

3.4.6. Effects of Probiotic Therapy on Triglyceride Concentration

Twenty-five studies [11,18,19,20,21,22,23,24,27,28,29,30,31,32,33,39,40,42,43,45,49,50,51,52], with a total of 969 cases in the experimental group and 855 cases in the control group, examined the effect of probiotic interventions on triglyceride (TG) concentration in patients with T2DM. A random-effects model that combined effect sizes (I2 = 47%, p = 0.005) showed that the experimental interventions were more effective than the control interventions in decreasing TG concentration (SMD = −0.30, 95% CI [−0.43, −0.17]; Figure 8).
We also performed subgroup analyses based on the duration of probiotic treatment (Figure 8a) and the probiotic strains used (Figure 8b). Intervention durations of less than or equal to 2 months (SMD = −0.47, 95% CI [−0.83, 0.12]) and 2 to 3 months (SMD = −0.29, 95% CI [−0.43, −0.16]), but not 3 to 6 months (SMD = −0.13, 95% CI [−0.46, 0.21]), had statistically significant effects on TG concentrations. Compared with the control interventions, both multi-strain and single-strain probiotic treatments resulted in significant reductions in TG concentration, but multi-strain probiotic treatments (SMD = −0.33, 95% CI [−0.49, −0.16]) were more effective than single-strain probiotic treatments (SMD = −0.24, 95% CI [−0.47, −0.02]).

3.4.7. Effects of Probiotic Therapy on Total Cholesterol Concentration

Twenty-four studies [11,18,19,20,21,22,23,24,25,27,28,29,30,32,33,38,39,40,43,45,49,50,51,52], with a total of 920 cases in the experimental group and 807 cases in the control group, examined the effect of probiotic interventions on total cholesterol (TC) concentration in patients with T2DM. A random-effects model that combined effect sizes (I2 = 61.8%, p = 0.000) showed that the experimental interventions were more effective than the control interventions in lowering TC concentration (SMD = −0.27, 95% CI [−0.43, −0.11]; Figure 9).
We also performed subgroup analyses based on the duration of probiotic treatment (Figure 9a) and the probiotic strains used (Figure 9b). Intervention durations of less than or equal to 2 months (SMD = −0.29, 95% CI [−0.54, −0.04]), 2 to 3 months (SMD = −0.16, 95% CI [−0.30, −0.03]), and 3 to 6 months (SMD = −0.86, 95% CI [−1.45, −0.27]) resulted in significant reductions in TC concentration. In the subgroup analysis based on different strains, the experimental interventions were more effective than the control interventions in reducing TC when the former comprised multi-strain probiotics (SMD = −0.24, 95% CI [−0.36, −0.13]), but not when they comprised single-strain probiotics (SMD = −0.26, 95% CI [−0.79, 0.28]).

3.4.8. Effects of Probiotic Therapy on Low-Density Lipoprotein Concentration

Twenty-six studies [11,18,19,20,21,22,23,24,25,27,28,29,30,32,33,38,39,40,43,45,49,50,51,52], with a total of 1002 cases in the experimental group and 889 cases in the control group, examined the effect of probiotic interventions on low-density lipoprotein (LDL) concentration in patients with T2DM. Combining effect sizes using a random-effects model (I2 = 63.9%, p = 0.000) revealed that the experimental interventions were more effective than the control interventions in lowering LDL concentration (SMD = −0.20, 95% CI [−0.37, −0.04]; Figure 10).
We also performed subgroup analyses based on the duration of probiotic treatment (Figure 10a) and the probiotic strains used (Figure 10b). Intervention durations of less than or equal to 2 months (SMD = −0.22, 95% CI [−0.47, 0.03]) and 2 to 3 months (SMD = −0.09, 95% CI [−0.23, 0.04]) had no significant effect on LDL concentration. However, intervention durations of 3 to 6 months (SMD = −0.76, 95% CI [−1.28, −0.25]) had a significant effect on LDL concentration. In the subgroup analysis based on different strains, the experimental interventions were more effective than the control interventions in reducing LDL when the former comprised multi-strain probiotics (SMD = −0.18, 95% CI [−0.32, −0.05]), but not when they comprised single-strain probiotics (SMD = −0.17, 95% CI [−0.63, 0.29]).

3.4.9. Effects of Probiotic Therapy on High-Density Lipoprotein Concentration

Twenty-eight studies [11,18,19,20,21,22,23,24,25,27,28,29,30,31,32,33,38,39,40,42,43,45,49,50,51,52], with a total of 1080 cases in the experimental group and 965 cases in the control group, examined the effect of probiotic interventions on high-density lipoprotein (HDL) concentration in patients with T2DM. A random-effects model that combined effect sizes (I2 = 82.1%, p = 0.000) revealed that the experimental interventions were more effective than the control interventions in increasing HDL concentration (SMD = 0.31, 95% CI [0.08, 0.54]; Figure 11).
We also performed subgroup analyses based on the duration of probiotic treatment (Figure 11a) and the probiotic strains used (Figure 11b). An intervention duration of 2 to 3 months (SMD = 0.34, 95% CI [0.14, 0.54]) was effective in increasing HDL concentration, but those of less than or equal to 2 months (SMD = 0.38, 95% CI [−0.18, 0.94]), or 3 to 6 months (SMD = −0.04, 95% CI [−0.31, 0.23]), were not. In the subgroup analysis based on different strains, the experimental interventions were more effective than the control interventions in increasing HDL when the former comprised multi-strain probiotics (SMD = 0.26, 95% CI [0.10, 0.43]), but not when they comprised single-strain probiotics (SMD = 0.40, 95% CI [−0.34, 1.15]).

3.5. Sensitivity Analysis and Publication Bias Test

The included studies exhibited no sensitivity problems. However, Egger’s test was used to examine the funnel plots, and it demonstrated that there was publication bias for the HOMA-IR, TC, and TG data (p = 0.006, p = 0.003, and p = 0.02, respectively; Table 2). We employed funnel plots to depict publication bias, and we used the trim-and-fill method to evaluate these in light of the publication bias that existed in the included studies. Including eight studies in the TC model resulted in a symmetrical funnel plot, and the total effect size was −0.430 (−0.583, −0.277). No additional studies were required to make the funnel plots symmetrical for the IR and TG models, and the overall effect sizes were consistent (Table 3). Funnel plots and sensitivity analyses are provided in Supplementary S2.

4. Discussion

As the gut microbiota is crucial for preserving the body’s normal metabolism, it is now recognised as a significant ‘hidden’ organ in the human body [53]. The makeup of the gut microbiota varies significantly between individuals, and it is influenced by a several variables, including genetics, diet, lifestyle, and health status [54]. The composition of the gut microbiota has been linked to the occurrence and development of T2DM, and an imbalanced gut microbiota stimulates the body to produce cytokines that reduce insulin sensitivity and accelerate the onset of diabetes [55]. To control the balance of the gut microbiota and reduce insulin resistance in patients with T2DM, Zhai LX et al. have proposed probiotic administration [56]. Probiotics are microorganisms that change the gut microbiota of their host, and therefore, they have a variety of effects; for example, they can preserve the gut microbiota’s structural balance, increase the body’s antioxidant concentrations, and reduce intestinal inflammation [57]. Bianchi et al. found that probiotics can safely and efficiently change a patient’s gut microbiota, and they advised patients with metabolic illnesses to consume them frequently [58]. Lipopolysaccharides, which enter the blood to cause inflammation, disrupt intestinal integrity and influence the body’s glucose metabolism, primarily by increasing concentrations of glycated haemoglobin; they are much more prevalent in patients with T2DM than healthy individuals [59]. However, Kim YA et al. found that patients with T2DM who consume probiotics have significantly lower lipopolysaccharide concentrations, less endoplasmic reticulum stress, and improved insulin sensitivity [60].
In this meta-analysis, the effects of probiotics on glucolipid metabolism were assessed in 37 RCTs involving a total of 2502 participants with T2DM. Analysis of the combined data showed that after treatment, patients in the probiotic group had significantly lower fasting glucose and fasting insulin concentrations than those in the control group. This suggests that probiotics can assist patients with T2DM to control their blood sugar concentrations. Problems with gut microbiota cause patients with T2DM to have significantly lower glucagon-like peptide-1 concentrations than people without T2DM, which promotes gastric emptying in these patients and makes them feel hungry [61]. A hypoglycaemic effect can be produced via probiotic administration, as this promotes the production of glucagon-like peptide-1, thus inhibiting glucagon secretion and delaying gastric emptying [62]. This suggests that oral probiotics help to control glycated haemoglobin concentrations by promoting a glucagon-like peptide-1 release. More specifically, after treatment, glycated haemoglobin concentrations decreased to a significantly greater extent in the experimental group than in the control group. Additionally, the findings of this meta-analysis demonstrated that the change in HOMA-IR score after probiotic treatment was significantly greater in the experimental group than the control group. The HOMA-IR score reflects the equilibrium between hepatic glucose output and insulin secretion, allowing physicians to gauge the severity of a patient’s insulin resistance. The abovementioned finding implies that in patients with T2DM, oral probiotics may reduce insulin resistance and improve insulin sensitivity. However, publication bias was present in the meta-analysis of the HOMA-IR score (p = 0.006), which may be due to the calibre of the studies included.
Obesity is an independent risk factor for T2DM. Moreover, there are differences in the composition of the gut microbiota between obese and healthy patients, and disorders of the gut microbiota aggravate obesity [63,64]. Obese patients have elevated concentrations of cytokines, interleukins, the tumour necrosis factor, and lipopolysaccharides, resulting in a chronic inflammatory state, which leads to metabolic disorders and obesity-related diseases [65]. Oral probiotics can increase the abundance of certain intestinal microbiota to therefore alleviate metabolic syndrome problems and improve immune function in obese adults [66]. The results of this meta-analysis showed that compared with the control group, the experimental group exhibited significant improvements in BMI and in TG, TC, HDL, and LDL concentrations. However, there was publication bias in the meta-analysis of the TG and TC concentrations (p = 0.006) which may be related to the quality of the studies included. TG and HDL cholesterol concentrations can be controlled by altering the composition of the gut microbiota [67]. This could occur via several possible mechanisms, such as a reduction in the enterohepatic circulation of bile salts, the assimilation of cholesterol in the gastrointestinal tract, and the conversion of cholesterol to faecal sterols in the intestine [68]. In addition, the activation of farnesol receptors may also modulate TG concentrations [69], thereby improving lipid concentrations [70]. Mechanisms of cholesterol removal via lactic acid bacteria have been proposed in previous studies. For example, probiotics were found to purify bile salts by lowering cholesterol concentrations, due to the absorption of cholesterol by bacterial cell membranes via bile salt hydrolases [71]. Another study found that a probiotic mixture could modulate apolipoprotein synthesis via a mechanism that may be mediated by peroxisome proliferator-activated receptor/farnesoid X receptor upregulation during enterohepatic circulation [72]. Lactobacillus rhamnosus GG and the Bifidobacterium subfamily may partially prevent hepatic steatosis and damage by regulating the activation of hepatic adenylate-activated protein kinase [73,74]. Supplementation with Bifidobacterium shortum B-3 inhibits the accumulation of epithelial fat and upregulates the expression of genes related to lipid metabolism and insulin sensitivity [6]. The mechanisms of these effects may be diverse, and they need to be investigated further in vivo.
In accordance with our subgroup analysis, patients treated with multi-strain probiotics experienced greater reductions in fasting blood glucose concentrations than those treated with a single strain of probiotics. Chapman et al. observed that multi-strain probiotics combinations offer more health benefits than any constituent strain alone [75], which is consistent with our findings. Synergistic interactions between probiotic strains may account for this effect, and they may be the result of functional groups interacting with one another to enhance the host’s glycaemic parameters [6].
The following limitations apply to this meta-analysis. The probiotic doses varied significantly between the included studies, and some studies did not specify the doses used. Therefore, the effect of probiotic dose levels on glycaemic control in patients with T2DM requires confirmation in other studies. Guerrero-Bonmatty et al. showed that the combination of monacolin K (a statin) and L. plantarum strains was more effective in reducing LDL-C and TC levels in the treatment of hypercholesterolemia [76]. Therefore, in the future, some studies concerning probiotics in combination with statins, versus probiotics alone, could be considered. Moreover, general information about patients’ ages and BMIs varied between the included studies, which may have increased the clinical heterogeneity of the sample used for this meta-analysis.
In future research, there are many new probiotics, in addition to the traditional ones, worth considering for use at this stage. Since probiotics are excellent carriers or delivery devices, they can be recombined to orally deliver to antidiabetic targets [77]. Although probiotics are usually defined as living microorganisms, it might be worth considering whether dead strains are as potent, or even more potent, than live strains [78]. Although most of the probiotics that are widely used at this stage are lactic acid bacteria, there are also some potentially novel probiotics such as Akkermansia muciniphila, which also have antidiabetic properties [79]. In the future, further experiments and clinical trials will inevitably be needed to identify and compare the effects of different probiotic strains and dosages. Furthermore, the preparation technique and viability of probiotics, as well as the duration and regimen of good treatments, are also important factors that influence their antidiabetic activity.

5. Conclusions

In conclusion, this meta-analysis shows that oral probiotics aid in the regulation of glucolipid metabolism in patients with T2DM, primarily indicated by a marked decrease in glucose metabolism and lipid metabolism following treatment. These findings suggest that probiotic supplementation can be utilised as a complementary therapy to help prevent T2DM. To confirm the ability of probiotics to support glycaemic, lipid, and blood pressure regulation, additional clinical investigations with various patient profiles, probiotic dosages, and intervention durations are required.

Supplementary Materials

The following supporting information can be downloaded at: https://www.mdpi.com/article/10.3390/nu15143240/s1, Supplementary S1: Details of searching strategy and screening process. Supplementary S2: funnel plots and sensitivity analysis.

Author Contributions

Conceptualization, G.W. and M.Z.; methodology, R.X., L.W. and P.T.; software, H.Z.; validation, X.J. and J.Z.; data curation, J.Z.; writing—original draft preparation, R.X.; writing—review and editing, G.W. and M.Z.; visualization, R.X., L.W. and P.T.; supervision, G.W.; project administration, G.W.; funding acquisition, G.W. and M.Z. All authors have read and agreed to the published version of the manuscript.

Funding

This work was financially supported by the National Natural Science Foundation of China (No. 31972052, 32021005, 31820103010), the Fundamental Research Funds for the Central Universities (JUSRP22006, JUSRP51501), the Program of Collaborative Innovation Centre of Food Safety and Quality Control in Jiangsu Province, Wuxi key medical discipline construction program from Wuxi Health Commission—Innovation Team of Anaesthesiology (CXTD2021017, 2021–2025).

Institutional Review Board Statement

Not applicable.

Informed Consent Statement

Not applicable.

Data Availability Statement

No new data were created or analyzed in this study. Data sharing is not applicable to this article.

Conflicts of Interest

The authors declare no conflict of interest.

References

  1. Zhang, C.; Wang, C.; Li, S.; Yu, L.; Tian, F.; Zhao, J.; Zhang, H.; Chen, W.; Zhai, Q. Meta-analysis of randomized controlled trials of the effects of probiotics on type 2 diabetes in adults. Clin. Nutr. 2022, 41, 365–373. [Google Scholar] [CrossRef]
  2. Nie, Q.X.; Hu, J.L.; Gao, H.; Fan, L.L.; Chen, H.H.; Nie, S.P. Polysaccharide from Plantago asiatica L. attenuates hyperglycemia, hyperlipidemia and affects colon microbiota in type 2 diabetic rats. Food Hydrocoll. 2019, 86, 34–42. [Google Scholar] [CrossRef]
  3. Aschner, P. Insulin Therapy in Type 2 Diabetes. Am. J. Ther. 2020, 27, E79–E90. [Google Scholar] [CrossRef]
  4. Tamborlane, W.V.; Fainberg, U.; Barrett, T. Liraglutide in Children and Teens with Type 2 Diabetes REPLY. N. Engl. J. Med. 2019, 381, 1787. [Google Scholar] [CrossRef]
  5. Komaroff, A.L. The Microbiome and Risk for Obesity and Diabetes. J. Am. Med. Assoc. 2017, 317, 355–356. [Google Scholar] [CrossRef]
  6. Zhao, L.P.; Zhang, F.; Ding, X.Y.; Wu, G.J.; Lam, Y.Y.; Wang, X.J.; Fu, H.Q.; Xue, X.H.; Lu, C.H.; Ma, J.L.; et al. Gut bacteria selectively promoted by dietary fibers alleviate type 2 diabetes. Science 2018, 359, 1151. [Google Scholar] [CrossRef] [Green Version]
  7. Wu, H.; Tremaroli, V.; Schmidt, C.; Lundqvist, A.; Olsson, L.M.; Kramer, M.; Gummesson, A.; Perkins, R.; Bergstrom, G.; Backhed, F. The Gut Microbiota in Prediabetes and Diabetes: A Population-Based Cross-Sectional Study. Cell Metab. 2020, 32, 379–390. [Google Scholar] [CrossRef]
  8. Chen, Z.L.; Radjabzadeh, D.; Chen, L.M.; Kurilshikov, A.; Kavousi, M.; Ahmadizar, F.; Ikram, M.A.; Uitterlinden, A.G.; Zhernakova, A.; Fu, J.Y.; et al. Association of Insulin Resistance and Type 2 Diabetes with Gut Microbial Diversity a Microbiome-Wide Analysis From Population Studies. JAMA Netw. Open 2021, 4, e2118811. [Google Scholar] [CrossRef]
  9. Que, Y.Y.; Cao, M.; He, J.Q.; Zhang, Q.; Chen, Q.Y.; Yan, C.S.; Lin, A.Q.; Yang, L.X.; Wu, Z.Z.; Zhu, D.; et al. Gut Bacterial Characteristics of Patients with Type 2 Diabetes Mellitus and the Application Potential. Front. Immunol. 2021, 12, 3218. [Google Scholar] [CrossRef]
  10. Ke, X.X.; Walker, A.; Haange, S.B.; Lagkouvardos, I.; Liu, Y.W.; Schmitt-Kopplin, P.; Von Bergen, M.; Jehmlich, N.; He, X.; Clavel, T.; et al. Synbiotic-driven improvement of metabolic disturbances is associated with changes in the gut microbiome in diet-induced obese mice. Mol. Metab. 2019, 22, 96–109. [Google Scholar] [CrossRef]
  11. Sabico, S.; Al-Mashharawi, A.; Al-Daghri, N.M.; Wani, K.; Amer, O.E.; Hussain, D.S.; Ansari, M.G.A.; Masoud, M.S.; Alokail, M.S.; McTernan, P.G. Effects of a 6-month multi-strain probiotics supplementation in endotoxemic, inflammatory and cardiometabolic status of T2DM patients: A randomized, double-blind, placebo-controlled trial. Clin. Nutr. 2019, 38, 1561–1569. [Google Scholar] [CrossRef] [Green Version]
  12. Kassaian, N.; Feizi, A.; Aminorroaya, A.; Jafari, P.; Ebrahimi, M.T.; Amini, M. The effects of probiotics and synbiotic supplementation on glucose and insulin metabolism in adults with prediabetes: A double-blind randomized clinical trial. Acta Diabetol. 2018, 55, 1019–1028. [Google Scholar] [CrossRef]
  13. Ardeshirlarijani, E.; Tabatabaei-Malazy, O.; Mohseni, S.; Qorbani, M.; Larijani, B.; Jalili, R.B. Effect of probiotics supplementation on glucose and oxidative stress in type 2 diabetes mellitus: A meta-analysis of randomized trials. Daru-J. Pharm. Sci. 2019, 27, 827–837. [Google Scholar] [CrossRef]
  14. Tao, Y.W.; Gu, Y.L.; Mao, X.Q.; Zhang, L.; Pei, Y.F. Effects of probiotics on type II diabetes mellitus: A meta-analysis. J. Transl. Med. 2020, 18, 30. [Google Scholar] [CrossRef] [Green Version]
  15. Hu, Y.M.; Zhou, F.; Yuan, Y.; Xu, Y.C. Effects of probiotics supplement in patients with type 2 diabetes mellitus: A meta-analysis of randomized trials. Med. Clin. 2017, 148, 362–370. [Google Scholar] [CrossRef]
  16. Kocsis, T.; Molnar, B.; Nemeth, D.; Hegyi, P.; Szakacs, Z.; Balint, A.; Garami, A.; Soos, A.; Marta, K.; Solymar, M. Probiotics have beneficial metabolic effects in patients with type 2 diabetes mellitus: A meta-analysis of randomized clinical trials. Sci. Rep. 2020, 10, 11787. [Google Scholar] [CrossRef]
  17. Khalili, L.; Alipour, B.; Asghari Jafar-Abadi, M.; Faraji, I.; Hassanalilou, T.; Mesgari Abbasi, M.; Vaghef-Mehrabany, E.; Alizadeh Sani, M. The Effects of Lactobacillus casei on Glycemic Response, Serum Sirtuin1 and Fetuin-A Levels in Patients with Type 2 Diabetes Mellitus: A Randomized Controlled Trial. Iran. Biomed. J. 2019, 23, 68–77. [Google Scholar] [CrossRef] [Green Version]
  18. Firouzi, S.; Majid, H.A.; Ismail, A.; Kamaruddin, N.A.; Barakatun-Nisak, M.Y. Effect of multi-strain probiotics (multi-strain microbial cell preparation) on glycemic control and other diabetes-related outcomes in people with type 2 diabetes: A randomized controlled trial. Eur. J. Nutr. 2017, 56, 1535–1550. [Google Scholar] [CrossRef] [PubMed]
  19. Razmpoosh, E.; Javadi, A.; Ejtahed, H.S.; Mirmiran, P.; Javadi, M.; Yousefinejad, A. The effect of probiotic supplementation on glycemic control and lipid profile in patients with type 2 diabetes: A randomized placebo controlled trial. Diabetes Metab. Syndr.-Clin. Res. Rev. 2019, 13, 175–182. [Google Scholar] [CrossRef]
  20. Mazloom, Z.; Yousefinejad, A.; Dabbaghmanesh, M.H. Effect of probiotics on lipid profile, glycemic control, insulin action, oxidative stress, and inflammatory markers in patients with type 2 diabetes: A clinical trial. Iran. J. Med. Sci. 2013, 38, 38–43. [Google Scholar]
  21. Ebrahimi, Z.S.; Nasli-Esfahani, E.; Nadjarzade, A.; Mozaffari-Khosravi, H. Effect of symbiotic supplementation on glycemic control, lipid profiles and microalbuminuria in patients with non-obese type 2 diabetes: A randomized, double-blind, clinical trial. J. Diabetes Metab. Disord. 2017, 16, 23. [Google Scholar] [CrossRef] [Green Version]
  22. Asemi, Z.; Zare, Z.; Shakeri, H.; Sabihi, S.S.; Esmaillzadeh, A. Effect of Multispecies Probiotic Supplements on Metabolic Profiles, hs-CRP, and Oxidative Stress in Patients with Type 2 Diabetes (Publication with Expression of Concern. See, J.A.N.; 2023). Ann. Nutr. Metab. 2013, 63, 1–9. [Google Scholar] [CrossRef]
  23. Asemi, Z.; Alizadeh, S.A.; Ahmad, K.; Goli, M.; Esmaillzadeh, A. Effects of beta-carotene fortified synbiotic food on metabolic control of patients with type 2 diabetes mellitus: A double-blind randomized cross-over controlled clinical trial. Clin. Nutr. 2016, 35, 819–825. [Google Scholar] [CrossRef]
  24. Asemi, Z.; Khorrami-Rad, A.; Alizadeh, S.A.; Shakeri, H.; Esmaillzadeh, A. Effects of synbiotic food consumption on metabolic status of diabetic patients: A double-blind randomized cross-over controlled clinical trial. Clin. Nutr. 2014, 33, 198–203. [Google Scholar] [CrossRef]
  25. Tonucci, L.B.; dos Santos, K.M.O.; de Oliveira, L.L.; Ribeiro, S.M.R.; Martino, H.S.D. Clinical application of probiotics in type 2 diabetes mellitus: A randomized, double-blind, placebo-controlled study. Clin. Nutr. 2017, 36, 85–92. [Google Scholar] [CrossRef]
  26. Ejtahed, H.S.; Mohtadi-Nia, J.; Homayouni-Rad, A.; Niafar, M.; Asghari-Jafarabadi, M.; Mofid, V. Probiotic yogurt improves antioxidant status in type 2 diabetic patients. Nutrition 2012, 28, 539–543. [Google Scholar] [CrossRef]
  27. Sabico, S.; Al-Mashharawi, A.; Al-Daghri, N.M.; Yakout, S.; Alnaami, A.M.; Alokail, M.S.; McTernan, P.G. Effects of a multi-strain probiotic supplement for 12 weeks in circulating endotoxin levels and cardiometabolic profiles of medication naive T2DM patients: A randomized clinical trial. J. Transl. Med. 2017, 15, 249. [Google Scholar] [CrossRef] [Green Version]
  28. Ostadrahimi, A.; Taghizadeh, A.; Mobasseri, M.; Farrin, N.; Payahoo, L.; Gheshlaghi, Z.B.; Vahedjabbari, M. Effect of Probiotic Fermented Milk (Kefir) on Glycemic Control and Lipid Profile In Type 2 Diabetic Patients: A Randomized Double-Blind Placebo-Controlled Clinical Trial. Iran. J. Public Health 2015, 44, 228–237. [Google Scholar]
  29. Mobini, R.; Tremaroli, V.; Stahlman, M.; Karlsson, F.; Levin, M.; Ljungberg, M.; Sohlin, M.; Perkins, R.; Perkins, R.; Baackhed, F.; et al. Metabolic effects of Lactobacillus reuteri DSM 17938 in people with type 2 diabetes: A randomized controlled trial. Diabetes Obes. Metab. 2017, 19, 579–589. [Google Scholar] [CrossRef]
  30. Feizollahzadeh, S.; Ghiasvand, R.; Rezaei, A.; Khanahmad, H.; Sadeghi, A.; Hariri, M. Effect of Probiotic Soy Milk on Serum Levels of Adiponectin, Inflammatory Mediators, Lipid Profile, and Fasting Blood Glucose among Patients with Type II Diabetes Mellitus. Probiotics Antimicrob. Proteins 2017, 9, 41–47. [Google Scholar] [CrossRef]
  31. Sato, J.; Kanazawa, A.; Azuma, K.; Ikeda, F.; Goto, H.; Komiya, K.; Kanno, R.; Tamura, Y.; Asahara, T.; Takahashi, T.; et al. Probiotic reduces bacterial translocation in type 2 diabetes mellitus: A randomised controlled study. Sci. Rep. 2017, 7, 12115. [Google Scholar] [CrossRef] [Green Version]
  32. Hove, K.D.; Brons, C.; Faerch, K.; Lund, S.S.; Rossing, P.; Vaag, A. Effects of 12 weeks of treatment with fermented milk on blood pressure, glucose metabolism and markers of cardiovascular risk in patients with type 2 diabetes: A randomised double-blind placebo-controlled study. Eur. J. Endocrinol. 2015, 172, 11–20. [Google Scholar] [CrossRef] [Green Version]
  33. Tajabadi-Ebrahimi, M.; Sharifi, N.; Farrokhian, A.; Raygan, F.; Karamali, F.; Razzaghi, R.; Taheri, S.; Asemi, Z. A Randomized Controlled Clinical Trial Investigating the Effect of Synbiotic Administration on Markers of Insulin Metabolism and Lipid Profiles in Overweight Type 2 Diabetic Patients with—Coronary Heart Disease. Exp. Clin. Endocrinol. Diabetes 2017, 125, 21–27. [Google Scholar] [CrossRef]
  34. Mohamadshahi, M.; Veissi, M.; Haidari, F.; Shahbazian, H.; Kaydani, G.A.; Mohammadi, F. Effects of probiotic yogurt consumption on inflammatory biomarkers in patients with type 2 diabetes. Bioimpacts 2014, 4, 83–88. [Google Scholar]
  35. Kobyliak, N.; Falalyeyeva, T.; Mykhalchyshyn, G.; Kyriienko, D.; Komissarenko, I. Effect of alive probiotic on insulin resistance in type 2 diabetes patients: Randomized clinical trial. Diabetes Metab. Syndr.-Clin. Res. Rev. 2018, 12, 617–624. [Google Scholar] [CrossRef]
  36. Tajadadi-Ebrahimi, M.; Bahmani, F.; Shakeri, H.; Hadaegh, H.; Hijijafari, M.; Abedi, F.; Asemi, Z. Effects of daily consumption of synbiotic bread on insulin metabolism and serum high-sensitivity C-reactive protein among diabetic patients: A double-blind, randomized, controlled clinical trial. Ann. Nutr. Metab. 2014, 65, 34–41. [Google Scholar] [CrossRef]
  37. Hosseinzadeh, P.; Javanbakht, M.H.; Mostafavi, S.A.; Djalali, M.; Derakhshanian, H.; Hajianfar, H.; Bahonar, A.; Djazayery, A. Brewer’s Yeast Improves Glycemic Indices in Type 2 Diabetes Mellitus. Int J. Prev. Med. 2013, 4, 1131–1138. [Google Scholar]
  38. Shakeri, H.; Hadaegh, H.; Abedi, F.; Tajabadi-Ebrahimi, M.; Mazroii, N.; Ghandi, Y.; Asemi, Z. Consumption of synbiotic bread decreases triacylglycerol and VLDL levels while increasing HDL levels in serum from patients with type-2 diabetes. Lipids 2014, 49, 695–701. [Google Scholar] [CrossRef]
  39. Madempudi, R.S.; Ahire, J.J.; Neelamraju, J.; Tripathi, A.; Nanal, S. Efficacy of UB0316, a multi-strain probiotic formulation in patients with type 2 diabetes mellitus: A double blind, randomized, placebo controlled study. PLoS ONE 2019, 14, e0225168. [Google Scholar] [CrossRef]
  40. Chaiyasut, C.; Sivamaruthi, B.S.; Kesika, P.; Khongtan, S.; Khampithum, N.; Thangaleela, S.; Peerajan, S.; Bumrungpert, A.; Chaiyasut, K.; Sirilun, S.; et al. Synbiotic Supplementation Improves Obesity Index and Metabolic Biomarkers in Thai Obese Adults: A Randomized Clinical Trial. Foods 2021, 10, 1580. [Google Scholar] [CrossRef]
  41. Jiang, H.; Zhang, Y.; Xu, D.; Wang, Q. Probiotics ameliorates glycemic control of patients with diabetic nephropathy: A randomized clinical study. J. Clin. Lab. Anal. 2021, 35, e23650. [Google Scholar] [CrossRef] [PubMed]
  42. Kanazawa, A.; Aida, M.; Yoshida, Y.; Kaga, H.; Katahira, T.; Suzuki, L.; Tamaki, S.; Sato, J.; Goto, H.; Azuma, K.; et al. Effects of Synbiotic Supplementation on Chronic Inflammation and the Gut Microbiota in Obese Patients with Type 2 Diabetes Mellitus: A Randomized Controlled Study. Nutrients 2021, 13, 558. [Google Scholar] [CrossRef] [PubMed]
  43. Toejing, P.; Khampithum, N.; Sirilun, S.; Chaiyasut, C.; Lailerd, N. Influence of Lactobacillus paracasei HII01 Supplementation on Glycemia and Inflammatory Biomarkers in Type 2 Diabetes: A Randomized Clinical Trial. Foods 2021, 10, 1455. [Google Scholar] [CrossRef] [PubMed]
  44. Oh, M.R.; Jang, H.Y.; Lee, S.Y.; Jung, S.J.; Chae, S.W.; Lee, S.O.; Park, B.H. Lactobacillus plantarum HAC01 Supplementation Improves Glycemic Control in Prediabetic Subjects: A Randomized, Double-Blind, Placebo-Controlled Trial. Nutrients 2021, 13, 2337. [Google Scholar] [CrossRef]
  45. Tay, A.; Pringle, H.; Penning, E.; Plank, L.D.; Murphy, R. PROFAST: A Randomized Trial Assessing the Effects of Intermittent Fasting and Lacticaseibacillus rhamnosus Probiotic among People with Prediabetes. Nutrients 2020, 12, 3530. [Google Scholar] [CrossRef] [PubMed]
  46. Palacios, T.; Vitetta, L.; Coulson, S.; Madigan, C.D.; Lam, Y.Y.; Manuel, R.; Briskey, D.; Hendy, C.; Kim, J.N.; Ishoey, T.; et al. Targeting the Intestinal Microbiota to Prevent Type 2 Diabetes and Enhance the Effect of Metformin on Glycaemia: A Randomised Controlled Pilot Study. Nutrients 2020, 12, 2041. [Google Scholar] [CrossRef]
  47. Toshimitsu, T.; Gotou, A.; Sashihara, T.; Hachimura, S.; Shioya, N.; Suzuki, S.; Asami, Y. Effects of 12-Week Ingestion of Yogurt Containing Lactobacillus plantarum OLL2712 on Glucose Metabolism and Chronic Inflammation in Prediabetic Adults: A Randomized Placebo-Controlled Trial. Nutrients 2020, 12, 374. [Google Scholar] [CrossRef] [Green Version]
  48. Stefanaki, C.; Michos, A.; Mastorakos, G.; Mantzou, A.; Landis, G.; Zosi, P.; Bacopoulou, F. Probiotics in Adolescent Prediabetes: A Pilot RCT on Glycemic Control and Intestinal Bacteriome. J. Clin. Med. 2019, 8, 1743. [Google Scholar] [CrossRef] [Green Version]
  49. Hsieh, M.C.; Tsai, W.H.; Jheng, Y.P.; Su, S.L.; Wang, S.Y.; Lin, C.C.; Chen, Y.H.; Chang, W.W. The beneficial effects of Lactobacillus reuteri ADR-1 or ADR-3 consumption on type 2 diabetes mellitus: A randomized, double-blinded, placebo-controlled trial. Sci. Rep. 2018, 8, 16791. [Google Scholar] [CrossRef] [PubMed] [Green Version]
  50. Raygan, F.; Rezavandi, Z.; Bahmani, F.; Ostadmohammadi, V.; Mansournia, M.A.; Tajabadi-Ebrahimi, M.; Borzabadi, S.; Asemi, Z. The effects of probiotic supplementation on metabolic status in type 2 diabetic patients with coronary heart disease. Diabetol. Metab. Syndr. 2018, 10, 51. [Google Scholar] [CrossRef]
  51. Soleimani, A.; Zarrati Mojarrad, M.; Bahmani, F.; Taghizadeh, M.; Ramezani, M.; Tajabadi-Ebrahimi, M.; Jafari, P.; Esmaillzadeh, A.; Asemi, Z. Probiotic supplementation in diabetic hemodialysis patients has beneficial metabolic effects. Kidney Int. 2017, 91, 435–442. [Google Scholar] [CrossRef]
  52. Ming, J.; Yu, X.; Xu, X.; Wang, L.; Ding, C.; Wang, Z.; Xie, X.; Li, S.; Yang, W.; Luo, S.; et al. Effectiveness and safety of Bifidobacterium and berberine in human hyperglycemia and their regulatory effect on the gut microbiota: A multi-center, double-blind, randomized, parallel-controlled study. Genome Med. 2021, 13, 125. [Google Scholar] [CrossRef] [PubMed]
  53. de Vos, W.M.; Tilg, H.; Van Hul, M.; Cani, P.D. Gut microbiome and health: Mechanistic insights. Gut 2022, 71, 1020–1032. [Google Scholar] [CrossRef] [PubMed]
  54. Alvarez, J.; Real, J.M.F.; Guarner, F.; Gueimonde, M.; Rodriguez, J.M.; de Pipaon, M.S.; Sanz, Y. Gut microbes and health. Gastroenterol. Y Hepatol. 2021, 44, 519–535. [Google Scholar] [CrossRef]
  55. Lau, W.L.; Tran, T.; Rhee, C.M.; Kalantar-Zadeh, K.; Vaziri, N.D. Diabetes and the Gut Microbiome. Semin. Nephrol. 2021, 41, 104–113. [Google Scholar] [CrossRef]
  56. Zhai, L.X.; Wu, J.Y.; Lam, Y.Y.; Kwan, H.Y.; Bian, Z.X.; Wong, H.L.X. Gut-Microbial Metabolites, Probiotics and Their Roles in Type 2 Diabetes. Int. J. Mol. Sci. 2021, 22, 12846. [Google Scholar] [CrossRef] [PubMed]
  57. Wieers, G.; Belkhir, L.; Enaud, R.; Leclercq, S.; de Foy, J.M.P.; Dequenne, I.; de Timary, P.; Cani, P.D. How Probiotics Affect the Microbiota. Front. Cell. Infect. Microbiol. 2020, 9, 454. [Google Scholar] [CrossRef] [PubMed] [Green Version]
  58. Bianchi, F.; Duque, A.; Saad, S.M.I.; Sivieri, K. Gut microbiome approaches to treat obesity in humans. Appl. Microbiol. Biotechnol. 2019, 103, 1081–1094. [Google Scholar] [CrossRef]
  59. Salazar, J.; Angarita, L.; Morillo, V.; Navarro, C.; Martinez, M.S.; Chacin, M.; Torres, W.; Rajotia, A.; Rojas, M.; Cano, C.; et al. Microbiota and Diabetes Mellitus: Role of Lipid Mediators. Nutrients 2020, 12, 3039. [Google Scholar] [CrossRef]
  60. Kim, Y.A.; Keogh, J.B.; Clifton, P.M. Probiotics, prebiotics, synbiotics and insulin sensitivity. Nutr. Res. Rev. 2018, 31, 35–51. [Google Scholar] [CrossRef]
  61. Aoki, R.; Kamikado, K.; Suda, W.; Takii, H.; Mikami, Y.; Suganuma, N.; Hattori, M.; Koga, Y. A proliferative probiotic Bifidobacterium strain in the gut ameliorates progression of metabolic disorders via microbiota modulation and acetate elevation. Sci. Rep. 2017, 7, 43522. [Google Scholar] [CrossRef] [PubMed] [Green Version]
  62. Wang, Y.M.; Dilidaxi, D.; Wu, Y.C.; Sailike, J.; Sun, X.; Nabi, X.H. Composite probiotics alleviate type 2 diabetes by regulating intestinal microbiota and inducing GLP-1 secretion in db/db mice. Biomed. Pharmacother. 2020, 125, 109914. [Google Scholar] [CrossRef] [PubMed]
  63. Peters, B.A.; Shapiro, J.A.; Church, T.R.; Miller, G.; Trinh-Shevrin, C.; Yuen, E.; Friedlander, C.; Hayes, R.B.; Ahn, J. A taxonomic signature of obesity in a large study of American adults. Sci. Rep. 2018, 8, 9749. [Google Scholar] [CrossRef] [PubMed] [Green Version]
  64. Singer-Englar, T.; Barlow, G.; Mathur, R. Obesity, diabetes, and the gut microbiome: An updated review. Expert Rev. Gastroenterol. Hepatol. 2019, 13, 3–15. [Google Scholar] [CrossRef] [PubMed]
  65. Gomes, A.C.; Hoffmann, C.; Mota, J.F. The human gut microbiota: Metabolism and perspective in obesity. Gut Microbes 2018, 9, 308–325. [Google Scholar] [CrossRef] [Green Version]
  66. Abenavoli, L.; Scarpellini, E.; Colica, C.; Boccuto, L.; Salehi, B.; Sharifi-Rad, J.; Aiello, V.; Romano, B.; De Lorenzo, A.; Izzo, A.A.; et al. Gut Microbiota and Obesity: A Role for Probiotics. Nutrients 2019, 11, 2690. [Google Scholar] [CrossRef] [Green Version]
  67. Allayee, H.; Hazen, S.L. Contribution of Gut Bacteria to Lipid Levels Another Metabolic Role for Microbes? Circ. Res. 2015, 117, 750–754. [Google Scholar] [CrossRef]
  68. Kumar, R.; Grover, S.; Batish, V.K. Bile Salt Hydrolase (Bsh) Activity Screening of Lactobacilli: In Vitro Selection of Indigenous Lactobacillus Strains with Potential Bile Salt Hydrolysing and Cholesterol-Lowering Ability. Probiotics Antimicrob. Proteins 2012, 4, 162–172. [Google Scholar] [CrossRef]
  69. Del Bas, J.M.; Ricketts, M.L.; Vaque, M.; Sala, E.; Quesada, H.; Ardevol, A.; Salvado, M.J.; Blay, M.; Arola, L.; Moore, D.D.; et al. Dietary procyanidins enhance transcriptional activity of bile acid-activated FXR in vitro and reduce triglyceridemia in vivo in a FXR-dependent manner. Mol. Nutr. Food Res. 2009, 53, 805–814. [Google Scholar] [CrossRef] [Green Version]
  70. Pols, T.W.H.; Noriega, L.G.; Nomura, M.; Auwerx, J.; Schoonjans, K. The Bile Acid Membrane Receptor TGR5: A Valuable Metabolic Target. Dig. Dis. 2011, 29, 37–44. [Google Scholar] [CrossRef] [Green Version]
  71. Staley, C.; Weingarden, A.R.; Khoruts, A.; Sadowsky, M.J. Interaction of gut microbiota with bile acid metabolism and its influence on disease states. Appl. Microbiol. Biotechnol. 2017, 101, 47–64. [Google Scholar] [CrossRef] [PubMed] [Green Version]
  72. Taranto, M.P.; Murga, M.L.F.; Lorca, G.; de Valdez, G.F. Bile salts and cholesterol induce changes in the lipid cell membrane of Lactobacillus reuteri. J. Appl. Microbiol. 2003, 95, 86–91. [Google Scholar] [CrossRef] [PubMed]
  73. Mencarelli, A.; Cipriani, S.; Renga, B.; Bruno, A.; D’Amore, C.; Distrutti, E.; Fiorucci, S. VSL#3 Resets Insulin Signaling and Protects against NASH and Atherosclerosis in a Model of Genetic Dyslipidemia and Intestinal Inflammation. PLoS ONE 2012, 7, e45425. [Google Scholar]
  74. Zhang, M.; Wang, C.L.; Wang, C.H.; Zhao, H.Y.; Zhao, C.Q.; Chen, Y.P.; Wang, Y.H.; McClain, C.; Feng, W.K. Enhanced AMPK phosphorylation contributes to the beneficial effects of Lactobacillus rhamnosus GG supernatant on chronic-alcohol-induced fatty liver disease. J. Nutr. Biochem. 2015, 26, 337–344. [Google Scholar] [CrossRef] [PubMed]
  75. Chapman, C.M.C.; Gibson, G.R.; Rowland, I. Health benefits of probiotics: Are mixtures more effective than single strains? Eur. J. Nutr. 2011, 50, 1–17. [Google Scholar] [CrossRef]
  76. Guerrero-Bonmatty, R.; Gil-Fernandez, G.; Rodriguez-Velasco, F.J.; Espadaler-Mazo, J. A Combination of Lactoplantibacillus plantarum Strains CECT7527, CECT7528, and CECT7529 Plus Monacolin K Reduces Blood Cholesterol: Results from a Randomized, Double-Blind, Placebo-Controlled Study. Nutrients 2021, 13, 1206. [Google Scholar] [CrossRef]
  77. Robert, S.; Steidler, L. Recombinant Lactococcus lactis can make the difference in antigen-specific immune tolerance induction, the Type 1 Diabetes case. Microb. Cell Factories 2014, 13, S11. [Google Scholar] [CrossRef] [Green Version]
  78. Adams, C.A. The probiotic paradox: Live and dead cells are biological response modifiers. Nutr. Res. Rev. 2010, 23, 37–46. [Google Scholar] [CrossRef] [Green Version]
  79. Hanninen, A.; Toivonen, R.; Poysti, S.; Belzer, C.; Plovier, H.; Ouwerkerk, J.P.; Emani, R.; Cani, P.D.; De Vos, W.M. Akkermansia muciniphila induces gut microbiota remodelling and controls islet autoimmunity in NOD mice. Gut 2018, 67, 1445–1453. [Google Scholar] [CrossRef] [Green Version]
Figure 1. Flowchart of Study Selection.
Nutrients 15 03240 g001
Figure 2. Bias risk evaluation for the studies that were included. The assessments concerning each risk of bias item for each included study are summarized in (A) of the risk of bias section. Low, high, and uncertain risk of bias are represented by the colours green, red, and yellow, respectively. (B) The risk of bias graph shows the percentages assigned to each risk of bias item across all included studies. Each point is assigned one of three bias assessment criteria, denoted by the colours green, red, or yellow, respectively: “Low”, “High”, and “Unclear” [11,17,18,19,20,21,22,23,24,26,27,28,29,30,31,32,33,34,35,36,37,38,39,40,41,42,43,44,45,46,47,48,49,50,51,52].
Nutrients 15 03240 g002
Figure 3. The impact of probiotic supplementation on BMI is shown using forest plots in a pooled study comparing against controls. The point estimate of the intervention effect is shown using solid black diamonds for each research item. The lower and upper bounds of the 95% CI for this effect are connected with the horizontal line. The subgroup and overall SMD, as determined using a random-effects model, are represented by the open diamonds. The red dotted line indicates pooled effect values. (a) shows a subgroup analysis of the duration of probiotic interventions, (b) shows a subgroup analysis of single or multiple probiotic strains [11,17,18,19,21,27,29,31,32,34,35,37,38,40,42,45,47,52].
Nutrients 15 03240 g003
Figure 4. Impact of probiotic supplementation on fasting blood glucose levels is shown using forest plots in a pooled study comparing against controls. The point estimate of the intervention effect is shown using solid black diamonds for each research item. The lower and upper bounds of the 95% CI for this effect are connected with the horizontal line. The subgroup and overall SMD, as determined using a random-effects model, are represented by the open diamonds. The red dotted line indicates pooled effect values. (a) shows a subgroup analysis of the duration of probiotic interventions, (b) shows a subgroup analysis of single or multiple probiotic strains [11,17,18,19,20,21,22,23,24,26,27,28,29,30,31,32,33,34,35,36,37,38,39,40,41,42,43,44,45,46,47,48,49,50,51,52].
Nutrients 15 03240 g004
Figure 5. Impact of probiotic supplementation on fasting insulin levels is shown using forest plots in a pooled analysis comparing against controls. The point estimate of the intervention effect is shown using solid black diamonds for each research item. The lower and upper bounds of the 95% CI for this effect are connected with the horizontal line. The subgroup and overall SMD, as determined using a random-effects model, are represented by the open diamonds. The red dotted line indicates pooled effect values. (a) shows a subgroup analysis of the duration of probiotic interventions, (b) shows a subgroup analysis of single or multiple probiotic strains [11,17,18,19,20,22,23,24,25,26,27,29,30,32,33,35,36,39,44,45,47,49,50,51].
Nutrients 15 03240 g005
Figure 6. Impact of probiotic supplementation on glycosylated haemoglobin is shown using forest plots in a combined study comparing against controls. The point estimate of the intervention effect is shown using solid black diamonds for each research item. The lower and upper bounds of the 95% CI for this effect are connected with the horizontal line. The subgroup and overall SMD, as determined using a random-effects model, are represented by the open diamonds. The red dotted line indicates pooled effect values. (a) shows a subgroup analysis of the duration of probiotic interventions. (b) shows a subgroup analysis of single or multiple probiotic strains [17,18,21,22,25,26,29,31,32,33,34,35,37,39,42,43,44,45,46,47,48,49,51,52].
Nutrients 15 03240 g006
Figure 7. Impact of probiotic supplementation on HOMA-IR is shown using forest plots in a pooled study comparing against controls. The point estimate of the intervention effect is shown using solid black diamonds for each research item. The lower and upper bounds of the 95% CI for this effect are connected with the horizontal line. The subgroup and overall SMD, as determined using a random-effects model, are represented by the open diamonds. The red dotted line indicates pooled effect values. (a) shows a subgroup analysis of the duration of probiotic interventions, (b) shows a subgroup analysis of single or multiple probiotic strains [17,18,19,20,22,23,24,25,27,30,32,33,36,37,39,44,45,47,49,50,51,52].
Nutrients 15 03240 g007
Figure 8. Impact of probiotic supplementation on TG is shown using forest plots in a pooled analysis comparing against controls. The point estimate of the intervention effect is shown using solid black diamonds for each research item. The lower and upper bounds of the 95% CI for this effect are connected with the horizontal line. The subgroup and overall SMD, as determined using a random-effects model, are represented by the open diamonds. The red dotted line indicates pooled effect values. (a) shows a subgroup analysis of the duration of probiotic interventions, (b) shows a subgroup analysis of single or multiple probiotic strains [11,18,19,20,21,22,23,24,27,28,29,30,31,32,33,39,40,42,43,45,49,50,51,52].
Nutrients 15 03240 g008
Figure 9. Impact of probiotic supplementation on TC is shown using forest plots in a pooled analysis comparing against controls. The point estimate of the intervention effect is shown using solid black diamonds for each research item. The lower and upper bounds of the 95% CI for this effect are connected with the horizontal line. The subgroup and overall SMD, as determined using a random-effects model, are represented by the open diamonds. The red dotted line indicates pooled effect values. (a) shows a subgroup analysis of the duration of probiotic interventions, (b) shows a subgroup analysis of single or multiple probiotic strains [11,18,19,20,21,22,23,24,25,27,28,29,30,32,33,38,39,40,43,45,49,50,51,52].
Nutrients 15 03240 g009
Figure 10. Impact of probiotic supplementation on LDL as measured by forest plots in a pooled analysis comparing against controls. The point estimate of the intervention effect is shown using solid black diamonds for each research item. The lower and upper bounds of the 95% CI for this effect are connected with the horizontal line. The subgroup and overall SMD, as determined using a random-effects model, are represented by the open diamonds. The red dotted line indicates pooled effect values. (a) shows a subgroup analysis of the duration of probiotic interventions, (b) shows a subgroup analysis of single or multiple probiotic strains [11,18,19,20,21,22,23,24,25,27,28,29,30,32,33,38,39,40,43,45,49,50,51,52].
Nutrients 15 03240 g010
Figure 11. Impact of probiotic supplementation on HDL is shown using forest plots in a pooled study comparing against controls. The point estimate of the intervention effect is shown using solid black diamonds for each research item. The lower and upper bounds of the 95% CI for this effect are connected with the horizontal line. The subgroup and overall SMD, as determined using a random-effects model, are represented by the open diamonds. The red dotted line indicates pooled effect values. (a) shows a subgroup analysis of the duration of probiotic interventions, (b) shows a subgroup analysis of single or multiple probiotic strains [11,18,19,20,21,22,23,24,25,27,28,29,30,31,32,33,38,39,40,42,43,45,49,50,51,52].
Nutrients 15 03240 g011
Table 1. Characteristics of the studies included in this meta-analysis.
Author/YearCountryIntervention/Control (Size)Age
(Year)
Female/MaleProbiotic/ControlDose
(CFU/d)
FormDurationMeasure Outcomes
Khalili et al., 2019 [17]IranProbiotics (20)43.95 ± 8.1413/7Lacidophilus casei2 × 108Capsules8 weeksFBS/HbA1c/Insulin/HOMA-IR/
BMI
Control (20)45.00 ± 5.3713/7Maltodextrin
Firouzi et al., 2017 [18]MalaysiaProbiotics (68)52.90 ± 9.20NRL. acidophilus, L. casei, L. lactis, Bifdobacterium,
Actinobacteria, B. bifdum, B.longum, and B. infantis
6 × 10¹⁰Powder12 weeksFBG/HbA1c/insulin/HOMA-IR/
TC/TG/HDL-C/LDL-C/BMI
Control (68)54.20 ± 8.30NRPlacebo
Sabico et al., 2019 [11]Saudi ArabiaProbiotics (39)48.00 ± 8.3020/19B. bifdum W23, B. lactis W52, L. acidophilus W37,
L. brevis W63, L. casei W56, L.salivarius W24,
L. lactis W19, and L. lactis W58
5 × 10⁹Sachets12 weeksGlucose/Insulin/HOMA-IR/
TC/TG/HDL-C/LDL-C/BMI
Control (39)46.60 ± 5.9018/21Maize starch and maltodextrins
Razmpoosh et al., 2019 [19]IranProbiotic (30)58.6 ± 6.513/17Lactobacillus acidophilus, Lactobacillus casei,
Lactobacillus rhamnosus, Lactobacillus bulgaricus, Bifidobacterium breve, Bifidobacterium longum,
Streptococcus thermophilus
4.9 × 10¹⁰Capsules6 weeksFBG/HbA1c/insulin/HOMA-IR/
TC/TG/BMI
Control (30)61.3 ± 5.214/16Fructo-oligosaccharide, and Magnesium stearate
Mazloom et al., 2013 [20]IranProbiotic (16)55.4NRL. acidophilus, L. bulgaricus, L. bifidum, and L. casei.NRCapsules6 weeksFBG/insulin/HOMA-IR/
TC/TG
Control (18)54.2NRMagnesium stearate
Ebrahimi et al., 2017 [21]IranProbiotic (35)58.71 ± 8.2012/23Lactobacillus family, Bifidobacterium family,
Streptococus thermophilus
NRCapsules9 weeksFBG/TC/TG/HDL-C/LDL-C
Control (35)58.71 ± 8.2016/19Row starch
Asemi et al., 2013 [22]IranProbiotic (27)50.51 ± 9.82NRL. acidophilus, L. case, L. rhamnosus, L. bulgaricus, Bifidobacterium breve, B. longum,
Streptococcus thermophilus
3.92 × 10¹⁰Capsules8 weeksFBG/HbA1c/insulin/HOMA-IR/
TC/TG/HDL-C/LDL-C/BMI
Control (27)52.59 ± 7.14NRPlacebo
Asemi et al., 2016 [23]IranProbiotic (51)NRNRLactobacillus sporogenes2.7 × 108Package6 weeksFBG/insulin/HOMA-IR/
TC/TG/HDL-C/LDL-C/BMI
Control (51)NRNRIsomalt, sorbitol and stevia
Asemi et al., 2014 [24]IranProbiotic (62)NRNRLactobacillus sporogenes2.7 × 108Synbiotic food6 weeksFBG/insulin/HOMA-IR/
TC/TG/HDL-C/LDL-C/BMI
Control (62)NRNRControl food
Tonucci et al., 2017 [25]BrazilProbiotic (23)51.83 ± 6.6411/12L. acidophilus La-5 B. lactis BB-12109Fermented goat milk6 weeksFBG/HbA1c/insulin/HOMA-IR/
TC/TG/HDL-C/LDL-C
Control (22)50.95 ± 7.208/14Conventional fermented milk
Ejtahed et al., 2012 [26]IranProbiotic (30)50.87 ± 7.6819/11B. lactis Bb12 and L. acidophilus La54 × 109Yogurt6 weeksFBG/HbA1c/insulin
Control (30)51.00 ±7.3218/12Conventional yogurts
Sabico et al., 2017 [27]Saudi ArabiaProbiotic (39)48.0 ± 8.320/19B. bifdum W23, B. lactis W52, L. acidophilus W37,
L. brevis W63, L. casei W56, L. salivarius W24,
L. lactis W19, and L. lactis W58
2 × 10⁹Powder12 weeksFBG/insulin/HOMA-IR/
TC/TG/HDL-C/LDL-C
Control (39)46.6 ± 5.918/21Maize starch and maltodextrins
Alireza et al., 2015 [28]IranProbiotic (30)NR12/18Fermented milk (kefir) containing L. casei,
L. acidophilus, and Bifidobacteria
4.6 × 10¹⁰Fermented milk8 weeksFBG/HbA1c/TC/TG/HDL-C/
LDL-C
Control (30)NR14/16Fermented milk (dough)
Mobini et al., 2016 [29]SwedenProbiotics (14)64.00 ± 6.003/11L. reuteri DSM 17938108 or 1010Powder12 weeksFBG/HbA1c/insulin/TC/
TG/HDL-C/LDL-C
Control (15)65.00 ± 5.004/11Placebo
Feizollahzadeh et al., 2017 [30]IranProbiotics (20)56.9 ± 1.8111/9Soy milk containing L. planetarum107Soy milk8 weeksFBS/TG/HDL-C/LDL-C
Control (20)53.60 ± 1.6010/10Conventional soy milk
Junko et al., 2017 [31]JapanProbiotic (34)64.0 ± 9.25/29Lactobacillus casei strain Shirota-fermented milk4 × 1010Fermented milk16 weeksFBG/HbA1c/TC/TG/HDL-C/
BMI
Control (34)65.0 ± 8.314/20Did not receive a probiotic
Hove et al.,
2015 [32]
DenmarkProbiotic (23)58.5 ± 7.7NRL. helveticus Cardi04NRYogurt12 weeksFBG/HbA1c/insulin/HOMA-IR/
TC/TG/HDL-C/LDL-C/BMI
Control (18)60.6 ± 5.2NRArtificially acidified milk
Tajabadi-Ebrahimi et al., 2017 [33]IranProbiotic (30)64.20 ± 12.00NRL. acidophilus, L. casei, L. lactis, ifdobacterium,
Actinobacteria, B. bifdum, B.longum, and B. infantis
2 × 10⁹Capsule12 weeksFBG/HbA1c/insulin/HOMA-IR/
TC/TG/HDL-C/LDL-C
Control (30)64.00 ± 11.70NRStarch
Mohamadshahi et al., 2014 [34]IranProbiotic (22)53.00 ±5.9NRL. acidophilus (La5) and B. lactic (Bb12)1.1 × 10⁹Yogurt8 weeksFBG/HbA1c
Control (22)49.00 ± 7.08NRConventional yogurts
Kobyliak et al., 2018 [35]UkraineProbiotic (31)52.23± 1.74NRLactobacillusþLactococcusþ
Bifidobacteriumþ
Propionibacteriumþ
Acetobacter
1012“Symbiter”8 weeksFBS/HbA1c/Insulin
Control (22)57.18± 2.06NRPlacebos
Tajadadi-Ebrahimi et al., 2014 [36]IranProbiotic (27)52.0 ± 7.2NRL. sporogenes1 × 108 Bread8 weeksFBG/insulin/HOMA-IR
Control (27)53.4 ± 7.5NRControl bread
Hosseinzadeh et al., 2013 [37] IranProbiotic (42)46.8 ± 6.2132/10Brewer’s yeast1.8 gTablets12 weeksFBS/HbA1c/HOMA-IR
Control (42)45.7 ± 6.1131/11Cellulose microcrystalline compounds, magnesium stearate, caramel, malt, and stearic acid.
Shakeri et al., 2014 [38]IranProbiotic (26)52.3± 8.2NRL. sporogenes1.2 × 1010Breads8 weeksFBG/BMI/TC/TG/HDL-C/
LDL-C
Control (26)53.1± 7.5NRControl bread
Madempudi et al., 2019 [39]IndiaProbiotic (37)53.607/30L. salivarius UBLS22, L. casei UBLC42,
L. plantarum UBLP40, L. acidophilus
UBLA34, B. breve UBBr01, and B. coagulans Unique IS2
3 × 10¹⁰Capsules12 weeksFBS/HbA1c/Insulin/HOMA-IR/TC/TG/HDL-C/
LDL-C
Control (37)50.509/28Maltodextrin
Chaiyasut et al., 2021 [40]ThailandProbiotic (36)54.78 ± 1.92NRLactobacillus paracasei, Bifidobacterium longum, Bifidobac-terium breve1011Sachet FBG/BMI/TC/TG/HDL-C/
LDL-C
Control (36)58.94 ± 1.32NRCorn starch
Jiang et al., 2020 [41]ChinaProbiotic (42)55.96 ± 8.4527/15Bifidobacterium bifidum, Lactobacillus acidophilus, Streptococcus thermophilus9.7 × 109Sachet12 weeksFBS/HbA1c/Insulin/HOMA-IR
Control (34)56.12 ± 8.2322/12Starch
Kanazawa et al., 2021 [42]JapanProbiotic (44)61.1 ± 11.013/31Lacticaseibacillus paracasei YIT 9029 (strain Shirota:LcS) organisms, Bifidobacterium breve YIT 122726 × 108 Powder24 weeksFBS/HbA1c/TC/TG/HDL-C/
LDL-C
Control (42)55.9 ± 10.78/34Placebo
Toejing et al., 2021 [43]ThailandProbiotic (18)63.50 ± 5.9412/6L. paracasei5 × 1010Powder12 weeksFBS/HbA1c/TC/TG/HDL-C/
LDL-C
Control (18)61.78 ± 7.7316/2Corn starch
Mi-Ra Oh et al., 2021 [44]KoreaProbiotic (20)56.40 ± 11.5714/6L. plantarum HAC01.4 × 109Capsules8 weeksFBS/HbA1c/Insulin/HOMA-IR
Control (20)53.55 ± 10.1817/3Microcrystalline cellulose
Tay et al., 2021 [45]New ZealandProbiotic (15)52.9 ± 8.79/6L. rhamnosus HN0016 × 109Capsules12 weeksFBS/HbA1c/TC/TG/HDL-C/
LDL-C
Control (11)54.1 ± 6.49/2Microcrystalline cellulose and dextrose anhydrate
Palacios et al., 2020 [46]AustraliaProbiotic (30)61.4± 8.913/17Lactobacillus plantarum Lp-115,
Lactobacillus bulgaricus Lb-64,
Lactobacillus gasseri Lg-36,
Bifidobacterium breve Bb-03,
Bifidobacterium animalis sbsp. lactis Bi-07,
Bifidobacterium bifidum Bb-06,
Streptococcus thermophilus St-21,
Saccharomyces boulardii DBVPG 6763
5 × 10¹⁰Capsules12 weeksFBS/HbA1c/Insulin/HOMA-IR
Control (30)56.1 ± 12.319/110 mg microcrystalline cellulose, 5 mg silica,
and 10 mg magnesium stearate
Toshimitsu et al., 2020 [47]JapanProbiotic (62)50.6 ± 6.920/42OLL27125 × 109Yogurt12 weeksFBS/HbA1c/Insulin/HOMA-IR
Control (64)51.2 ± 7.620/44Placebo
Stefanaki et al., 2019 [48]GreeceProbiotic (7)154/3Streptococcus thermophilus (DSM24731),
Bifidobacteria breve (DSM24732),
Bifidobacteria longum (DSM2473),
Bifidobacteria infantis (DSM24737),
Lactobacillus acidophilus (DSM24735),
Lactobacillus plantarum (DSM24730),
Lactobacillus paracasei (DSM24733),
Lactobacillus delbreuckii subspecies bulgaricus (DSM24734)
4.5 × 10¹¹Powder24 weeksFBS/TC/TG/HDL-C/LDL-C
Control (10)13.505/5Placebo
Hsieh et al., 2018 [49]China TaiwanProbiotic (22)NRNRL. reuteri4 × 109Capsules24 weeksFBS/HbA1c/Insulin/HOMA-IR/
TC/TG/HDL-C/LDL-C
Control (22)NRNRPlacebo
Raygan et al., 2018 [50]IranProbiotic (30)60.7 ± 9.4NRBifidobacterium bifidum, Lactobacillus casei,
Lactobacillus acidophilus
6 × 10⁹Capsules12 weeksFBS/Insulin/HOMA-IR/
TC/TG/HDL-C/LDL-C/BMI
Control (30)61.8 ± 9.8NRPlacebo
Soleimani et al., 2017 [51]IranProbiotic (30)NR10/20L. acidophilus, L. casei, and B. bifidum2 × 109Capsules12 weeksFBS/HbA1c/Insulin/HOMA-IR/
TC/TG/HDL-C/LDL-C/BMI
Control (30)NR10/20Placebo
Jie et al., 2021 [52]chinaProbiotic (100)54.16 ± 9.1041/59Bifidobacterium2 × 108Capsules16 weeksFBS/HbA1c/TC/TG/HDL-C/
LDL-C/BMI
Control (99)52.73 ± 9.3555/54Lactose and magnesium stearate
Table 2. Results of Egger’s test for publication bias.
Outcome IndicatorsItemsEffect SizeStandard Error95% CIt Valuep
BMIslope−1.067560.6448588(−2.37, 0.35)−1.560.137
bias2.3338512.712093(−3.39, 8.06)0.860.401
HDLslope0.60006440.7204764(−0.88, 2.08)0.830.413
bias−1.1067452.812447(−6.90, 4.69)−0.390.697
HOMA-IRslope0.621138390.4490837(−0.31, 1.55)1.380.179
bias−0.585181.844773(−9.39, −1.78)−3.030.006
LDLslope−0.85413990.3113323(−1.50, −0.21)−2.740.012
bias2.5366761.277253(−0.11, 5.18)1.990.059
TCslope−1.2364450.2768925(−1.81, −0.66)−4.470.000
bias3.8212321.143507(1.45, 6.19)3.340.003
TGslope0.29464040.2313827(−0.18, 0.77)1.270.216
bias−2.4062540.9667479(−4.41, −0.41)−2.490.020
FBGslope0.30081140.4888035(−0.69, 1.29)0.620.542
bias−3.622171.900053(−7.47, 0.22)−1.910.064
Fasting insulinslope0. 55091780.7954488(−1.09, 2.20)0.690.496
bias−4.4687283.06054(−10.78, 1.86)−1.460.158
glycosylated haemoglobinslope−0.04407520.3279199(−0.72, 0.63)−0.130.894
bias−1.8858721.327238(−4.63, 0.85)−1.420.168
Table 3. Results of trim-and-fill method.
Outcome
Indicators
PhaseEffect Size95% CIZ ValuepNo. of Studies
HOMA-IRBefore−0.879(−1.169, −0.589)−5.944026
After−0.879(−1.169, −0.589)−5.944026
TCBefore−0.267(−0.429, −0.105)−3.2350.00124
After−0.430(−0.583, −0. 277)−5.4940.00032
TGBefore−0.301(−0. 435, −0.167)−4.4130.00025
After−0.301(−0. 435, −0.167)−4.4130.00025
Disclaimer/Publisher’s Note: The statements, opinions and data contained in all publications are solely those of the individual author(s) and contributor(s) and not of MDPI and/or the editor(s). MDPI and/or the editor(s) disclaim responsibility for any injury to people or property resulting from any ideas, methods, instructions or products referred to in the content.

