
Nutrient Profiles of Commercially Produced Complementary Foods Available in Burkina Faso, Cameroon, Ghana, Nigeria and Senegal

 , ,
, ,
Abstract
:1. Introduction
2. Materials and Methods
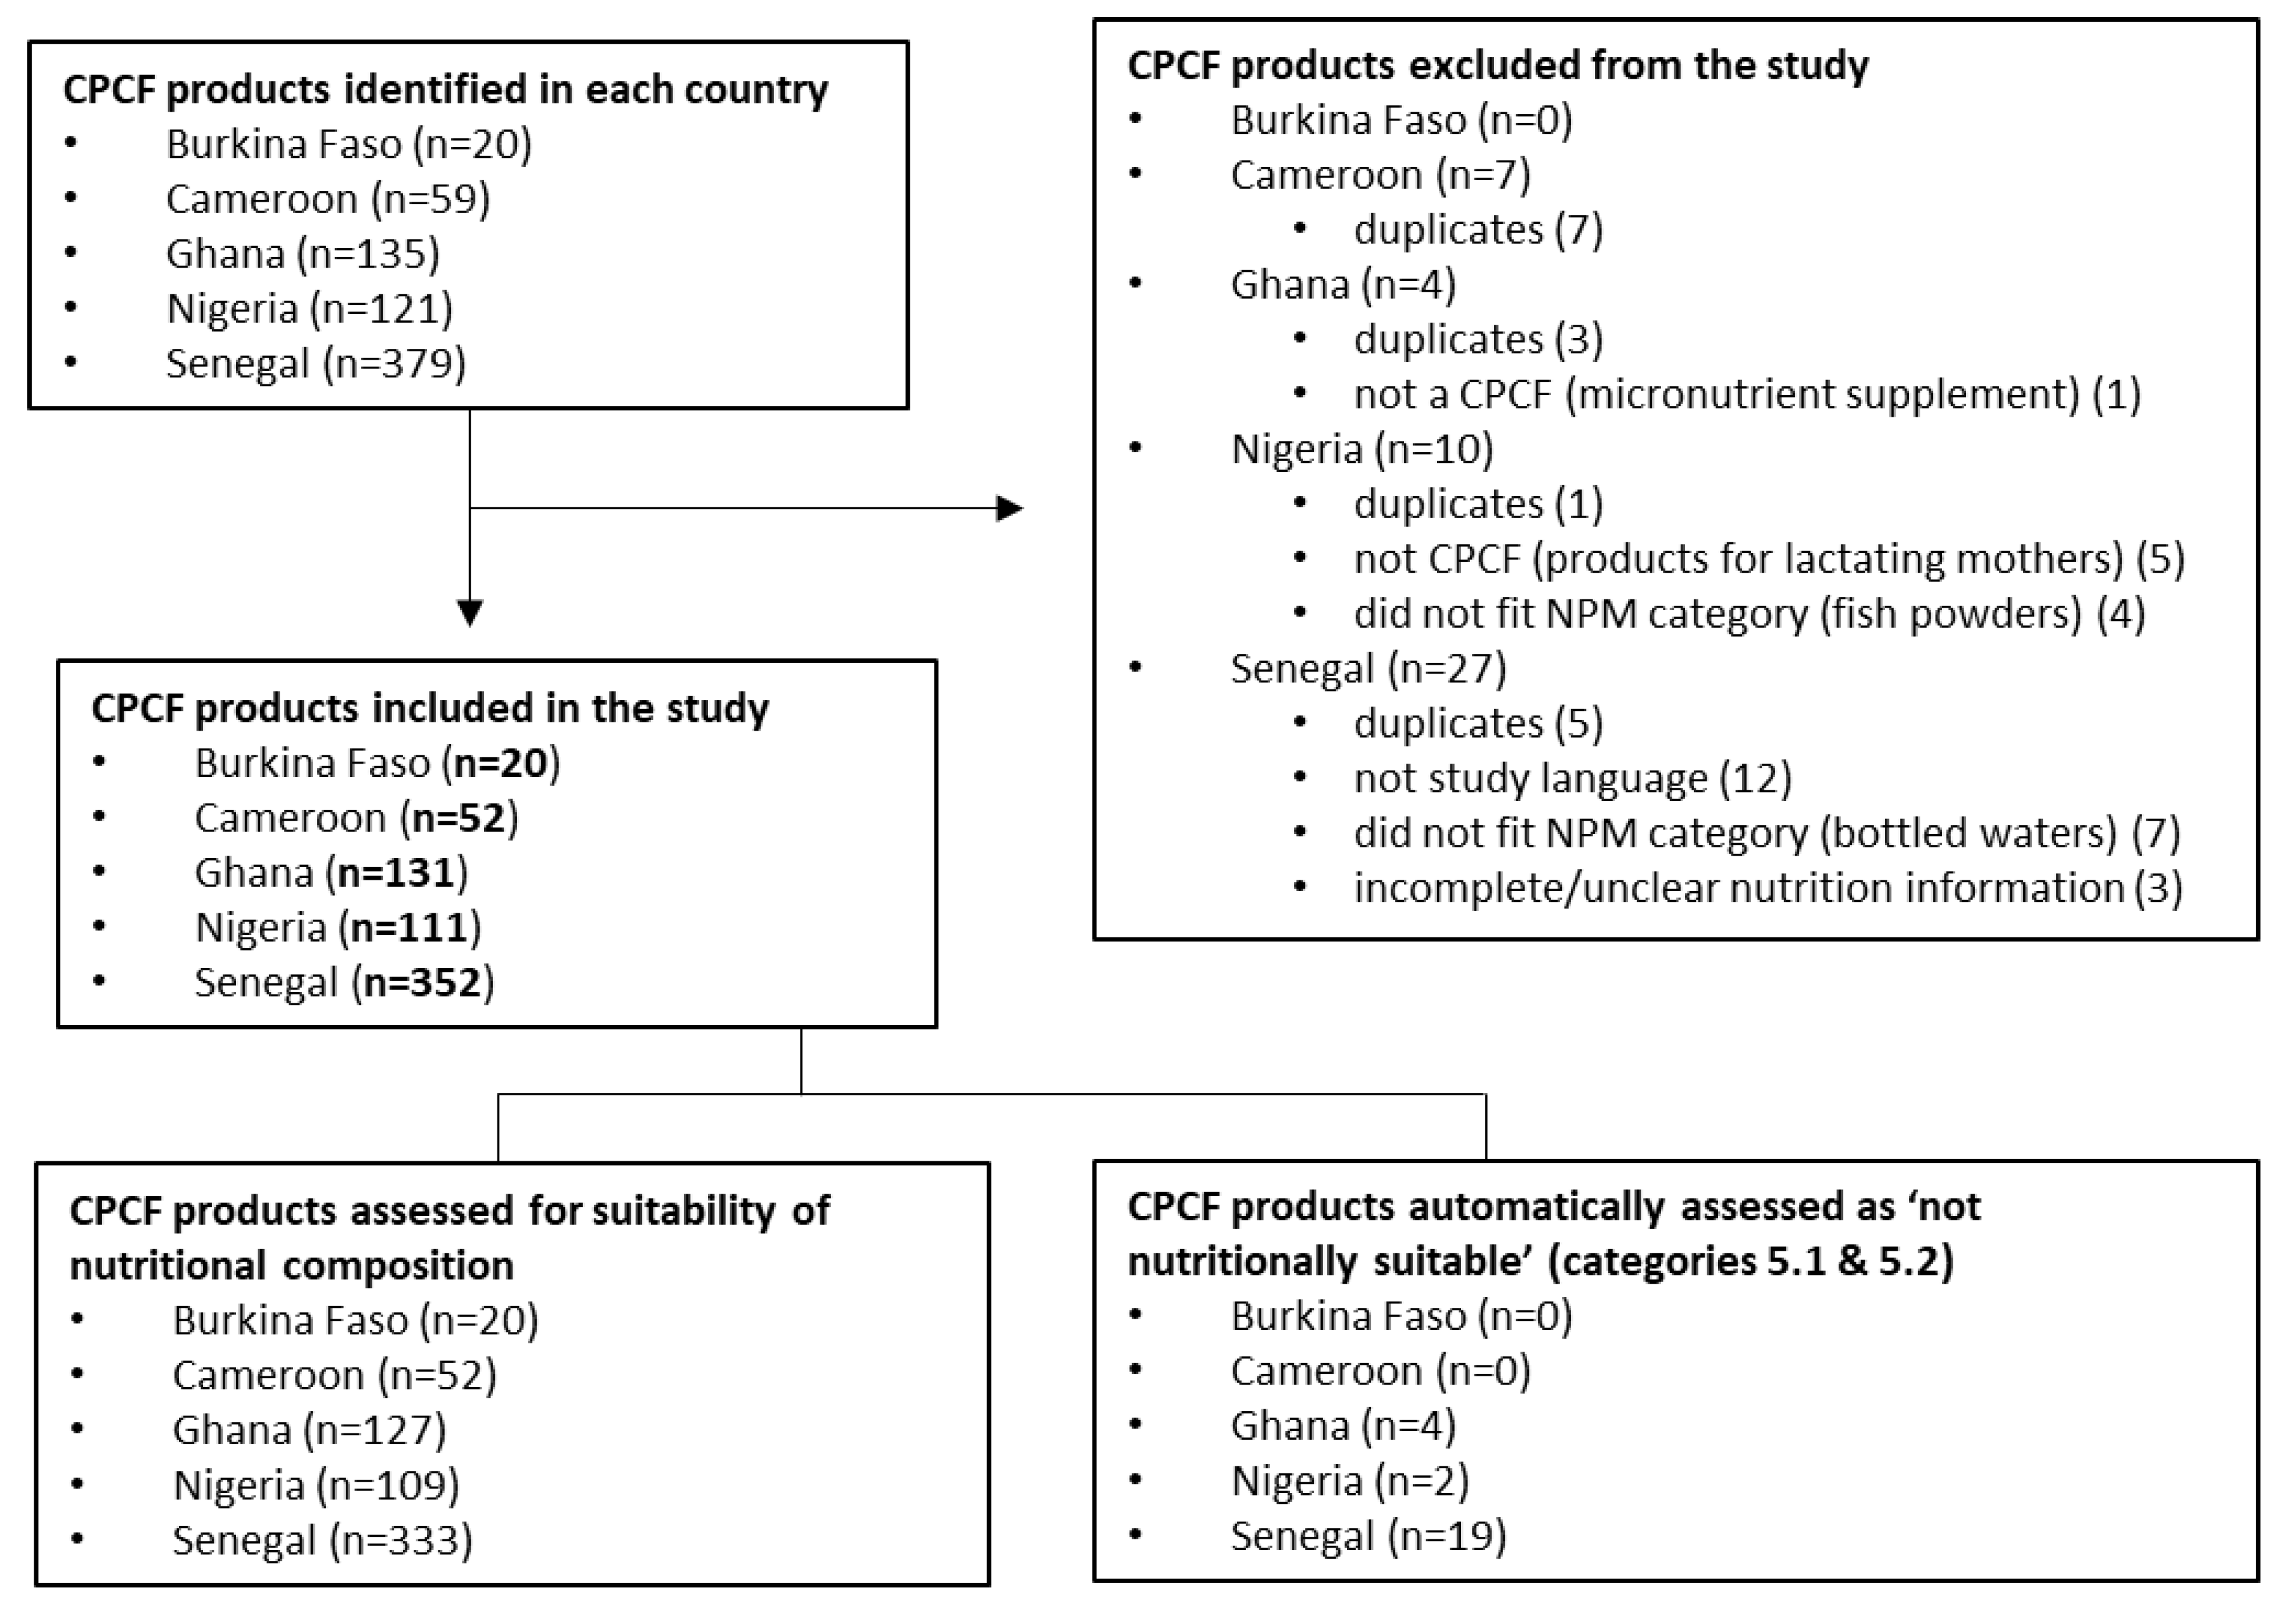
2.1. Study Design
2.2. Product Identification and Data Management
2.3. Analysis
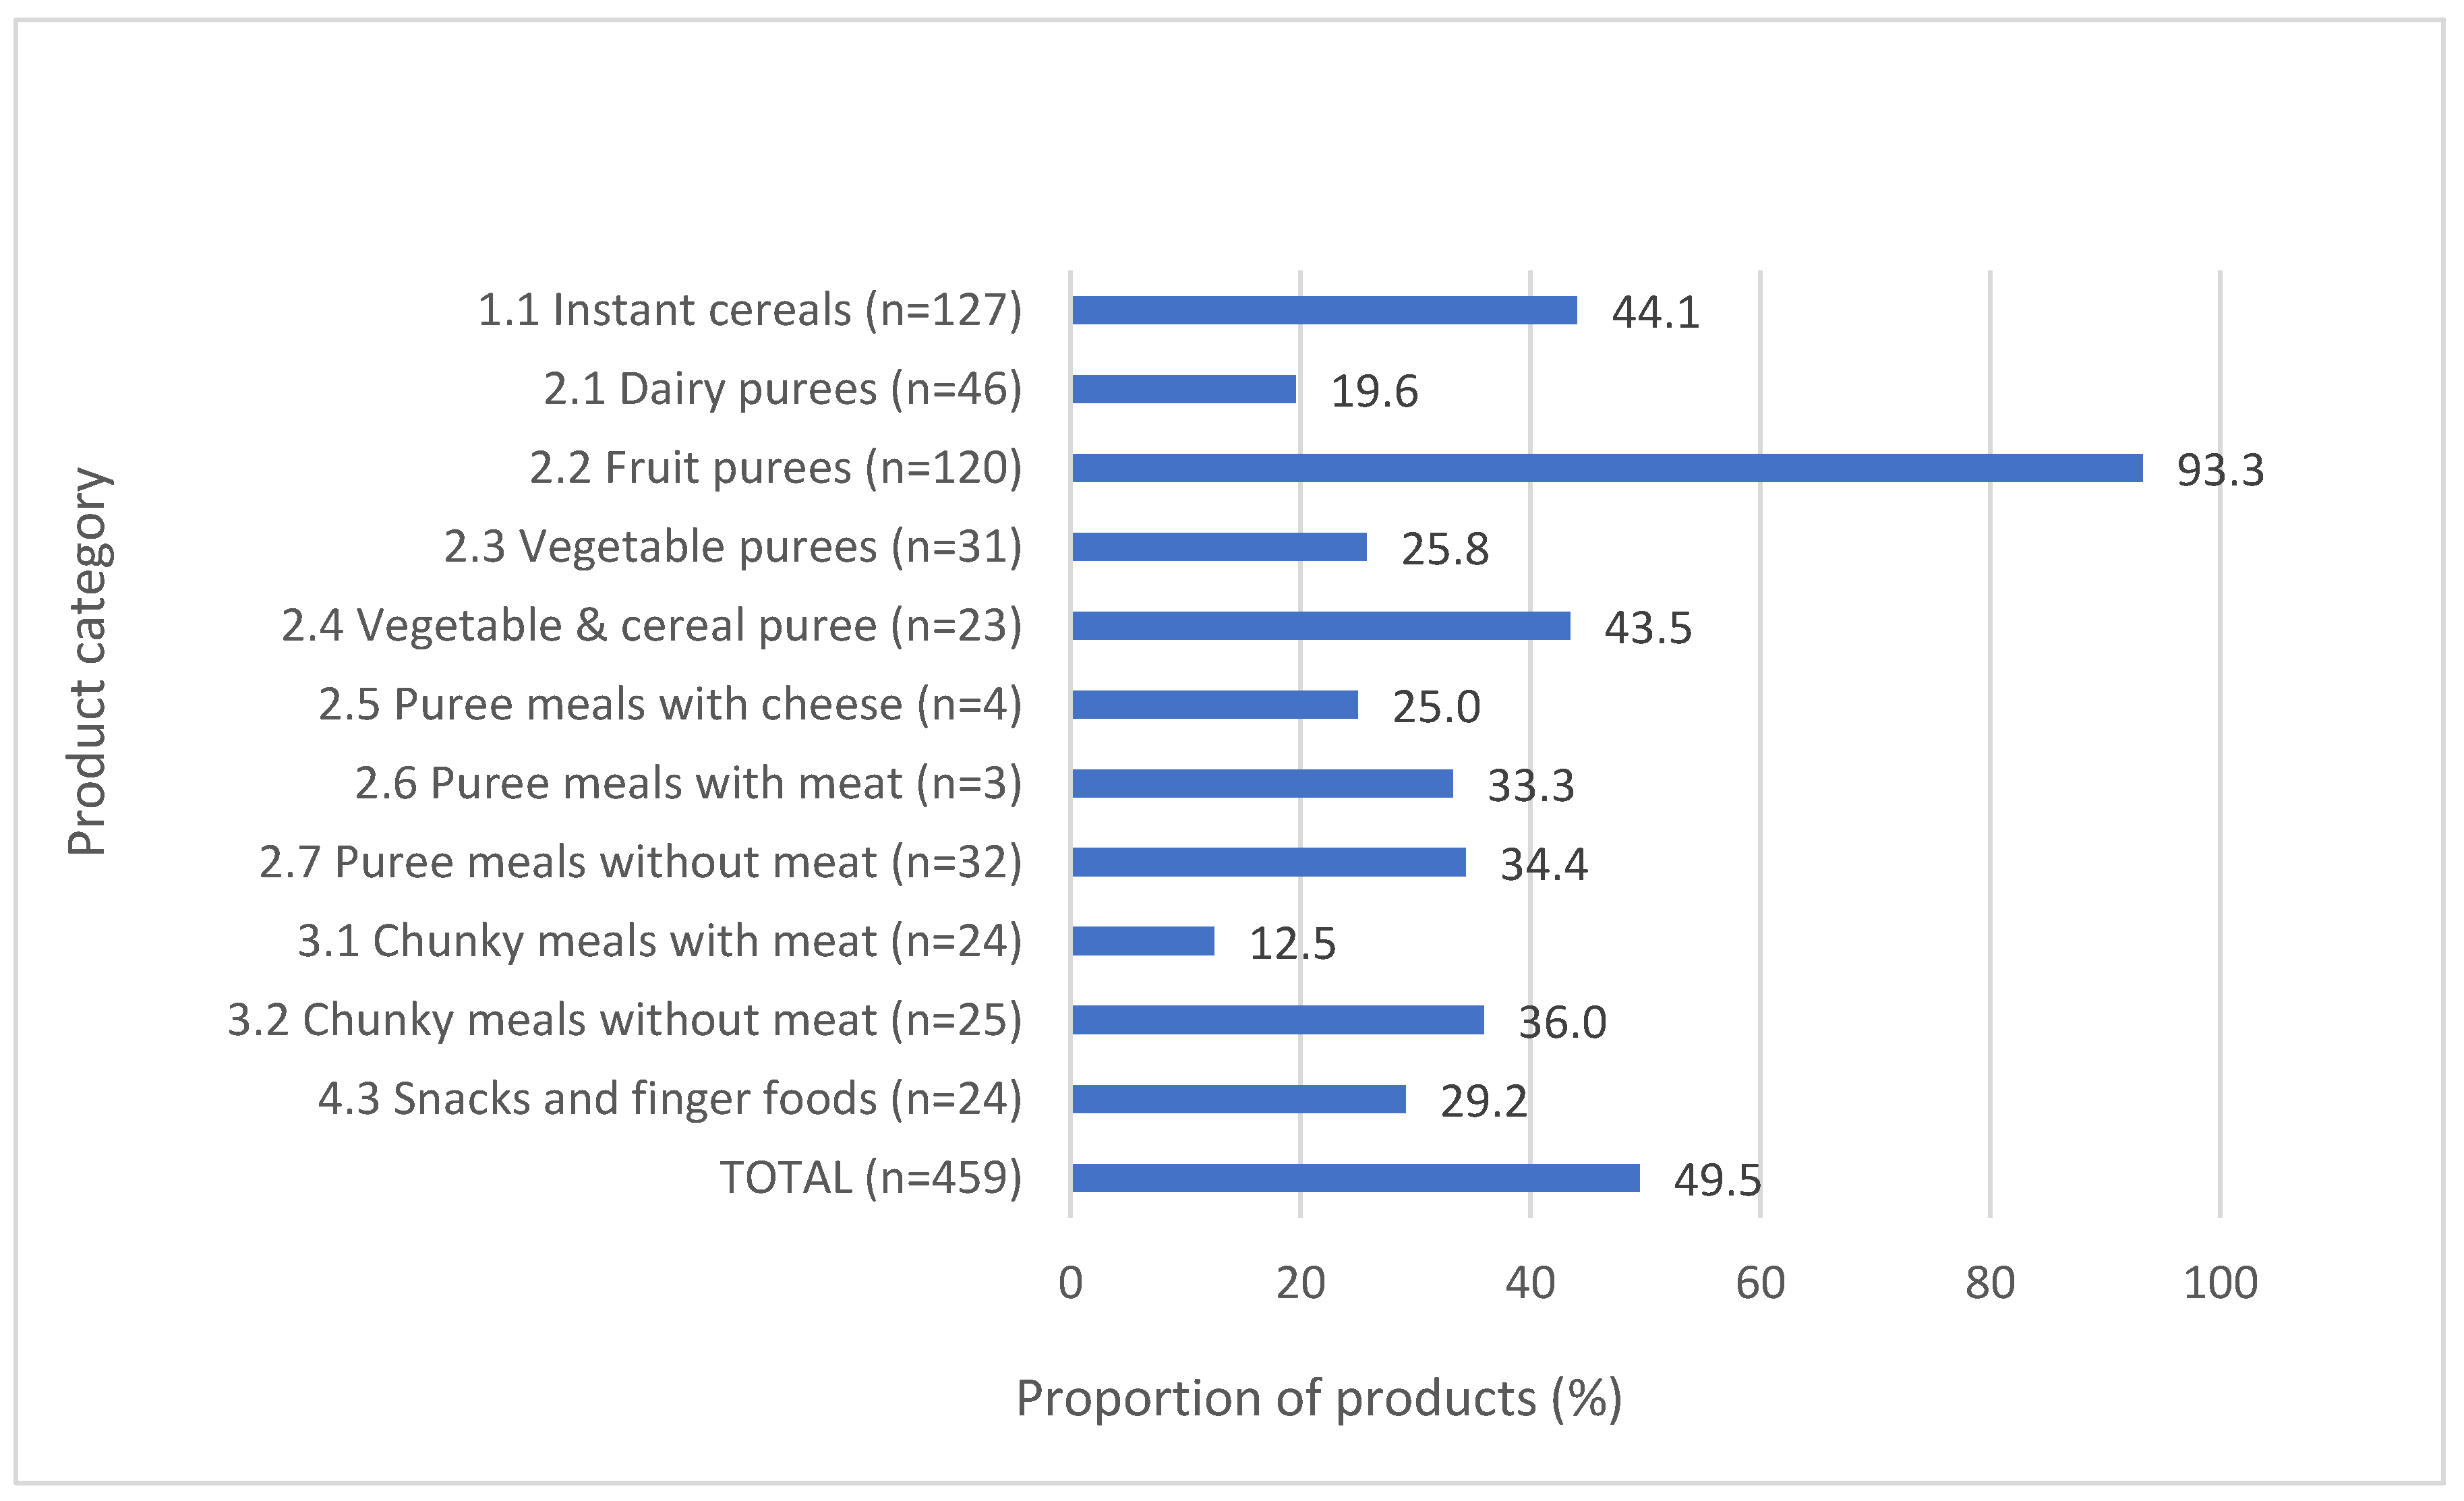
3. Results
4. Discussion
5. Conclusions
Supplementary Materials
Author Contributions
Funding
Institutional Review Board Statement
Informed Consent Statement
Data Availability Statement
Acknowledgments
Conflicts of Interest
References
- Keats, E.C.; Das, J.K.; Salam, R.A.; Lassi, Z.S.; Imdad, A.; Black, R.E.; Bhutta, Z.A. Effective Interventions to Address Maternal and Child Malnutrition: An Update of the Evidence. Lancet Child Adolesc. Health 2021, 5, 367–384. [Google Scholar] [CrossRef] [PubMed]
- Dewey, K.G.; Adu-Afarwuah, S. Review Article Systematic Review of the Efficacy and Effectiveness of Complementary Feeding Interventions in Developing Countries. Matern. Child Nutr. 2008, 4, 24–85. [Google Scholar] [CrossRef] [PubMed]
- World Health Organisation. Nutritional Anaemias: Tools for Effective Prevention and Control Nutritional Anaemias: Tools for Effective Prevention and Control; WHO: Geneva, Switzerland, 2017. [Google Scholar]
- Ferguson, E.L.; Darmon, N. Traditional Foods vs. Manufactured Baby Foods. In Issues in Complementary Feeding; KARGER: Basel, Switzerland, 2007; pp. 43–63. [Google Scholar]
- Genannt Bonsmann, S.S.; Robinson, M.; Wollgast, J.; Caldeira, S. The Ineligibility of Food Products from across the EU for Marketing to Children According to Two EU-Level Nutrient Profile Models. PLoS ONE 2019, 14, e0213512. [Google Scholar] [CrossRef]
- Hutchinson, J.; Rippin, H.; Threapleton, D.; Jewell, J.; Kanamäe, H.; Salupuu, K.; Caroli, M.; Antignani, A.; Pace, L.; Vassallo, C.; et al. High Sugar Content of European Commercial Baby Foods and Proposed Updates to Existing Recommendations. Matern. Child Nutr. 2021, 17, e13020. [Google Scholar] [CrossRef]
- WHO Regional Office for Europe. Effective Regulatory Frameworks for Ending Inappropriate Marketing of Breast-Milk Substitutes and Foods for Infants and Young Children in the WHO European Region; WHO: Copenhagen, Denmark, 2022. [Google Scholar]
- Marais, N.C.; Christofides, N.J.; Erzse, A.; Hofman, K.J. Evidence for High Sugar Content of Baby Foods in South Africa. S. Afr. Med. J. 2019, 109, 328. [Google Scholar] [CrossRef] [PubMed] [Green Version]
- Grammatikaki, E.; Wollgast, J.; Caldeira, S. High Levels of Nutrients of Concern in Baby Foods Available in Europe That Contain Sugar-Contributing Ingredients or Are Ultra-Processed. Nutrients 2021, 13, 3105. [Google Scholar] [CrossRef]
- Ventura, A.K.; Worobey, J. Early Influences on the Development of Food Preferences. Curr. Biol. 2013, 23, R401–R408. [Google Scholar] [CrossRef] [Green Version]
- Foterek, K.; Buyken, A.E.; Bolzenius, K.; Hilbig, A.; Nöthlings, U.; Alexy, U. Commercial Complementary Food Consumption Is Prospectively Associated with Added Sugar Intake in Childhood. Br. J. Nutr. 2016, 115, 2067–2074. [Google Scholar] [CrossRef] [Green Version]
- Mennella, J.A.; Griffin, C.E.; Beauchamp, G.K. Flavor Programming During Infancy. Pediatrics 2004, 113, 840–845. [Google Scholar] [CrossRef] [Green Version]
- World Health Organization. Sugars and Dental Caries; WHO Technical Information Note; WHO: Geneva, Switzerland, 2017. [Google Scholar]
- Pries, A.M.; Filteau, S.; Ferguson, E.L. Snack Food and Beverage Consumption and Young Child Nutrition in Low- and Middle-Income Countries: A Systematic Review. Matern. Child Nutr. 2019, 15, e12729. [Google Scholar] [CrossRef] [Green Version]
- WHO Regional Office for Europe. Ending Inappropriate Promotion of Commercially Available Complementary Foods for Infants and Young Children between 6 and 36 Months in Europe. A Discussion Paper Outlining the First Steps in Developing a Nutrient Profile Model to Drive Changes to Product Composition and Labelling and Promotion Practices in the WHO European Region; WHO Regional Office for Europe: Copenhagen, Denmark, 2019; Available online: https://apps.who.int/iris/handle/10665/346583 (accessed on 17 April 2023).
- World Health Organization. Guidance on Ending the Inappropriate Promotion of Foods for Infants and Young Children: Implementation Manual; WHO: Geneva, Switzerland, 2017. [Google Scholar]
- World Health Organization. Nutrient Profiling Report of a WHO/IASO Technical Meeting. London, United Kingdom 4–6 October 2010; WHO: Geneva, Switzerland, 2011. [Google Scholar]
- Bassetti, E.; Zehner, E.; Mayhew, S.H.; Nasser, N.; Mulder, A.; Badham, J.; Sweet, L.; Crossley, R.; Pries, A.M. Nutrient Profiles of Commercially Produced Complementary Foods Available in Cambodia, Indonesia and the Philippines. Public Health Nutr. 2022, 25, 2720–2730. [Google Scholar] [CrossRef] [PubMed]
- UNICEF. The State of Wasting in West and Central Africa 2020; UNICEF: New York, NY, USA, 2020. [Google Scholar]
- Global Nutrition Report. Country Nutrition Profiles. Western Africa. 2021. Available online: https://globalnutritionreport.org/resources/nutrition-profiles/ (accessed on 12 July 2022).
- Onyango, A.W.; Jean-Baptiste, J.; Samburu, B.; Mahlangu, T.L.M. Regional Overview on the Double Burden of Malnutrition and Examples of Program and Policy Responses: African Region. Ann. Nutr. Metab. 2019, 75, 127–130. [Google Scholar] [CrossRef]
- World Health Organization. Obesity and Overweight. Available online: https://www.who.int/news-room/fact-sheets/detail/obesity-and-overweight (accessed on 17 April 2023).
- Shlisky, J.; Mandlik, R.; Askari, S.; Abrams, S.; Belizan, J.M.; Bourassa, M.W.; Cormick, G.; Driller-Colangelo, A.; Gomes, F.; Khadilkar, A.; et al. Calcium Deficiency Worldwide: Prevalence of Inadequate Intakes and Associated Health Outcomes. Ann. N. Y. Acad. Sci. 2022, 1512, 10–28. [Google Scholar] [CrossRef] [PubMed]
- Ndiaye, B.; Siekmans, K.; Kung, J.; Wade, S. Distribution of Iron, Vitamin A and Zinc Deficiencies in Children and Women in Senegal. Eur. J. Nutr. Food Saf. 2015, 5, 908–909. [Google Scholar] [CrossRef]
- Diedhiou, B.M.; Jalal, C. Current Situation of Micronutrient Deficiencies in West Africa. In Scaling Up Rice Fortification in West Africa; Sight & Life Publishers: Basel, Switzerland, 2018. [Google Scholar]
- Institut National de la Statistique (INS); ICF. Enquête Démographique et de Santé Du Cameroun 2018; INS et ICF: Rockville, MD, USA, 2020.
- Issaka, A.I.; Agho, K.E.; Page, A.N.; Burns, P.L.; Stevens, G.J.; Dibley, M.J. The Problem of Suboptimal Complementary Feeding Practices in West Africa: What Is the Way Forward? Matern. Child Nutr. 2015, 11, 53–60. [Google Scholar] [CrossRef] [Green Version]
- Feeley, A.B.; Ndeye Coly, A.; Sy Gueye, N.Y.; Diop, E.I.; Pries, A.M.; Champeny, M.; Zehner, E.R.; Huffman, S.L. Promotion and Consumption of Commercially Produced Foods among Children: Situation Analysis in an Urban Setting in Senegal. Matern. Child Nutr. 2016, 12, 64–76. [Google Scholar] [CrossRef] [Green Version]
- Ghana Statistical Service (GSS); Ghana Health Service (GHS); ICF International. Ghana Demographic and Health Survey 2014; GSS, GHS, and ICF International: Rockville, MD, USA, 2015.
- Abizari, A.R.; Ali, Z.; Essah, C.N.; Agyeiwaa, P.; Amaniampong, M. Use of Commercial Infant Cereals as Complementary Food in Infants and Young Children in Ghana. BMC Nutr. 2017, 3, 72. [Google Scholar] [CrossRef] [Green Version]
- World Health Organization. WHA 69 9/7 Add.1. Maternal, Infant and Young Child Nutrition, Guidance on Ending the Inappropriate Promotion of Foods for Infants and Young Children, Report by the Secretariat; WHO: Geneva, Switzerland, 2016. [Google Scholar]
- Dreyfuss, M.L.; Green, M.; Agustino; Hadihardjono, D.N.; Izwardy, D.; Huffman, S.L. Commercially Produced Complementary Foods in Bandung City, Indonesia, Are Often Reported to Be Iron Fortified but with Less than Recommended Amounts or Suboptimal Forms of Iron. Matern. Child Nutr. 2019, 15, e12789. [Google Scholar] [CrossRef] [Green Version]
- The Food and Drug Administration (FDA). Dietary Supplement Labeling Guide: Appendix C. Daily Values for Infants, Children Less Than 4 Years of Age, and Pregnant and Lactating Women; FDA: Silver Spring, MD, USA, 2005.
- World Health Organization (WHO); Food and Agriculture Organization (FAO). Vitamin and Mineral Requirements in Human Nutrition, 2nd ed.; WHO: Geneva, Switzerland, 2004; ISBN 9241546123. [Google Scholar]
- World Health Organization. Guideline: Sugars Intake for Adults and Children; WHO: Geneva, Switzerland, 2015; Volume 57. [Google Scholar]
- Breda, J.; Jewell, J.; Keller, A. The Importance of the World Health Organization Sugar Guidelines for Dental Health and Obesity Prevention. Caries Res. 2019, 53, 149–152. [Google Scholar] [CrossRef] [Green Version]
- Mendis, S.; Puska, P.; Norrving, B.; World Health Organization; World Heart Federation; World Stroke Organization. Global Atlas on Cardiovascular Disease Prevention and Control; WHO: Geneva, Switzerland, 2011. [Google Scholar]
- Kengne, A.P.; Bentham, J.; Zhou, B.; Peer, N.; Matsha, T.E.; Bixby, H.; Di Cesare, M.; Hajifathalian, K.; Lu, Y.; Taddei, C.; et al. Trends in Obesity and Diabetes across Africa from 1980 to 2014: An Analysis of Pooled Population-Based Studies. Int. J. Epidemiol. 2017, 46, 1421–1432. [Google Scholar] [CrossRef] [Green Version]
- Evans, C.E.L. Sugars and Health: A Review of Current Evidence and Future Policy. Proc. Nutr. Soc. 2017, 76, 400–407. [Google Scholar] [CrossRef] [PubMed]
- Maalouf, J.; Cogswell, M.E.; Bates, M.; Yuan, K.; Scanlon, K.S.; Pehrsson, P.; Gunn, J.P.; Merritt, R.K. Sodium, Sugar, and Fat Content of Complementary Infant and Toddler Foods Sold in the United States, 2015. Am. J. Clin. Nutr. 2017, 105, 1443–1452. [Google Scholar] [CrossRef] [PubMed] [Green Version]
- Genovesi, S.; Giussani, M.; Orlando, A.; Orgiu, F.; Parati, G. Salt and Sugar: Two Enemies of Healthy Blood Pressure in Children. Nutrients 2021, 13, 697. [Google Scholar] [CrossRef] [PubMed]
- Murray, R.D. Savoring Sweet: Sugars in Infant and Toddler Feeding. Ann. Nutr. Metab. 2017, 70, 38–46. [Google Scholar] [CrossRef] [PubMed] [Green Version]
- U.S. Department of Agriculture; U.S. Department of Health and Human Services. Dietary Guidelines for Americans, 2020–2025; USDA: Washington, DC, USA, 2020.
- Hawkes, C.; Ruel, M.T.; Salm, L.; Sinclair, B.; Branca, F. Double-Duty Actions: Seizing Programme and Policy Opportunities to Address Malnutrition in All Its Forms. Lancet 2020, 395, 142–155. [Google Scholar] [CrossRef]
- Garcia, A.L.; Curtin, L.; Ronquillo, J.D.; Parrett, A.; Wright, C.M. Changes in the UK Baby Food Market Surveyed in 2013 and 2019: The Rise of Baby Snacks and Sweet/Savoury Foods. Arch. Dis. Child. 2020, 105, 1162–1166. [Google Scholar] [CrossRef]
- Nordhagen, S.; Pries, A.M.; Dissieka, R. Commercial Snack Food and Beverage Consumption Prevalence among Children 6–59 Months in West Africa. Nutrients 2019, 11, 2715. [Google Scholar] [CrossRef] [Green Version]
- WHO Africa. Obesity Rising in Africa, WHO Analysis Finds. Available online: https://www.afro.who.int/news/obesity-rising-africa-who-analysis-finds (accessed on 12 July 2022).
- Reardon, T.; Tschirley, D.; Liverpool-Tasie, L.S.O.; Awokuse, T.; Fanzo, J.; Minten, B.; Vos, R.; Dolislager, M.; Sauer, C.; Dhar, R.; et al. The Processed Food Revolution in African Food Systems and the Double Burden of Malnutrition. Glob. Food Secur. 2021, 28, 100466. [Google Scholar] [CrossRef]
- Popkin, B.M.; Corvalan, C.; Grummer-Strawn, L.M. Dynamics of the Double Burden of Malnutrition and the Changing Nutrition Reality. Lancet 2020, 395, 65–74. [Google Scholar] [CrossRef]
- Dimaria, S.; Schwartz, H.; Icard-Vernière, C.; Picq, C.; Zagre, N.; Mouquet-Rivier, C. Adequacy of Some Locally Produced Complementary Foods Marketed in Benin, Burkina Faso, Ghana, and Senegal. Nutrients 2018, 10, 785. [Google Scholar] [CrossRef] [Green Version]
- Osendarp, S.J.M.; Broersen, B.; van Liere, M.J.; De-Regil, L.M.; Bahirathan, L.; Klassen, E.; Neufeld, L.M. Complementary Feeding Diets Made of Local Foods Can Be Optimized, but Additional Interventions Will Be Needed to Meet Iron and Zinc Requirements in 6- to 23-Month-Old Children in Low- and Middle-Income Countries. Food Nutr. Bull. 2016, 37, 544–570. [Google Scholar] [CrossRef] [Green Version]
- Beal, T.; White, J.M.; Arsenault, J.E.; Okronipa, H.; Hinnouho, G.-M.; Murira, Z.; Torlesse, H.; Garg, A. Micronutrient Gaps during the Complementary Feeding Period in South Asia: A Comprehensive Nutrient Gap Assessment. Nutr. Rev. 2021, 79, 26–34. [Google Scholar] [CrossRef] [PubMed]
- Swanepoel, E.; Havemann-Nel, L.; Rothman, M.; Laubscher, R.; Matsungo, T.M.; Smuts, C.M.; Faber, M. Contribution of Commercial Infant Products and Fortified Staple Foods to Nutrient Intake at Ages 6, 12, and 18 Months in a Cohort of Children from a Low Socio-Economic Community in South Africa. Matern. Child Nutr. 2019, 15, e12674. [Google Scholar] [CrossRef] [PubMed] [Green Version]
- Tzioumis, E.; Kay, M.; Wright, M.; Adair, L. Health Effects of Commercially-Available Complementary Foods: A Systematic Review; University of North Carolina at Chapel Hill: Chapel Hill, NC, USA, 2015. [Google Scholar]
- Helen Keller International Senegal Nutrient Profiling Study Results Report. ARCH 3—Nutrient Profiling Study. Using an Adapted 2019 WHO EURO. Commercially Available Complementary Foods Nutrient Profiling Model to Assess Nutrient Composition and Labelling Practices of Commercially Produced Complementary Foods Purchased in the Dakar and Guédiawaye Departments, Senegal. 2022. Available online: https://archnutrition.org/resource/composition-and-labelling-practices-of-complementary-foods-senegal/ (accessed on 1 March 2023).
- Masters, W.A.; Nene, M.D.; Bell, W. Nutrient Composition of Premixed and Packaged Complementary Foods for Sale in Low- and Middle-Income Countries: Lack of Standards Threatens Infant Growth. Matern. Child Nutr. 2017, 13, e12421. [Google Scholar] [CrossRef] [PubMed]
- Ukoji, U.V.; Fayehun, O. Parental Childhood Feeding Experiences and Complementary Feeding Practices in Urban Households of Nigeria. Child Care Pract. 2021, 29, 152–165. [Google Scholar] [CrossRef]
- Mitchodigni, I.M.; Hounkpatin, A.W.; Ntandou-Bouzitou, G.; Termote, C.; Bodjrenou, F.S.U.; Mutanen, M.; Hounhouigan, D.J. Complementary Feeding Practices among Children under Two Years Old in West Africa: A Review. Afr. J. Food Agric. Nutr. Dev. 2018, 18, 13541–13557. [Google Scholar] [CrossRef]
- Croker, H.; Packer, J.; Russell, S.J.; Stansfield, C.; Viner, R.M. Front of Pack Nutritional Labelling Schemes: A Systematic Review and Meta-analysis of Recent Evidence Relating to Objectively Measured Consumption and Purchasing. J. Hum. Nutr. Diet. 2020, 33, 518–537. [Google Scholar] [CrossRef]


| Category 1: Dry, powdered, and instant cereal/starchy food |
| Category 1.1 Dry or instant cereals/starches |
| Category 2: Soft–wet spoonable, ready-to-eat foods |
| Category 2.1 Dairy-based desserts and cereal products |
| Category 2.2 Fruit purée with or without the addition of vegetables, cereals, or milk |
| Category 2.3 Vegetable only purée |
| Category 2.4 Puréed vegetables and cereals |
| Category 2.5 Puréed meal with cheese (but not meat or fish) mentioned in the name |
| Category 2.6 Puréed meal with meat or fish mentioned as the first food in the product name |
| Category 2.7 Puréed meals with meat or fish (but not named first in the product name) |
| Category 2.8 Purées with only meat, fish, or cheese in the name |
| Category 3: Meals with chunky pieces |
| Category 3.1 Meat, fish, or cheese-based meal with chunky pieces |
| Category 3.2 Vegetable-based meal with chunky pieces |
| Category 4: Dry finger foods and snacks |
| Category 4.1 Confectionery, sweet spreads, and fruit chews |
| Category 4.2 Fruit (fresh or dry whole fruit or pieces) |
| Category 4.3 Other snacks and finger foods |
| Category 5: Juices and other drinks |
| Category 5.1 Single or mixed fruit juices, vegetable juices, or other non-formula drinks |
| Category 5.2 Cow’s milk and milk alternatives with added sugar or sweetening agent |
| Product Category | n | Met All Relevant Nutrient Requirements | No Added Sugar/Sweetener 2 | Low/No Added Fruit 3 | >15% Energy from Sugar 4 | Met Sodium Requirement 5 | Met Energy Density Requirement 6 | Met Protein Requirement 7 | Met Total Fat Requirement 8 |
|---|---|---|---|---|---|---|---|---|---|
| Dry, powdered, and instant cereal/starchy foods | |||||||||
| 1.1 Dry or instant cereals/starches | 275 | 11.3 (31) | 24.0 (66) | 81.5 (224) | NA | 73.8 (203) | NA | 89.1 (245) | 89.1 (245) |
| Soft–wet spoonable, ready-to-eat foods (purees) | |||||||||
| 2.1 Dairy-based desserts and cereal products | 48 | 0.0 (0) | 8.3 (4) | 79.2 (38) | NA | 70.8 (34) | 91.7 (44) | 93.8 (45) | 100.0 (48) |
| 2.2 Fruit puree | 136 | 23.5 (32) | 73.5 (100) | NA | NA | 95.6 (130) | 36.8 (50) | NA | 97.8 (133) |
| 2.3 Vegetable-only puree | 36 | 22.2 (8) | 100.0 (36) | 100.0 (36) | NA | 66.7 (24) | NA | NA | 94.4 (34) |
| 2.4 Vegetable puree with cereals | 25 | 32.0 (8) | 100.0 (25) | 92.0 (23) | NA | 64.0 (16) | 56.0 (14) | NA | 100.0 (25) |
| 2.5 Pureed meal with cheese | 4 | 50.0 (2) | 100.0 (4) | 100.0 (4) | NA | 25.0 (10) | 75.0 (3) | 75.0 (3) | 100.0 (4) |
| 2.6 Pureed meal with meat/fish in product name | 6 | 16.7 (1) | 100.0 (6) | 100.0 (6) | NA | 33.3 (2) | 50.0 (3) | 83.3 (5) | 100.0 (6) |
| 2.7 Pureed meal with meat/fish not in product name | 34 | 38.2 (13) | 97.1 (33) | 94.1 (32) | NA | 64.7 (22) | 50.0 (17) | 97.1 (33) | 100.0 (34) |
| Meals with chunky pieces | |||||||||
| 3.1 Chunky meal with meat/fish/cheese | 24 | 4.2 (1) | 100.0 (24) | 100.0 (24) | NA | 16.7 (4) | NA | 8.3 (2) | 100.0 (24) |
| 3.2 Chunky meal with vegetables | 25 | 24.0 (6) | 100.0 (25) | 100.0 (25) | NA | 24.0 (6) | NA | 60.0 (15) | 100.0 (25) |
| Dry finger foods and snacks | |||||||||
| 4.3 Snacks and finger foods | 28 | 0.0 (0) | 3.6 (10) | NA | 10.7 (3) | 39.3 (11) | NA | NA | 60.7 (17) |
| All products | 641 | 15.9 (102) | 50.6 (324) | 86.4 (412) | 10.7 (3) | 70.7 (453) | 51.8 (131) | 83.7 (348) | 92.8 (595) |
| Product Category | Calcium Content Declared (n) | Calcium RNI for 6–12 m | Calcium RNI for 12–36 m | Iron Content Declared (n) | Iron RNI for 6–12 m | Iron RNI for 12–36 m | Zinc Content Declared (n) | Zinc RNI for 6–36 m |
|---|---|---|---|---|---|---|---|---|
| Burkina Faso | ||||||||
| 1. Dry, powdered, and instant cereal/starchy food (n = 20) | 18 | 57% (40–75%) | 46% (32–60%) | 18 | 41% (29–54%) | 66% (47–86%) | 14 | 52% (40–61%) |
| Cameroon | ||||||||
| 1. Dry, powdered, and instant cereal/starchy food (n = 46) | 35 | 56% (42–74%) | 45% (34–60%) | 38 | 41% (27–54%) | 65% (43–87%) | 26 | 58% (47–67%) |
| 2. Soft-wet spoonable, ready-to-eat foods (purees) (n = 6) | 2 | 33% (32–34%) | 26% (25–27%) | 1 | 20% (--) | 32% (--) | 0 | - |
| Ghana | ||||||||
| 1. Dry, powdered, and instant cereal/starchy food (n = 54) | 26 | 33% (23–56%) | 27% (18–45%) | 35 | 41% (34–52%) | 66% (54–84%) | 28 | 44% (33–63%) |
| 2. Soft-wet spoonable, ready-to-eat foods (purees) (n = 69) | 8 | 20% (4–27%) | 16% (3–21%) | 5 | 19% (3–40%) | 30% (4–65%) | 2 | 44% (42–46%) |
| 4. Dry finger foods and snacks (n = 4) | 1 | 6% (--) | 5% (--) | 1 | 4% (--) | 7% (--) | 0 | - |
| 5. Juices and other drinks (n = 4) | 0 | - | - | 0 | - | - | 0 | - |
| Nigeria | ||||||||
| 1. Dry, powdered, and instant cereal/starchy food (n = 75) 2 | 49 | 46% (24–63%) | 36% (19–50%) | 56 | 35% (32–55%) | 56% (52–88%) | 37 | 34% (27–37%) |
| 2. Soft-wet spoonable, ready-to-eat foods (purees) (n = 17) | 4 | 14% (5–20%) | 11% (4–16%) | 3 | 8% (5–9%) | 13% (9–15%) | 0 | - |
| 4. Dry finger foods and snacks (n = 14) | 5 | 12% (8–13%) | 9% (6–10%) | 5 | 15% (13–18%) | 24% (21–29%) | 1 | 11% |
| 5. Juices and other drinks (n = 2) | 1 | 0% (--) | 0% (--) | 1 | 0% (--) | 0% (--) | 1 | 0% (--) |
| Senegal | ||||||||
| 1. Dry, powdered, and instant cereal/starchy food (n = 76) | 49 | 25% (18–55%) | 20% (14–44%) | 62 | 38% (32–47%) | 60% (52–76%) | 40 | 34% (32–50%) |
| 2. Soft-wet spoonable, ready-to-eat foods (purees) (n = 194) | 20 | 25% (16–25%) | 20% (13–20%) | 0 | - | - | 3 | 22% (20–22%) |
| 3. Meals with chunky pieces (n = 49) | 0 | - | - | 0 | - | - | 0 | - |
| 4. Dry finger foods and snacks (n = 10) | 2 | 8% (8–8%) | 6% (6–6%) | 2 | 7% (7–7%) | 11% (11–11%) | 0 | - |
| 5. Juices and other drinks (n = 19) | 0 | - | - | 0 | - | - | 0 | - |
Disclaimer/Publisher’s Note: The statements, opinions and data contained in all publications are solely those of the individual author(s) and contributor(s) and not of MDPI and/or the editor(s). MDPI and/or the editor(s) disclaim responsibility for any injury to people or property resulting from any ideas, methods, instructions or products referred to in the content. |
© 2023 by the authors. Licensee MDPI, Basel, Switzerland. This article is an open access article distributed under the terms and conditions of the Creative Commons Attribution (CC BY) license (https://creativecommons.org/licenses/by/4.0/).
Share and Cite
Khosravi, A.; Bassetti, E.; Yuen-Esco, K.; Sy, N.Y.; Kane, R.; Sweet, L.; Zehner, E.; Pries, A.M. Nutrient Profiles of Commercially Produced Complementary Foods Available in Burkina Faso, Cameroon, Ghana, Nigeria and Senegal. Nutrients 2023, 15, 2279. https://doi.org/10.3390/nu15102279
Khosravi A, Bassetti E, Yuen-Esco K, Sy NY, Kane R, Sweet L, Zehner E, Pries AM. Nutrient Profiles of Commercially Produced Complementary Foods Available in Burkina Faso, Cameroon, Ghana, Nigeria and Senegal. Nutrients. 2023; 15(10):2279. https://doi.org/10.3390/nu15102279
Chicago/Turabian StyleKhosravi, Asha, Eleonora Bassetti, Katelyn Yuen-Esco, Ndeye Yaga Sy, Rosenette Kane, Lara Sweet, Elizabeth Zehner, and Alissa M. Pries. 2023. "Nutrient Profiles of Commercially Produced Complementary Foods Available in Burkina Faso, Cameroon, Ghana, Nigeria and Senegal" Nutrients 15, no. 10: 2279. https://doi.org/10.3390/nu15102279