
A Comprehensive Analysis of Plasma Cytokines and Metabolites Shows an Association between Galectin-9 and Changes in Peripheral Lymphocyte Subset Percentages Following Coix Seed Consumption

 , , and
Abstract
:1. Introduction
2. Materials and Methods
2.1. Plasma Samples
2.2. Cytokine Analysis
2.3. Metabolite Analysis
2.4. Statistical Analysis
3. Results
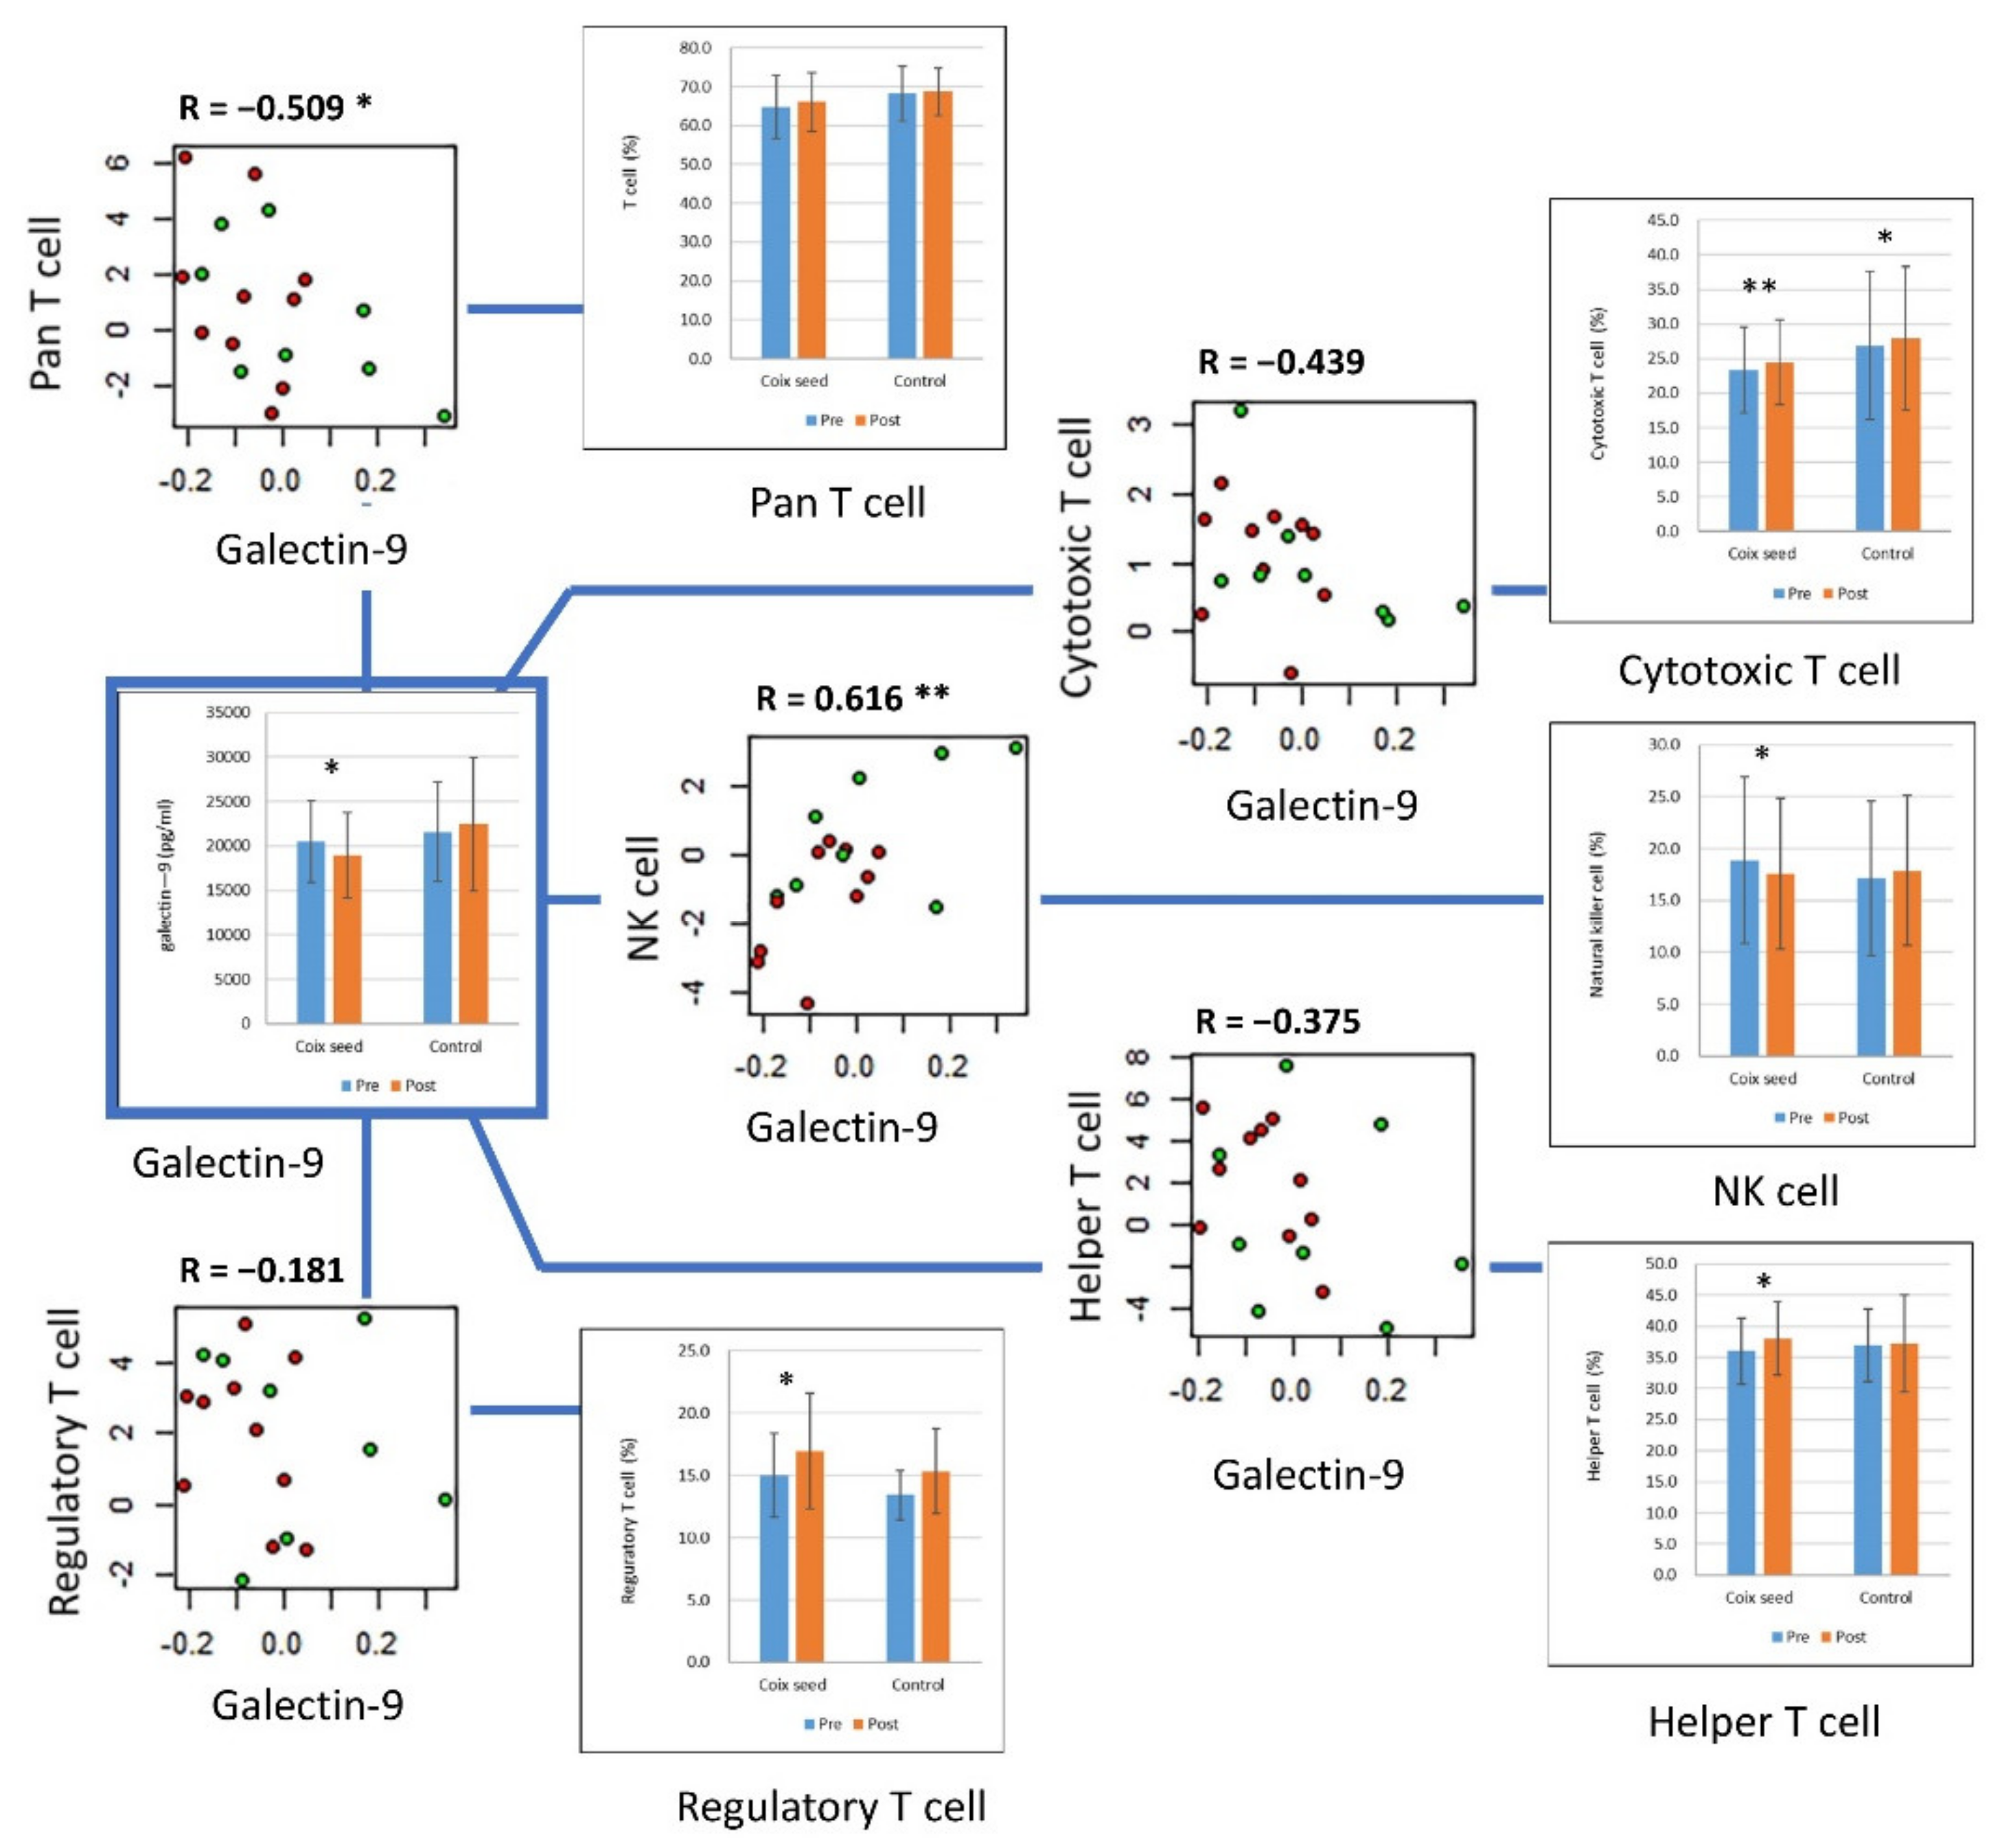
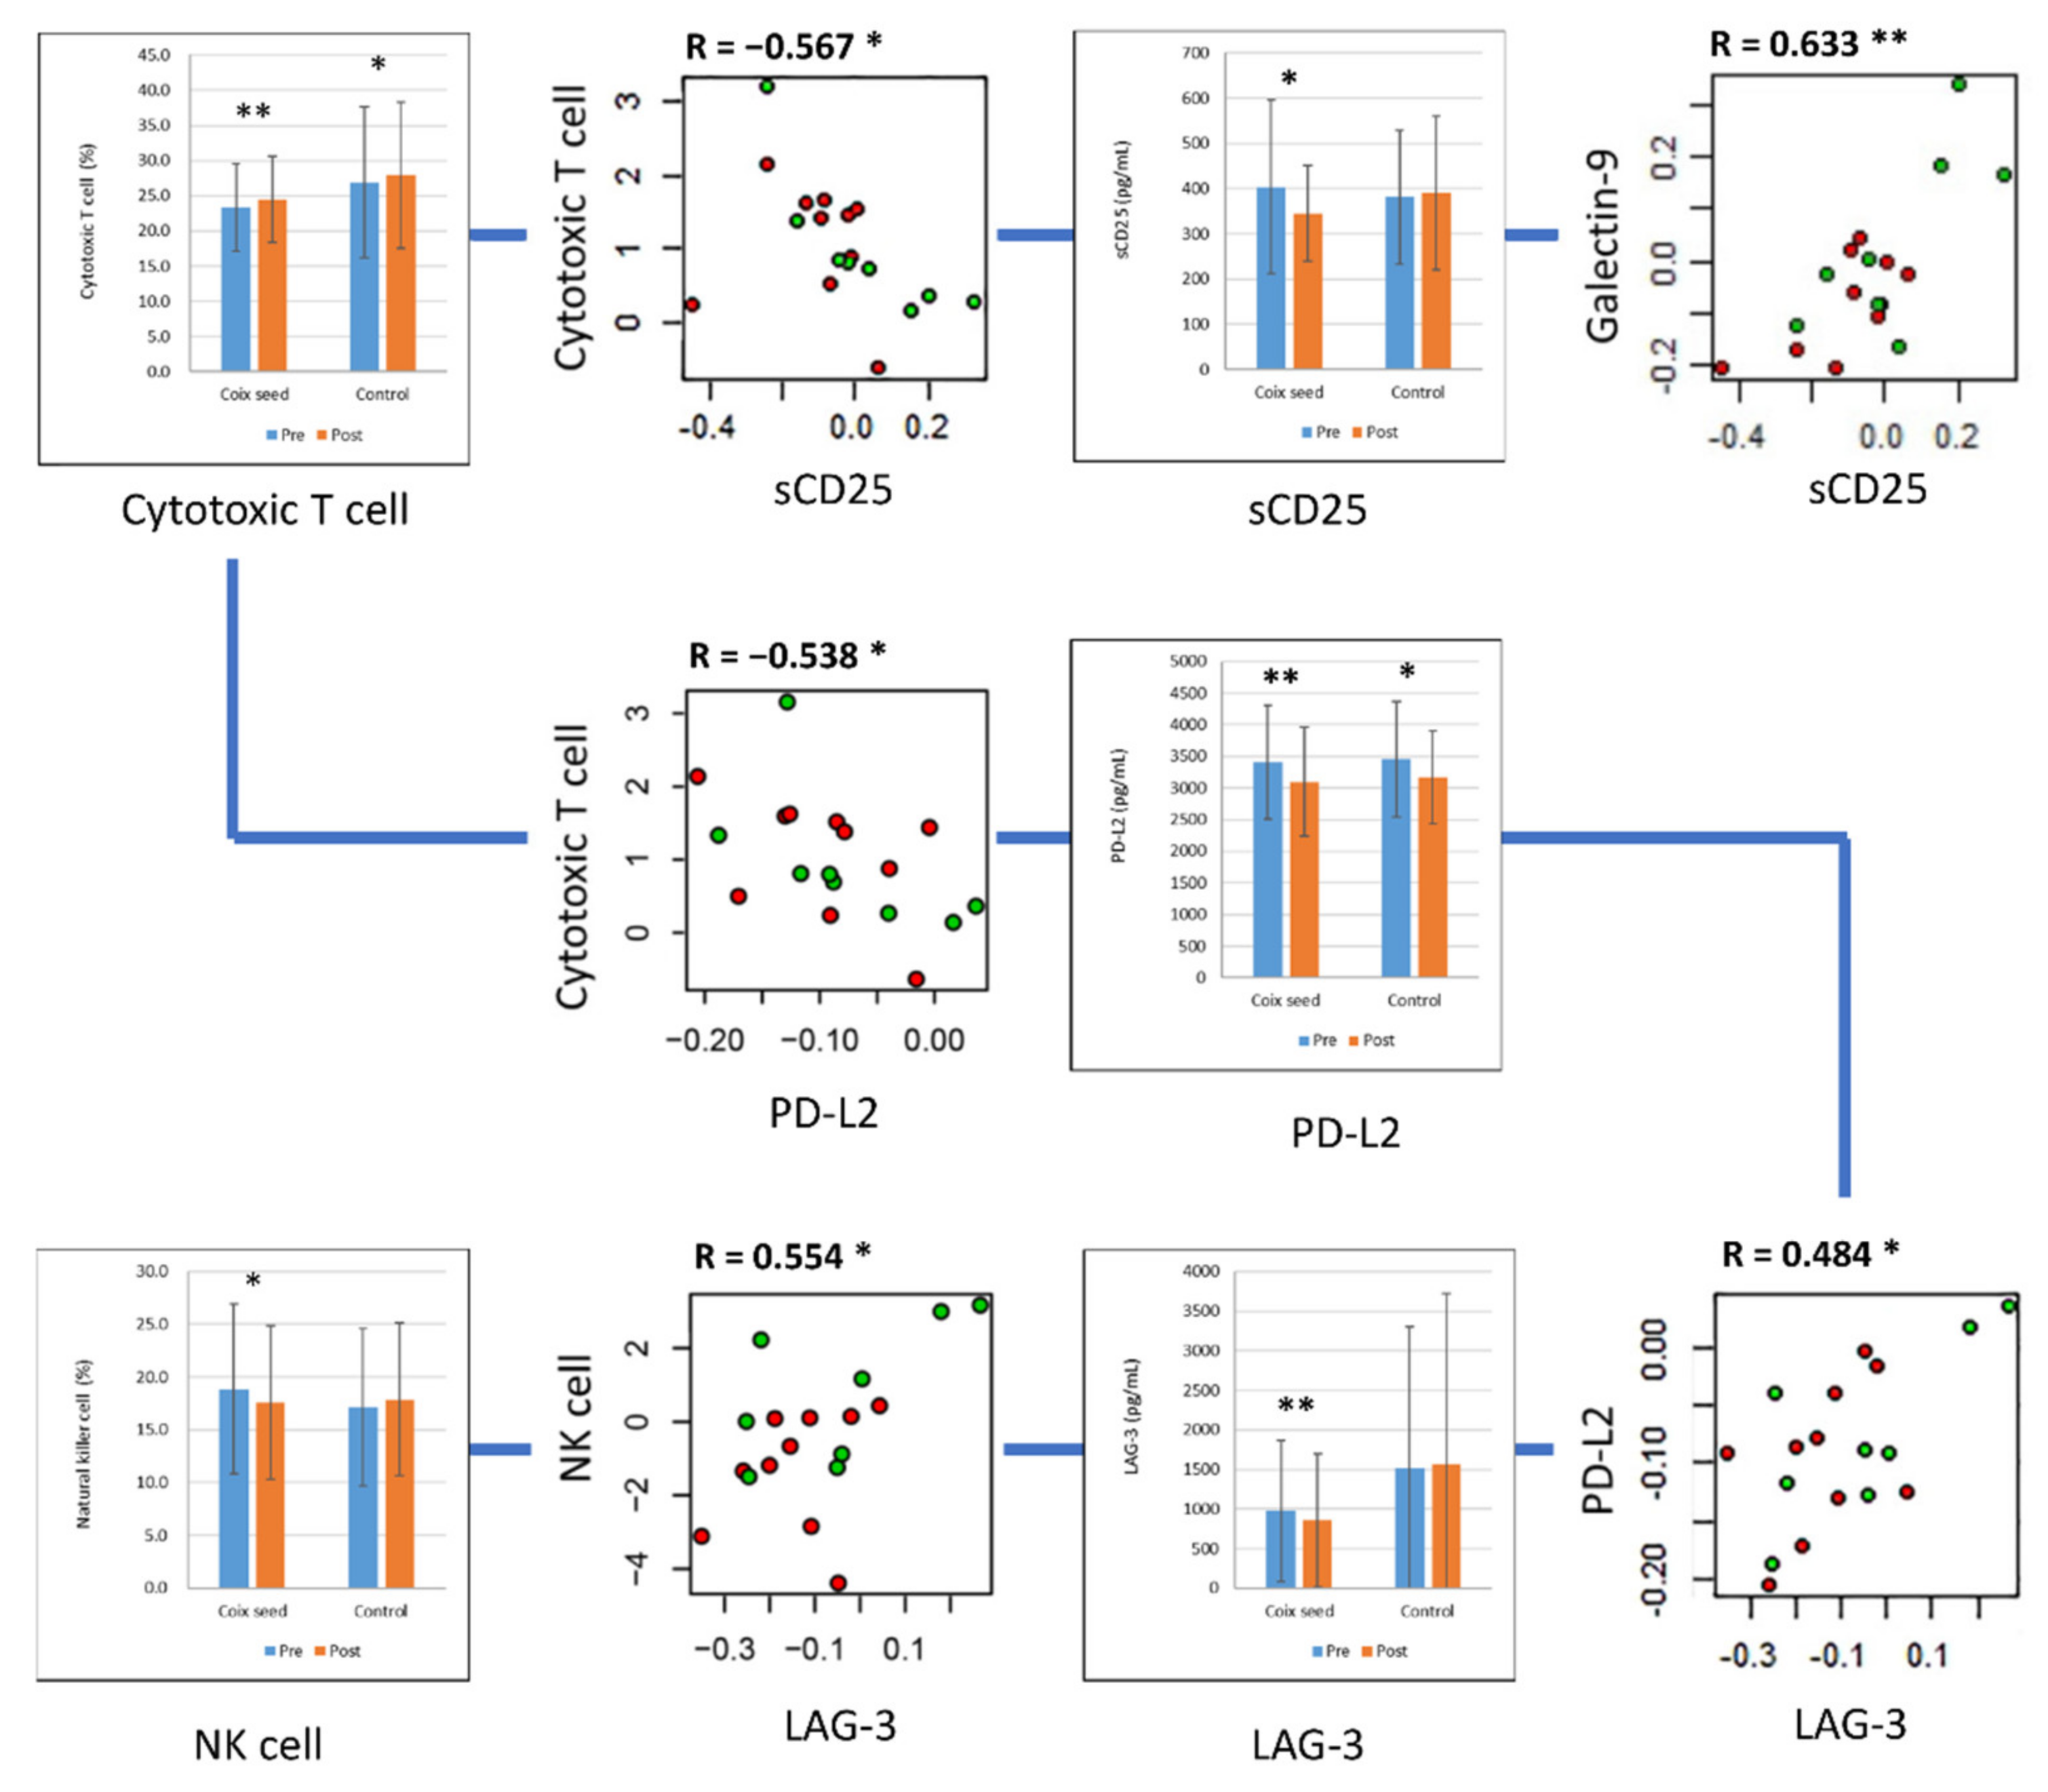
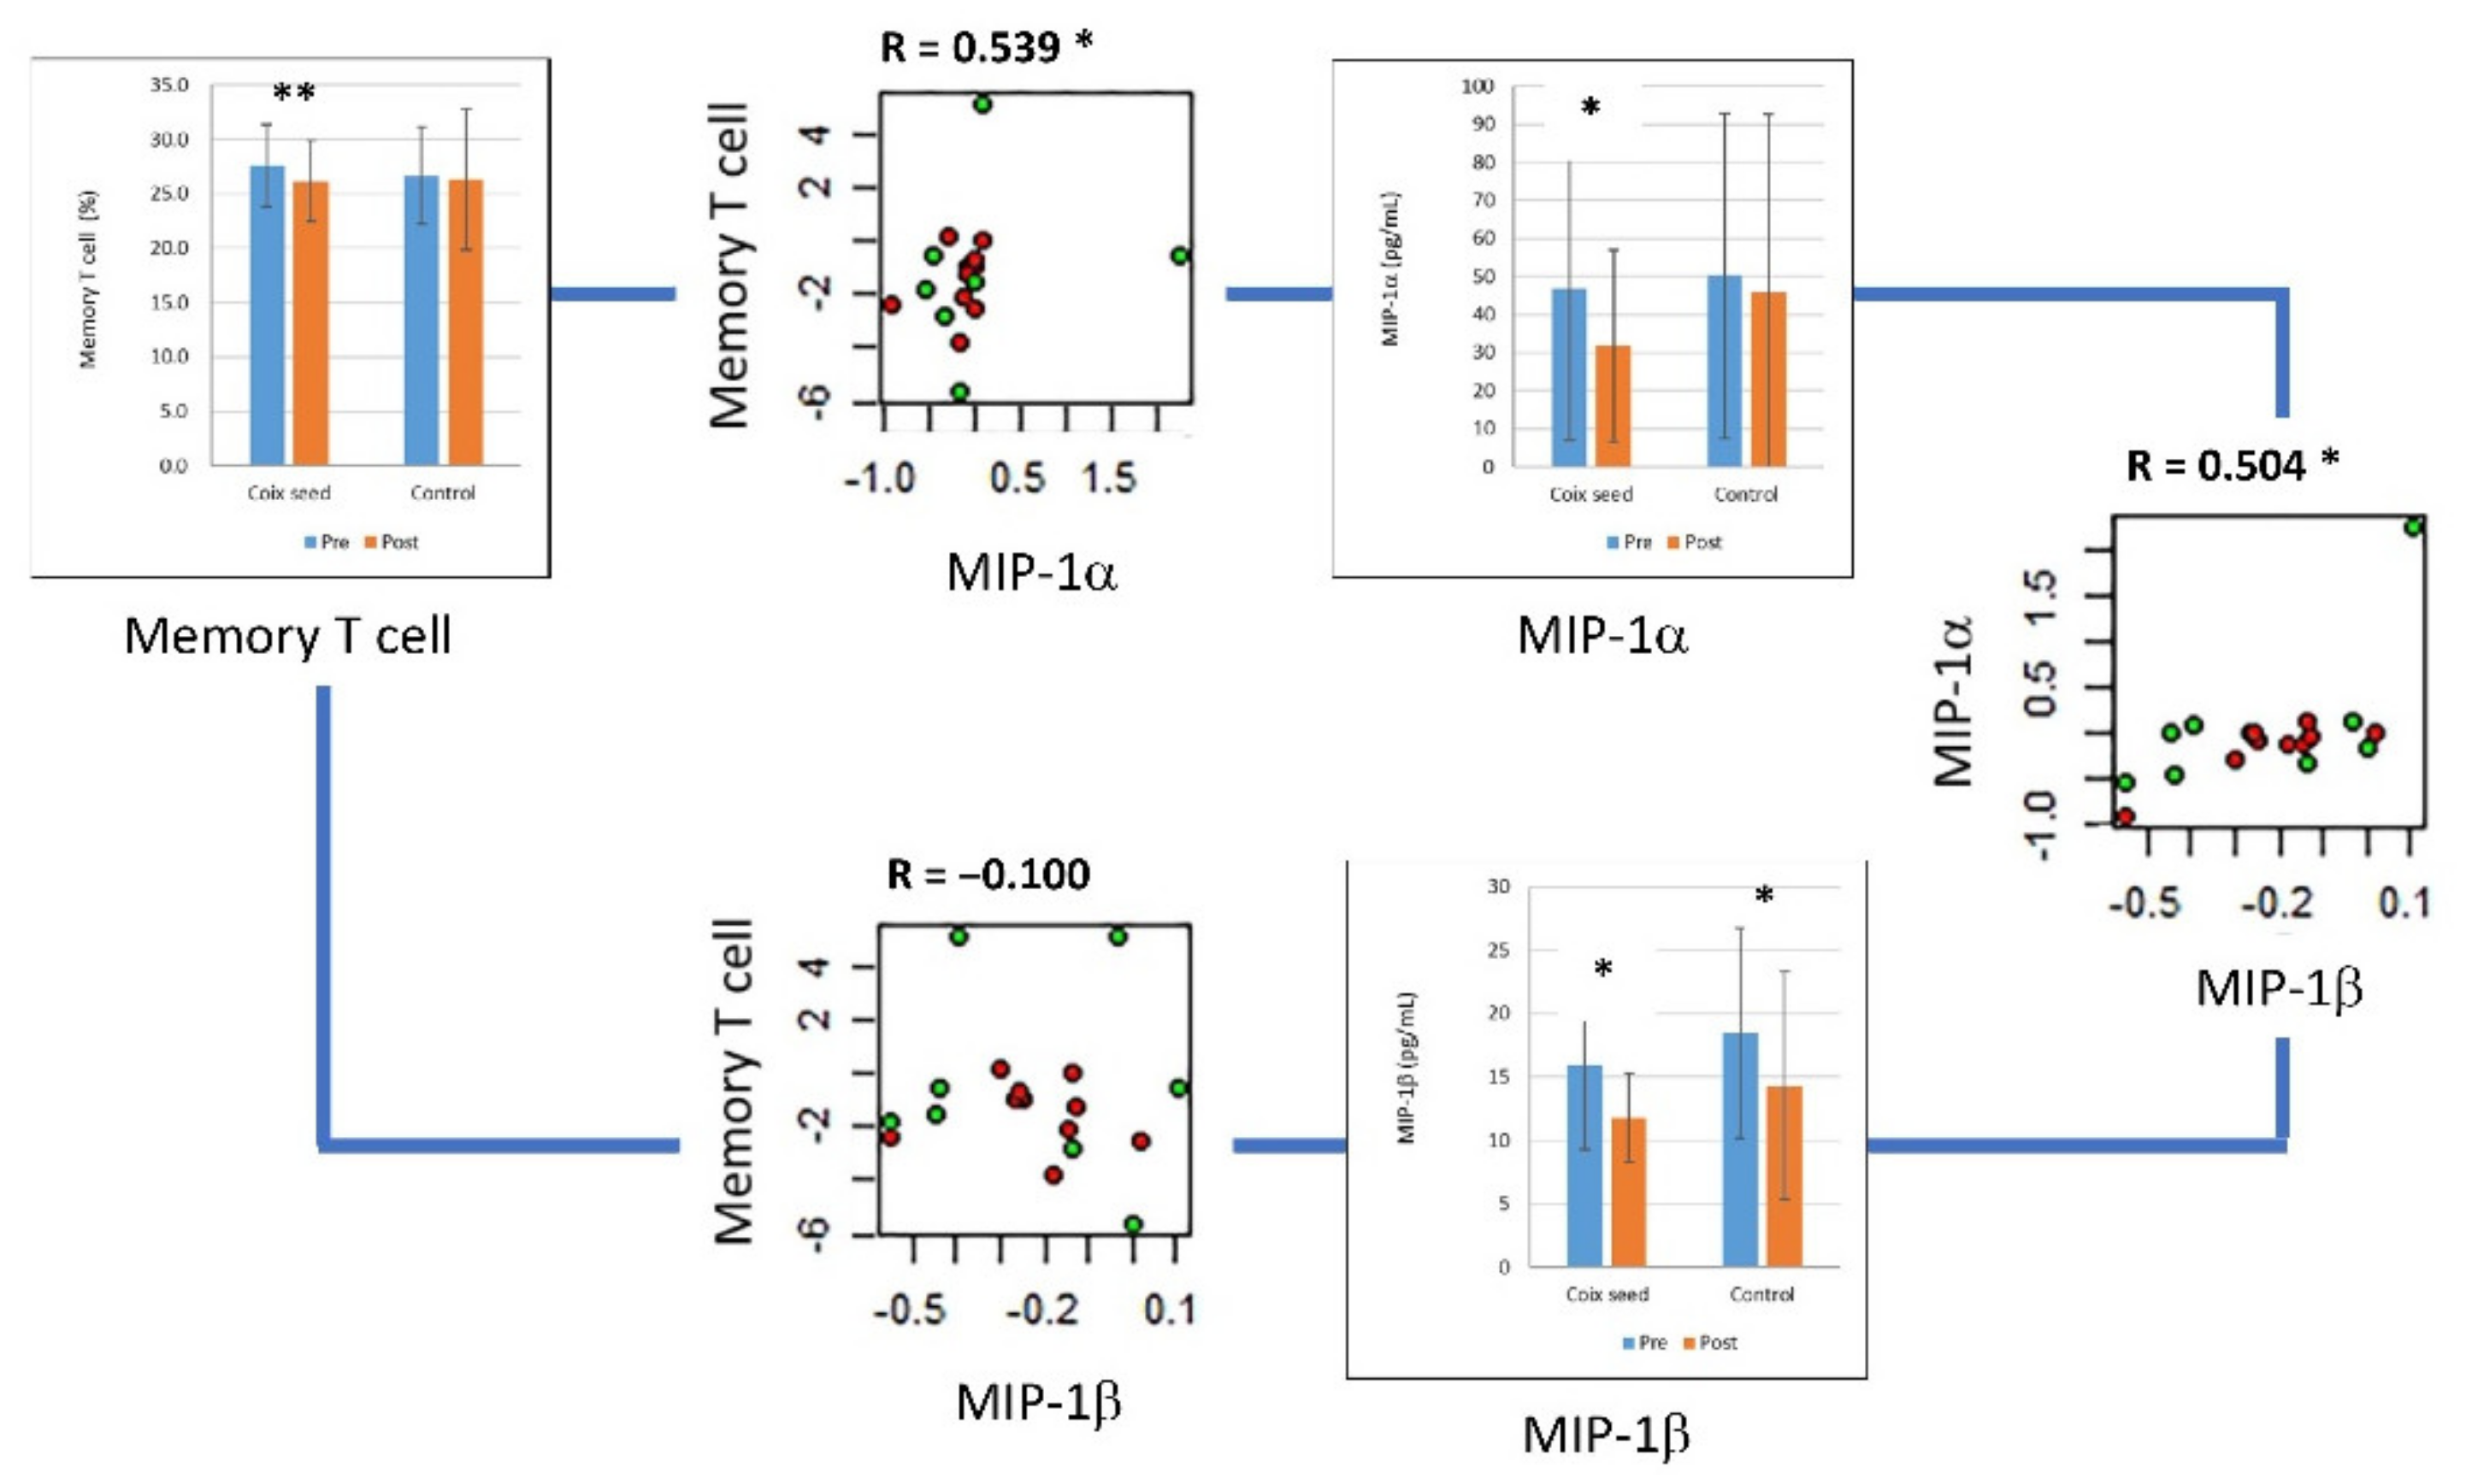
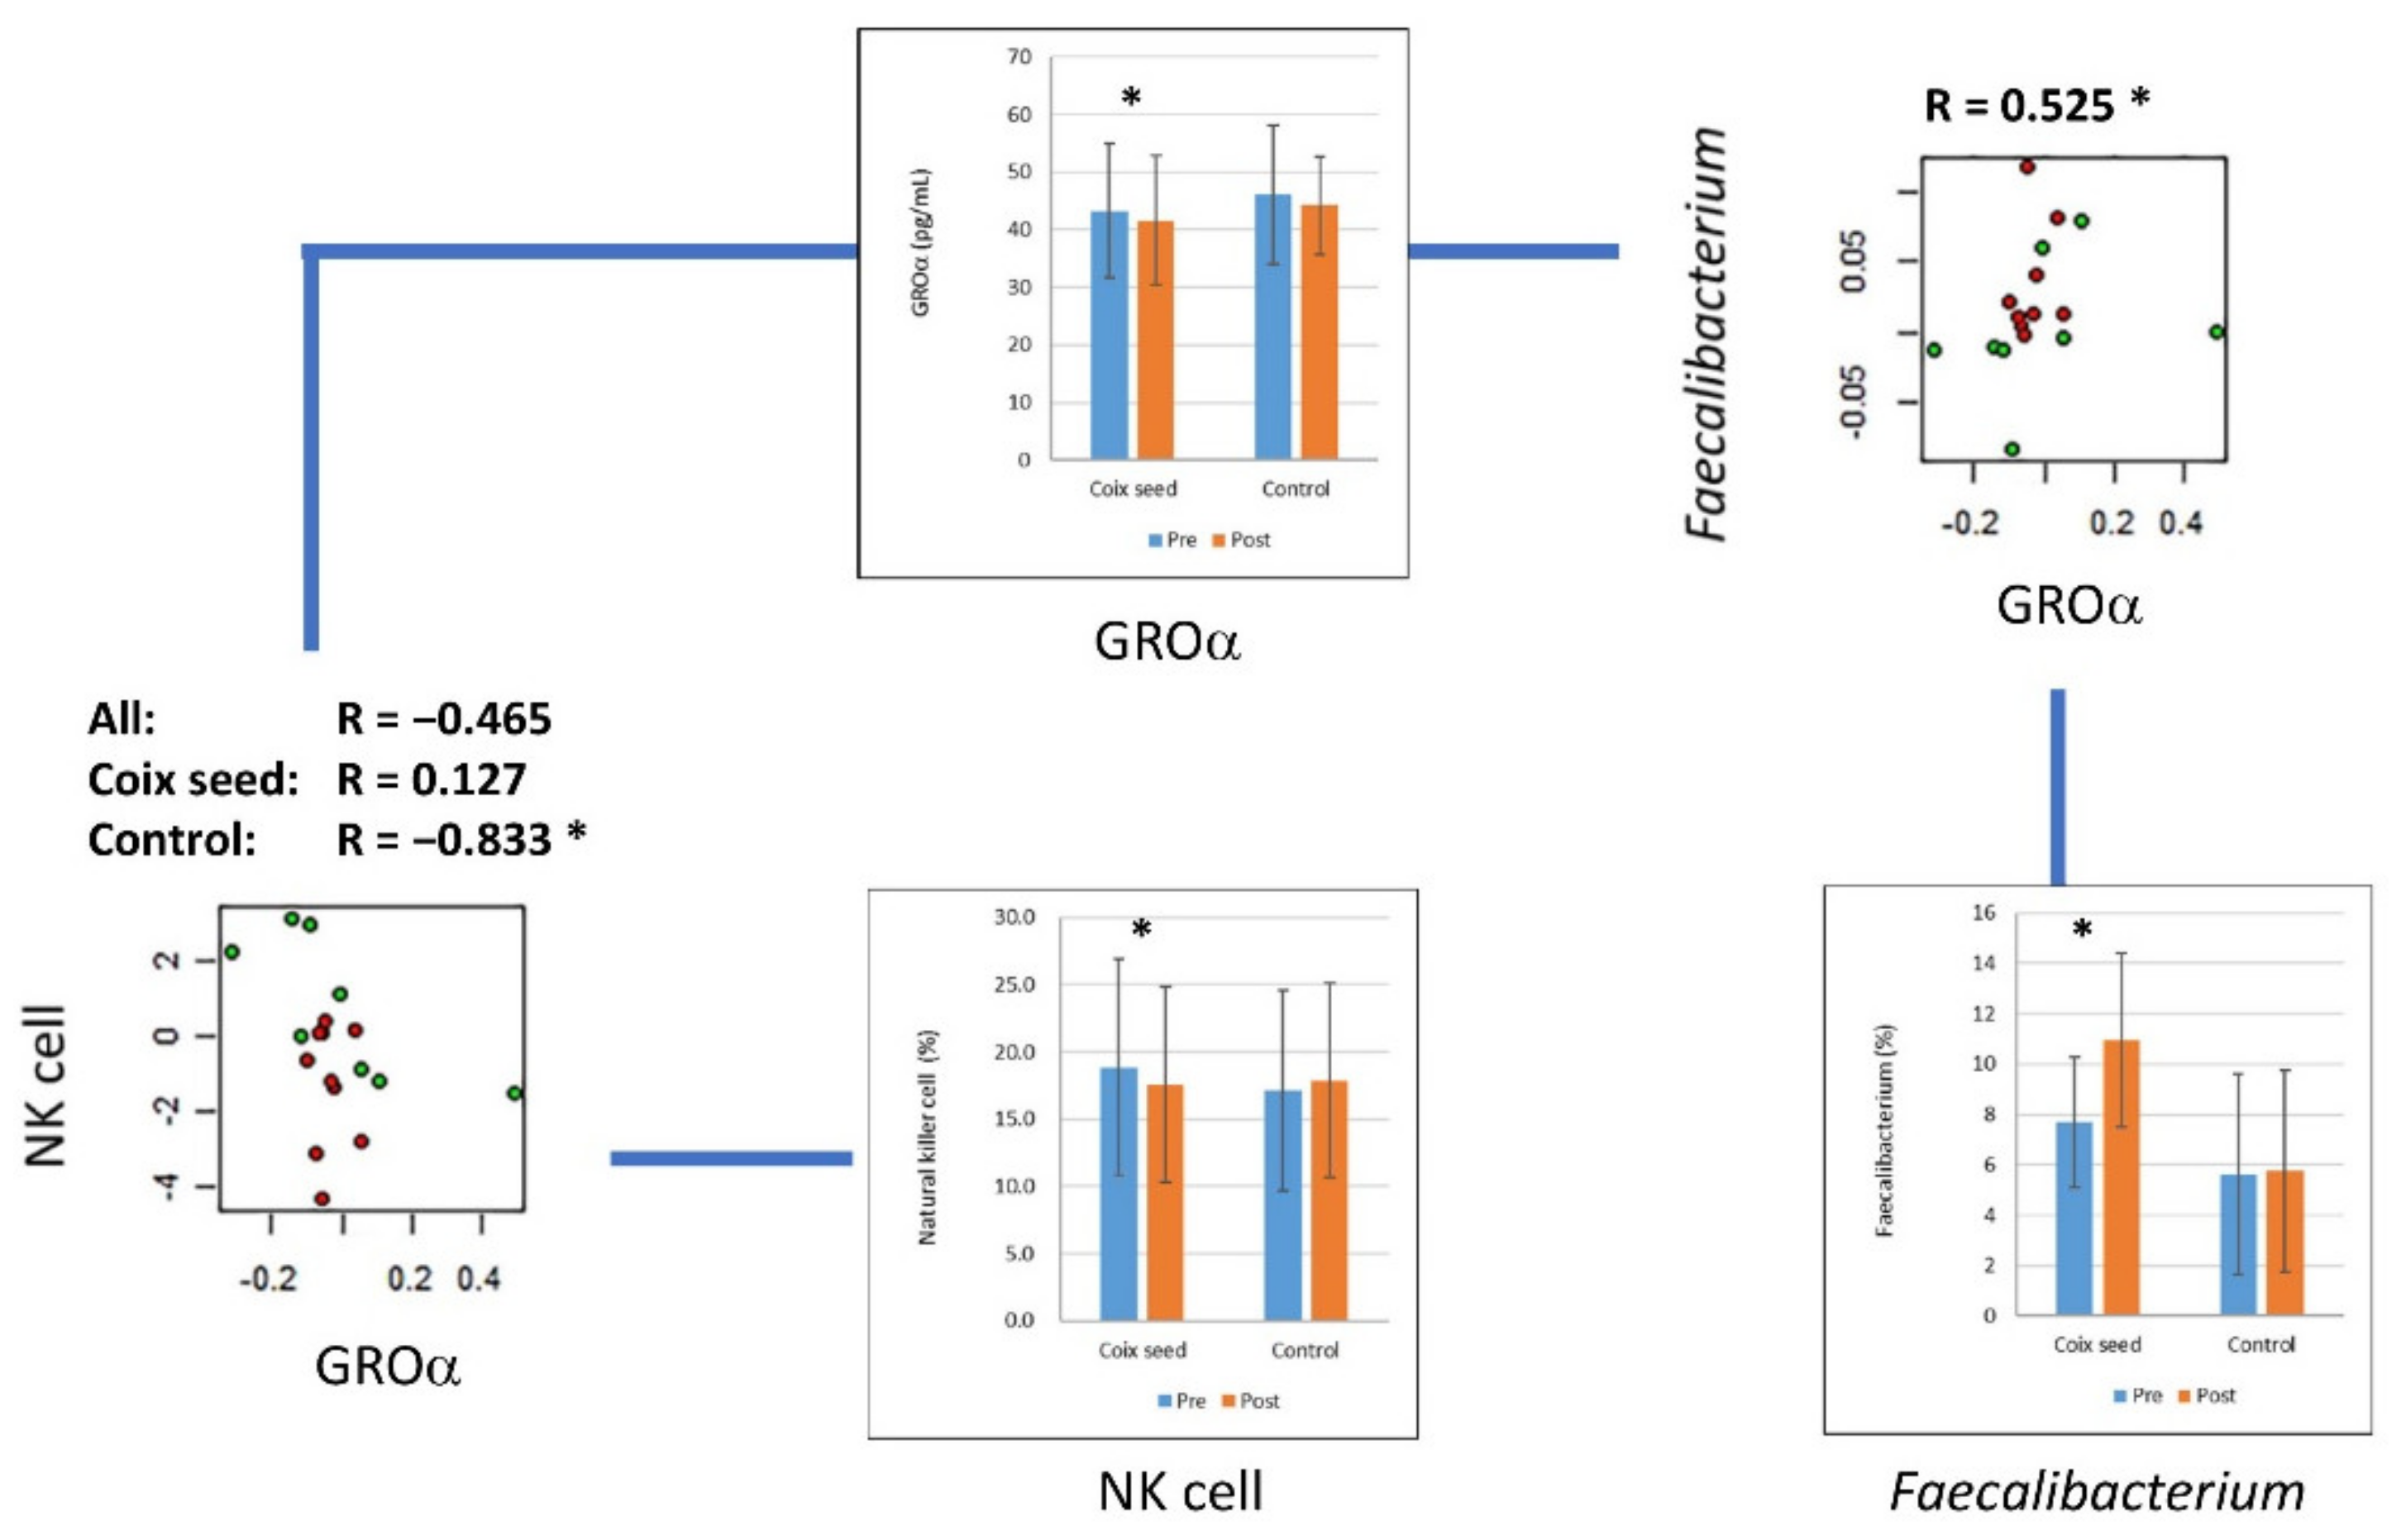
3.1. Cytokines
3.2. Metabolites
4. Discussion
5. Conclusions
Supplementary Materials
Author Contributions
Funding
Institutional Review Board Statement
Informed Consent Statement
Data Availability Statement
Acknowledgments
Conflicts of Interest
References
- Suzuki, Y.; Konaya, Y. Coix Seed May Affect Human Immune Function. Nat. Prod. Commun. 2021, 16, 1934578X2110486. [Google Scholar] [CrossRef]
- Research Group for Coix Seed Extract Powder. Therapeutic Effect of Coix Seed (Yokuinin) Extract Powder on Molluscum Contagiosum- Well-Controlled Double Blind Trials by Multi-Institutes Compared with Placebo. Ski. Res. 1987, 29, 762–773. [Google Scholar] [CrossRef]
- Liu, J.; Liu, X.; Ma, J.; Li, K.; Xu, C. The clinical efficacy and safety of kanglaite adjuvant therapy in the treatment of advanced hepatocellular carcinoma: A PRISMA-compliant meta-analysis. Biosci. Rep. 2019, 39, 1–16. [Google Scholar] [CrossRef] [Green Version]
- Huang, X.; Wang, J.; Lin, W.; Zhang, N.; Du, J.; Long, Z.; Yang, Y.; Zheng, B.; Zhong, F.; Wu, Q.; et al. Kanglaite injection plus platinum-based chemotherapy for stage III/IV non-small cell lung cancer: A meta-analysis of 27 RCTs. Phytomedicine 2020, 67, 153154. [Google Scholar] [CrossRef] [PubMed]
- Wen, J.; Yang, T.; Wang, J.; Ma, X.; Tong, Y.; Zhao, Y. Kanglaite Injection Combined with Chemotherapy versus Chemotherapy Alone for the Improvement of Clinical Efficacy and Immune Function in Patients with Advanced Non-Small-Cell Lung Cancer: A Systematic Review and Meta-Analysis. Evid. Based Complement. Alternat. Med. 2020, 2020, 8586596. [Google Scholar] [CrossRef] [PubMed]
- Song, Q.; Zhang, J.; Wu, Q.; Li, G.; Leung, E.L. Kanglaite injection plus fluorouracil-based chemotherapy on the reduction of adverse effects and improvement of clinical effectiveness in patients with advanced malignant tumors of the digestive tract: A meta-analysis of 20 RCTs following the PRISMA guide. Medicine 2020, 99, e19480. [Google Scholar] [CrossRef]
- Tanimura, A. Studies on anti-tumor component in the seeds of Coix Lachryma-Jobi L. VAR. Ma-yuen (Roman) Stapf. II. Chem. Pharm. Bull. 1961, 9, 47–53. [Google Scholar] [CrossRef]
- Ukita, T.; Tanimura, A. Component in seeds of Coix Lacryma-Jobi L. Ma-yuen (Roman). Chem. Pharm. Bull. 1961, 9, 43–46. [Google Scholar] [CrossRef] [Green Version]
- Koyama, T.; Yamato, M. Studies on the constituents of coix species. I. On the constituents of the root of Coix Lachryma-Jobi L. Yakugaku Zasshi 1955, 75, 699–701. [Google Scholar] [CrossRef] [Green Version]
- Koyama, T. Studies on the constituents of coix species. II. On the chemical structure of coixol. Yakuhgaku Zasshi 1955, 75, 702–704. [Google Scholar] [CrossRef] [Green Version]
- Hu, Y.; Zhou, Q.; Liu, T.; Liu, Z. Coixol Suppresses NF-κB, MAPK Pathways and NLRP3 Inflammasome Activation in Lipopolysaccharide-Induced RAW 264.7 Cells. Molecules 2020, 25, 894. [Google Scholar] [CrossRef] [PubMed] [Green Version]
- Zheng, H.; Zhang, W.; Zhou, H.; Zhang, W.; Yu, J.; Wang, W. Effect of Coixenolide on Foxp3+ CD4+ CD25+ Regulatory T Cells in Collagen-induced Arthritis Mice. Chin. J. Integr. Tradit. West. Med. 2016, 36, 348–350. [Google Scholar]
- Takimoto, Y.; Suzuki, N.; Kawabata, T.; Tadano, T.; Ohta, T.; Tokuda, H.; Xu, F.; Inoue, M. A Study on the Useful Components of Adlay (Coix lachryma-jobi L. var.ma-yuen Stapf). Jpn. J. Complement. Altern. Med. 2013, 10, 69–74. [Google Scholar] [CrossRef] [Green Version]
- Chung, C.-P.; Hsu, C.-Y.; Lin, J.-H.; Kuo, Y.-H.; Chiang, W.; Lin, Y.-L. Antiproliferative lactams and spiroenone from adlay bran in human breast cancer cell lines. J. Agric. Food Chem. 2011, 59, 1185–1194. [Google Scholar] [CrossRef] [PubMed]
- Amen, Y.; Arung, E.T.; Afifi, M.S.; Halim, A.F.; Ashour, A.; Fujimoto, R.; Goto, T.; Shimizu, K. Melanogenesis inhibitors from Coix lacryma-jobi seeds in B16-F10 melanoma cells. Nat. Prod. Res. 2017, 31, 2712–2718. [Google Scholar] [CrossRef] [PubMed]
- Sanders, E.H.; Gardner, P.D.; Berger, P.J.; Negus, N.C. 6-methoxybenzoxazolinone: A plant derivative that stimulates reproduction in Microtus montanus. Science 1981, 214, 67–69. [Google Scholar] [CrossRef]
- Hameed, A.; Hafizur, R.M.; Khan, M.I.; Jawed, A.; Wang, H.; Zhao, M.; Matsunaga, K.; Izumi, T.; Siddiqui, S.; Khan, F.; et al. Coixol amplifies glucose-stimulated insulin secretion via cAMP mediated signaling pathway. Eur. J. Pharmacol. 2019, 858, 172514. [Google Scholar] [CrossRef]
- Sharma, K.R.; Adhikari, A.; Hafizur, R.M.; Hameed, A.; Raza, S.A.; Kalauni, S.K.; Miyazaki, J.-I.; Choudhary, M.I. Potent Insulin Secretagogue from Scoparia dulcis Linn of Nepalese Origin. Phytother. Res. 2015, 29, 1672–1675. [Google Scholar] [CrossRef]
- Lee, H.J.; Ryu, J.; Park, S.H.; Seo, E.-K.; Han, A.-R.; Lee, S.K.; Kim, Y.S.; Hong, J.-H.; Seok, J.H.; Lee, C.J. Suppressive effects of coixol, glyceryl trilinoleate and natural products derived from Coix Lachryma-Jobi var. ma-yuen on gene expression, production and secretion of airway MUC5AC mucin. Arch. Pharm. Res. 2015, 38, 620–627. [Google Scholar] [CrossRef]
- Jinnouchi, M.; Miyahara, T.; Suzuki, Y. Coix Seed Consumption Affects the Gut Microbiota and the Peripheral Lymphocyte Subset Profiles of Healthy Male Adults. Nutrients 2021, 13, 4079. [Google Scholar] [CrossRef]
- Cao, Y.; Shen, J.; Ran, Z.H. Association between Faecalibacterium prausnitzii Reduction and Inflammatory Bowel Disease: A Meta-Analysis and Systematic Review of the Literature. Gastroenterol. Res. Pract. 2014, 2014, 872725. [Google Scholar] [CrossRef] [PubMed] [Green Version]
- Fujimoto, T.; Imaeda, H.; Takahashi, K.; Kasumi, E.; Bamba, S.; Fujiyama, Y.; Andoh, A. Decreased abundance of Faecalibacterium prausnitzii in the gut microbiota of Crohn’s disease. J. Gastroenterol. Hepatol. 2013, 28, 613–619. [Google Scholar] [CrossRef] [PubMed]
- Sokol, H.; Seksik, P.; Furet, J.P.; Firmesse, O.; Nion-Larmurier, I.; Beaugerie, L.; Cosnes, J.; Corthier, G.; Marteau, P.; Doré, J. Low counts of Faecalibacterium prausnitzii in colitis microbiota. Inflamm. Bowel Dis. 2009, 15, 1183–1189. [Google Scholar] [CrossRef]
- Vakili, B.; Fateh, A.; Asadzadeh Aghdaei, H.; Sotoodehnejadnematalahi, F.; Siadat, S.D. Intestinal Microbiota in Elderly Inpatients with Clostridioides difficile Infection. Infect. Drug Resist. 2020, 13, 2723–2731. [Google Scholar] [CrossRef] [PubMed]
- Pinto-Cardoso, S.; Lozupone, C.; Briceño, O.; Alva-Hernández, S.; Téllez, N.; Adriana, A.; Murakami-Ogasawara, A.; Reyes-Terán, G. Fecal Bacterial Communities in treated HIV infected individuals on two antiretroviral regimens. Sci. Rep. 2017, 7, 43741. [Google Scholar] [CrossRef] [PubMed] [Green Version]
- Lu, H.; Wu, Z.; Xu, W.; Yang, J.; Chen, Y.; Li, L. Intestinal microbiota was assessed in cirrhotic patients with hepatitis B virus infection. Intestinal microbiota of HBV cirrhotic patients. Microb. Ecol. 2011, 61, 693–703. [Google Scholar] [CrossRef] [PubMed]
- Yoshio, S. Nutrient contents of packed cooked coix seed. J. Jpn. Soc. Food Eng. 2022; 42, in press. [Google Scholar]
- Faul, F.; Erdfelder, E.; Lang, A.-G.; Buchner, A. G*Power 3: A flexible statistical power analysis program for the social, behavioral, and biomedical sciences. Behav. Res. Methods 2007, 39, 175–191. [Google Scholar] [CrossRef]
- Faul, F.; Erdfelder, E.; Buchner, A.; Lang, A.-G. Statistical power analyses using G*Power 3.1: Tests for correlation and regression analyses. Behav. Res. Methods 2009, 41, 1149–1160. [Google Scholar] [CrossRef] [Green Version]
- Wada, J.; Kanwar, Y.S. Identification and characterization of galectin-9, a novel β- galactoside-binding mammalian lectin. J. Biol. Chem. 1997, 272, 6078–6086. [Google Scholar] [CrossRef] [Green Version]
- Wada, J.; Ota, K.; Kumar, A.; Wallner, E.I.; Kanwar, Y.S. Developmental regulation, expression, and apoptotic potential of galectin-9, a β-galactoside binding lectin. J. Clin. Investig. 1997, 99, 2452–2461. [Google Scholar] [CrossRef] [PubMed]
- Kashio, Y.; Nakamura, K.; Abedin, M.J.; Seki, M.; Nishi, N.; Yoshida, N.; Nakamura, T.; Hirashima, M. Galectin-9 Induces Apoptosis Through the Calcium-Calpain-Caspase-1 Pathway. J. Immunol. 2003, 170, 3631–3636. [Google Scholar] [CrossRef] [PubMed] [Green Version]
- Zhu, C.; Anderson, A.C.; Schubart, A.; Xiong, H.; Imitola, J.; Khoury, S.J.; Zheng, X.X.; Strom, T.B.; Kuchroo, V.K. The Tim-3 ligand galectin-9 negatively regulates T helper type 1 immunity. Nat. Immunol. 2005, 6, 1245–1252. [Google Scholar] [CrossRef]
- Yang, R.; Sun, L.; Li, C.-F.; Wang, Y.-H.; Yao, J.; Li, H.; Yan, M.; Chang, W.-C.; Hsu, J.-M.; Cha, J.-H.; et al. Galectin-9 interacts with PD-1 and TIM-3 to regulate T cell death and is a target for cancer immunotherapy. Nat. Commun. 2021, 12, 832. [Google Scholar] [CrossRef]
- Rubin, L.A.; Galli, F.; Greene, W.C.; Nelson, D.L.; Jay, G. The molecular basis for the generation of the human soluble interleukin 2 receptor. Cytokine 1990, 2, 330–336. [Google Scholar] [CrossRef]
- Lindqvist, C.A.; Christiansson, L.H.; Simonsson, B.; Enblad, G.; Olsson-Strömberg, U.; Loskog, A.S.I. T regulatory cells control T-cell proliferation partly by the release of soluble CD25 in patients with B-cell malignancies. Immunology 2010, 131, 371–376. [Google Scholar] [CrossRef]
- Pedersen, A.E.; Lauritsen, J.P. CD25 shedding by human natural occurring CD4+CD25+ regulatory T cells does not inhibit the action of IL-2. Scand. J. Immunol. 2009, 70, 40–43. [Google Scholar] [CrossRef]
- Maier, L.M.; Anderson, D.E.; Severson, C.A.; Baecher-Allan, C.; Healy, B.; Liu, D.V.; Wittrup, K.D.; De Jager, P.L.; Hafler, D.A. Soluble IL-2RA levels in multiple sclerosis subjects and the effect of soluble IL-2RA on immune responses. J. Immunol. 2009, 182, 1541–1547. [Google Scholar] [CrossRef] [Green Version]
- Yang, Z.-Z.; Grote, D.M.; Ziesmer, S.C.; Manske, M.K.; Witzig, T.E.; Novak, A.J.; Ansell, S.M. Soluble IL-2Rα facilitates IL-2-mediated immune responses and predicts reduced survival in follicular B-cell non-Hodgkin lymphoma. Blood 2011, 118, 2809–2820. [Google Scholar] [CrossRef]
- Damoiseaux, J. The IL-2—IL-2 receptor pathway in health and disease: The role of the soluble IL-2 receptor. Clin. Immunol. 2020, 218, 108515. [Google Scholar] [CrossRef]
- Chen, L. Co-inhibitory molecules of the B7-CD28 family in the control of T-cell immunity. Nat. Rev. Immunol. 2004, 4, 336–347. [Google Scholar] [CrossRef]
- Sharpe, A.H.; Wherry, E.J.; Ahmed, R.; Freeman, G.J. The function of programmed cell death 1 and its ligands in regulating autoimmunity and infection. Nat. Immunol. 2007, 8, 239–245. [Google Scholar] [CrossRef] [PubMed]
- Akutsu, Y.; Murakami, K.; Hanari, N.; Kano, M.; Uesato, M.; Ota, T.; Suito, H.; Matsumoto, Y.; Takahashi, M.; Matsubara, H. Serum Level of PD-1, PD-L1, and PD-L2 as a New Biomarker for Esophageal Cancer. Am. J. Gastroenterol. 2015, 110, S694. [Google Scholar] [CrossRef]
- Wu, W.; Xia, X.; Cheng, C.; Niu, L.; Wu, J.; Qian, Y. Serum Soluble PD-L1, PD-L2, and B7-H5 as Potential Diagnostic Biomarkers of Human Pancreatic Cancer. Clin. Lab. 2021, 67, 210103. [Google Scholar] [CrossRef] [PubMed]
- Triebel, F.; Jitsukawa, S.; Baixeras, E.; Roman-Roman, S.; Genevee, C.; Viegas-Pequignot, E.; Hercend, T. LAG-3, a novel lymphocyte activation gene closely related to CD4. J. Exp. Med. 1990, 171, 1393–1405. [Google Scholar] [CrossRef] [Green Version]
- Saunders, P.A.; Hendrycks, V.R.; Lidinsky, W.A.; Woods, M.L. PD-L2:PD-1 involvement in T cell proliferation, cytokine production, and integrin-mediated adhesion. Eur. J. Immunol. 2005, 35, 3561–3569. [Google Scholar] [CrossRef]
- Li, N.; Jilisihan, B.; Wang, W.; Tang, Y.; Keyoumu, S. Soluble LAG3 acts as a potential prognostic marker of gastric cancer and its positive correlation with CD8+T cell frequency and secretion of IL-12 and INF-γ in peripheral blood. Cancer Biomark. 2018, 23, 341–351. [Google Scholar] [CrossRef]
- He, Y.; Wang, Y.; Zhao, S.; Zhao, C.; Zhou, C.; Hirsch, F.R. sLAG-3 in non-small-cell lung cancer patients’ serum. Onco. Targets Ther. 2018, 11, 4781–4784. [Google Scholar] [CrossRef] [Green Version]
- Guo, M.; Qi, F.; Rao, Q.; Sun, J.; Du, X.; Qi, Z.; Yang, B.; Xia, J. Serum LAG-3 Predicts Outcome and Treatment Response in Hepatocellular Carcinoma Patients with Transarterial Chemoembolization. Front. Immunol. 2021, 12, 754961. [Google Scholar] [CrossRef]
- Tsai, H.-H.; Frost, E.; To, V.; Robinson, S.; Ffrench-Constant, C.; Geertman, R.; Ransohoff, R.M.; Miller, R.H. The chemokine receptor CXCR2 controls positioning of oligodendrocyte precursors in developing spinal cord by arresting their migration. Cell 2002, 110, 373–383. [Google Scholar] [CrossRef] [Green Version]


| Cytokine | Group | Pre | Post | p | |||
|---|---|---|---|---|---|---|---|
| Mean | SD | Mean | SD | ||||
| TNF-α | Coix seed | 6.792 | 3.568 | 2.704 | 2.673 | 0.0020 | ** |
| Control | 9.527 | 5.652 | 2.69 | 2.366 | 0.0234 | * | |
| PD-L2 | Coix seed | 3409.385 | 897.79 | 3100.019 | 864.241 | 0.0024 | ** |
| Control | 3452.927 | 910.039 | 3168.057 | 727.724 | 0.0422 | * | |
| LAG-3 | Coix seed | 974.04 | 887.598 | 858.48 | 843.609 | 0.0059 | ** |
| Control | 1523.65 | 1782.27 | 1567.275 | 2148.765 | 0.7422 | ||
| Eotaxin | Coix seed | 26.856 | 5.633 | 25.317 | 5.982 | 0.0063 | ** |
| Control | 27.711 | 9.639 | 25.637 | 9.06 | 0.1025 | ||
| sCD27 | Coix seed | 16,901.79 | 5130.348 | 15,185.19 | 5108.296 | 0.0087 | ** |
| Control | 16,075.838 | 4472.859 | 14,340.6 | 2940.917 | 0.0645 | ||
| IL-8 | Coix seed | 45.01 | 42.048 | 23.249 | 12.161 | 0.0098 | ** |
| Control | 51.822 | 41.884 | 37.705 | 49.843 | 0.0391 | * | |
| Granulysin | Coix seed | 1362.035 | 584.072 | 1236.16 | 566.357 | 0.0177 | * |
| Control | 1251.207 | 353.024 | 1195.626 | 278.356 | 0.3960 | ||
| MIP-1β | Coix seed | 15.962 | 6.686 | 11.808 | 3.477 | 0.0208 | * |
| Control | 18.446 | 8.274 | 14.329 | 8.97 | 0.0341 | * | |
| GROα | Coix seed | 43.306 | 11.6 | 41.594 | 11.222 | 0.0268 | * |
| Control | 46.075 | 12.12 | 44.224 | 8.499 | 0.4609 | ||
| sCD25 | Coix seed | 403.288 | 192.1 | 344.777 | 106.083 | 0.0371 | * |
| Control | 381.585 | 148.286 | 390.705 | 169.936 | 0.7309 | ||
| Galectin-9 | Coix seed | 20,522.77 | 4604.374 | 18,982.87 | 4809.372 | 0.0390 | * |
| Control | 21,600.662 | 5630.121 | 22,487.975 | 7507.335 | 0.5870 | ||
| MIP-1α | Coix seed | 46.864 | 39.994 | 31.732 | 25.262 | 0.0422 | * |
| Control | 50.209 | 42.623 | 45.774 | 46.875 | 0.6726 | ||
| RANTES | Coix seed | 1589.879 | 534.273 | 1393.553 | 465.832 | 0.0488 | * |
| Control | 2475.471 | 1999.592 | 1363.781 | 612.868 | 0.0656 | ||
| B7.2 | Coix seed | 119.586 | 31.025 | 112.681 | 29.667 | 0.0497 | * |
| Control | 104.954 | 52.349 | 104.704 | 64.895 | 0.4609 |
| Metabolite | Group | Pre | Post | p | |||
|---|---|---|---|---|---|---|---|
| Mean | SD | Mean | SD | ||||
| Malic acid | Coix seed | 3.227 | 0.679 | 4.204 | 0.76 | <0.0001 | **** |
| Control | 3.183 | 0.403 | 4.617 | 1.337 | 0.0369 | * | |
| Creatinine | Coix seed | 66.355 | 8.19 | 59.674 | 5.94 | 0.0017 | ** |
| Control | 64.205 | 8.077 | 60.045 | 10.131 | 0.0414 | * | |
| cis-Aconitic acid | Coix seed | 1.041 | 0.344 | 1.411 | 0.339 | 0.0023 | ** |
| Control | 1.018 | 0.386 | 1.415 | 0.462 | 0.1386 | ||
| Anthranilic acid | Coix seed | 0.323 | 0.164 | 0.148 | 0 | 0.0084 | ** |
| Control | 0.35 | 0.358 | 0.148 | 0 | 0.1558 | ||
| Cysteine | Coix seed | 3.932 | 1.159 | 2.625 | 1.049 | 0.0144 | * |
| Control | 3.63 | 0.697 | 2.19 | 1.345 | 0.0582 | ||
| 4-Aminobutyric | Coix seed | 9.284 | 6.928 | 11.157 | 7.594 | 0.0239 | * |
| acid (GABA) | Control | 10.46 | 5.78 | 12.469 | 6.57 | 0.1443 | |
| Citrulline | Coix seed | 26.376 | 6.821 | 29.838 | 5.495 | 0.0241 | * |
| Control | 28.127 | 4.522 | 28.002 | 5.617 | 0.9536 | ||
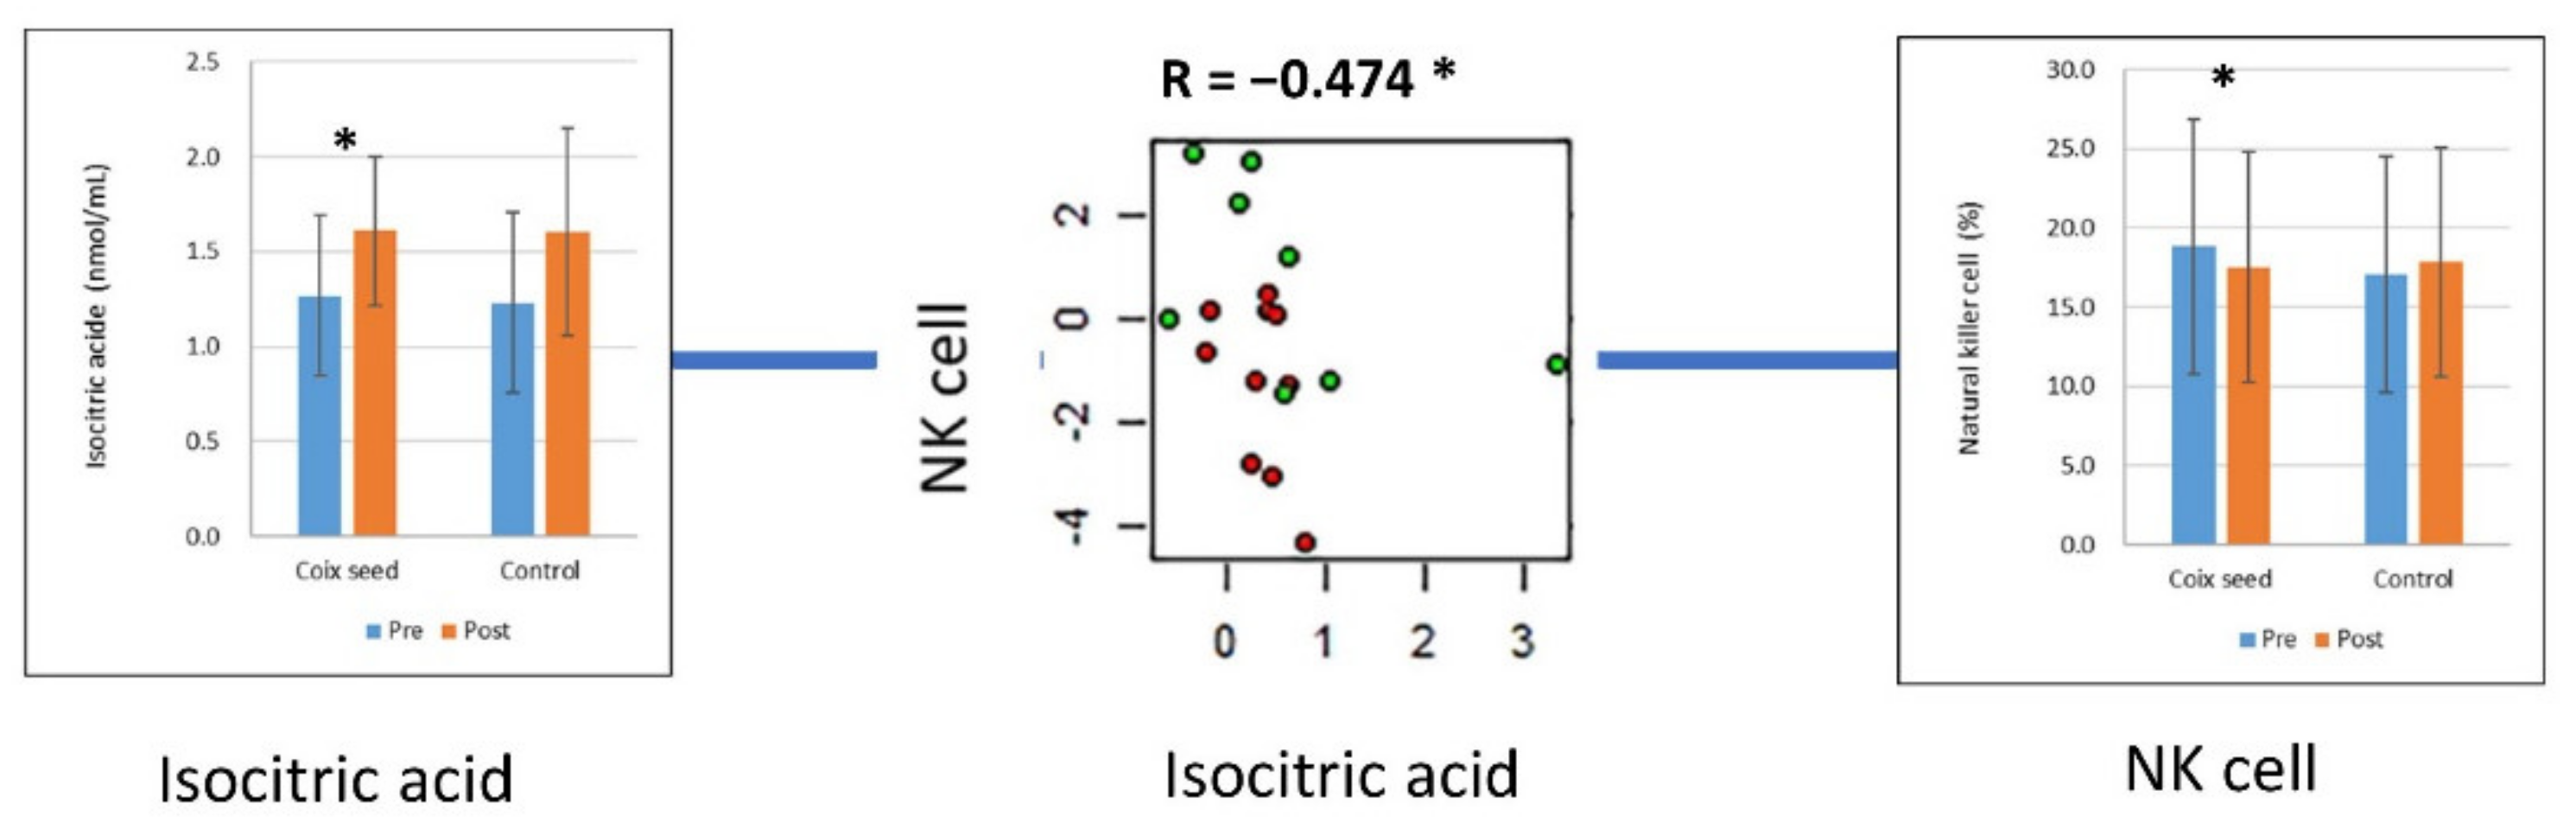
| Isocitric acid | Coix seed | 1.27 | 0.425 | 1.611 | 0.393 | 0.0251 | * |
| Control | 1.232 | 0.476 | 1.602 | 0.547 | 0.2261 | ||
| Glyoxylic acid | Coix seed | 40.741 | 17.426 | 53.421 | 16.734 | 0.0490 | * |
| Control | 34.722 | 9.372 | 53.225 | 15.079 | 0.0391 | * |
Publisher’s Note: MDPI stays neutral with regard to jurisdictional claims in published maps and institutional affiliations. |
© 2022 by the authors. Licensee MDPI, Basel, Switzerland. This article is an open access article distributed under the terms and conditions of the Creative Commons Attribution (CC BY) license (https://creativecommons.org/licenses/by/4.0/).
Share and Cite
Suzuki, Y.; Miyahara, T.; Jinnouchi, M.; Miura, Y.; Taka, H.; Kaga, N.; Ohara-Takada, A. A Comprehensive Analysis of Plasma Cytokines and Metabolites Shows an Association between Galectin-9 and Changes in Peripheral Lymphocyte Subset Percentages Following Coix Seed Consumption. Nutrients 2022, 14, 1696. https://doi.org/10.3390/nu14091696
Suzuki Y, Miyahara T, Jinnouchi M, Miura Y, Taka H, Kaga N, Ohara-Takada A. A Comprehensive Analysis of Plasma Cytokines and Metabolites Shows an Association between Galectin-9 and Changes in Peripheral Lymphocyte Subset Percentages Following Coix Seed Consumption. Nutrients. 2022; 14(9):1696. https://doi.org/10.3390/nu14091696
Chicago/Turabian StyleSuzuki, Yoshio, Taisei Miyahara, Minami Jinnouchi, Yoshiki Miura, Hikari Taka, Naoko Kaga, and Akiko Ohara-Takada. 2022. "A Comprehensive Analysis of Plasma Cytokines and Metabolites Shows an Association between Galectin-9 and Changes in Peripheral Lymphocyte Subset Percentages Following Coix Seed Consumption" Nutrients 14, no. 9: 1696. https://doi.org/10.3390/nu14091696