
Nutrition and Rheumatoid Arthritis Onset: A Prospective Analysis Using the UK Biobank


 , and
, and
Abstract
:
1. Introduction
2. Methods
2.1. Cohort Selection
2.2. Dietary Data Collection
2.3. Outcome Ascertainment
2.4. Covariates Assessment
2.5. Statistical Analysis
3. Results
4. Discussion
5. Conclusions
Supplementary Materials
Author Contributions
Funding
Institutional Review Board Statement
Informed Consent Statement
Data Availability Statement
Acknowledgments
Conflicts of Interest
References
- Aletaha, D.; Neogi, T.; Silman, A.J.; Funovits, J.; Felson, D.T.; Bingham, C.O., 3rd; Birnbaum, N.S.; Burmester, G.R.; Bykerk, V.P.; Cohen, M.D.; et al. 2010 Rheumatoid arthritis classification criteria: An American College of Rheumatology/European League Against Rheumatism collaborative initiative. Arthritis Rheum. 2010, 62, 2569–2581. [Google Scholar] [CrossRef] [PubMed]
- Smolen, J.S.; Aletaha, D.; Barton, A.; Burmester, G.R.; Emery, P.; Firestein, G.S.; Kavanaugh, A.; McInnes, I.B.; Solomon, D.H.; Strand, V.; et al. Rheumatoid arthritis. Nat. Rev. Dis. Primers 2018, 4, 18001. [Google Scholar] [CrossRef] [PubMed]
- Kaplan, M.J. Cardiovascular Complications of Rheumatoid Arthritis: Assessment, Prevention, and Treatment. Rheum. Dis. Clin. N. Am. 2010, 36, 405–426. [Google Scholar] [CrossRef] [Green Version]
- Romão, V.C.; Fonseca, J.E. Major Challenges in Rheumatology: Will We Ever Treat Smarter, Instead of Just Harder? Front. Med. 2019, 6, 144. [Google Scholar] [CrossRef] [PubMed]
- Romão, V.C.; Fonseca, J.E. Etiology and Risk Factors for Rheumatoid Arthritis: A State-of-the-Art Review. Front. Med. 2021, 8, 2383. [Google Scholar] [CrossRef] [PubMed]
- Gioia, C.; Lucchino, B.; Tarsitano, M.G.; Iannuccelli, C.; Di Franco, M. Dietary Habits and Nutrition in Rheumatoid Arthritis: Can Diet Influence Disease Development and Clinical Manifestations? Nutrients 2020, 12, 1456. [Google Scholar] [CrossRef]
- Philippou, E.; Nikiphorou, E. Are we really what we eat? Nutrition and its role in the onset of rheumatoid arthritis. Autoimmun. Rev. 2018, 17, 1074–1077. [Google Scholar] [CrossRef] [Green Version]
- Manzel, A.; Muller, D.N.; Hafler, D.A.; Erdman, S.E.; Linker, R.A.; Kleinewietfeld, M. Role of “Western Diet” in Inflammatory Autoimmune Diseases. Curr. Allergy Asthma Rep. 2014, 14, 404. [Google Scholar] [CrossRef] [Green Version]
- Hu, Y.; Costenbader, K.H.; Gao, X.; Al-Daabil, M.; Sparks, J.A.; Solomon, D.H.; Hu, F.B.; Karlson, E.W.; Lu, B. Sugar-sweetened soda consumption and risk of developing rheumatoid arthritis in women. Am. J. Clin. Nutr. 2014, 100, 959–967. [Google Scholar] [CrossRef]
- DeChristopher, L.R.; Uribarri, J.; Tucker, K.L. Intake of high-fructose corn syrup sweetened soft drinks, fruit drinks and apple juice is associated with prevalent arthritis in US adults, aged 20–30 years. Nutr. Diabetes 2016, 6, e199. [Google Scholar] [CrossRef] [Green Version]
- Jiang, X.; Sundström, B.; Alfredsson, L.; Klareskog, L.; Rantapää-Dahlqvist, S.; Bengtsson, C. High Sodium Chloride Consumption Enhances the Effects of Smoking but Does Not Interact with SGK1 Polymorphisms in the Development of ACPA-Positive Status in Patients with RA. Ann. Rheum. Dis. 2016, 75, 943–946. [Google Scholar] [CrossRef] [PubMed]
- Christ, A.; Lauterbach, M.; Latz, E. Western Diet and the Immune System: An Inflammatory Connection. Immunity 2019, 51, 794–811. [Google Scholar] [CrossRef] [PubMed]
- Chan, M.M.; Yang, X.; Wang, H.; Saaoud, F.; Sun, Y.; Fong, D. The Microbial Metabolite Trimethylamine N-Oxide Links Vascular Dysfunctions and the Autoimmune Disease Rheumatoid Arthritis. Nutrients 2019, 11, 1821. [Google Scholar] [CrossRef] [PubMed] [Green Version]
- Patterson, E.; Wall, R.; Fitzgerald, G.F.; Ross, R.P.; Stanton, C. Health Implications of High Dietary Omega-6 Polyunsaturated Fatty Acids. J. Nutr. Metab. 2012, 2012, 1–16. [Google Scholar] [CrossRef] [PubMed]
- Pattison, D.J.; Symmons, D.P.M.; Lunt, M.; Welch, A.; Luben, R.; Bingham, S.A.; Khaw, K.-T.; Day, N.E.; Silman, A.J. Dietary risk factors for the development of inflammatory polyarthritis: Evidence for a role of high level of red meat consumption. Arthritis Care Res. 2004, 50, 3804–3812. [Google Scholar] [CrossRef] [PubMed]
- Sundström, B.; Ljung, L.; Di Giuseppe, D. Consumption of Meat and Dairy Products Is Not Associated with the Risk for Rheumatoid Arthritis among Women: A Population-Based Cohort Study. Nutrients 2019, 11, 2825. [Google Scholar] [CrossRef] [PubMed] [Green Version]
- He, J.; Wang, Y.; Feng, M.; Zhang, X.; Jin, Y.-B.; Li, X.; Su, L.-C.; Liu, S.; Wang, A.-X.; Chen, X.-M.; et al. Dietary intake and risk of rheumatoid arthritis—A cross section multicenter study. Clin. Rheumatol. 2016, 35, 2901–2908. [Google Scholar] [CrossRef]
- Merlino, L.A.; Curtis, J.; Mikuls, T.R.; Cerhan, J.R.; Criswell, L.A.; Saag, K.G. Vitamin D intake is inversely associated with rheumatoid arthritis: Results from the Iowa Women’s Health Study. Arthritis Care Res. 2004, 50, 72–77. [Google Scholar] [CrossRef]
- Sand, I.K. The Role of Diet in Multiple Sclerosis: Mechanistic Connections and Current Evidence. Curr. Nutr. Rep. 2018, 7, 150–160. [Google Scholar] [CrossRef] [Green Version]
- Sparks, J.A.; O’reilly, J.; Barbhaiya, M.; Tedeschi, S.K.; Malspeis, S.; Lu, B.; Willett, W.C.; Costenbader, K.H.; Karlson, E.W. Association of fish intake and smoking with risk of rheumatoid arthritis and age of onset: A prospective cohort study. BMC Musculoskelet. Disord. 2019, 20, 2. [Google Scholar] [CrossRef]
- Lombardo, M.; Aulisa, G.; Marcon, D.; Rizzo, G.; Tarsisano, M.G.; Di Renzo, L.; Federici, M.; Caprio, M.; De Lorenzo, A. Association of Urinary and Plasma Levels of Trimethylamine N-Oxide (TMAO) with Foods. Nutrients 2021, 13, 1426. [Google Scholar] [CrossRef] [PubMed]
- Di Giuseppe, D.; Crippa, A.; Orsini, N.; Wolk, A. Fish consumption and risk of rheumatoid arthritis: A dose-response meta-analysis. Arthritis Res. Ther. 2014, 16, 1–7. [Google Scholar] [CrossRef] [PubMed] [Green Version]
- Cena, H.; Calder, P.C. Defining a Healthy Diet: Evidence for the Role of Contemporary Dietary Patterns in Health and Disease. Nutrients 2020, 12, 334. [Google Scholar] [CrossRef] [PubMed] [Green Version]
- Schönenberger, K.A.; Schüpfer, A.-C.; Gloy, V.L.; Hasler, P.; Stanga, Z.; Kaegi-Braun, N.; Reber, E. Effect of Anti-Inflammatory Diets on Pain in Rheumatoid Arthritis: A Systematic Review and Meta-Analysis. Nutrients 2021, 13, 4221. [Google Scholar] [CrossRef]
- Nguyen, Y.; Salliot, C.; Gelot, A.; Gambaretti, J.; Mariette, X.; Boutron-Ruault, M.C.; Seror, R. Mediterranean Diet and Risk of Rheumatoid Arthritis: Findings from the French E3N-EPIC Cohort Study. Arthritis Rheumatol. 2021, 73, 69–77. [Google Scholar] [CrossRef]
- Johansson, K.; Askling, J.; Alfredsson, L.; Di Giuseppe, D.; EIRA Study Group. Mediterranean diet and risk of rheumatoid arthritis: A population-based case-control study. Arthritis Res. Ther. 2018, 20, 175. [Google Scholar] [CrossRef]
- Linos, A.; Kaklamani, V.G.; Kaklamani, E.; Koumantaki, Y.; Giziaki, E.; Papazoglou, S.; Mantzoros, C.S. Dietary factors in relation to rheumatoid arthritis: A role for olive oil and cooked vegetables? Am. J. Clin. Nutr. 1999, 70, 1077–1082. [Google Scholar] [CrossRef] [Green Version]
- Hu, Y.; Sparks, J.; Malspeis, S.; Costenbader, K.H.; Hu, F.B.; Karlson, E.W.; Lu, B. Long-term dietary quality and risk of developing rheumatoid arthritis in women. Ann. Rheum. Dis. 2017, 76, 1357–1364. [Google Scholar] [CrossRef]
- Karlson, E.W.; Mandl, L.A.; Aweh, G.N.; Grodstein, F. Coffee consumption and risk of rheumatoid arthritis. Arthritis Care Res. 2003, 48, 3055–3060. [Google Scholar] [CrossRef]
- Mikuls, T.R.; Cerhan, J.R.; Criswell, L.A.; Merlino, L.; Mudano, A.S.; Burma, M.; Folsom, A.R.; Saag, K.G. Coffee, tea, and caffeine consumption and risk of rheumatoid arthritis: Results from the Iowa Women’s Health Study. Arthritis Care Res. 2002, 46, 83–91. [Google Scholar] [CrossRef]
- Asoudeh, F.; Dashti, F.; Jayedi, A.; Hemmati, A.; Fadel, A.; Mohammadi, H. Caffeine, Coffee, Tea and Risk of Rheumatoid Arthritis: Systematic Review and Dose-Response Meta-analysis of Prospective Cohort Studies. Front. Nutr. 2022, 9. [Google Scholar] [CrossRef] [PubMed]
- Lee, Y.H.; Bae, S.-C.; Song, G.G. Coffee or tea consumption and the risk of rheumatoid arthritis: A meta-analysis. Clin. Rheumatol. 2014, 33, 1575–1583. [Google Scholar] [CrossRef] [PubMed]
- Heliovaara, M.; Aho, K.; Knekt, P.; Impivaara, O.; Reunanen, A.; Aromaa, A. Coffee consumption, rheumatoid factor, and the risk of rheumatoid arthritis. Ann. Rheum. Dis. 2000, 59, 631–635. [Google Scholar] [CrossRef] [PubMed] [Green Version]
- Scott, I.C.; Tan, R.; Stahl, D.; Steer, S.; Lewis, C.M.; Cope, A.P. The protective effect of alcohol on developing rheumatoid arthritis: A systematic review and meta-analysis. Rheumatology 2013, 52, 856–867. [Google Scholar] [CrossRef] [Green Version]
- Lu, B.; Solomon, D.H.; Costenbader, K.H.; Karlson, E.W. Alcohol Consumption and Risk of Incident Rheumatoid Arthritis in Women: A Prospective Study. Arthritis Rheumatol. 2014, 66, 1998–2005. [Google Scholar] [CrossRef] [PubMed]
- Sudlow, C.; Gallacher, J.; Allen, N.; Beral, V.; Burton, P.; Danesh, J.; Downey, P.; Elliott, P.; Green, J.; Landray, M.; et al. UK Biobank: An Open Access Resource for Identifying the Causes of a Wide Range of Complex Diseases of Middle and Old Age. PLoS Med. 2015, 12, e1001779. [Google Scholar] [CrossRef] [Green Version]
- Bradbury, K.E.; Young, H.J.; Guo, W.; Key, T.J. Dietary assessment in UK Biobank: An evaluation of the performance of the touchscreen dietary questionnaire. J. Nutr. Sci. 2018, 7, e6. [Google Scholar] [CrossRef] [Green Version]
- Mair, F.S.; Foster, H.M.E.; Celis-Morales, C.A.; Nicholl, B.I.; Petermann-Rocha, F.; Pell, J.P.; Gill, J.M.R.; O’Donnell, C.A. The Effect of Socioeconomic Deprivation on the Association between an Extended Measurement of Unhealthy Lifestyle Factors and Health Outcomes: A Prospective Analysis of the UK Biobank Cohort. Lancet Public Health 2018, 3, e576–e585. [Google Scholar] [CrossRef] [Green Version]
- Zaccardelli, A.; Friedlander, H.M.; Ford, J.A.; Sparks, J.A. Potential of Lifestyle Changes for Reducing the Risk of Developing Rheumatoid Arthritis: Is an Ounce of Prevention Worth a Pound of Cure? Clin. Ther. 2019, 41, 1323–1345. [Google Scholar] [CrossRef]
- Kronzer, V.L.; Davis, J.M., III. Etiologies of Rheumatoid Arthritis: Update on Mucosal, Genetic, and Cellular Pathogenesis. Curr. Rheumatol. Rep. 2021, 21, 1926. [Google Scholar] [CrossRef]
- Pinto, A.J.; Roschel, H.; de Sá Pinto, A.L.; Lima, F.R.; Pereira, R.M.R.; Silva, C.A.; Bonfá, E.; Gualano, B. Physical inactivity and sedentary behavior: Overlooked risk factors in autoimmune rheumatic diseases? Autoimmun. Rev. 2017, 16, 667–674. [Google Scholar] [CrossRef] [PubMed]
- Yin, X.; Gibbons, H.; Rundle, M.; Frost, G.; McNulty, B.A.; Nugent, A.P.; Walton, J.; Flynn, A.; Brennan, L. The Relationship between Fish Intake and Urinary Trimethylamine-N-Oxide. Mol. Nutr. Food Res. 2019, 64, 1900799. [Google Scholar] [CrossRef] [PubMed]
- Le Daré, B.; Lagente, V.; Gicquel, T. Ethanol and its metabolites: Update on toxicity, benefits, and focus on immunomodulatory effects. Drug Metab. Rev. 2019, 51, 545–561. [Google Scholar] [CrossRef] [PubMed]
- Rajakulendran, S.; Gadsby, K.; Deighton, C. Rheumatoid Arthritis, Alcohol, Lefl Unomide and Methotrexate. Can Changes to the BSR Guidelines for Lefl Unomide and Methotrexate on Alcohol Consumption Be Justified? Musculoskelet. Care 2008, 6, 233–246. [Google Scholar] [CrossRef]
- Mandrekar, P.; Catalano, D.; White, B.; Szabo, G. Moderate Alcohol Intake in Humans Attenuates Monocyte Inflammatory Responses: Inhibition of Nuclear Regulatory Factor Kappa B and Induction of Interleukin 10. Alcohol. Clin. Exp. Res. 2006, 30, 135–139. [Google Scholar] [CrossRef]
- Mandrekar, P.; Catalano, D.; Dolganiuc, A.; Kodys, K.; Szabo, G. Inhibition of Myeloid Dendritic Cell Accessory Cell Function and Induction of T Cell Anergy by Alcohol Correlates with Decreased IL-12 Production. J. Immunol. 2004, 173, 3398–3407. [Google Scholar] [CrossRef] [Green Version]
- Turk, J.N.; Zahavi, E.R.; Gorman, A.E.; Murray, K.; Turk, M.A.; Veale, D.J. Exploring the effect of alcohol on disease activity and outcomes in rheumatoid arthritis through systematic review and meta-analysis. Sci. Rep. 2021, 11, 1–6. [Google Scholar] [CrossRef]
- Lamichhane, D.; Collins, C.; Constantinescu, F.; Walitt, B.; Pettinger, M.; Parks, C.; Howard, B.V. Coffee and Tea Consumption in Relation to Risk of Rheumatoid Arthritis in the Women’s Health Initiative Observational Cohort. J. Clin. Rheumatol. 2019, 25, 127–132. [Google Scholar] [CrossRef]
- Rambod, M.; Nazarinia, M.; Raieskarimian, F. The impact of dietary habits on the pathogenesis of rheumatoid arthritis: A case-control study. Clin. Rheumatol. 2018, 37, 2643–2648. [Google Scholar] [CrossRef]
- Stavric, B.; Klassen, R.; Watkinson, B.; Karpinski, K.; Stapley, R.; Fried, P. Variability in caffeine consumption from coffee and tea: Possible significance for epidemiological studies. Food Chem. Toxicol. 1988, 26, 111–118. [Google Scholar] [CrossRef]
- Horrigan, L.A.; Kelly, J.P.; Connor, T.J. Immunomodulatory effects of caffeine: Friend or foe? Pharmacol. Ther. 2006, 111, 877–892. [Google Scholar] [CrossRef] [PubMed]
- Hwang, S.J.; Kim, Y.-W.; Park, Y.; Lee, H.-J.; Kim, K.-W. Anti-inflammatory effects of chlorogenic acid in lipopolysaccharide-stimulated RAW 264.7 cells. Agents Actions 2013, 63, 81–90. [Google Scholar] [CrossRef] [PubMed]
- Wang, P.; Yamabe, N.; Hong, C.-J.; Bai, H.-W.; Zhu, B.T. Caffeic acid phenethyl ester, a coffee polyphenol, inhibits DNA methylation in vitro and in vivo. Eur. J. Pharmacol. 2020, 887, 173464. [Google Scholar] [CrossRef] [PubMed]
- Zhu, H.; Liang, Q.-H.; Xiong, X.-G.; Chen, J.; Wu, D.; Wang, Y.; Yang, B.; Zhang, Y.; Huang, X.; Zhang, Y. Anti-Inflammatory Effects of the Bioactive Compound Ferulic Acid Contained in Oldenlandia diffusaon Collagen-Induced Arthritis in Rats. Evid. -Based Complement. Altern. Med. 2014, 2014, 1–10. [Google Scholar] [CrossRef] [Green Version]
- Marotte, H.; Ruth, J.H.; Campbell, P.L.; Koch, A.E.; Ahmed, S. Green tea extract inhibits chemokine production, but up-regulates chemokine receptor expression, in rheumatoid arthritis synovial fibroblasts and rat adjuvant-induced arthritis. Rheumatology 2009, 49, 467–479. [Google Scholar] [CrossRef] [Green Version]
- Fechtner, S.; Singh, A.; Chourasia, M.; Ahmed, S. Molecular insights into the differences in anti-inflammatory activities of green tea catechins on IL-1β signaling in rheumatoid arthritis synovial fibroblasts. Toxicol. Appl. Pharmacol. 2017, 329, 112–120. [Google Scholar] [CrossRef]
- O’Connor, L.; Imamura, F.; Brage, S.; Griffin, S.J.; Wareham, N.J.; Forouhi, N.G. Intakes and sources of dietary sugars and their association with metabolic and inflammatory markers. Clin. Nutr. 2018, 37, 1313–1322. [Google Scholar] [CrossRef] [Green Version]
- Arpaia, N.; Campbell, C.; Fan, X.; Dikiy, S.; Van Der Veeken, J.; DeRoos, P.; Liu, H.; Cross, J.R.; Pfeffer, K.; Coffer, P.J.; et al. Metabolites produced by commensal bacteria promote peripheral regulatory T-cell generation. Nature 2013, 504, 451–455. [Google Scholar] [CrossRef]
- North, C.J.; Venter, C.S.; Jerling, J.C. The effects of dietary fibre on C-reactive protein, an inflammation marker predicting cardiovascular disease. Eur. J. Clin. Nutr. 2009, 63, 921–933. [Google Scholar] [CrossRef] [Green Version]
- Cium, L.; Milaciu, M.V.; Runcan, O.; Vesa, C.; Negrean, V.; Pern, M.; Donca, V.I. Molecules the Effects of Flavonoids in Cardiovascular Diseases. Molecules 2020, 25, 4320. [Google Scholar]
- Yuan, G.-F.; Sun, B.; Yuan, J.; Wang, Q.-M. Effects of different cooking methods on health-promoting compounds of broccoli. J. Zhejiang Univ. Sci. B 2009, 10, 580–588. [Google Scholar] [CrossRef] [PubMed] [Green Version]
- Salliot, C.; Nguyen, Y.; Boutron-Ruault, M.-C.; Seror, R. Environment and Lifestyle: Their Influence on the Risk of RA. J. Clin. Med. 2020, 9, 3109. [Google Scholar] [CrossRef] [PubMed]
- Curtis, J.R.; Xie, F.; Zhou, H.; Salchert, D.; Yun, H. Use of ICD-10 diagnosis codes to identify seropositive and seronegative rheumatoid arthritis when lab results are not available. Arthritis Res. Ther. 2020, 22, 1–9. [Google Scholar] [CrossRef] [PubMed]


| Rheumatoid Arthritis (RA) | ||||
|---|---|---|---|---|
| Overall | No | Yes | ||
| N = 479,494 | N = 476,675 | N = 2819 | HR (95%CI) | |
| N (%) | N (%) | N (%) | ||
| Sex | ||||
| Females | 259,709 (54.16) | 257,827 (54.09) | 1882 (66.76) | 1 |
| Males | 219,785 (45.84) | 218,848 (45.91) | 937 (33.24) | 0.587 (0.543–0.635) |
| Age | ||||
| <50 | 113,569 (23.69) | 113,241 (23.76) | 328 (11.64) | 1 |
| [50–60) | 159,718 (33.31) | 158,896 (33.33) | 822 (29.16) | 1.783 (1.569–2.026) |
| [60–70) | 203,923 (42.53) | 202,276 (42.43) | 1647 (58.42) | 2.837 (2.520–3.194) |
| ≥70 | 2284 (0.48) | 2262 (0.47) | 22 (0.78) | 3.412 (2.216–5.254) |
| Area | ||||
| England | 425,147 (88.67) | 422,517 (88.64) | 2630 (93.30) | 1 |
| Scotland | 34,470 (7.19) | 34,356 (7.21) | 114 (4.04) | 0.426 (0.353–0.515) |
| Wales | 19,877 (4.15) | 19,802 (4.15) | 75 (2.66) | 0.518 (0.412–0.653) |
| Townsend deprivation index | ||||
| Q1 | 119,829 (25.03) | 119,246 (25.05) | 583 (20.07) | 0.623 (0.561–0.691) |
| Q2 | 119,649 (24.98) | 119,019 (25.00) | 630 (22.37) | 0.680 (0.615–0.753) |
| Q3 | 119,700 (24.99) | 119,009 (25.00) | 691 (24.54) | 0.754 (0.683–0.883) |
| Q4 | 119,721 (25.00) | 118,809 (24.95) | 912 (32.39) | 1 |
| Smoking | ||||
| Current smokers | 37,322 (7.82) | 36,993 (7.79) | 329 (11.73) | 1.779 (1.569–2.016) |
| Current occasional smokers | 13,080 (2.74) | 12,990 (2.74) | 90 (3.21) | 1.404 (1.131–1.743) |
| Past smokers | 110,361 (23.12) | 109,534 (23.07) | 827 (29.49) | 1.530 (1.393–1.679) |
| Past occasional smokers | 124,811 (26.14) | 124,194 (26.16) | 617 (22.00) | 1.012 (0.915–1.121) |
| Never smokers | 191,849 (40.18) | 191,022 (40.24) | 827 (29.49) | 1 |
| BMI categories (kg/m2) | ||||
| Underweight (<18.5) | 2417 (0.51) | 2406 (0.51) | 11 (0.39) | 1.110 (0.612–2.014) |
| Normal weight (18.5–24.9) | 155,221 (32.54) | 154,584 (32.60) | 637 (22.68) | 1 |
| Overweight (25.0–29.9) | 203,259 (42.61) | 202,140 (42.63) | 1119 (40.15) | 1.340 (1.216–1.477) |
| Obese (≥30.0) | 116,099 (24.34) | 115,079 (24.27) | 1020 (36.60) | 2.143 (1.941–2.366) |
| Moderate/vigorous physical activity (days/week) | ||||
| 0 | 58,834 (12.54) | 58,299 (12.50) | 535 (19.87) | 1 |
| 1–3 | 174,747 (37.25) | 173,947 (37.29) | 800 (29.72) | 0.507 (0.455–0.566) |
| 4–6 | 147,347 (31.41) | 146,568 (31.42) | 779 (28.94) | 0.588 (0.527–0.656) |
| 7 | 88,202 (18.80) | 87,624 (18.79) | 578 (21.47) | 0.732 (0.651–0.823) |
| Alcohol consumption (drinks/time) | ||||
| ≤3 times a month | 145,185 (30.28) | 144,017 (30.21) | 1168 (41.43) | 1 |
| 1–4 times week | 235,440 (49.10) | 234,281 (49.15) | 1159 (41.11) | 0.606 (0.558–0.657) |
| Daily or almost daily | 98,289 (20.50) | 97,804 (20.52) | 485 (17.20) | 0.609 (0.548–0.677) |
| Diabetes | ||||
| No | 471,755 (98.39) | 469,020 (98.39) | 2735 (97.02) | 1 |
| Yes | 7739 (1.61) | 7655 (1.61) | 84 (2.98) | 1.91 (1.534–2.368) |
| Hypertension | ||||
| No | 354,937 (74.02) | 353,156 (74.09) | 1781 (63.18) | 1 |
| Yes | 124,557 (25.98) | 123,519 (25.91) | 1038 (36.82) | 1.663 (1.540–1.795) |
| Hypercholesterolemia | ||||
| No | 456,036 (95.11) | 453,382 (95.11) | 2654 (94.15) | 1 |
| Yes | 23,458 (4.89) | 23,293 (4.89) | 165 (5.85) | 1.227 (1.048–1.436) |
| Other autoimmune diseases | ||||
| No | 473,960 (98.85) | 471,210 (98.85) | 2750 (97.55) | 1 |
| Yes | 5534 (1.15) | 5465 (1.15) | 69 (2.45) | 2.140 (1.686–2.717) |
| Consumption | |||||
|---|---|---|---|---|---|
| FRUIT and VEGETABLES | |||||
| Cooked vegetables (tbs/day) | ≤1 | 2 | 3 | ≥4 | trend p-value |
| N events/non events | 463/86,493 | 817/156,746 | 797/128,209 | 693/98,931 | |
| HR (95%CI) | 1 | 0.979 (0.874–1.097) | 1.175 (1.048–1.318) | 1.330 (1.182–1.496) | |
| aHR (95%CI) | 1 | 0.922 (0.819–1.038) | 1.018 (0.903–1.148) | 1.130 (0.999–1.278) | 0.0037 |
| Salad/vegetables (tbs/day) | ≤1 | 2 | 3 | ≥4 | |
| N events/non events | 451/68,007 | 710/141,580 | 629/114,133 | 976/146,425 | |
| HR (95%CI) | 1 | 0.758 (0.674–0.853) | 0.836 (0.741–0.944) | 1.016 (0.908–1.135) | |
| aHR (95%CI) | 1 | 0.810 (0.716–0.916) | 0.856 (0.754–0.971) | 0.961 (0.854–1.082) | 0.8797 |
| Fresh fruit (serving/day) | ≤1 | 2 | ≥3 | ||
| N events/non events | 963/169,282 | 776/1342,56 | 1062/170,928 | ||
| HR (95%CI) | 1 | 1.013 (0.922–1.114) | 1.084 (0.993–1.183) | ||
| aHR (95%CI) | 1 | 0.941 (0.853–1.038) | 0.918 (0.838–1.007) | 0.0729 | |
| FISH AND MEAT | |||||
| Oily fish (times/week) | 0 | <1 | 1 | ≥2 | |
| N events/non events | 374/51,386 | 856/158,216 | 1011/179,705 | 552/84,390 | |
| HR (95%CI) | 1 | 0.748 (0.662–0.844) | 0.778 (0.691–0.876) | 0.905 (0.793–1.031) | |
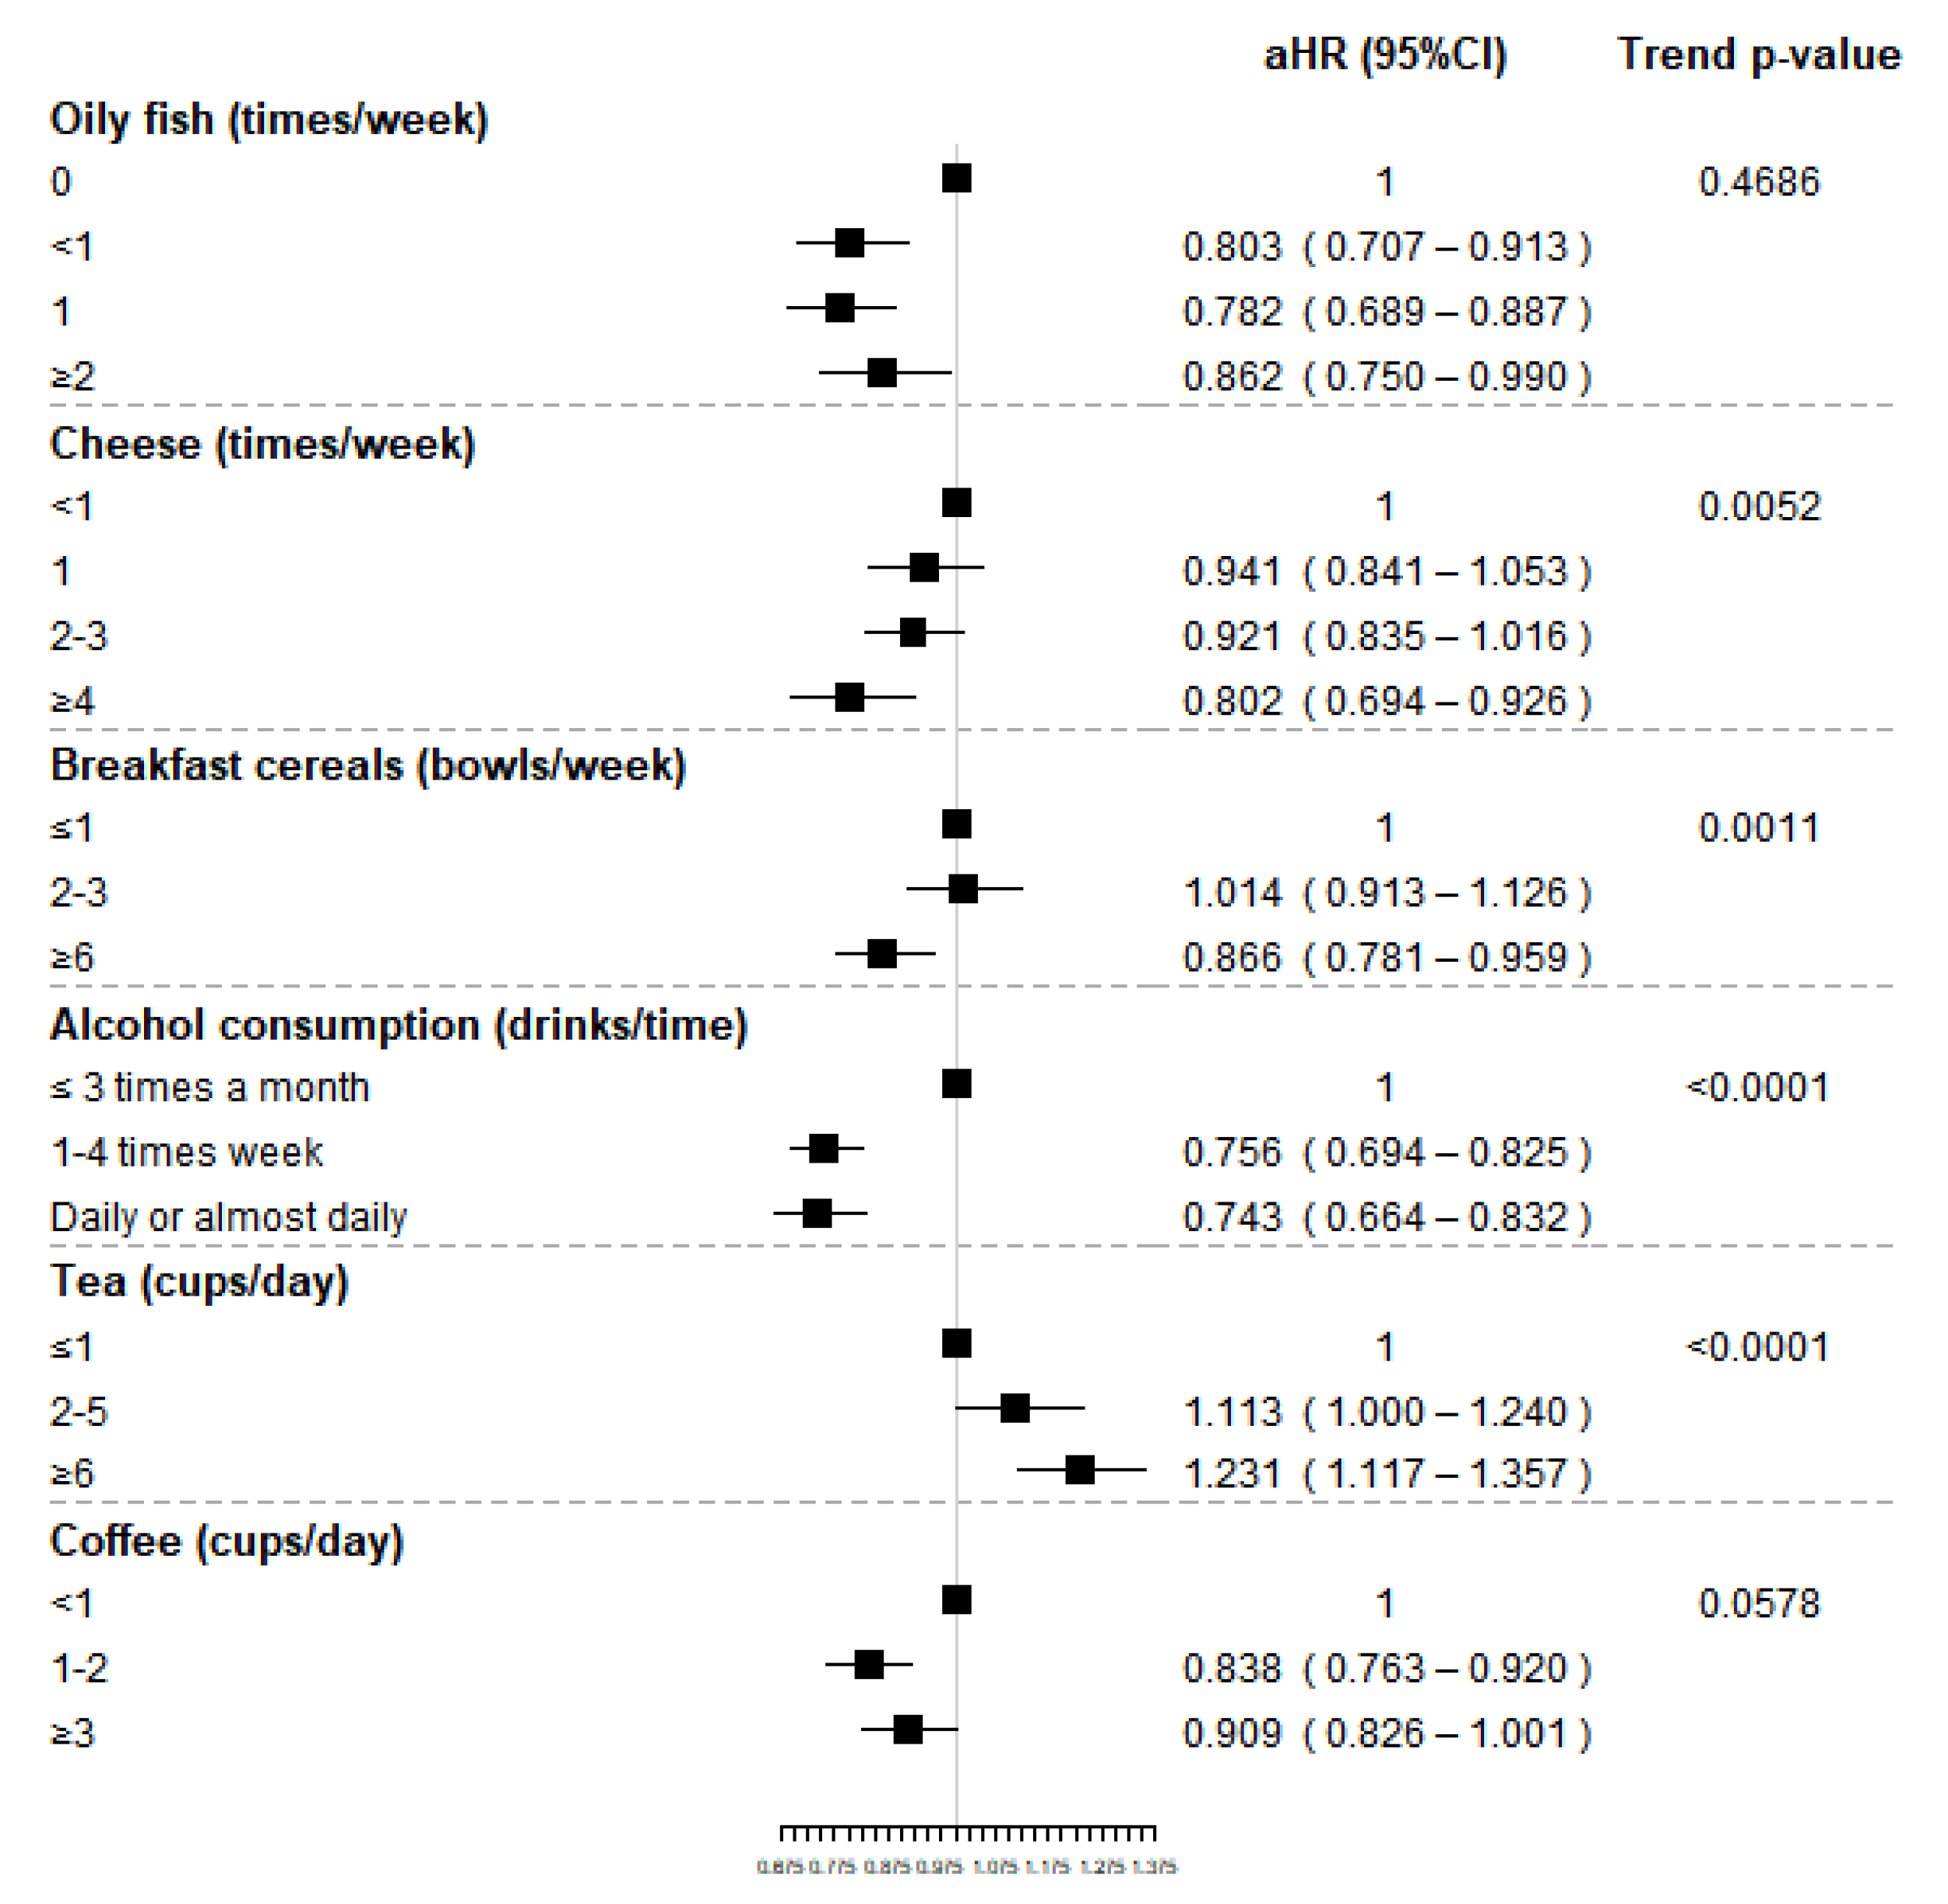
| aHR (95%CI) | 1 | 0.803 (0.707–0.913) | 0.782 (0.689–0.887) | 0.862 (0.750–0.990) | 0.4686 |
| Other fish (times/week) | <1 | 1 | ≥2 | ||
| N events/non events | 937/160,162 | 1391/236,703 | 474/77,179 | ||
| HR (95%CI) | 1 | 1.001 (0.922–1.088) | 1.046 (0.937–1.168) | ||
| aHR (95%CI) | 1 | 1.004 (0.921–1.095) | 1.032 (0.921–1.157) | 0.5844 | |
| Processed meat (times/week) | ≤1 | 2–4 | ≥5 | ||
| N events/non events | 1155/187,524 | 816/139,233 | 841/148,692 | ||
| HR (95%CI) | 1 | 0.950 (0.869–1.039) | 0.921 (0.843–1.007) | ||
| aHR (95%CI) | 1 | 0.998 (0.908–1.096) | 1.054 (0.958–1.159) | 0.3068 | |
| Chicken, turkey or other poultry (times/week) | <1 | 1 | ≥2 | trend p-value | |
| N events/non events | 121/23,761 | 324/51,162 | 2369/400,635 | ||
| HR (95%CI) | 1 | 1.228 (0.997–1.514) | 1.150 (0.958–1.381) | ||
| aHR (95%CI) | 1 | 1.147 (0.922–1.429) | 1.143 (0.943–1.386) | 0.2980 | |
| Beef (times/week) | 0 | <1 | 1 | ≥2 | |
| N events/non events | 327/51,145 | 1245/216,939 | 911/151,458 | 323/54,888 | |
| HR (95%CI) | 1 | 0.894 (0.791–1.010) | 0.922 (0.813–1.046) | 0.884 (0.758–1.031) | |
| aHR (95%CI) | 1 | 0.951 (0.836–1.082) | 0.999 (0.873–1.144) | 1.024 (0.871–1.205) | 0.3557 |
| Lamb/mutton (times/week) | 0 | <1 | ≥1 | ||
| N events/non events | 523/82,872 | 1480/269,629 | 786/120,816 | ||
| HR (95%CI) | 1 | 0.878 (0.794–0.970) | 1.038 (0.930–1.160) | ||
| aHR (95%CI) | 1 | 0.908 (0.818–1.008) | 0.992 (0.883–1.115) | 0.8123 | |
| Pork (times/week) | 0 | <1 | ≥1 | ||
| N events/non events | 506/80,295 | 1483/270,575 | 803/122,645 | ||
| HR (95%CI) | 1 | 0.873 (0.789–0.965) | 1.050 (0.940–1.174) | ||
| aHR (95%CI) | 1 | 0.937 (0.842–1.042) | 1.038 (0.923–1.168) | 0.3083 | |
| OTHER FOOD GROUPS | |||||
| Cheese (times/week) | <1 | 1 | 2–4 | ≥4 | |
| N events/non events | 696/95,256 | 640/101,778 | 1188/215,115 | 287/62,993 | |
| HR (95%CI) | 1 | 0.859 (0.771–0.956) | 0.756 (0.689–0.831) | 0.628 (0.547–0.720) | |
| aHR (95%CI) | 1 | 0.941 (0.841–1.053) | 0.921 (0.835–1.016) | 0.802 (0.694–0.926) | 0.0052 |
| Bread (slices/week) | ≤1 | 2 | 3 | ≥4 | |
| N events/non events | 79/14,845 | 518/80,479 | 913/150,723 | 1253/224,858 | |
| HR (95%CI) | 1 | 1.204 (0.950–1.526) | 1.128 (0.897–1.420) | 1.035 (0.824–1.299) | |
| aHR (95%CI) | 1 | 0.998 (0.897–1.110) | 0.927 (0.825–1.042) | 0.966 (0.857–1.089) | 0.3256 |
| Breakfast cereals (bowls/week) | ≤1 | 2–4 | ≥6 | ||
| N events/non events | 625/100,393 | 969/158,200 | 1214/216,138 | ||
| HR (95%CI) | 1 | 0.982 (0.888–1.086) | 0.898 (0.815–0.989) | ||
| aHR (95%CI) | 1 | 1.014 (0.913–1.126) | 0.866 (0.781–0.959) | 0.0011 | |
| Consumption | |||||
| BEVERAGES | |||||
| Alcohol consumption (drinks/time) | ≤3 times a month | 1–4 times week | Daily or almost daily | trend p-value | |
| N events/non events | 1168/144,017 | 1159/234,281 | 485/97,804 | ||
| HR (95%CI) | 1 | 0.606 (0.558–0.657) | 0.609 (0.548–0.677) | ||
| aHR (95%CI) | 1 | 0.756 (0.694–0.825) | 0.743 (0.664–0.832) | <0.0001 | |
| Tea (cups/day) | ≤1 | 2–4 | ≥4 | ||
| N events/non events | 650/124,195 | 785/140,221 | 1375/211,059 | ||
| HR (95%CI) | 1 | 1.074 (0.968–1.191) | 1.249 (1.137–1.371) | ||
| aHR (95%CI) | 1 | 1.113 (1.000–1.240) | 1.231 (1.117–1.357) | <0.0001 | |
| Coffee (cups/day) | <1 | 1–2 | ≥3 | ||
| N events/non events | 923/138,300 | 1004/185,400 | 877/151,727 | ||
| HR (95%CI) | 1 | 0.816 (0.746–0.892) | 0.865 (0.788–0.948) | ||
| aHR (95%CI) | 1 | 0.838 (0.763–0.920) | 0.909 (0.826–1.001) | 0.0578 | |
| Decaffeinated coffee (cups/day) | <1 | 1–2 | ≥3 | ||
| N events/non events | 45/6534 | 230/35,399 | 192/29,021 | ||
| HR (95%CI) | 1 | 0.954 (0.687–1.301) | 0.960 (0.694–1.328) | ||
| aHR (95%CI) | 1 | 0.962 (0.687–1.349) | 0.957 (0.679–1.349) | 0.8375 | |
| Ground coffee (cups/day) | <1 | 1–2 | ≥3 | ||
| N events/non events | 43/9416 | 205/49,061 | 95/26,479 | ||
| HR (95%CI) | 1 | 0.921 (0.663–1.280) | 0.786 (0.548–1.127) | ||
| aHR (95%CI) | 1 | 0.904 (0.647–1.262) | 0.792 (0.549–1.143) | 0.1770 | |
| Instant coffee (cups/day) | <1 | 1–2 | ≥3 | ||
| N events/non events | 104/16,765 | 534/96,518 | 566/94,133 | ||
| HR (95%CI) | 1 | 0.894 (0.724–1.103) | 0.965 (0.783–1.190) | ||
| aHR (95%CI) | 1 | 0.870 (0.701–1.080) | 1.000 (0.807–1.239) | 0.2082 | |
| Other coffee (cups/day) | <1 | 1–2 | ≥3 | ||
| N events/non events | 11/1068 | 35/4006 | 20/1656 | ||
| HR (95%CI) | 1 | 0.857 (0.435–1.687) | 1.169 (0.560–2.440) | ||
| aHR (95%CI) | 1 | 0.720 (0.361–1.437) | 0.853 (0.388–1.875) | 0.7910 | |
| Incident RA Cases | Prevalent RA Cases | Disease Free Subjects | pOR (95%CI) | |
|---|---|---|---|---|
| N = 2819 | N = 6604 | N = 476,675 | Prevalent vs. Incident RA Cases | |
| Oily fish (times/week) | ||||
| 0 | 374 (13.39) | 844 (12.90) | 51,386 (10.85) | 1 |
| 1 | 856 (30.65) | 2079 (31.78) | 158,216 (33.40) | 1.040 (0.809–1.337) |
| 2 | 1011 (36.20) | 2367 (36.19) | 179,705 (37.94) | 0.874 (0.681–1.122) |
| ≥3 | 552 (19.76) | 1251 (19.13) | 84,390 (17.81) | 0.965 (0.734–1.270) |
| Missing | 26 | 63 | 2978 | |
| Cheese (times/week) | ||||
| ≤1 | 696 (7.76) | 1525 (24.16) | 95,256 (20.05) | 1 |
| 2 | 640 (22.77) | 1496 (23.70) | 101,778 (21.42) | 1.005 (0.800–1.262) |
| 3 | 1188 (42.26) | 2665 (42.23) | 215,115 (45.27) | 0.944 (0.772–1.153) |
| ≥4 | 287 (10.21) | 625 (9.90) | 62,993 (13.26) | 0.796 (0.583–1.088) |
| Missing | 8 | 293 | 1533 | |
| Breakfast cereals (bowls/week) | ||||
| ≤1 | 625 (22.26) | 1379 (21.02) | 100,393 (21.15) | 1 |
| 2–5 | 969 (34.51) | 2090 (31.86) | 158,200 (33.32) | 0.939 (0.756–1.164) |
| ≥6 | 1214 (43.23) | 3090 (47.11) | 216,138 (45.53) | 1.070 (0.873–1.311) |
| Missing | 11 | 45 | 1944 | |
| Tea (cups/day) | ||||
| ≤1 | 650 (23.13) | 1479 (23.23) | 124,195 (26.12) | 1 |
| 2–3 | 785 (27.94) | 1777 (27.91) | 140,221 (29.49) | 0.887 (0.712–1.105) |
| ≥4 | 1375 (48.93) | 3110 (48.85) | 211,059 (44.39) | 0.917 (0.754–1.114) |
| Missing | 9 | 238 | 1200 |
Publisher’s Note: MDPI stays neutral with regard to jurisdictional claims in published maps and institutional affiliations. |
© 2022 by the authors. Licensee MDPI, Basel, Switzerland. This article is an open access article distributed under the terms and conditions of the Creative Commons Attribution (CC BY) license (https://creativecommons.org/licenses/by/4.0/).
Share and Cite
Mazzucca, C.B.; Scotti, L.; Cappellano, G.; Barone-Adesi, F.; Chiocchetti, A. Nutrition and Rheumatoid Arthritis Onset: A Prospective Analysis Using the UK Biobank. Nutrients 2022, 14, 1554. https://doi.org/10.3390/nu14081554
Mazzucca CB, Scotti L, Cappellano G, Barone-Adesi F, Chiocchetti A. Nutrition and Rheumatoid Arthritis Onset: A Prospective Analysis Using the UK Biobank. Nutrients. 2022; 14(8):1554. https://doi.org/10.3390/nu14081554
Chicago/Turabian StyleMazzucca, Camilla Barbero, Lorenza Scotti, Giuseppe Cappellano, Francesco Barone-Adesi, and Annalisa Chiocchetti. 2022. "Nutrition and Rheumatoid Arthritis Onset: A Prospective Analysis Using the UK Biobank" Nutrients 14, no. 8: 1554. https://doi.org/10.3390/nu14081554