
Mediterranean Dietary Treatment in Hyperlipidemic Children: Should It Be an Option?

 ,
,
Abstract
:1. Introduction
2. Methods
2.1. Study Design
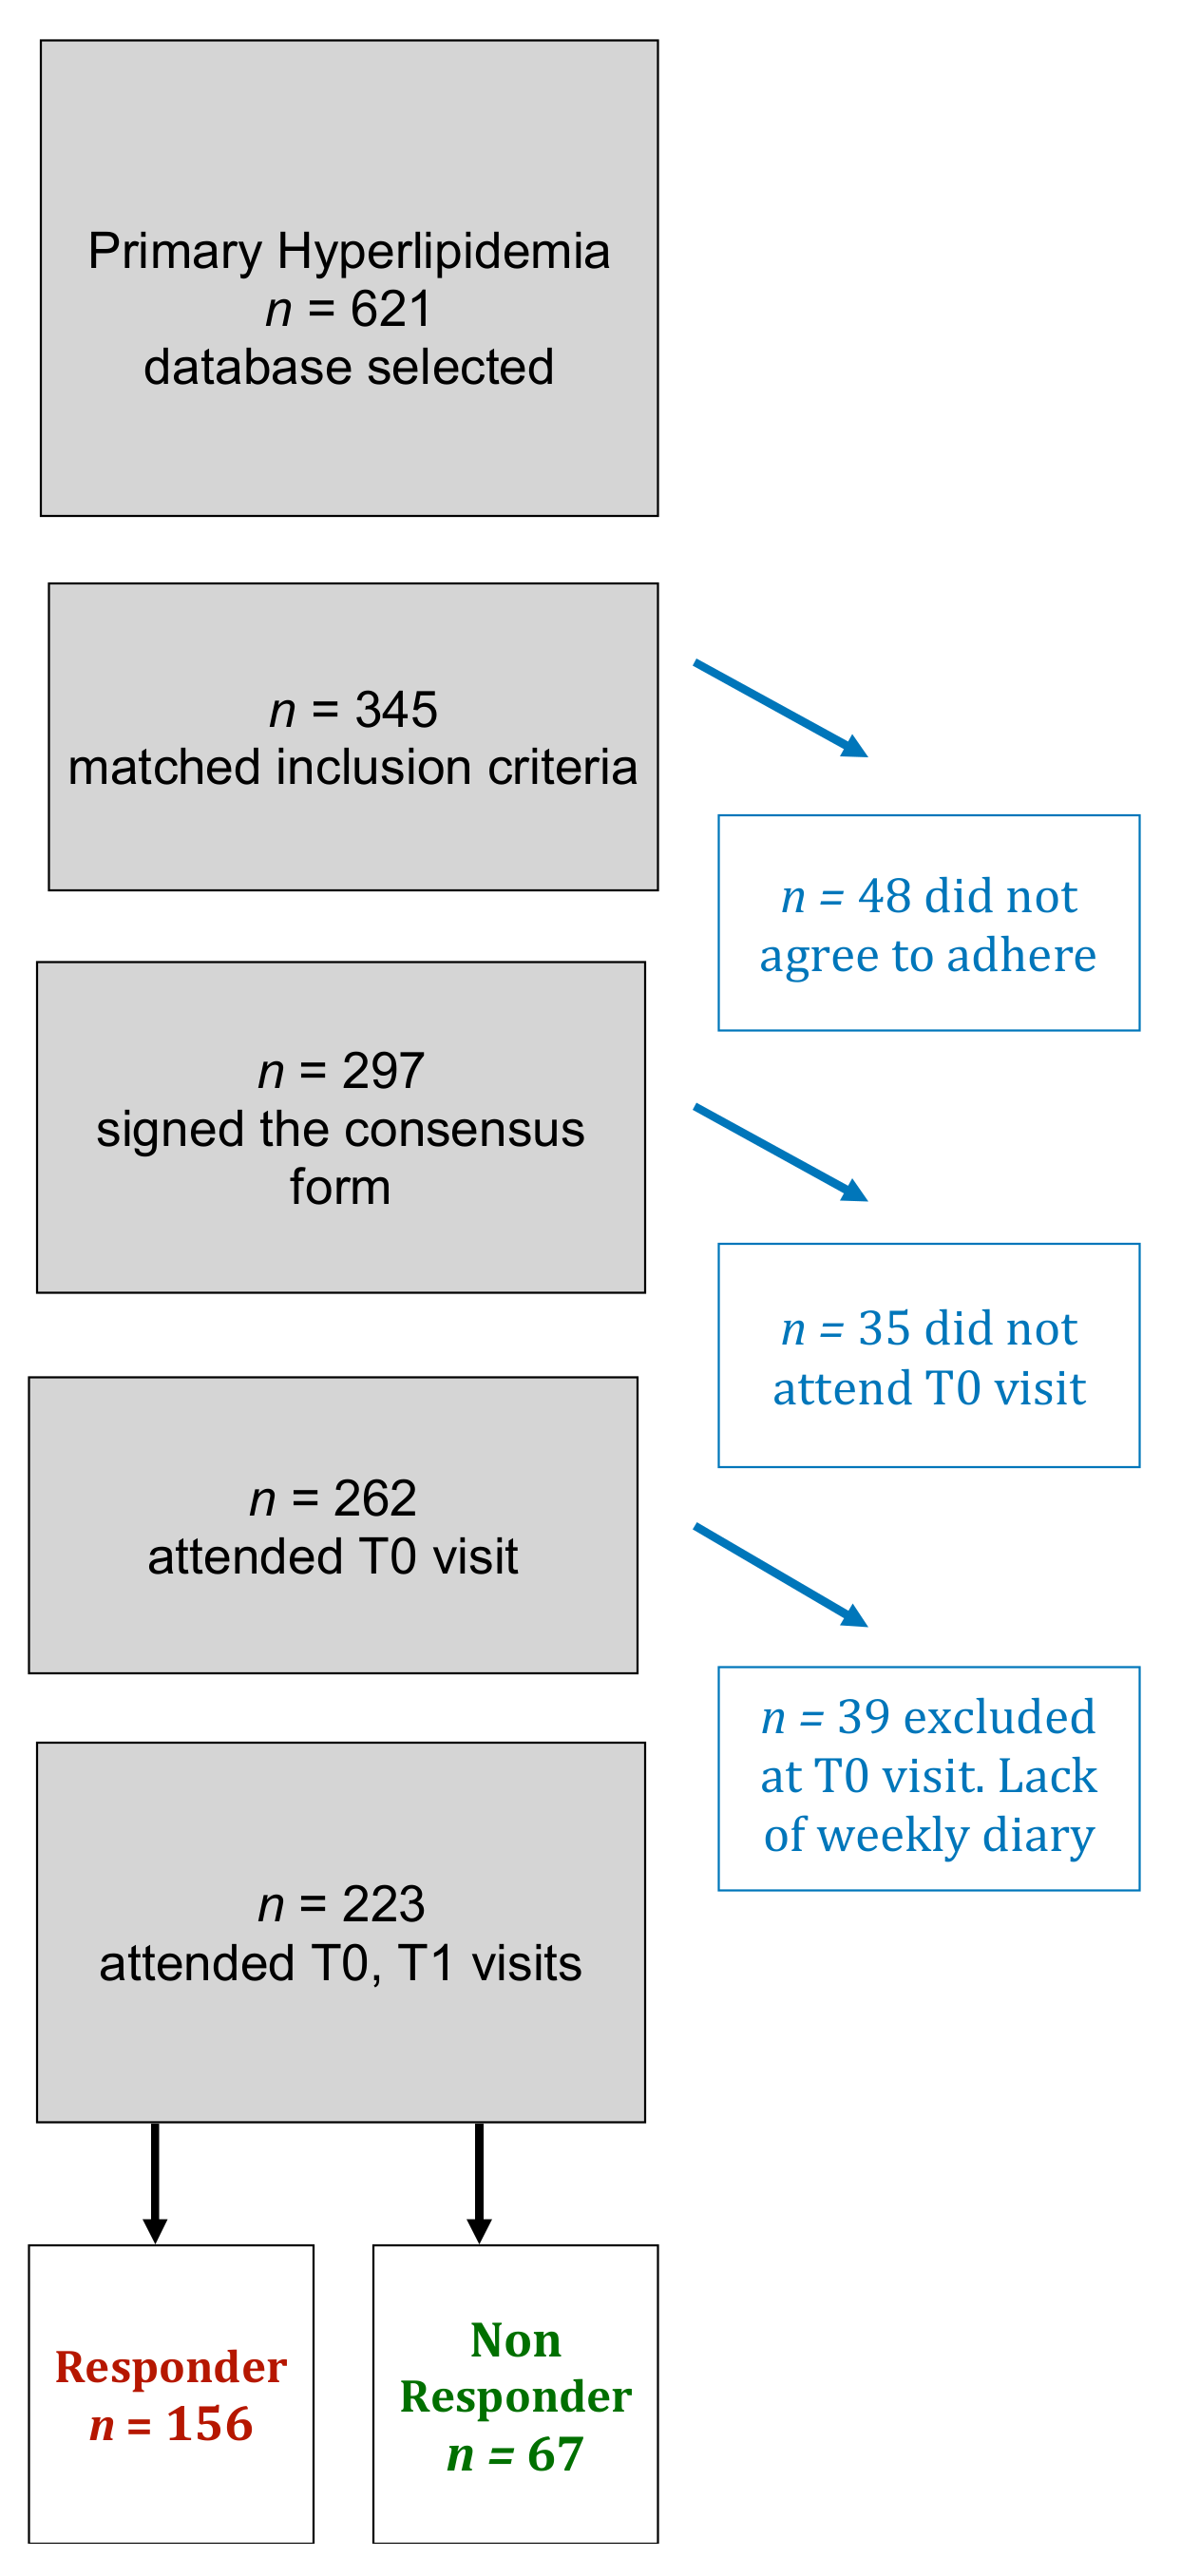
2.2. Participants
2.3. Diet
2.4. Statistical Analysis
3. Results
4. Discussion
5. Conclusions
Author Contributions
Funding
Institutional Review Board Statement
Informed Consent Statement
Data Availability Statement
Conflicts of Interest
References
- Ezzati, M.; Riboli, E.N. Behavioral and dietary risk factors for noncommunicable diseases. Engl. J. Med. 2013, 369, 954–964. [Google Scholar] [CrossRef] [Green Version]
- Daniels, S.R. Diet and primordial prevention of cardiovascular disease in children and adolescents. Circulation 2007, 116, 973–974. [Google Scholar] [CrossRef] [PubMed] [Green Version]
- Obarzanek, E.; Kimm, S.Y.; Barton, B.A.; Van Horn, L.L.; Kwiterovich, P.O., Jr.; Simons-Morton, D.G.; Hunsberger, S.A.; Lasser, N.L.; Robson, A.M.; Franklin, F.A., Jr.; et al. Long-term safety and efficacy of a cholesterol-lowering diet in children with elevated low-density lipoprotein cholesterol: Seven-year results of the dietary intervention study in children (DISC). Pediatrics 2001, 107, 256–264. [Google Scholar] [CrossRef]
- Torvik, K.; Narverud, I.; Ottestad, I.; Svilaas, A.; Gran, J.M.; Retterstøl, K.; Ellingvåg, A.; Strøm, E.; Ose, L.; Veierød, M.B.; et al. Dietary counseling is associated with an improved lipid profile in children with familial hypercholesterolemia. Atherosclerosis 2016, 252, 21–27. [Google Scholar] [CrossRef] [Green Version]
- Astrup, A.; Magkos, F.; Bier, D.M.; Brenna, J.T.; de Oliveira Otto, M.C.; Hill, J.O. Saturated fats and health: A reassessment and proposal for food-based recommendations. J. Am. Coll. Cardiol. 2020, 76, 844–857. [Google Scholar] [CrossRef]
- Hooper, L.; Martin, N.; Abdelhamid, A.; Smith, G.D. Reduction in saturated fat intake for cardiovascular disease. Cochrane Database Syst. Rev. 2015, 6, CD011737. [Google Scholar] [CrossRef]
- Griffin, B.A.; Mensink, R.P.; Lovegrove, J.A. Does variation in serum LDL-cholesterol response to dietary fatty acids help explain the controversy over fat quality and cardiovascular disease risk? Atherosclerosis 2021, 328, 108–113. [Google Scholar] [CrossRef]
- Gustafsson, I.B.; Boberg, J.; Karlstrom, B.; Lithell, H.; Vessby, B. Similar serum lipoprotein reductions by lipid-lowering diets with different polyunsaturated: Saturated fat values. Br. J. Nutr. 1983, 50, 531–537. [Google Scholar] [CrossRef] [Green Version]
- Helk, O.; Widhalm, K. Effects of a low-fat dietary regimen enriched with soy in children affected with heterozygous familial hypercholesterolemia. Clin. Nutr. ESPEN 2020, 36, 150–156. [Google Scholar] [CrossRef]
- Barkas, F.; Nomikos, T.; Liberopoulos, E.; Panagiotakos, D. Diet and cardiovascular disease risk among individuals with familial hypercholesterolemia: Systematic review and meta-analysis. Nutrients 2020, 12, 2436. [Google Scholar] [CrossRef]
- Rodríguez-Borjabad, C.; Narveud, I.; Christensen, J.J.; Ulven, S.M.; Malo, A.I.; Ibarretxe, D.; Girona, J.; Torvik, K.; Bogsrud, M.P.; Retterstøl, K.; et al. Dietary intake and lipid levels in Norwegian and Spanish children with familial hypercholesterolemia. Nutr. Metab. Cardiovasc. Dis. 2021, 31, 1299–1307. [Google Scholar] [CrossRef] [PubMed]
- Wiegman, A.; Gidding, S.S.; Watts, G.F.; Chapman, M.J.; Ginsberg, H.N.; Cuchel, M.; Ose, L.; Averna, M.; Boileau, C.; Borén, J.; et al. Familial hypercholesterolæmia in children and adolescents: Gaining decades of life by optimizing detection and treatment. Eur. Heart J. 2015, 36, 2425–2437. [Google Scholar] [CrossRef] [PubMed] [Green Version]
- McNeal, C.J.; Underland, L.; Wilson, D.P.; Blackett, P.R. Pediatric lipid screening. Clin. Lipidol. 2013, 8, 425–436. [Google Scholar]
- Expert Panel on Integrated Guidelines for Cardiovascular Health and Risk Reduction in Children and Adolescents, National Heart, Lung, and Blood Institute. Expert panel on integrated guidelines for cardiovascular health and risk reduction in children and adolescents: Summary report. Pediatrics 2011, 128 (Suppl. 5), S213–S256. [Google Scholar] [CrossRef] [Green Version]
- Friedewald, W.T.; Levy, R.I.; Fredrickson, D.S. Estimation of the concentration of low-density lipoprotein cholesterol in plasma, without use of the preparative ultracentrifuge. Clin. Chem. 1972, 18, 499–502. [Google Scholar] [PubMed]
- Nordestgaard, B.G.; Langlois, M.R.; Langsted, A.; Chapman, M.J.; Aakre, K.M.; Baum, H.; Boren, J.; Bruckert, E.; Catapano, A.; Cobbaert, C. Quantifying atherogenic lipoproteins for lipid-lowering strategies: Consensus-based recommendations from EAS and EFLM. Atherosclerosis 2020, 294, 46–61. [Google Scholar] [CrossRef] [Green Version]
- Il Dietometro Accu-Chek. Available online: http://www.gdm1.org/eventi/dietometro-Accu-Chek.pdf (accessed on 1 December 2021).
- Marletta, L.; Carnovale, E. Tabelle di Composizione degli Alimenti, Aggiornamento 2000, 2nd ed.; EDRA: Milan, Italy, 2001. [Google Scholar]
- Banca Dati di Composizione degli Alimenti per Studi Epidemiologici in Italia (BDA). Available online: http://www.bda-ieo.it/ (accessed on 1 December 2021).
- Giannini, C.; Diesse, L.; D’Adamo, E.; Chiavaroli, V.; de Giorgis, T.; Di Iorio, C.; Chiarelli, F.; Mohn, A. Influence of the Mediterranean diet on carotid intima-media thickness in hypercholesterolaemic children: A 12-month intervention study. Nutr. Metab. Cardiovasc. Dis. 2014, 24, 75–82. [Google Scholar] [CrossRef]
- Lampropoulou, M.; Chaini, M.; Rigopoulos, N.; Evangeliou, A.; Papadopoulou-Legbelou, K.; Koutelidakis, A.E. Association between serum lipid levels in Greek children with dyslipidemia and Mediterranean diet adherence, dietary habits, lifestyle and family socioeconomic factors. Nutrients 2020, 12, 1600. [Google Scholar] [CrossRef]
- Tonstad, S.; Leren, T.; Sivertsen, M.; Ose, L. Determinants of lipid levels among children with heterozygous familial hypercholesterole- mia in Norway. Arterioscler. Tromb. Vasc. Biol. 1995, 15, 1009–1014. [Google Scholar] [CrossRef]
- Gidding, S.S. Special commentary: Is diet management helpful in familial hypercholesterolemia? Curr. Opin. Clin. Nutr. Metab. Care 2019, 22, 135–140. [Google Scholar] [CrossRef]
- Gidding, S.S.; Sniderman, A. Improving recognition of cardiovascular risk in children. J. Pediatr. 2014, 164, 228–230. [Google Scholar] [CrossRef] [PubMed]
- Goldberg, A.C.; Hopkins, P.N.; Toth, P.P.; Ballantyne, C.M.; Rader, D.J.; Robinson, J.G.; Daniels, S.R.; Gidding, S.S.; de Ferranti, S.D.; Ito, M.K.; et al. Familial hypercholesterolemia: Screening, diagnosis and management of pediatric and adult patients: Clinical guidance from the national lipid association expert panel on familial hypercholesterolemia. J. Clin. Lipidol. 2011, 5, 133–140. [Google Scholar] [CrossRef] [PubMed]
- Mach, F.; Baigent, C.; Catapano, A.L.; Koskinas, K.C.; Casula, M.; Badimon, L.; Chapman, M.J.; De Backer, G.G.; Delgado, V.; Ference, B.A.; et al. 2019 ESC/EAS Guidelines for the management of dyslipidaemias: Lipid modification to reduce cardiovascular risk. Eur. Heart J. 2020, 41, 111–188. [Google Scholar] [CrossRef] [PubMed]
- Bruckert, E.; Rosenbaum, D. Lowering LDL cholesterol through diet: Potential role in the statin era. Curr. Opin. Lipidol. 2011, 22, 43–48. [Google Scholar] [CrossRef] [PubMed]
- Molven, K.; Retterstol, L.F.; Andersen, M.B.; Veierod, I.; Narverud, L.; Ose, L.; Svilaas, A.; Wandel, M.; Holven, K.B. Children and young adults with familial hypercholesterolaemia (FH) have healthier food choices particularly with respect to dietary fat sources compared with non-FH children. J. Nutr. Sci. 2013, 2, e32. [Google Scholar] [CrossRef] [Green Version]
- Estruch, R.; Ros, E.; Salas-Salvadó, J.; Covas, M.I.; Corella, D.; Arós, F.; Gómez-Gracia, E.; Ruiz-Gutiérrez, V.; Fiol, M.; Lapetra, J.; et al. Primary prevention of cardiovascular disease with a Mediterranean diet. N. Engl. J. Med. 2013, 368, 1279–1290. [Google Scholar] [CrossRef] [Green Version]
- Fernandez-Lazaro, C.I.; Toledo, E.; Buil-Cosiales, P.; Salas-Salvadó, J.; Corella, D.; Fitó, M.; Martínez, J.A.; Alonso-Gómez, Á.M.; Wärnberg, J.; Vioque, J.; et al. Factors associated with successful dietary changes in an energy-reduced Mediterranean diet intervention: A longitudinal analysis in the PREDIMED-Plus trial. Eur. J. Nutr. 2021, 61, 1457–1475. [Google Scholar] [CrossRef]
- Tognon, G.; Hebestreit, A.; Lanfer, A.; Moreno, L.A.; Pala, V.; Siani, A.; Tornaritis, M.; De Henauw, S.; Veidebaum, T.; Molnar, D.; et al. Mediterranean diet, overweight and body composition in children from eight European countries: Cross-sectional and prospective results from the IDEFICS study. Nutr. Metab. Cardiovas. Dis. 2014, 24, 205–213. [Google Scholar] [CrossRef]
- Nestel, P.J.; Beilin, L.J.; Mori, T.A. Changing dietary approaches to prevent cardiovascular disease. Curr. Opin. Lipidol. 2020, 31, 313–323. [Google Scholar] [CrossRef]
- Te Morenga, L.; Montez, J.M. Health effects of saturated and trans-fatty acid intake in children and adolescents: Systematic review and meta-analysis. PLoS ONE 2017, 12, e0186672. [Google Scholar] [CrossRef] [Green Version]
- Antoniazi, L.; Arroyo-Olivares, R.; Mata, P.; Santos, R.D. Association of dietary patterns and components with atherosclerosis risk biomarkers in familial hypercholesterolemia. Curr. Opin. Lipidol. 2021, 33, 89–94. [Google Scholar] [CrossRef]
- Serra-Majem, L.; Ribas, L.; Ngo, J.; Ortega, R.M.; Garcıa, A.; Perez-Rodrigo, C.; Aranceta, J. Food, youth and the Mediterranean diet in Spain. Development of KIDMED, Mediterranean diet quality index in children and adolescents. Public Health Nutr. 2004, 7, 931–935. [Google Scholar] [CrossRef] [PubMed]
- Fernandez-Ballart, J.D.; Pino, J.L.; Zazpe, I.; Corella, D.; Carrasco, P.; Toledo, E.; Perez-Bauer, M.; Martınez-Gonzalez, M.A.; Salas-Salvado, J.; Martın-Moreno, J.M. Relative validity of a semi-quantitative food-frequency questionnaire in an elderly Mediterranean population of Spain. Br. J. Nutr. 2010, 103, 1808–1816. [Google Scholar] [CrossRef] [PubMed] [Green Version]
- Grassi, T.; Bagordo, F.; Panico, A.; De Giorgi, M.; Idolo, A.; Serio, F.; Tumolo, M.R.; De Donno, A. Adherence to Mediterranean diet of children living in small Southern Italian villages. Int. J. Food. Sci. Nutr. 2020, 71, 490–499. [Google Scholar] [CrossRef]


| Parameter | Unit | ALL (n°223) | NR (n°67) | R (n°156) | p-Value |
|---|---|---|---|---|---|
| AGE | year | 10.05 ± 3.26 | 10.18 ± 3.45 | 9.99 ± 3.19 | 0.699 |
| SEX (MALE) | 101 (45.3%) | 27 (40.3%) | 74 (47.7%) | 0.326 | |
| BMI | kg/m2 | 18.84 (16.26; 22.05) | 19.5 (16.9; 23.49) | 18.65 (16.19; 21.6) | 0.158 |
| TC | mg/dL | 220 (202; 251) | 214 (187; 239) | 226 (206; 253) | 0.004 * |
| HDL-C | mg/dL | 58 (49; 68) | 57 (47; 68) | 59 (50; 68) | 0.141 |
| LDL-C | mg/dL | 145 (124; 174) | 133 (114; 162) | 148.5 (128.5; 175) | 0.003 * |
| TG | mg/dL | 69 (55; 104) | 74 (59; 112) | 67.5 (54; 99) | 0.051 |
| Non-HDL-C | mg/dL | 159 (141; 189) | 153 (135; 186) | 166 (144.5; 192.5) | 0.017 * |
| Calories | Kcal/day | 1258 (10,472; 1441) | 1236 (1056; 1441) | 1259.5 (1084; 143) | 0.649 |
| TDL | E%/day | 34.06 ± 5.01 | 34.63 ± 5.67 | 33.82 ± 4.69 | 0.273 |
| DC | mg/day | 137.7 (107.77; 174.31) | 136 (106; 177.85) | 137.85 (109.32; 172.99) | 0.812 |
| PUFAs | E%/day | 3.3 (2.9; 3.81) | 3.35 (2.81; 3.95) | 3.29 (2.93; 3.8) | 0.735 |
| MUFAs | E%/day | 16.36 ± 3.45 | 16.86 ± 3.98 | 16.14 ± 3.19 | 0.153 |
| SFAs | E%/day | 10.15 (8.44; 11.63) | 10.16 (8.68; 11.41) | 10.08 (8.2; 11.7) | 0.706 |
| Fiber | g/day | 9.96 ± 3.58 | 9.64 ± 3.95 | 10.09 ± 3.41 | 0.387 |
| CHO | E%/day | 50.05 ± 5.82 | 49.56 ± 5.94 | 50.26 ± 5.78 | 0.412 |
| Pr | E%/day | 15.83 ± 2.65 | 15.78 ± 2.27 | 15.86 ± 2.81 | 0.837 |
| Parameter | Unit | NON-RESPONDERS (n°67) | RESPONDERS (n°156) | |||||
|---|---|---|---|---|---|---|---|---|
| T0 | T1 | p-value | T0 | T1 | p-value | ∆ p-value | ||
| AGE | year | 10.18 ± 3.45 | - | 9.99 ± 3.19 | 0.699 | |||
| SEX (MALE) | 27 (40.3%) | - | 74 (47.7%) | 0.326 | ||||
| BMI | kg/m2 | 19.5 (16.9; 23.49) | 20.08 (16.11; 23.11) | 0.097 | 18.65 (16.19; 21.66) | 18.87 (16.2; 21.44) | 0.826 | 0.159 |
| TC | mg/dL | 214 (187; 239) | 222 (200; 245) | <0.0001 * | 226 (206; 253) | 202.5 (181; 233) | <0.0001 * | <0.0001 |
| HDL-C | mg/dL | 57 (47; 68) | 57 (48; 64) | 0.978 | 59 (50; 68) | 55 (47; 65) | <0.0001 * | 0.016 * |
| LDL-C | mg/dL | 133 (114; 162) | 148 (123; 179) | <0.0001 * | 148.5 (128.5; 175.5) | 127 (109.5; 156) | <0.0001 * | <0.0001 |
| TG | mg/dL | 74 (59; 112) | 83 (61; 99) | 0.241 | 67.5 (54; 99) | 71 (52; 97) | 0.787 | 0.483 |
| Non-HDL-C | mg/dL | 153 (135; 186) | 164 (140; 191) | <0.0001 * | 166 (144.5; 192.5) | 144.5 (125; 176.5) | <0.0001 * | <0.0001 |
| Calories | Kcal/day | 1236 (1056; 1441) | 1208 (1104; 1368) | 0.745 | 1259.5 (1084; 1436) | 1254.6 (1083; 1383.5) | 0.503 | 0.644 |
| TDL | E%/day | 34.63 ± 5.67 | 35.45 ± 6.15 | 0.352 | 33.82 ± 4.69 | 32.84 ± 5.02 | 0.033 * | 0.059 |
| DC | mg/day | 136 (106; 177.85) | 133 (105; 160) | 0.419 | 137.85 (109.32; 172.99) | 125.15 (99.5; 168.33) | 0.047 * | 0.321 |
| PUFAs | E%/day | 3.35 (2.81; 3.95) | 3.4 (3.02; 3.92) | 0.444 | 3.29 (2.93; 3.8) | 3.33 (2.9; 3.87) | 0.362 | 0.736 |
| MUFAs | E%/day | 16.86 ± 3.98 | 17.42 ± 3.79 | 0.361 | 16.14 ± 3.19 | 16.31 ± 3.76 | 0.628 | 0.619 |
| SFAs | E%/day | 10.16 (8.68; 11.41) | 10.5 (8.8; 12.38) | 0.51 | 10.08 (8.2; 11.7) | 8.84 (7.61; 10.48) | <0.0001 * | 0.014 |
| Fiber | g/day | 9.64 ± 3.95 | 10.62 ± 3.91 | 0.057 | 10.09 ± 3.41 | 11.37 ± 3.89 | <0.0001 * | 0.642 |
| CHO | E%/day | 49.56 ± 5.94 | 48.71 ± 6.58 | 0.375 | 50.26 ± 5.78 | 51.31 ± 5.77 | 0.043 * | 0.077 |
| Pr | E%/day | 15.78 ± 2.27 | 15.87 ± 2.12 | 0.797 | 15.86 ± 2.81 | 15.82 ± 2.49 | 0.895 | 0.821 |
| Parameter | Unit | FH RESPONDERS (n°45) | PH RESPONDERS (n°111) | |||||
|---|---|---|---|---|---|---|---|---|
| T0 | T1 | p-value | T0 | T1 | p-value | ∆ p-value | ||
| AGE | year | 9.37 ± 3.52 | - | 10.24 ± 3.03 | 0.125 | |||
| SEX (MALE) | 19 (42.2%) | - | 55 (49.55%) | 0.406 | ||||
| BMI | kg/m2 | 18.18 (15.04; 19.73) | 17.64 (15.68; 19.93) | 0.946 | 18.9 (16.3; 22.32) | 19.19 (16.43; 22.06) | 0.802 | 0.942 |
| TC | mg/dL | 272 (234; 306) | 245 (214; 276) | <0.0001 * | 216 (198; 237) | 192 (178; 216) | <0.0001 * | 0.388 |
| HDL-C | mg/dL | 55 (48; 64) | 54 (45; 61) | 0.581 | 61 (51; 72) | 55 (47; 67) | <0.0001 * | 0.077 |
| LDL-C | mg/dL | 205 (170; 235) | 177 (142; 211) | <0.0001 * | 137 (125; 155) | 117 (105; 133) | <0.0001 * | 0.380 |
| TG | mg/dL | 63 (53; 75) | 63 (44; 84) | 0.940 | 68 (55; 107) | 73 (53; 106) | 0.871 | 0.779 |
| Non-HDL-C | mg/dL | 222 (181; 244) | 190 (156; 220) | <0.0001 * | 153 (140; 173) | 133 (122; 153) | <0.0001 * | 0.806 |
| Calories | Kcal/day | 1308 (1122; 1453) | 1300 (1116; 1488) | 0.993 | 1232 (1083; 1430) | 1243 (1070; 1372) | 0.409 | 0.723 |
| TDL | E%/day | 33.31 ± 4.88 | 32.72 ± 5.87 | 0.530 | 34.03 ± 4.62 | 32.89 ± 4.67 | 0.030 * | 0.488 |
| DC | mg/day | 142.14 (104.48; 175. 5) | 127.24 (95; 172) | 0.438 | 137.7 (112; 171.67) | 123.12 (100.3; 159) | 0.057 | 0.858 |
| PUFAs | E%/day | 3.36 (3.06; 3.81) | 3.19 (2.72; 3.81) | 0.656 | 3.25 (2.87; 3.8) | 3.4 (2.94; 3.9) | 0.097 | 0.079 |
| MUFAs | E%/day | 16.34 ± 3.22 | 16.44 ± 4.31 | 0.889 | 16.06 ± 3.18 | 16.25 ± 3.54 | 0.946 | 0.937 |
| SFAs | E%/day | 9.48 (7.5; 11.12) | 7.99 (6.98; 10.55) | 0.040 * | 10.2 (8.44; 11.85) | 9.11 (7.8; 10.46) | 0.002 * | 0.898 |
| Fiber | g/day | 10.26 ± 3.39 | 11.51 ± 3.17 | 0.022 * | 10.03 ± 3.42 | 11.31 ± 4.16 | 0.001 * | 0.929 |
| CHO | E%/day | 51.26 ± 5.82 | 5.96 ± 5.53 | 0.503 | 49.85 ± 5.74 | 51.05 ± 5.86 | 0.047 * | 0.566 |
| Pr | E%/day | 15.38 ± 2.64 | 15.36 ± 2.4 | 0.950 | 16.05 ± 2.86 | 16.01 ± 2.51 | 0.908 | 0.933 |
| Time T1 | Delta Log LDL-C | Delta Log Non-HDL-C | Delta Log TC |
|---|---|---|---|
| TDL | 0.152 | 0.172 | 0.137 |
| 0.024 * | 0.010 * | 0.041 * | |
| DC (log) | 0.128 | 0.132 | 0.106 |
| 0.057 | 0.0499 * | 0.115 | |
| PUFAs (log) | −0.012 | 0.018 | 0.007 |
| 0.854 | 0.789 | 0.919 | |
| MUFAs | 0.098 | 0.104 | 0.063 |
| 0.147 | 0.124 | 0.348 | |
| SFAs (log) | 0.186 | 0.224 | 0.204 |
| 0.006 * | 0.001 * | 0.002 * | |
| F | −0.056 | −0.085 | −0.065 |
| 0.4064 | 0.2059 | 0.3341 | |
| CHO | −0.168 | −0.201 | −0.152 |
| 0.0124 * | 0.003 * | 0.024 * | |
| KCAL (log) | 0.032 | 0.002 | 0.043 |
| 0.635 | 0.976 | 0.521 | |
| Pr | 0.080 | 0.111 | 0.072 |
| 0.238 | 0.101 | 0.285 |
| Dependent Variables | Independent Variables | Beta | 95% CL | p-Value | |
|---|---|---|---|---|---|
| delta log non-HDL-C | log SFA T1 | 0.120 | 0.051 | 0.190 | 0.001 * |
| delta log LDL-C | 0.112 | 0.033 | 0.191 | 0.006 * | |
| delta log TC | 0.092 | 0.033 | 0.150 | 0.002 * | |
Publisher’s Note: MDPI stays neutral with regard to jurisdictional claims in published maps and institutional affiliations. |
© 2022 by the authors. Licensee MDPI, Basel, Switzerland. This article is an open access article distributed under the terms and conditions of the Creative Commons Attribution (CC BY) license (https://creativecommons.org/licenses/by/4.0/).
Share and Cite
Massini, G.; Capra, N.; Buganza, R.; Nyffenegger, A.; de Sanctis, L.; Guardamagna, O. Mediterranean Dietary Treatment in Hyperlipidemic Children: Should It Be an Option? Nutrients 2022, 14, 1344. https://doi.org/10.3390/nu14071344
Massini G, Capra N, Buganza R, Nyffenegger A, de Sanctis L, Guardamagna O. Mediterranean Dietary Treatment in Hyperlipidemic Children: Should It Be an Option? Nutrients. 2022; 14(7):1344. https://doi.org/10.3390/nu14071344
Chicago/Turabian StyleMassini, Giulia, Nicolò Capra, Raffaele Buganza, Anna Nyffenegger, Luisa de Sanctis, and Ornella Guardamagna. 2022. "Mediterranean Dietary Treatment in Hyperlipidemic Children: Should It Be an Option?" Nutrients 14, no. 7: 1344. https://doi.org/10.3390/nu14071344