
Associations between Taste and Smell Sensitivity, Preference and Quality of Life in Healthy Aging—The NutriAct Family Study Examinations (NFSE) Cohort

 , ,
, ,
Abstract
:1. Introduction
2. Methods
2.1. Recruitment
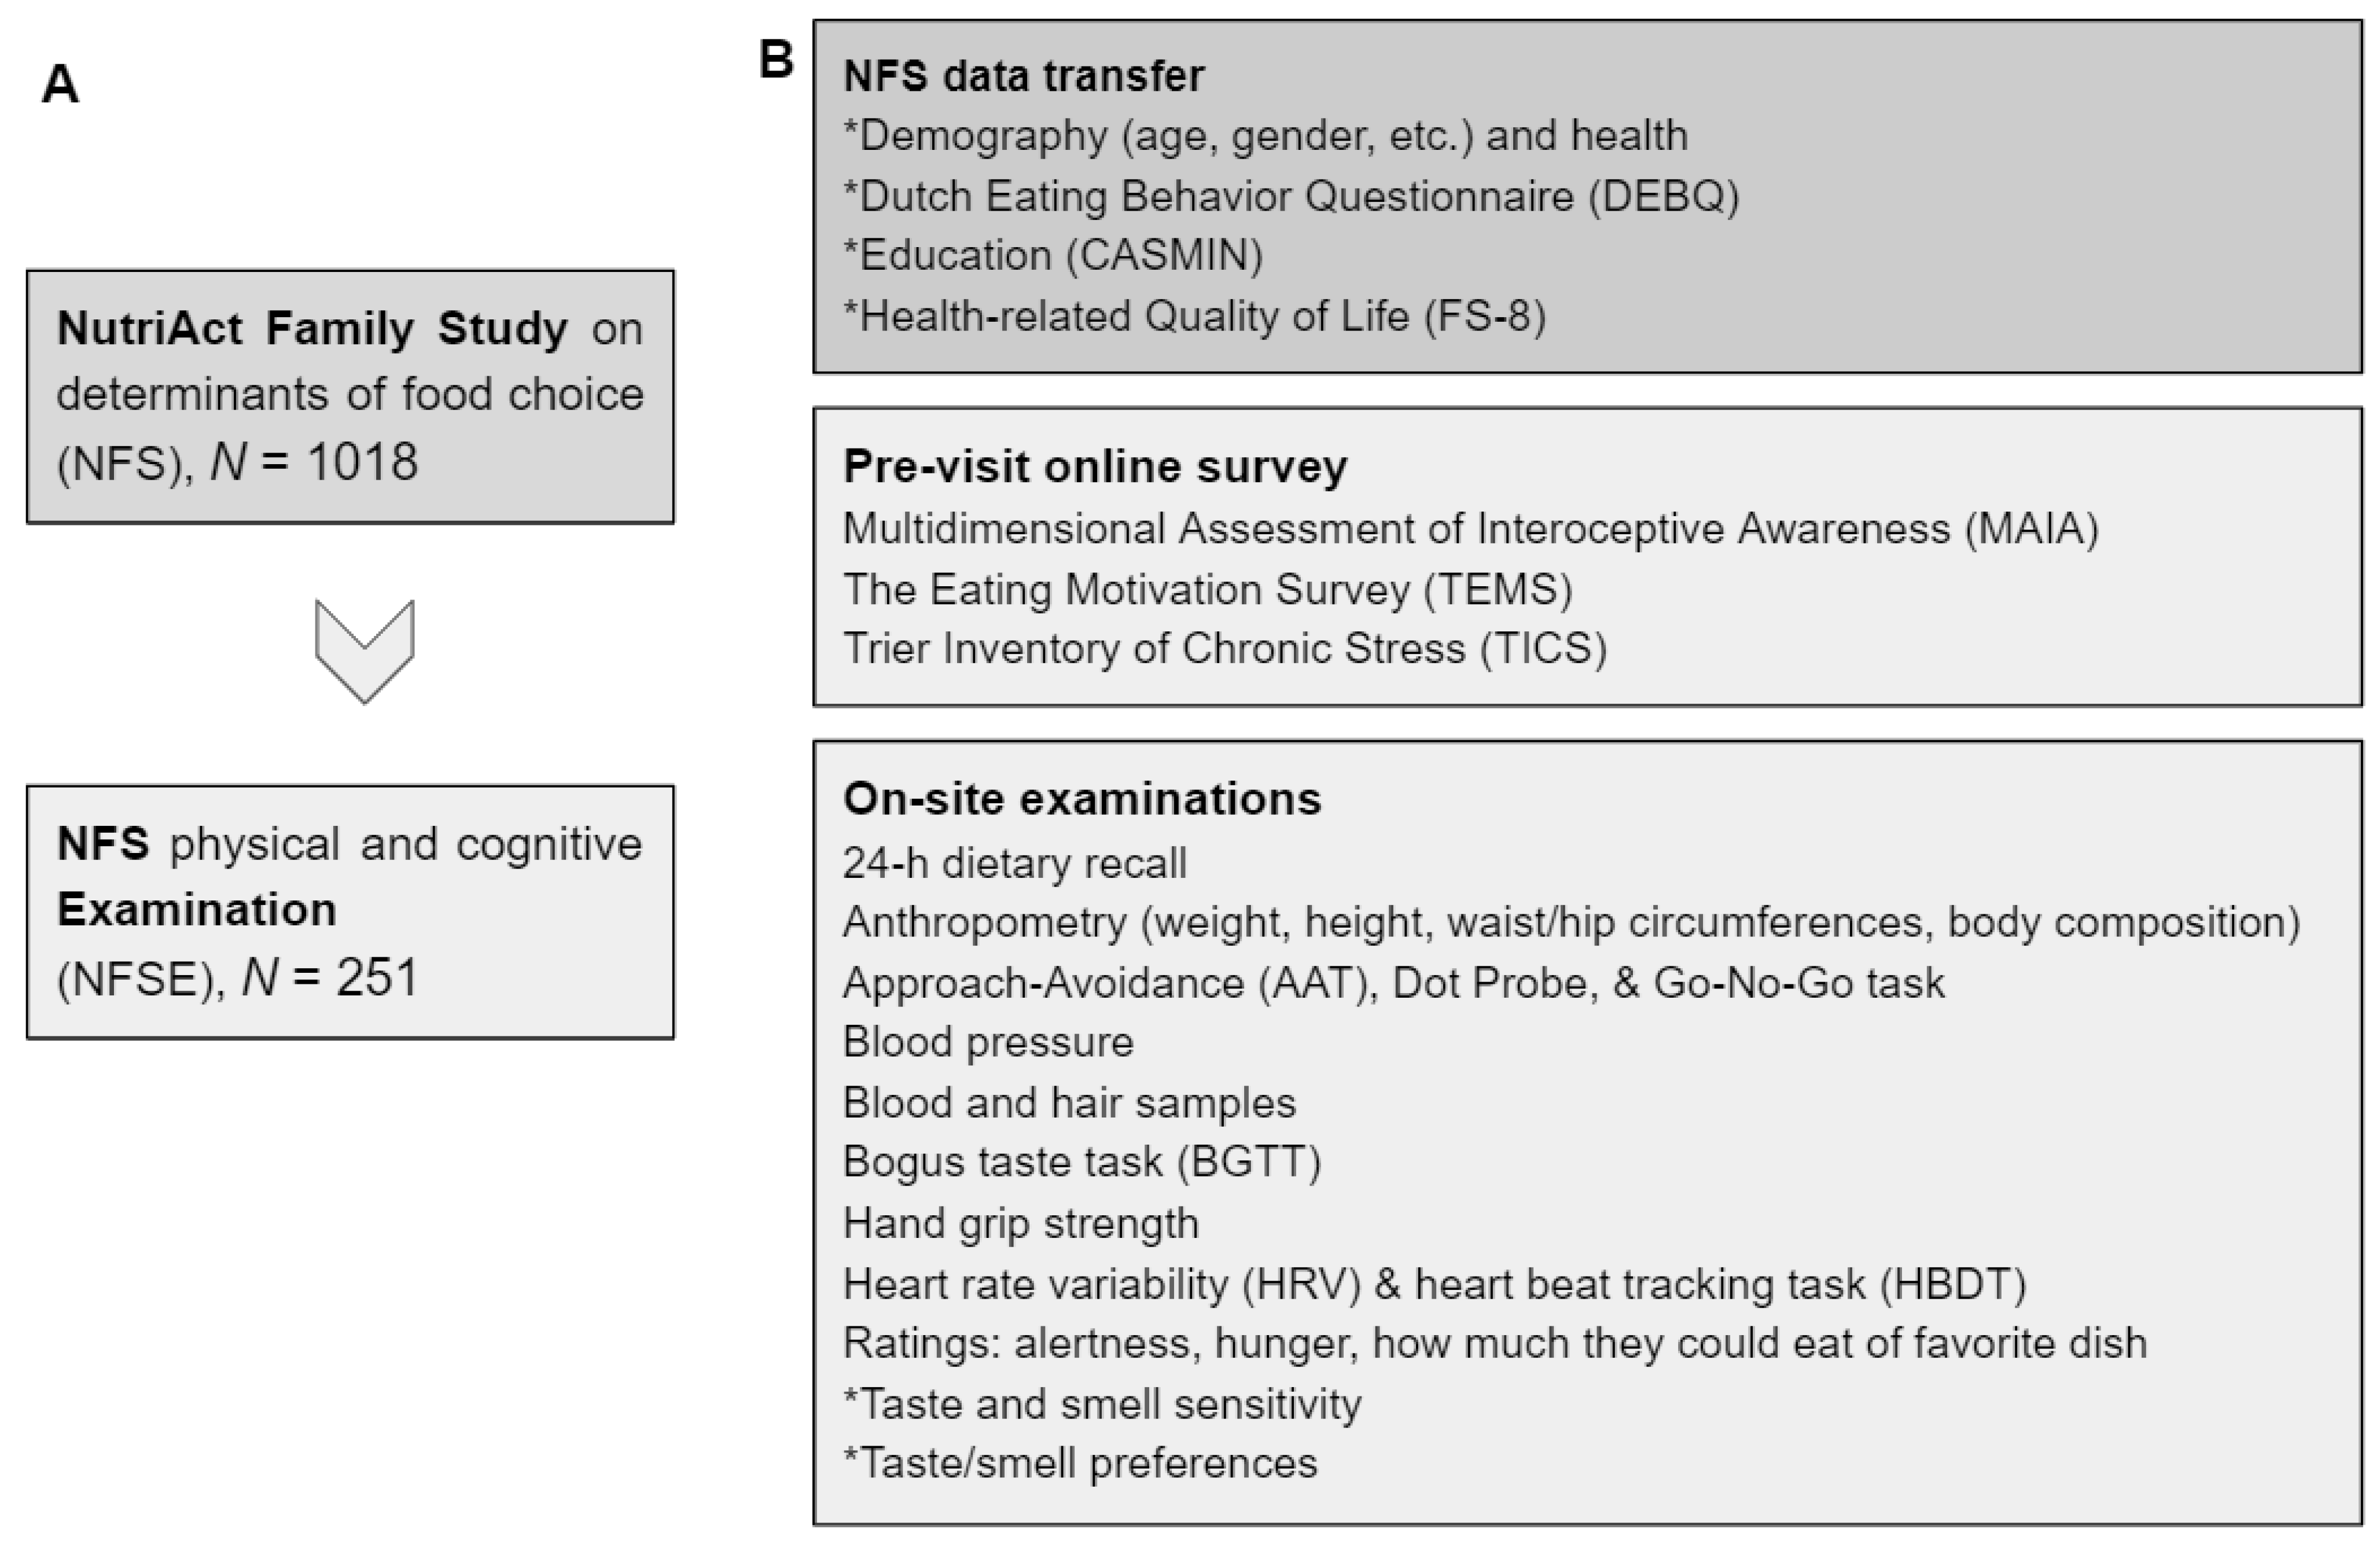
2.2. NFSE Protocol
2.2.1. NFS Data Transfer
2.2.2. Pre-Visit Survey
2.2.3. Examination Procedure
2.3. Taste and Smell Sensitivity
2.3.1. Questionnaires
2.3.2. Taste Threshold Measurement
2.3.3. Statistical Analyses
2.3.4. Software
3. Results
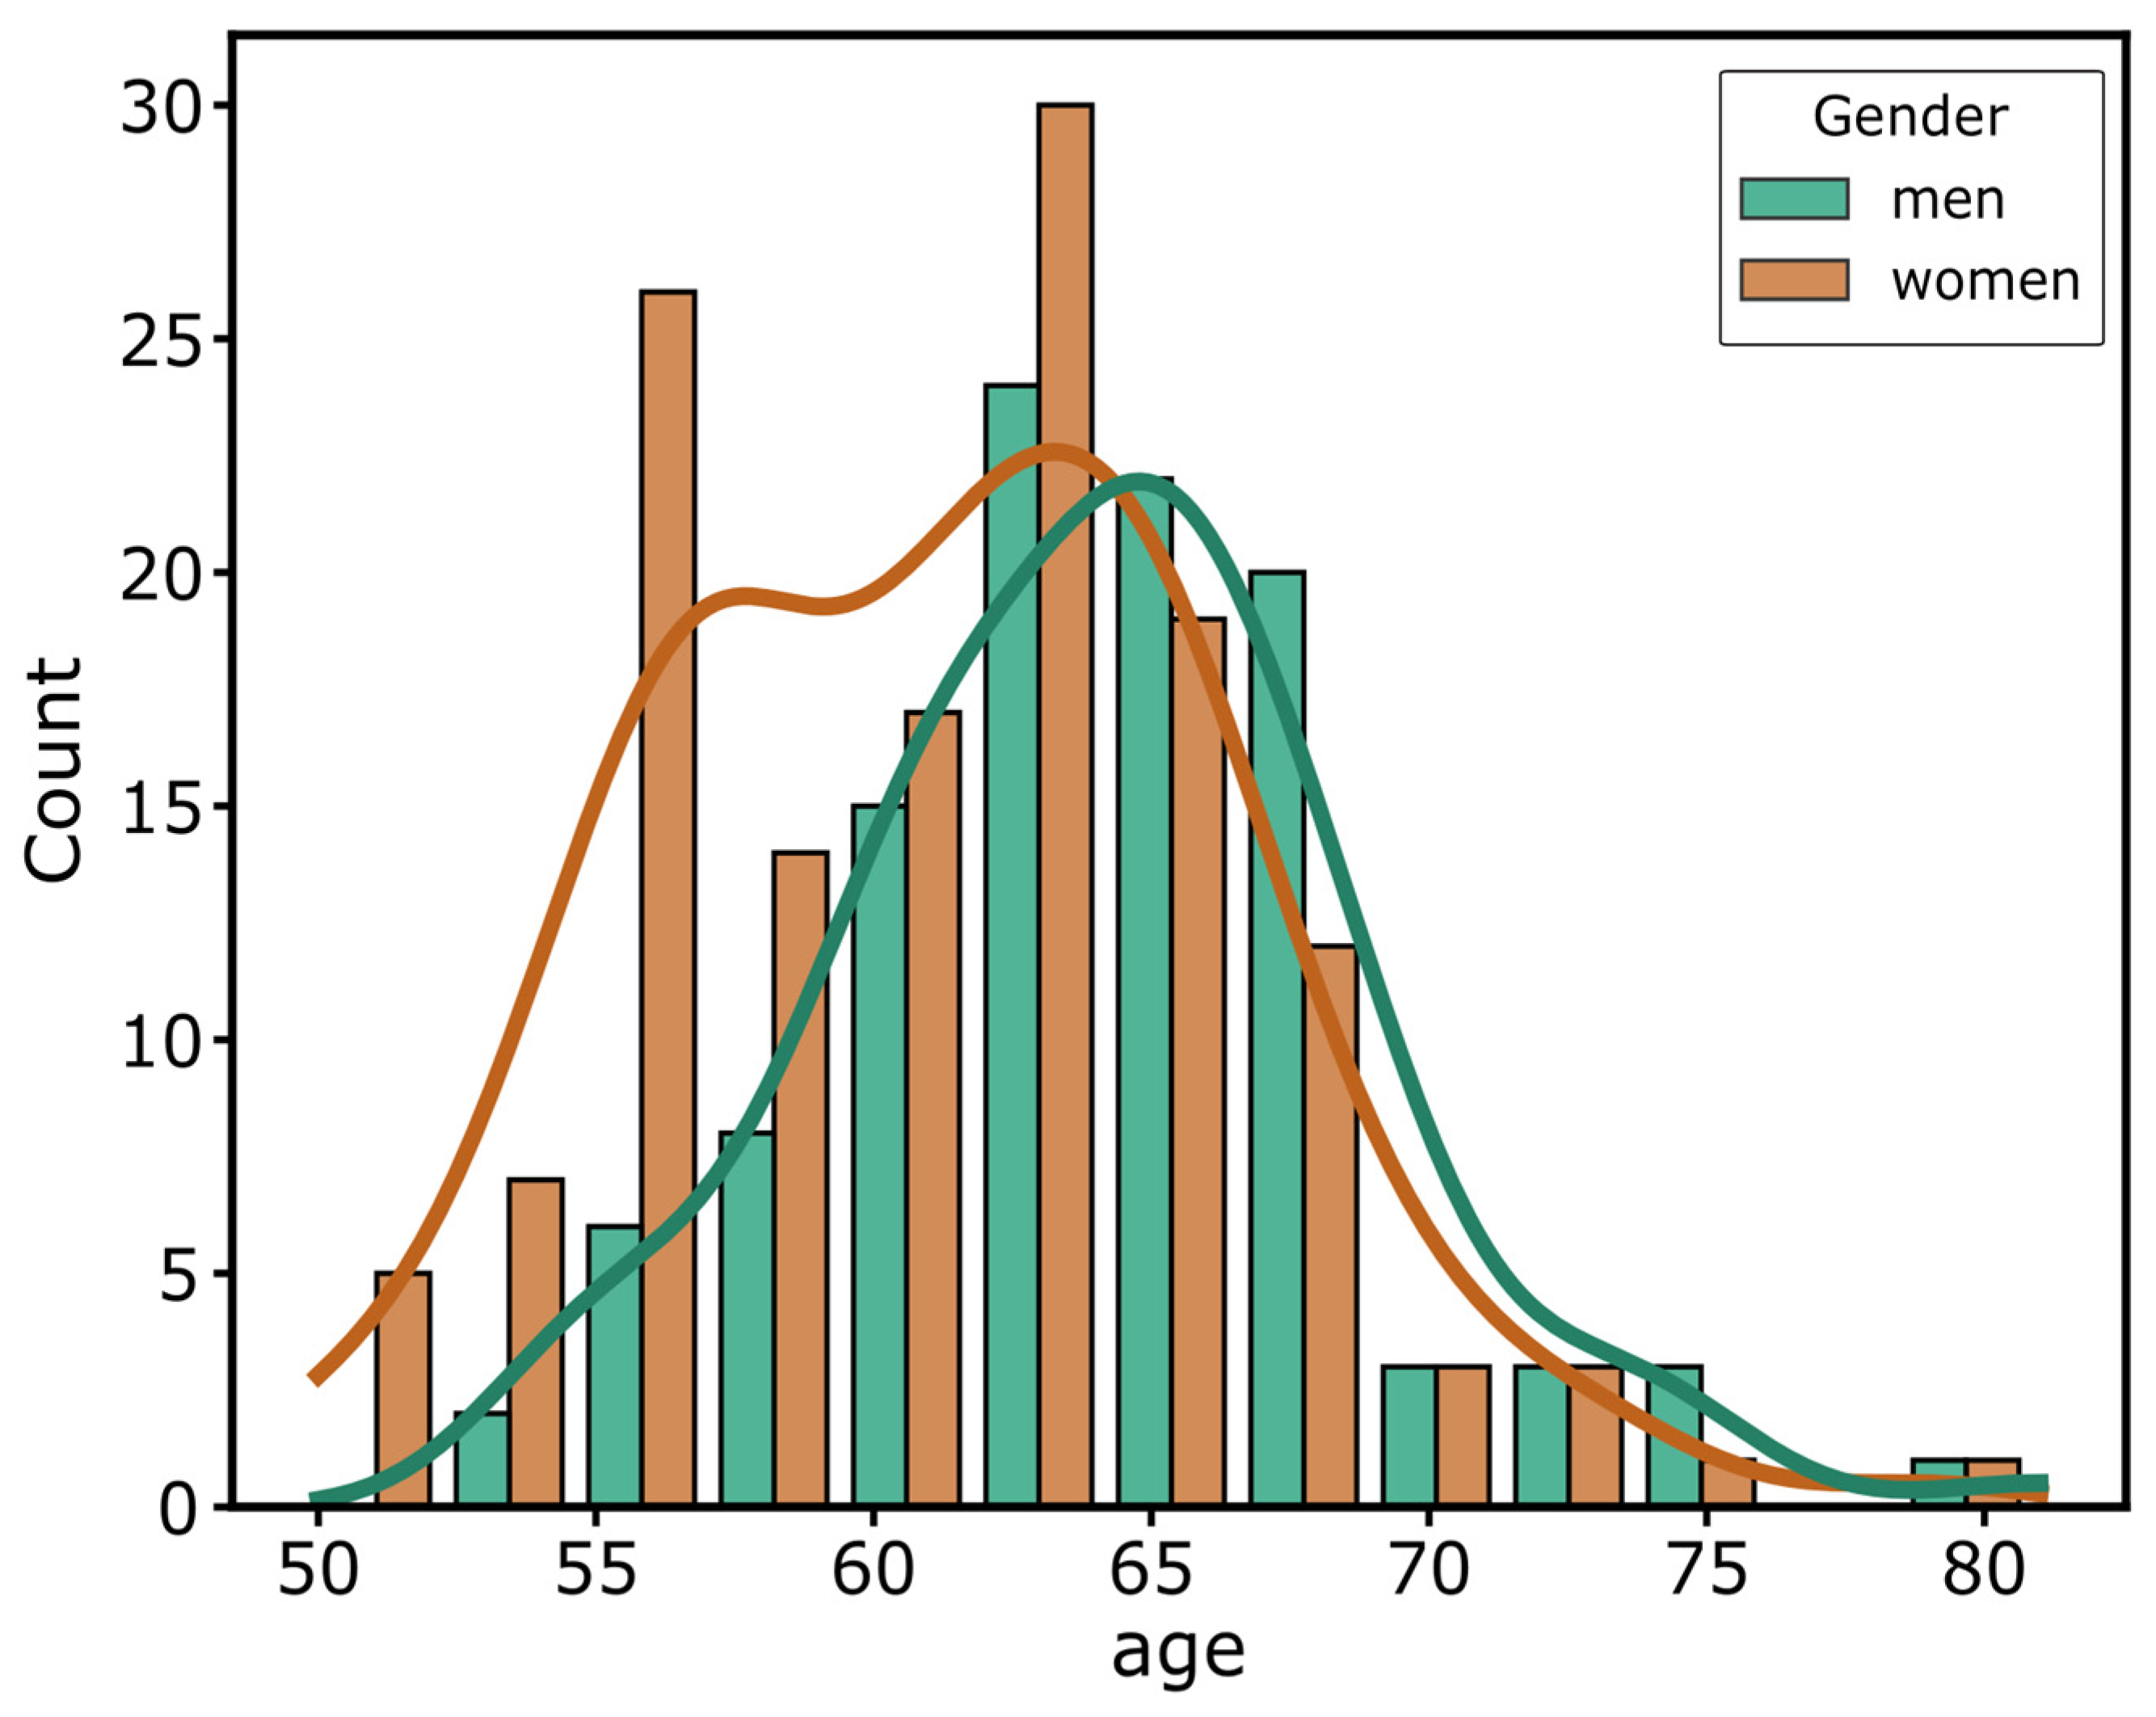
3.1. Participants
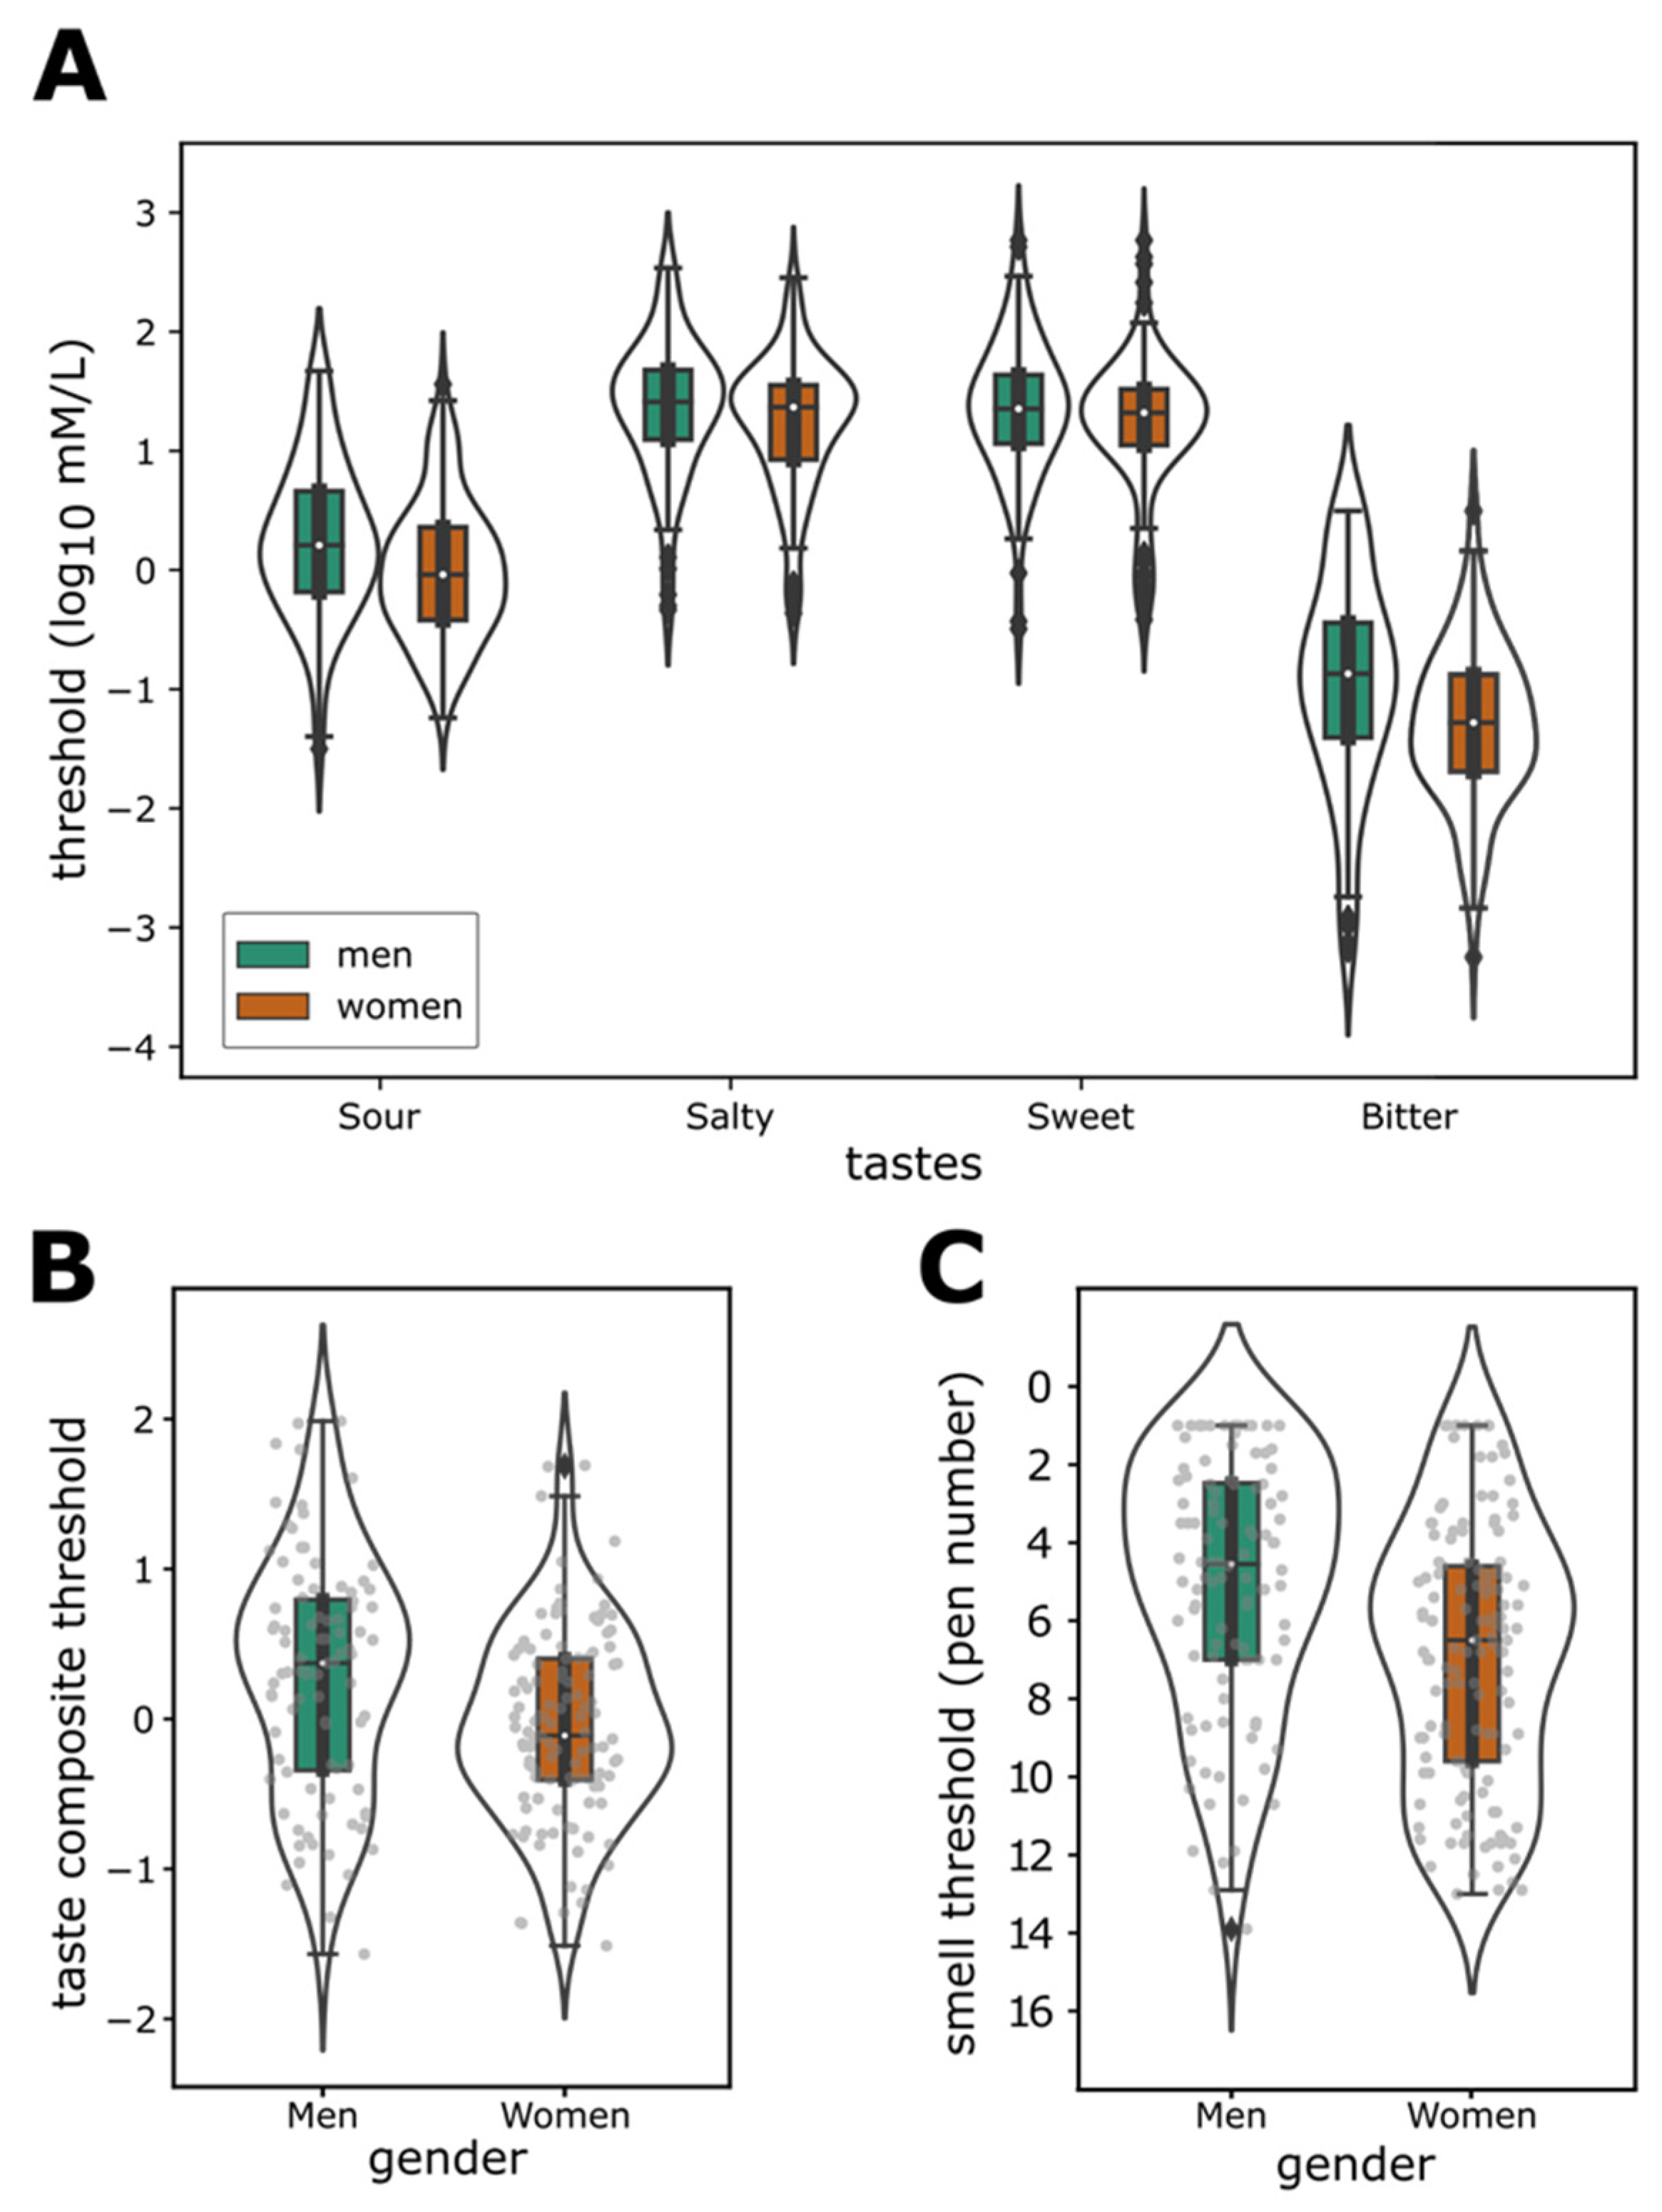
3.2. Taste and Smell Sensitivity
3.3. Link between Taste and Smell Sensitivity
3.4. Sensitivity and Gender
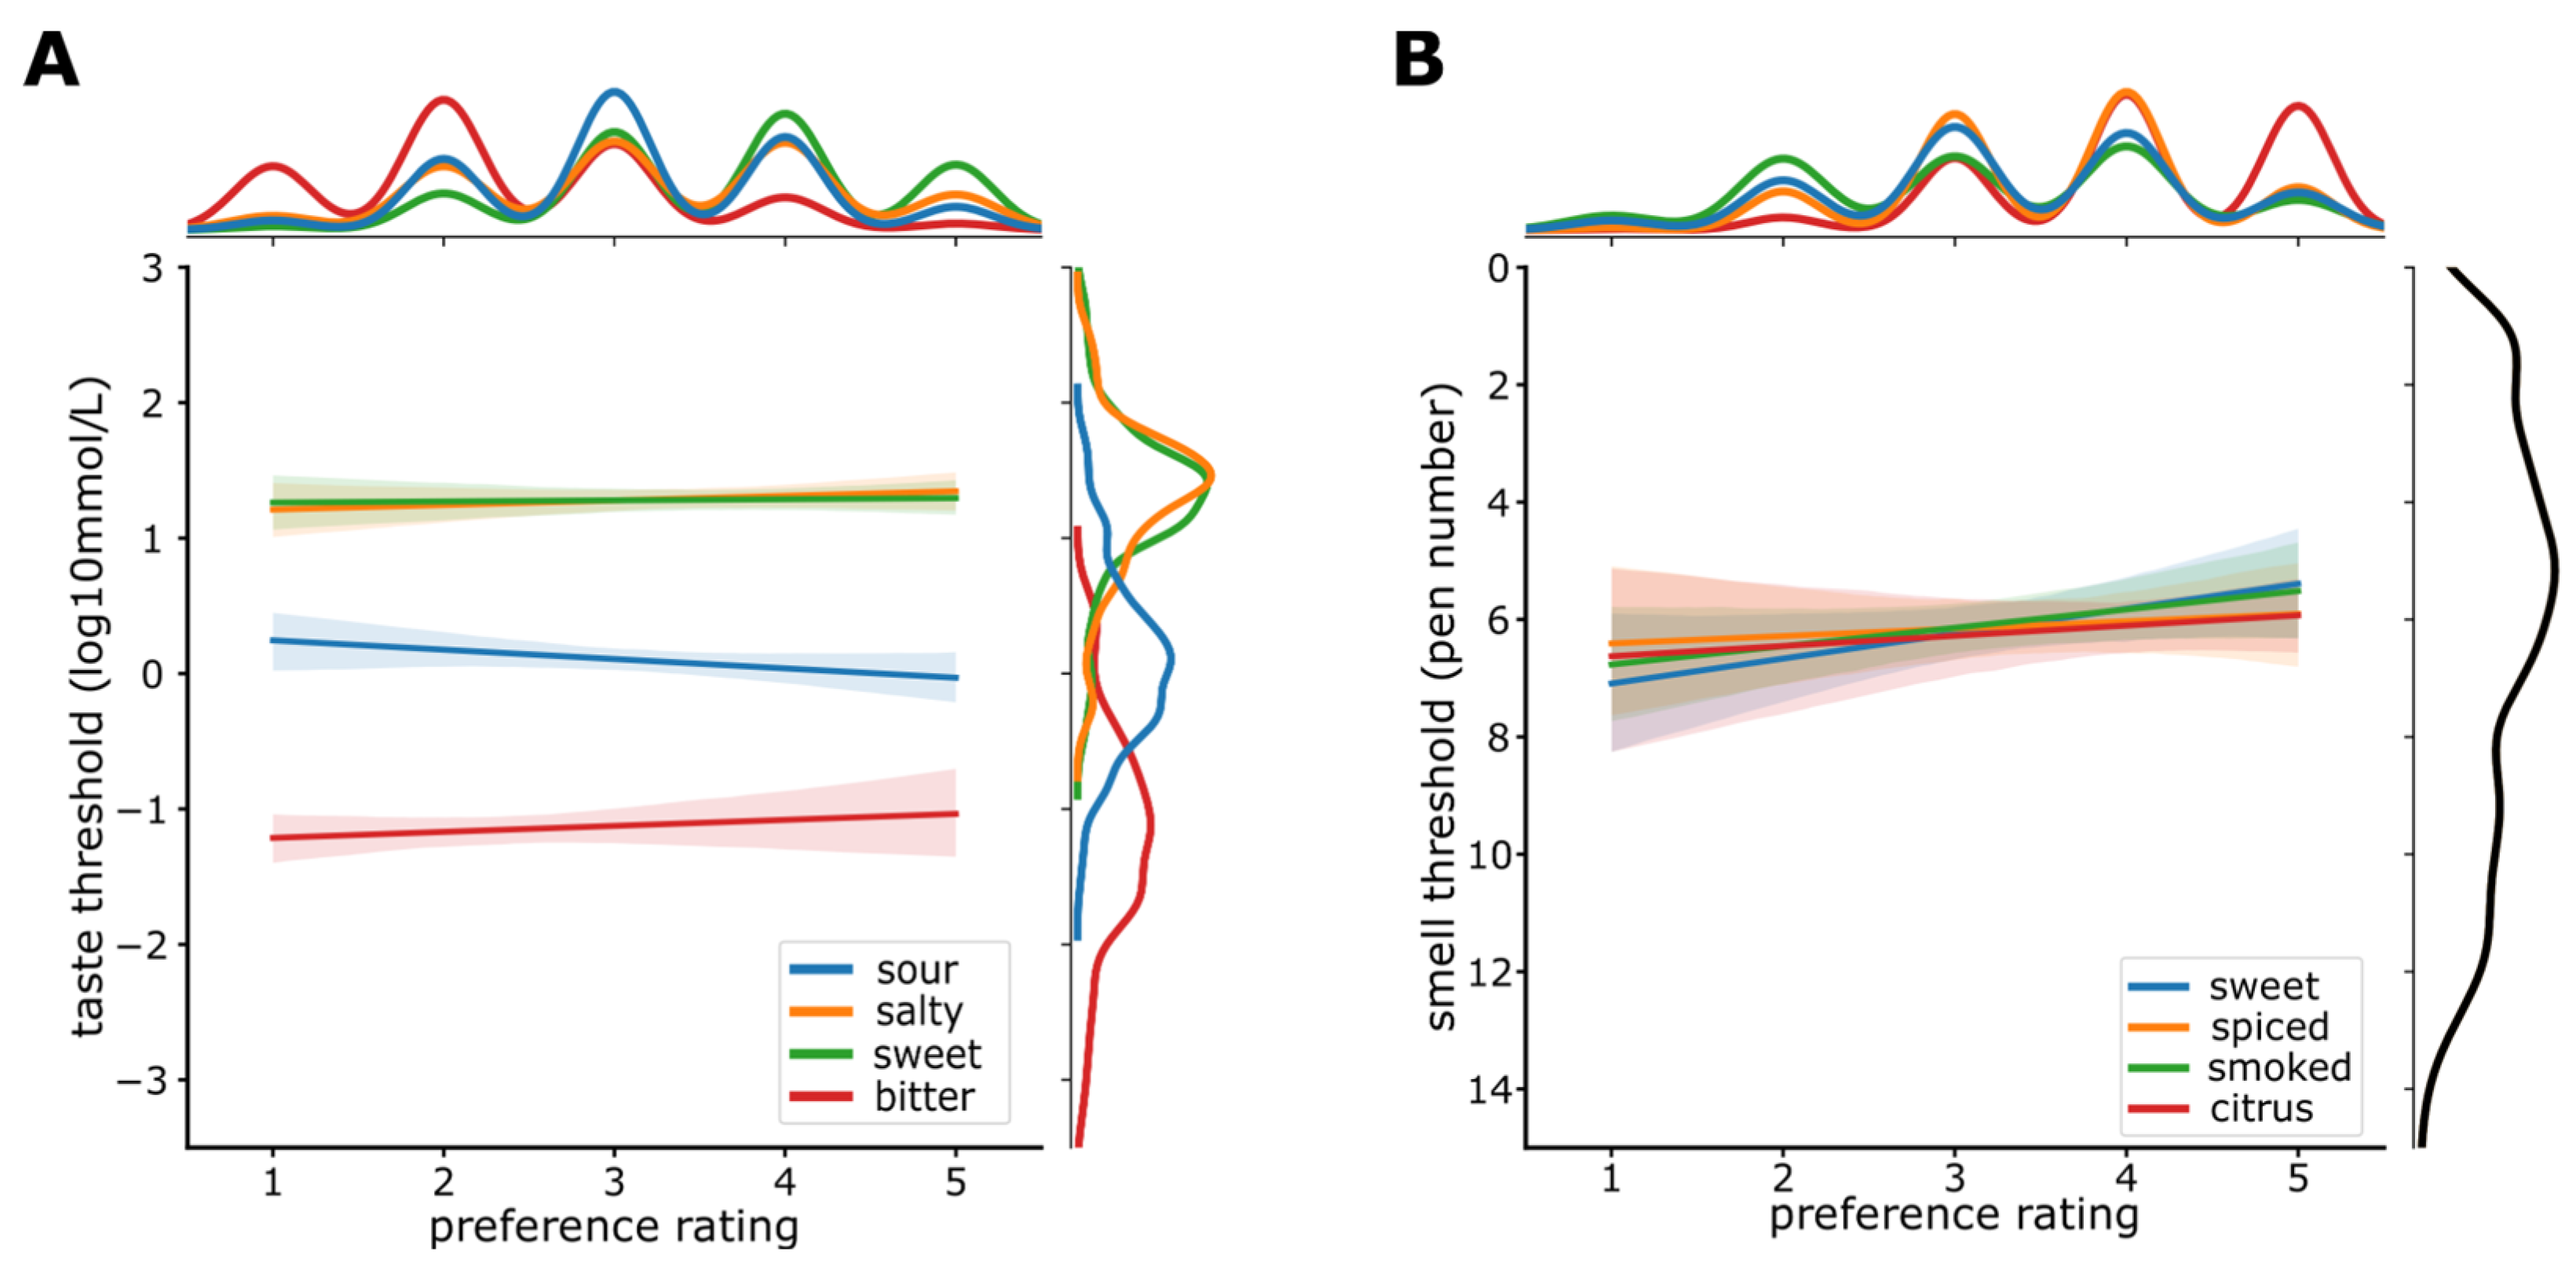
3.5. Sensitivity and Preference
3.6. Sensitivity and Age
3.7. Sensitivity and Quality of Life (QoL)
4. Discussion
4.1. Taste and Smell Sensitivity
4.2. Sensitivity and Preference
4.3. Sensitivity and Gender
4.4. Sensitivity and Age
4.5. Quality of Life (QoL)
5. Conclusions
Supplementary Materials
Author Contributions
Funding
Institutional Review Board Statement
Informed Consent Statement
Data Availability Statement
Acknowledgments
Conflicts of Interest
References
- Stevenson, R.J. An Initial Evaluation of the Functions of Human Olfaction. Chem. Senses 2010, 35, 3–20. [Google Scholar] [CrossRef] [PubMed] [Green Version]
- Nusbaum, N.J. Aging and Sensory Senescence. South. Med. J. 1999, 92, 267–275. [Google Scholar] [CrossRef] [PubMed]
- Attems, J.; Walker, L.; Jellinger, K.A. Olfaction and Aging: A Mini-Review. Gerontology 2015, 61, 485–490. [Google Scholar] [CrossRef] [PubMed]
- Doty, R.L. Age-Related Deficits in Taste and Smell. Otolaryngol. Clin. N. Am. 2018, 51, 815–825. [Google Scholar] [CrossRef]
- Hoffman, H.J.; Rawal, S.; Li, C.-M.; Duffy, V.B. New Chemosensory Component in the U.S. National Health and Nutrition Examination Survey (NHANES): First-Year Results for Measured Olfactory Dysfunction. Rev. Endocr. Metab. Disord. 2016, 17, 221–240. [Google Scholar] [CrossRef] [Green Version]
- Fluitman, K.S.; Hesp, A.C.; Kaihatu, R.F.; Nieuwdorp, M.; Keijser, B.J.F.; IJzerman, R.G.; Visser, M. Poor Taste and Smell Are Associated with Poor Appetite, Macronutrient Intake, and Dietary Quality but Not with Undernutrition in Older Adults. J. Nutr. 2021, 151, 605–614. [Google Scholar] [CrossRef]
- Athanassi, A.; Dorado Doncel, R.; Bath, K.G.; Mandairon, N. Relationship between Depression and Olfactory Sensory Function: A Review. Chem. Senses 2021, 46, bjab044. [Google Scholar] [CrossRef]
- Croy, I.; Hummel, T. Olfaction as a Marker for Depression. J. Neurol. 2017, 264, 631–638. [Google Scholar] [CrossRef]
- Jeon, S.; Kim, Y.; Min, S.; Song, M.; Son, S.; Lee, S. Taste Sensitivity of Elderly People Is Associated with Quality of Life and Inadequate Dietary Intake. Nutrients 2021, 13, 1693. [Google Scholar] [CrossRef]
- Vaira, L.A.; Gessa, C.; Deiana, G.; Salzano, G.; Maglitto, F.; Lechien, J.R.; Saussez, S.; Piombino, P.; Biglio, A.; Biglioli, F.; et al. The Effects of Persistent Olfactory and Gustatory Dysfunctions on Quality of Life in Long-COVID-19 Patients. Life 2022, 12, 141. [Google Scholar] [CrossRef]
- Schwingshackl, L.; Ruzanska, U.; Anton, V.; Wallroth, R.; Ohla, K.; Knüppel, S.; Schulze, M.B.; Pischon, T.; Deutschbein, J.; Schenk, L.; et al. The NutriAct Family Study: A Web-Based Prospective Study on the Epidemiological, Psychological and Sociological Basis of Food Choice. BMC Public Health 2018, 18, 963. [Google Scholar] [CrossRef]
- Nagl, M.; Hilbert, A.; de Zwaan, M.; Braehler, E.; Kersting, A. The German Version of the Dutch Eating Behavior Questionnaire: Psychometric Properties, Measurement Invariance, and Population-Based Norms. PLoS ONE 2016, 11, e0162510. [Google Scholar] [CrossRef]
- Ware, J.E.; Kosinski, M.; Dewey, J.E.; Gandek, B. How to Score and Interpret Single-Item Health Status Measures: A Manual for Users of the of the SF-8 Health Survey: With a Supplement on the SF-6 Health Survey; QualityMetric Inc.: Lincoln, RI, USA, 2001. [Google Scholar]
- Lechert, Y.; Schroedter, J.H.; Lüttinger, P. Die Umsetzung der Bildungsklassifikation CASMIN für die Volkszählung 1970, die Mikrozensus-Zusatzerhebung 1971 und die Mikrozensen 1976–2004; ZUMA-Methodenbericht; Zentrum für Umfragen, Methoden und Analysen-ZUMA-: Mannheim, Germany, 2006; Volume 12, Available online: https://nbn-resolving.org/urn:nbn:de:0168-ssoar-262353 (accessed on 28 February 2022).
- Schulz, P.; Schlotz, W. Trierer Inventar zum chronischen Stress (TICS): Skalenkonstruktion, teststatistische Überprüfung und Validierung der Skala Arbeitsüberlastung. Diagnostica 1999, 45, 8–19. [Google Scholar] [CrossRef]
- Wiers, R.W.; Gladwin, T.E.; Hofmann, W.; Salemink, E.; Ridderinkhof, K.R. Cognitive Bias Modification and Cognitive Control Training in Addiction and Related Psychopathology: Mechanisms, Clinical Perspectives, and Ways Forward. Clin. Psychol. Sci. 2013, 1, 192–212. [Google Scholar] [CrossRef] [Green Version]
- MacLeod, C.; Mathews, A.; Tata, P. Attentional Bias in Emotional Disorders. J. Abnorm. Psychol. 1986, 95, 15–20. [Google Scholar] [CrossRef]
- Kakoschke, N.; Kemps, E.; Tiggemann, M. Combined Effects of Cognitive Bias for Food Cues and Poor Inhibitory Control on Unhealthy Food Intake. Appetite 2015, 87, 358–364. [Google Scholar] [CrossRef]
- Werthmann, J.; Roefs, A.; Nederkoorn, C.; Mogg, K.; Bradley, B.P.; Jansen, A. Can(Not) Take My Eyes off It: Attention Bias for Food in Overweight Participants. Health Psychol. 2011, 30, 561–569. [Google Scholar] [CrossRef] [Green Version]
- Zahn, D.; Adams, J.; Krohn, J.; Wenzel, M.; Mann, C.G.; Gomille, L.K.; Jacobi-Scherbening, V.; Kubiak, T. Heart Rate Variability and Self-Control—A Meta-Analysis. Biol. Psychol. 2016, 115, 9–26. [Google Scholar] [CrossRef]
- Schandry, R. Heart Beat Perception and Emotional Experience. Psychophysiology 1981, 18, 483–488. [Google Scholar] [CrossRef]
- Höchenberger, R.; Ohla, K. Estimation of Olfactory Sensitivity Using a Bayesian Adaptive Method. Nutrients 2019, 11, 1278. [Google Scholar] [CrossRef] [Green Version]
- Höchenberger, R.; Ohla, K. Repeatability of Taste Recognition Threshold Measurements with QUEST and Quick Yes–No. Nutrients 2020, 12, 24. [Google Scholar] [CrossRef] [Green Version]
- Brauns, H.; Scherer, S.; Steinmann, S. The CASMIN Educational Classification in International Comparative Research. In Advances in Cross-National Comparison: A European Working Book for Demographic and Socio-Economic Variables; Hoffmeyer-Zlotnik, J.H.P., Wolf, C., Eds.; Springer US: Boston, MA, USA, 2003; pp. 221–244. ISBN 978-1-4419-9186-7. [Google Scholar]
- Baer, N.-R.; Zoellick, J.C.; Deutschbein, J.; Anton, V.; Bergmann, M.M.; Schenk, L. Dietary Preferences in the Context of Intra-Couple Dynamics: Relationship Types within the German NutriAct Family Cohort. Appetite 2021, 167, 105625. [Google Scholar] [CrossRef]
- Ware, J.E.; Sherbourne, C.D. The MOS 36-Item Short-Form Health Survey (SF-36). I. Conceptual Framework and Item Selection. Med. Care 1992, 30, 473–483. [Google Scholar] [CrossRef]
- Höchenberger, R.; Ohla, K. Rapid Estimation of Gustatory Sensitivity Thresholds with SIAM and QUEST. Front. Psychol. 2017, 8, 981. [Google Scholar] [CrossRef] [Green Version]
- Hardikar, S.; Höchenberger, R.; Villringer, A.; Ohla, K. Higher Sensitivity to Sweet and Salty Taste in Obese Compared to Lean Individuals. Appetite 2017, 111, 158–165. [Google Scholar] [CrossRef] [Green Version]
- Lee, M.D.; Wagenmakers, E.-J. Bayesian Cognitive Modeling: A Practical Course; Cambridge University Press: Cambridge, UK, 2013; ISBN 978-1-139-08775-9. [Google Scholar]
- The Jamovi Project. jamovi, version 1.6.23; 2021. Available online: https://www.jamovi.org (accessed on 14 February 2022).
- Gallucci, M. GAMLj: General Analyses for Linear Models, version 2.6.3; 2019. Available online: https://gamlj.github.io/ (accessed on 14 February 2022).
- Clyde, M.A. BAS: Bayesian Adaptive Sampling for Bayesian Model Averaging, R Package Version 1.6.0; 2021. Available online: https://cran.r-project.org/web/packages/BAS/index.html (accessed on 14 February 2022).
- Clyde, M.A.; Ghosh, J.; Littman, M.L. Bayesian Adaptive Sampling for Variable Selection and Model Averaging. J. Comput. Graph. Stat. 2011, 20, 80–101. [Google Scholar] [CrossRef]
- Droettboom, M.; Caswell, T.A.; Hunter, J.; Firing, E.; Nielsen, J.H.; Lee, A.; de Andrade, E.S.; Varoquaux, N.; Stansby, D.; Root, B.; et al. Matplotlib/Matplotlib, Version 2.2.2; Zenodo. 2018. Available online: https://ui.adsabs.harvard.edu/abs/2018zndo...1202077D/abstract (accessed on 14 February 2022). [CrossRef]
- Waskom, M.L. Seaborn: Statistical Data Visualization. J. Open Source Softw. 2021, 6, 3021. [Google Scholar] [CrossRef]
- Beierlein, V.; Morfeld, M.; Bergelt, C.; Bullinger, M.; Brähler, E. Messung der gesundheitsbezogenen Lebensqualität mit dem SF-8: Deutsche Normdaten aus einer repräsentativen schriftlichen Befragung. Diagnostica 2012, 58, 145–153. [Google Scholar] [CrossRef]
- McMahon, D.B.T.; Shikata, H.; Breslin, P.A.S. Are Human Taste Thresholds Similar on the Right and Left Sides of the Tongue? Chem. Senses 2001, 26, 875–883. [Google Scholar] [CrossRef]
- Keast, R.S.J.; Roper, J. A Complex Relationship among Chemical Concentration, Detection Threshold, and Suprathreshold Intensity of Bitter Compounds. Chem. Senses 2007, 32, 245–253. [Google Scholar] [CrossRef] [Green Version]
- Cowart, B.J. Relationships between Taste and Smell across the Adult Life Span. Ann. N. Y. Acad. Sci. 1989, 561, 39–55. [Google Scholar] [CrossRef] [PubMed]
- Lim, J.; Urban, L.; Green, B.G. Measures of Individual Differences in Taste and Creaminess Perception. Chem. Senses 2008, 33, 493–501. [Google Scholar] [CrossRef] [PubMed] [Green Version]
- Webb, J.; Bolhuis, D.P.; Cicerale, S.; Hayes, J.E.; Keast, R. The Relationships between Common Measurements of Taste Function. Chemosens. Percept. 2015, 8, 11–18. [Google Scholar] [CrossRef] [PubMed] [Green Version]
- Lundström, J.N.; Gordon, A.R.; Wise, P.; Frasnelli, J. Individual Differences in the Chemical Senses: Is There a Common Sensitivity? Chem. Senses 2012, 37, 371–378. [Google Scholar] [CrossRef]
- Lundström, J.N.; Boesveldt, S.; Albrecht, J. Central Processing of the Chemical Senses: An Overview. ACS Chem. Neurosci. 2011, 2, 5–16. [Google Scholar] [CrossRef]
- Bawajeeh, A.O.; Albar, S.A.; Zhang, H.; Zulyniak, M.A.; Evans, C.E.L.; Cade, J.E. Impact of Taste on Food Choices in Adolescence—Systematic Review and Meta-Analysis. Nutrients 2020, 12, 1985. [Google Scholar] [CrossRef]
- Bartoshuk, L.M.; Duffy, V.B.; Miller, I.J. PTC/PROP Tasting: Anatomy, Psychophysics, and Sex Effects. Physiol. Behav. 1994, 56, 1165–1171. [Google Scholar] [CrossRef]
- Hayes, J.E.; Keast, R.S. Two Decades of Supertasting: Where Do We Stand? Physiol. Behav. 2011, 104, 1072–1074. [Google Scholar] [CrossRef] [Green Version]
- Tepper, B.J. Nutritional Implications of Genetic Taste Variation: The Role of PROP Sensitivity and Other Taste Phenotypes. Annu. Rev. Nutr. 2008, 28, 367–388. [Google Scholar] [CrossRef]
- Lucas, L.; Riddell, L.; Liem, G.; Whitelock, S.; Keast, R. The Influence of Sodium on Liking and Consumption of Salty Food. J. Food Sci. 2011, 76, S72–S76. [Google Scholar] [CrossRef]
- Hayes, J.E.; Duffy, V.B. Oral Sensory Phenotype Identifies Level of Sugar and Fat Required for Maximal Liking. Physiol. Behav. 2008, 95, 77–87. [Google Scholar] [CrossRef] [Green Version]
- Petty, S.; Salame, C.; Mennella, J.A.; Pepino, M.Y. Relationship between Sucrose Taste Detection Thresholds and Preferences in Children, Adolescents, and Adults. Nutrients 2020, 12, 1918. [Google Scholar] [CrossRef]
- Keskitalo, K.; Tuorila, H.; Spector, T.D.; Cherkas, L.F.; Knaapila, A.; Silventoinen, K.; Perola, M. Same Genetic Components Underlie Different Measures of Sweet Taste Preference. Am. J. Clin. Nutr. 2007, 86, 1663–1669. [Google Scholar] [CrossRef]
- Low, J.Y.Q.; Lacy, K.E.; McBride, R.; Keast, R.S.J. The Association between Sweet Taste Function, Anthropometry, and Dietary Intake in Adults. Nutrients 2016, 8, 241. [Google Scholar] [CrossRef] [Green Version]
- Beauchamp, G.K.; Mennella, J.A. Flavor Perception in Human Infants: Development and Functional Significance. Digestion 2011, 83, 1–6. [Google Scholar] [CrossRef] [Green Version]
- Mennella, J.A. Ontogeny of Taste Preferences: Basic Biology and Implications for Health. Am. J. Clin. Nutr. 2014, 99, 704S–711S. [Google Scholar] [CrossRef] [Green Version]
- Trout, K.K.; Wetzel-Effinger, L. Flavor Learning In Utero and Its Implications for Future Obesity and Diabetes. Curr. Diab. Rep. 2012, 12, 60–66. [Google Scholar] [CrossRef]
- Sauer, H.; Ohla, K.; Dammann, D.; Teufel, M.; Zipfel, S.; Enck, P.; Mack, I. Changes in Gustatory Function and Taste Preference Following Weight Loss. J. Pediatr. 2017, 182, 120–126. [Google Scholar] [CrossRef] [Green Version]
- Drewnowski, A. Taste Preferences and Food Intake. Annu. Rev. Nutr. 1997, 17, 237–253. [Google Scholar] [CrossRef] [Green Version]
- Ohla, K.; Lundström, J.N. Sex Differences in Chemosensation: Sensory or Emotional? Front. Hum. Neurosci. 2013, 7, 607. [Google Scholar] [CrossRef] [Green Version]
- Segal, N.L.; Topolski, T.D.; Wilson, S.M.; Brown, K.W.; Araki, L. Twin Analysis of Odor Identification and Perception. Physiol. Behav. 1995, 57, 605–609. [Google Scholar] [CrossRef]
- Kobal, G.; Klimek, L.; Wolfensberger, M.; Gudziol, H.; Temmel, A.; Owen, C.M.; Seeber, H.; Pauli, E.; Hummel, T. Multicenter Investigation of 1,036 Subjects Using a Standardized Method for the Assessment of Olfactory Function Combining Tests of Odor Identification, Odor Discrimination, and Olfactory Thresholds. Eur. Arch. Oto-Rhino-Laryngol. 2000, 257, 205–211. [Google Scholar] [CrossRef]
- Brand, G.; Millot, J.-L. Sex Differences in Human Olfaction: Between Evidence and Enigma. Q. J. Exp. Psychol. Sect. B 2001, 54, 259–270. [Google Scholar] [CrossRef]
- Sorokowski, P.; Karwowski, M.; Misiak, M.; Marczak, M.K.; Dziekan, M.; Hummel, T.; Sorokowska, A. Sex Differences in Human Olfaction: A Meta-Analysis. Front. Psychol. 2019, 10, 242. [Google Scholar] [CrossRef] [PubMed] [Green Version]
- Yoshinaka, M.; Ikebe, K.; Uota, M.; Ogawa, T.; Okada, T.; Inomata, C.; Takeshita, H.; Mihara, Y.; Gondo, Y.; Masui, Y.; et al. Age and Sex Differences in the Taste Sensitivity of Young Adult, Young-Old and Old-Old Japanese. Geriatr. Gerontol. Int. 2016, 16, 1281–1288. [Google Scholar] [CrossRef] [PubMed]
- Gudziol, H.; Hummel, T. Normative Values for the Assessment of Gustatory Function Using Liquid Tastants. Acta Otolaryngol. 2007, 127, 658–661. [Google Scholar] [CrossRef] [PubMed]
- Hummel, T.; Kobal, G.; Gudziol, H.; Mackay-Sim, A. Normative Data for the “Sniffin’ Sticks” Including Tests of Odor Identification, Odor Discrimination, and Olfactory Thresholds: An Upgrade Based on a Group of More than 3000 Subjects. Eur. Arch. Otorhinolaryngol. 2007, 264, 237–243. [Google Scholar] [CrossRef]
- Oleszkiewicz, A.; Schriever, V.A.; Croy, I.; Hähner, A.; Hummel, T. Updated Sniffin’ Sticks Normative Data Based on an Extended Sample of 9139 Subjects. Eur. Arch. Otorhinolaryngol. 2019, 276, 719–728. [Google Scholar] [CrossRef] [Green Version]
- Murphy, C. Age-Related Effects on the Threshold, Psychophysical Function, and Pleasantness of Menthol. J. Gerontol. 1983, 38, 217–222. [Google Scholar] [CrossRef]
- Mojet, J.; Christ-Hazelhof, E.; Heidema, J. Taste Perception with Age: Generic or Specific Losses in Threshold Sensitivity to the Five Basic Tastes? Chem. Senses 2001, 26, 845–860. [Google Scholar] [CrossRef] [Green Version]
- Hayes, J.E.; Feeney, E.L.; Allen, A.L. Do Polymorphisms in Chemosensory Genes Matter for Human Ingestive Behavior? Food Qual. Prefer. 2013, 30, 202–216. [Google Scholar] [CrossRef] [Green Version]
- Balungwe, P.; Huart, C.; Matanda, R.; Bisimwa, G.; Mouraux, A.; Rombaux, P. Adaptation of the Sniffin’ Sticks Test in South-Kivu. Eur. Ann. Otorhinolaryngol. Head Neck Dis. 2020, 137, 467–471. [Google Scholar] [CrossRef]
- Delgado-Losada, M.L.; Delgado-Lima, A.H.; Bouhaben, J. Spanish Validation for Olfactory Function Testing Using the Sniffin’Sticks Olfactory Test: Threshold, Discrimination, and Identification. Brain Sci. 2020, 10, 943. [Google Scholar] [CrossRef]
- Katotomichelakis, M.; Balatsouras, D.; Tripsianis, G.; Tsaroucha, A.; Homsioglou, E.; Danielides, V. Normative Values of Olfactory Function Testing Using the ‘Sniffin’Sticks’. Laryngoscope 2007, 117, 114–120. [Google Scholar] [CrossRef]
- De Vries, Y.C.; Boesveldt, S.; Kelfkens, C.S.; Posthuma, E.E.; van den Berg, M.M.G.A.; de Kruif, J.T.C.M.; Haringhuizen, A.; Sommeijer, D.W.; Buist, N.; Grosfeld, S.; et al. Taste and Smell Perception and Quality of Life during and after Systemic Therapy for Breast Cancer. Breast Cancer Res. Treat. 2018, 170, 27–34. [Google Scholar] [CrossRef] [Green Version]
- Zou, L.-Q.; Hummel, T.; Otte, M.S.; Bitter, T.; Besser, G.; Mueller, C.A.; Welge-Lussen, A.; Bulut, O.C.; Goktas, O.; Negoias, S.; et al. Association between Olfactory Function and Quality of Life in Patients with Olfactory Disorders: A Multicenter Study in over 760 Participants. Rhinology 2021, 59, 164–172. [Google Scholar] [CrossRef]
- Croy, I.; Nordin, S.; Hummel, T. Olfactory Disorders and Quality of Life—An Updated Review. Chem. Senses 2014, 39, 185–194. [Google Scholar] [CrossRef] [Green Version]


| Women (N = 138) | Men (N = 107) | All (N = 245) | |
|---|---|---|---|
| Age (years) | 61.3 ± 5.27 | 64.1 ± 4.75 | 62.5 ± 5.23 |
| Body Mass Index (BMI) | 25.1 ± 4.3 | 26.3 ± 3.44 | 25.6 ± 3.99 |
| N smokers | 11 | 6 | 17 |
| Education level CASMIN N (%) | |||
| 3 | 82 (59.42%) | 84 (78.50%) | 166 (67.76%) |
| 2 | 54 (39.13%) | 20 (18.69%) | 74 (30.20%) |
| 1 | 2 (1.45%) | 3 (2.80%) | 5 (2.04%) |
| Eating Behavior (DEBQ) | |||
| Total | 2.39 ± 0.47 | 2.12 ± 0.4 | 2.27 ± 0.46 |
| Emotional subscale | 1.74 ± 0.66 | 1.42 ± 0.46 | 1.60 ± 0.60 |
| Restraint subscale | 2.95 ± 0.72 | 2.60 ± 0.70 | 2.79 ± 0.73 |
| External subscale | 2.49 ± 0.50 | 2.33 ± 0.47 | 2.42 ± 0.50 |
| Quality of Life (SF-8) | |||
| MCS-8 (mental) | 52.8 ± 7.63 | 52.2 ± 7.17 | 52.4 ± 7.37 |
| PCS-8 (physical) | 49.5 ± 8.45 | 49.2 ± 8.19 | 49.3 ± 8.29 |
| Sour | Salty | Bitter | Sweet | Rose | ||||||
|---|---|---|---|---|---|---|---|---|---|---|
| Sour | - | |||||||||
| Salty | 0.520 | *** | - | |||||||
| Bitter | 0.538 | *** | 0.527 | *** | - | |||||
| Sweet | 0.514 | *** | 0.527 | *** | 0.46 | *** | - | |||
| Rose | 0.014 | 0.049 | 0.058 | −0.002 | - | |||||
Publisher’s Note: MDPI stays neutral with regard to jurisdictional claims in published maps and institutional affiliations. |
© 2022 by the authors. Licensee MDPI, Basel, Switzerland. This article is an open access article distributed under the terms and conditions of the Creative Commons Attribution (CC BY) license (https://creativecommons.org/licenses/by/4.0/).
Share and Cite
Lim, S.X.L.; Höchenberger, R.; Busch, N.A.; Bergmann, M.; Ohla, K. Associations between Taste and Smell Sensitivity, Preference and Quality of Life in Healthy Aging—The NutriAct Family Study Examinations (NFSE) Cohort. Nutrients 2022, 14, 1141. https://doi.org/10.3390/nu14061141
Lim SXL, Höchenberger R, Busch NA, Bergmann M, Ohla K. Associations between Taste and Smell Sensitivity, Preference and Quality of Life in Healthy Aging—The NutriAct Family Study Examinations (NFSE) Cohort. Nutrients. 2022; 14(6):1141. https://doi.org/10.3390/nu14061141
Chicago/Turabian StyleLim, Shirley X. L., Richard Höchenberger, Niko A. Busch, Manuela Bergmann, and Kathrin Ohla. 2022. "Associations between Taste and Smell Sensitivity, Preference and Quality of Life in Healthy Aging—The NutriAct Family Study Examinations (NFSE) Cohort" Nutrients 14, no. 6: 1141. https://doi.org/10.3390/nu14061141