Genetic Biomarkers of Metabolic Detoxification for Personalized Lifestyle Medicine

 , , ,
, , ,
Abstract
:1. Introduction
2. Clinically Tested Genetic Variants within Genes Involved in Phase I/Phase II Detox Reactions
2.1. Phase I Detox Enzymes
2.1.1. Cytochrome P-450 1A2
2.1.2. Cytochrome P450 1B1
2.2. Phase II Detox Enzymes
2.2.1. Glutathione S-Transferases Mu 1 (GSTM1) and Theta 1 (GSTT1)
2.2.2. Catechol-O-Methyltransferase (COMT)
2.2.3. Bilirubin Uridine Diphosphate Glucuronosyl Transferase
3. Validation of Genetic Variants of Detox Metabolism in Real-World Clinical Settings
4. Conclusions
Author Contributions
Funding
Institutional Review Board Statement
Informed Consent Statement
Data Availability Statement
Acknowledgments
Conflicts of Interest
References
- Norman, R.E.; Carpenter, D.O.; Scott, J.; Brune, M.N.; Sly, P.D. Environmental exposures: An underrecognized contribution to non-communicable diseases. Rev. Environ. Health 2013, 28, 59–65. [Google Scholar] [CrossRef] [PubMed] [Green Version]
- Moulton, P.V.; Yang, W. Air pollution, oxidative stress, and Alzheimer’s disease. J. Environ. Public Health 2012, 2012, 472751. [Google Scholar] [CrossRef] [PubMed]
- Grimaldi, K.A.; van Ommen, B.; Ordovas, J.M.; Parnell, L.D.; Mathers, J.C.; Bendik, I.; Brennan, L.; Celis-Morales, C.; Cirillo, E.; Daniel, H.; et al. Proposed guidelines to evaluate scientific validity and evidence for geno-type-based dietary advice. Genes Nutr. 2017, 12, 35. [Google Scholar] [CrossRef] [PubMed] [Green Version]
- Eaton, D.L.; Gallagher, E.P.; Bammler, T.K.; Kunze, K.L. Role of cytochrome P4501A2 in chemical carcinogenesis: Implications for human variability in expression and enzyme activity. Pharmacogenetics 1995, 5, 259–274. [Google Scholar] [CrossRef] [PubMed]
- Horn, T.L.; Reichert, M.A.; Bliss, R.L.; Malejka-Giganti, D. Modulations of P450 mRNA in liver and mammary gland and P450 ac-tivities and metabolism of estrogen in liver by treatment of rats with indole-3-carbinol. Biochem. Pharmacol. 2002, 64, 393–404. [Google Scholar] [CrossRef]
- Nakajima, M.; Yokoi, T.; Mizutani, M.; Kinoshitah, M.; Funayama, M.; Kamataki, T. Genetic Polymorphism in the 5′-Flanking Region of HumanCYP1A2 Gene: Effect on the CYP1A2 Inducibility in Humans. J. Biochem. 1999, 125, 803–808. [Google Scholar] [CrossRef]
- Ghotbi, R.; Christensen, M.; Roh, H.-K.; Ingelman-Sundberg, M.; Aklillu, E.; Bertilsson, L. Comparisons of CYP1A2 genetic polymorphisms, enzyme activity and the genotype-phenotype relationship in Swedes and Koreans. Eur. J. Clin. Pharmacol. 2007, 63, 537–546. [Google Scholar] [CrossRef] [PubMed]
- Gunes, A.; Ozbey, G.; Vural, E.H.; Uluoglu, C.; Scordo, M.G.; Zengil, H.; Dahl, M.-L. Influence of genetic polymorphisms, smoking, gender and age on CYP1A2 activity in a Turkish population. Pharmacogenomics 2009, 10, 769–778. [Google Scholar] [CrossRef] [PubMed]
- Sachse, C.; Brockmöller, J.; Bauer, S.; Roots, I. Functional significance of a C→A polymorphism in intron 1 of the cytochrome P450 CYP1A2 gene tested with caffeine. Br. J. Clin. Pharmacol. 1999, 47, 445–449. [Google Scholar] [CrossRef] [PubMed] [Green Version]
- Djordjevic, N.; Ghotbi, R.; Jankovic, S.; Aklillu, E. Induction of CYP1A2 by heavy coffee consumption is associated with the CYP1A2−163C>A polymorphism. Eur. J. Clin. Pharmacol. 2010, 66, 697–703. [Google Scholar] [CrossRef] [PubMed]
- Wang, L.; Hu, Z.; Deng, X.; Wang, Y.; Zhang, Z.; Cheng, Z.-N. Association between CommonCYP1A2Polymorphisms and Theophylline Metabolism in Non-smoking Healthy Volunteers. Basic Clin. Pharmacol. Toxicol. 2013, 112, 257–263. [Google Scholar] [CrossRef] [PubMed]
- Taioli, E.; Garte, S.J.; Trachman, J.; Garbers, S.; Sepkovic, D.W.; Osborne, M.P.; Mehl, S.; Bradlow, H.L. Ethnic Differences in Estrogen Metabolism in Healthy Women. JNCI J. Natl. Cancer Inst. 1996, 88, 617. [Google Scholar] [CrossRef] [PubMed] [Green Version]
- Vistisen, K.; Loft, S.; Olsen, J.H.; Vallentin, S.; Ottesen, S.; Hirsch, F.R.; Poulsen, H.E. Low CYP1A2 activity associated with testicular cancer. Carcinogenesis 2004, 25, 923–929. [Google Scholar] [CrossRef] [PubMed]
- Danielson, P.Á. The Cytochrome P450 Superfamily: Biochemistry, Evolution and Drug Metabolism in Humans. Curr. Drug Metab. 2002, 3, 561–597. [Google Scholar] [CrossRef] [PubMed]
- Božina, N.; Bradamante, V.; Lovrić, M. Genetic Polymorphism of Metabolic Enzymes P450 (CYP) as a Susceptibility Factor for Drug Response, Toxicity, and Cancer Risk. Arch. Ind. Hyg. Toxicol. 2009, 60, 217–242. [Google Scholar] [CrossRef] [PubMed]
- Palatini, P.; Ceolotto, G.; Ragazzo, F.; Dorigatti, F.; Saladini, F.; Papparella, I.; Mos, L.; Zanata, G.; Santonastaso, M. CYP1A2 genotype modifies the association between coffee intake and the risk of hypertension. J. Hypertens. 2009, 27, 1594–1601. [Google Scholar] [CrossRef] [PubMed] [Green Version]
- Cornelis, M.C.; El-Sohemy, A.; Kabagambe, E.K.; Campos, H. Coffee, CYP1A2 Genotype, and Risk of Myocardial Infarction. JAMA J. Am. Med. Assoc. 2006, 295, 1135–1141. [Google Scholar] [CrossRef] [PubMed] [Green Version]
- El-Sohemy, A.; Cornelis, M.C.; Kabagambe, E.K.; Campos, H. Coffee, CYP1A2 genotype and risk of myocardial infarction. Genes Nutr. 2007, 2, 155–156. [Google Scholar] [CrossRef] [Green Version]
- Peterson, S.; Schwarz, Y.; Li, S.S.; Li, L.; King, I.B.; Chen, C.; Eaton, D.L.; Potter, J.; Lampe, J.W. CYP1A2, GSTM1, and GSTT1 Polymorphisms and Diet Effects on CYP1A2 Activity in a Crossover Feeding Trial. Cancer Epidemiol. Biomark. Prev. 2009, 18, 3118–3125. [Google Scholar] [CrossRef] [PubMed] [Green Version]
- Wilms, L.C.; Boots, A.W.; De Boer, V.C.; Maas, L.M.; Pachen, D.M.; Gottschalk, R.W.; Ketelslegers, H.B.; Godschalk, R.W.; Haenen, G.R.; van Schooten, F.J.; et al. Impact of multiple genetic polymorphisms on effects of a 4-week blueberry juice in-tervention on ex vivo induced lymphocytic DNA damage in human volunteers. Carcinogenesis 2007, 28, 1800–1806. [Google Scholar] [CrossRef] [PubMed]
- Li, N.; Mu, Y.; Liu, Z.; Deng, Y.; Guo, Y.; Zhang, X.; Li, X.; Yu, P.; Wang, Y.; Zhu, J. Assessment of interaction between maternal polycyclic aromatic hydrocarbons exposure and genetic polymorphisms on the risk of congenital heart diseases. Sci. Rep. 2018, 8, 3075. [Google Scholar] [CrossRef] [PubMed]
- Lampe, J.W.; Chen, C.; Li, S.; Prunty, J.; Grate, M.T.; Meehan, E.D.; Barale, K.V.; Dightman, A.D.; Feng, Z.; Potter, J. Modulation of human glutathione S-transferases by botanically defined vegetable diets. Cancer Epidemiol. Biomark. Prev. 2000, 9, 787–793. [Google Scholar]
- Bailey, L.R.; Roodi, N.; Dupont, W.D.; Parl, F.F. Association of cytochrome P450 1B1 (CYP1B1) polymorphism with steroid receptor status in breast cancer. Cancer Res. 1998, 58, 5038–5041. [Google Scholar] [PubMed]
- Paracchini, V.; Raimondi, S.; Gram, I.T.; Kang, D.; Kocabas, N.A.; Kristensen, V.N.; Li, D.; Parl, F.F.; Rylander-Rudqvist, T.; Soucek, P.; et al. Meta- and pooled analyses of the cytochrome P-450 1B1 Val432Leu polymorphism and breast cancer: A HuGE-GSEC review. Am. J. Epidemiol. 2007, 165, 115–125. [Google Scholar] [CrossRef] [PubMed] [Green Version]
- Chen, Y.; Xiao, P.; Ou-Yang, D.-S.; Fan, L.; Guo, D.; Wang, Y.-N.; Han, Y.; Tu, J.-H.; Zhou, G.; Huang, Y.-F.; et al. Simultaneous action of the flavonoid quercetin on cytochrome p450 (cyp) 1a2, cyp2a6,n-acetyltransferase and xanthine oxidase activity in healthy volunteers. Clin. Exp. Pharmacol. Physiol. 2009, 36, 828–833. [Google Scholar] [CrossRef] [PubMed]
- Moyer, A.M.; Salavaggione, O.E.; Hebbring, S.J.; Moon, I.; Hildebrandt, M.A.; Eckloff, B.W.; Schaid, D.J.; Wieben, E.D.; Weinshilboum, R.M. GlutathioneS-Transferase T1 and M1: Gene Sequence Variation and Functional Genomics. Clin. Cancer Res. 2007, 13, 7207–7216. [Google Scholar] [CrossRef] [PubMed] [Green Version]
- Huang, R.S.; Chen, P.; Wisel, S.; Duan, S.; Zhang, W.; Cook, E.H.; Das, S.; Cox, N.J.; Dolan, M.E. Population-specific GSTM1 copy number variation. Hum. Mol. Genet. 2008, 18, 366–372. [Google Scholar] [CrossRef] [PubMed] [Green Version]
- Carlsten, C.; Sagoo, G.S.; Frodsham, A.J.; Burke, W.; Higgins, J.P.T. Glutathione S-Transferase M1 (GSTM1) Polymorphisms and Lung Cancer: A Literature-based Systematic HuGE Review and Meta-Analysis. Am. J. Epidemiol. 2008, 167, 759–774. [Google Scholar] [CrossRef] [Green Version]
- McDougle, C.J.; Price, L.H.; Goodman, W.K.; Charney, D.S.; Heninger, G.R. A controlled trial of lithium augmentation in fluvoxam-ine-refractory obsessive-compulsive disorder: Lack of efficacy. J. Clin. Psychopharmacol. 1991, 11, 175–184. [Google Scholar] [CrossRef] [PubMed]
- Nagle, C.M.; Chenevix-Trench, G.; Spurdle, A.B.; Webb, P.M. The role of glutathione-S-transferase polymorphisms in ovarian cancer survival. Eur. J. Cancer 2007, 43, 283–290. [Google Scholar] [CrossRef] [PubMed]
- Ott, K.; Lordick, F.; Becker, K.; Ulm, K.; Siewert, J.; Höfler, H.; Keller, G. Glutathione-S-transferase P1, T1 and M1 genetic polymorphisms in neoadjuvant-treated locally advanced gastric cancer: GSTM1-present genotype is associated with better prognosis in completely resected patients. Int. J. Color. Dis. 2008, 23, 773–782. [Google Scholar] [CrossRef] [PubMed]
- Gasper, A.V.; Al-Janobi, A.; Smith, J.A.; Bacon, J.R.; Fortun, P.; Atherton, C.; Taylor, M.; Hawkey, C.J.; Barrett, D.; Mithen, R.F. Glutathione S-transferase M1 polymorphism and metabolism of sulforaphane from standard and high-glucosinolate broccoli. Am. J. Clin. Nutr. 2005, 82, 1283–1291. [Google Scholar] [CrossRef] [PubMed]
- Steck, S.E.; Gammon, M.D.; Hebert, J.R.; Wall, D.E.; Zeisel, S.H. GSTM1, GSTT1, GSTP1, and GSTA1 polymorphisms and urinary isothiocyanate metabolites following broccoli consumption in humans. J. Nutr. 2007, 137, 904–909. [Google Scholar] [CrossRef] [PubMed] [Green Version]
- London, S.J.; Yuan, J.-M.; Chung, F.-L.; Gao, Y.-T.; Coetzee, A.G.; Ross, R.K.; Yu, M.C. Isothiocyanates, glutathione S-transferase M1 and T1 polymorphisms, and lung-cancer risk: A prospective study of men in Shanghai, China. Lancet 2000, 356, 724–729. [Google Scholar] [CrossRef]
- Brennan, P.; Hsu, C.C.; Moullan, N.; Szeszenia-Dabrowska, N.; Lissowska, J.; Zaridze, D.; Rudnai, P.; Fabianova, E.; Mates, D.; Bencko, V.; et al. Effect of cruciferous vegetables on lung cancer in patients stratified by genetic status: A mendelian randomisation approach. Lancet 2005, 366, 1558–1560. [Google Scholar] [CrossRef]
- Moy, K.A.; Yuan, J.-M.; Chung, F.-L.; Wang, X.-L.; Berg, D.V.D.; Wang, R.; Gao, Y.-T.; Yu, M.C. Isothiocyanates, glutathione S-transferase M1 and T1 polymorphisms and gastric cancer risk: A prospective study of men in Shanghai, China. Int. J. Cancer 2009, 125, 2652–2659. [Google Scholar] [CrossRef] [Green Version]
- Gaudet, M.; Olshan, A.; Poole, C.; Weissler, M.; Watson, M.; Bell, D. Diet, GSTM1 and GSTT1 and head and neck cancer. Carcinogenesis 2003, 25, 735–740. [Google Scholar] [CrossRef] [Green Version]
- Ambrosone, C.B.; McCann, S.E.; Freudenheim, J.L.; Marshall, J.R.; Zhang, Y.; Shields, P.G. Breast Cancer Risk in Premenopausal Women Is Inversely Associated with Consumption of Broccoli, a Source of Isothiocyanates, but Is Not Modified by GST Genotype. J. Nutr. 2004, 134, 1134–1138. [Google Scholar] [CrossRef]
- Joseph, M.A.; Moysich, K.B.; Freudenheim, J.L.; Shields, P.G.; Bowman, E.D.; Zhang, Y.; Marshall, J.R.; Ambrosone, C.B. Cruciferous Vegetables, Genetic Polymorphisms in Glutathione S-Transferases M1 and T1, and Prostate Cancer Risk. Nutr. Cancer 2004, 50, 206–213. [Google Scholar] [CrossRef]
- Wang, L.I.; Giovannucci, E.L.; Hunter, D.; Neuberg, D.; Su, L.; Christiani, D.C. Dietary intake of Cruciferous vegetables, Glutathione S-transferase (GST) polymorphisms and lung cancer risk in a Caucasian population. Cancer Causes Control 2004, 15, 977–985. [Google Scholar] [CrossRef]
- Navarro, S.L.; Chang, J.L.; Peterson, S.; Chen, C.; King, I.B.; Schwarz, Y.; Li, S.S.; Li, L.; Potter, J.D.; Lampe, J.W. Modulation of human serum glutathione S-transferase A1/2 concentration by cru-ciferous vegetables in a controlled feeding study is influenced by GSTM1 and GSTT1 genotypes. Cancer Epidemiol. Biomark. Prev. 2009, 18, 2974–2978. [Google Scholar] [CrossRef] [PubMed] [Green Version]
- Navarro, S.; Peterson, S.; Chen, C.; Makar, K.W.; Schwarz, Y.; King, I.B.; Li, S.S.; Li, L.; Kestin, M.; Lampe, J.W. Cruciferous Vegetable Feeding Alters UGT1A1 Activity: Diet- and Genotype-Dependent Changes in Serum Bilirubin in a Controlled Feeding Trial. Cancer Prev. Res. 2009, 2, 345–352. [Google Scholar] [CrossRef] [PubMed] [Green Version]
- Riso, P.; Brusamolino, A.; Moro, M.; Porrini, M. Absorption of bioactive compounds from steamed broccoli and their effect on plasma glutathione S-transferase activity. Int. J. Food Sci. Nutr. 2009, 60, 56–71. [Google Scholar] [CrossRef]
- Navarro, S.; Schwarz, Y.; Song, X.; Wang, C.-Y.; Chen, C.; Trudo, S.P.; Kristal, A.R.; Kratz, M.; Eaton, D.L.; Lampe, J.W. Cruciferous Vegetables Have Variable Effects on Biomarkers of Systemic Inflammation in a Randomized Controlled Trial in Healthy Young Adults. J. Nutr. 2014, 144, 1850–1857. [Google Scholar] [CrossRef] [Green Version]
- Yuan, J.-M.; Murphy, S.E.; Stepanov, I.; Wang, R.; Carmella, S.G.; Nelson, H.; Hatsukami, D.; Hecht, S.S. 2-Phenethyl Isothiocyanate, Glutathione S-transferase M1 and T1 Polymorphisms, and Detoxification of Volatile Organic Carcinogens and Toxicants in Tobacco Smoke. Cancer Prev. Res. 2016, 9, 598–606. [Google Scholar] [CrossRef] [PubMed] [Green Version]
- Cho, M.-R.; Han, J.-H.; Lee, H.-J.; Park, Y.K.; Kang, M.-H. Purple grape juice supplementation in smokers and antioxidant status according to different types of GST polymorphisms. J. Clin. Biochem. Nutr. 2015, 56, 49–56. [Google Scholar] [CrossRef] [Green Version]
- Doyle, A.E.S.; Goodman, J.E.; Silber, P.M.; Yager, J.D. Catechol-O-methyltransferase low activity genotype (COMTLL) is associated with low levels of COMT protein in human hepatocytes. Cancer Lett. 2004, 214, 189–195. [Google Scholar] [CrossRef] [PubMed]
- Chen, J.; Lipska, B.K.; Halim, N.; Ma, Q.D.; Matsumoto, M.; Melhem, S.; Kolachana, B.S.; Hyde, T.M.; Herman, M.M.; Apud, J.; et al. Functional Analysis of Genetic Variation in Catechol-O-Methyltransferase (COMT): Effects on mRNA, Protein, and Enzyme Activity in Postmortem Human Brain. Am. J. Hum. Genet. 2004, 75, 807–821. [Google Scholar] [CrossRef] [Green Version]
- Ghisari, M.; Long, M.; Røge, D.M.; Olsen, J.; Bonefeld-Jørgensen, E.C. Polymorphism in xenobiotic and estrogen metabolizing genes, exposure to perfluorinated compounds and subsequent breast cancer risk: A nested case-control study in the Danish National Birth Cohort. Environ. Res. 2017, 154, 325–333. [Google Scholar] [CrossRef]
- Lorenz, M.; Paul, F.; Moobed, M.; Baumann, G.; Zimmermann, B.F.; Stangl, K.; Stangl, V. The activity of catechol-O-methyltransferase (COMT) is not impaired by high doses of epigallocatechin-3-gallate (EGCG) in vivo. Eur. J. Pharmacol. 2014, 740, 645–651. [Google Scholar] [CrossRef]
- Inoue-Choi, M.; Yuan, J.M.; Yang, C.S.; Van Den Berg, D.J.; Lee, M.J.; Gao, Y.T.; Yu, M.C. Genetic Association Between the COMT Genotype and Urinary Levels of Tea Poly-phenols and Their Metabolites among Daily Green Tea Drinkers. Int. J. Mol. Epidemiol. Genet. 2010, 1, 114–123. [Google Scholar] [PubMed]
- Brown, A.L.; Lane, J.; Holyoak, C.; Nicol, B.; Mayes, A.E.; Dadd, T. Health effects of green tea catechins in overweight and obese men: A randomised controlled cross-over trial. Br. J. Nutr. 2011, 106, 1880–1889. [Google Scholar] [CrossRef] [PubMed] [Green Version]
- Miller, R.J.; Jackson, K.G.; Dadd, T.; Mayes, A.E.; Brown, A.L.; Minihane, A.M. The impact of the catechol-O-methyltransferase genotype on the acute responsiveness of vascular reactivity to a green tea extract. Br. J. Nutr. 2010, 105, 1138–1144. [Google Scholar] [CrossRef] [PubMed] [Green Version]
- Miller, R.J.; Jackson, K.G.; Dadd, T.; Mayes, A.E.; Brown, A.L.; Lovegrove, J.A.; Minihane, A.M. The impact of the catechol-O-methyltransferase genotype on vascular function and blood pressure after acute green tea ingestion. Mol. Nutr. Food Res. 2012, 56, 966–975. [Google Scholar] [CrossRef] [PubMed]
- Dostal, A.M.; Arikawa, A.; Espejo, L.; Bedell, S.; Kurzer, M.S.; Stendell-Hollis, N.R. Green tea extract and catechol-O-methyltransferase genotype modify the post-prandial serum insulin response in a randomised trial of overweight and obese post-menopausal women. J. Hum. Nutr. Diet. 2016, 30, 166–176. [Google Scholar] [CrossRef] [PubMed] [Green Version]
- de la Torre, R.; Corella, D.; Castaner, O.; Martínez-González, M.A.; Salas-Salvador, J.; Vila, J.; Estruch, R.; Sorli, J.V.; Arós, F.; Fiol, M.; et al. Protective effect of homovanillyl alcohol on cardiovascular disease and total mortality: Virgin olive oil, wine, and catechol-methylation. Am. J. Clin. Nutr. 2017, 105, 1297–1304. [Google Scholar] [CrossRef]
- Bosma, P.J.; Chowdhury, J.R.; Bakker, C.; Gantla, S.; de Boer, A.; Oostra, B.A.; Lindhout, D.; Tytgat, G.M.J.; Jansen, P.J.M.; Oude Elferink, R.J.; et al. The genetic basis of the reduced expression of bilirubin UDP-glucuronosyltransferase 1 in Gilbert’s syndrome. N. Engl. J. Med. 1995, 333, 1171–1175. [Google Scholar] [CrossRef]
- Guillemette, C.; Millikan, R.C.; Newman, B.; Housman, E.D. Genetic polymorphisms in uridine diphospho-glucuronosyltransferase 1A1 and association with breast cancer among African Americans. Cancer Res. 2000, 60, 950–956. [Google Scholar]
- Danoff, T.M.; Campbell, D.A.; McCarthy, L.C.; Lewis, K.F.; Repasch, M.H.; Saunders, A.M.; Spurr, N.K.; Purvis, I.J.; Roses, A.D.; Xu, C.-A. Gilbert’s syndrome UGT1A1 variant confers susceptibility to tranilast-induced hyperbilirubinemia. Pharm. J. 2004, 4, 49–53. [Google Scholar] [CrossRef] [Green Version]
- Perera, M.A.; Innocenti, F.; Ratain, M.J. Pharmacogenetic testing for uridine diphosphate glucuronosyltransferase 1A1 polymor-phisms: Are we there yet? Pharmacotherapy 2008, 28, 755–768. [Google Scholar] [CrossRef]
- Palomaki, G.E.; Bradley, L.A.; Douglas, M.P.; Kolor, K.; Dotson, W.D. Can UGT1A1 genotyping reduce morbidity and mortality in patients with metastatic colorectal cancer treated with irinotecan? An evidence-based review. Genet. Med. 2009, 11, 21–34. [Google Scholar] [CrossRef] [PubMed] [Green Version]
- Saracino, M.R.; Bigler, J.; Schwarz, Y.; Chang, J.-L.; Li, S.; Li, L.; White, E.; Potter, J.D.; Lampe, J.W. Citrus Fruit Intake Is Associated with Lower Serum Bilirubin Concentration among Women with the UGT1A1*28 Polymorphism. J. Nutr. 2009, 139, 555–560. [Google Scholar] [CrossRef] [PubMed] [Green Version]
- Lamb, J.J.; Stone, M.; D’Adamo, C.R.; Volkov, A.; Metti, D.; Aronica, L.; Minich, D.; Leary, M.; Class, M.; Carullo, M.; et al. Personalized Lifestyle Intervention and Functional Evaluation Health Outcomes SurvEy: Presentation of the LIFEHOUSE Study Using N-of-One Tent–Umbrella–Bucket Design. J. Pers. Med. 2022, 12, 115. [Google Scholar] [CrossRef] [PubMed]
- Lee, D.-H.; Jacobs, D.R. Is serum gamma-glutamyltransferase a marker of exposure to various environmental pollutants? Free Radic. Res. 2009, 43, 533–537. [Google Scholar] [CrossRef] [PubMed]
- Lee, D.H.; Jacobs, D.R., Jr. Serum gamma-glutamyltransferase: New insights about an old enzyme. J. Epidemiol. Community Health 2009, 63, 884–886. [Google Scholar] [CrossRef] [PubMed]
- Perna, A.F.; Ingrosso, D.; De Santo, N.G. Homocysteine and oxidative stress. Amino Acids 2003, 25, 409–417. [Google Scholar] [CrossRef] [PubMed]
- Perna, A.F.; Capasso, R.; Acanfora, F.; Satta, E.; Lombardi, G.; Ingrosso, D.; Violetti, E.; Maddalena, M.; De Santo, N.G. Toxic effects of hyperhomocysteinemia in chronic renal failure and in uremia: Cardi-ovascular and metabolic consequences. Semin. Nephrol. 2006, 26, 20–23. [Google Scholar] [CrossRef] [PubMed]
- Kaplan, P.; Tatarkova, Z.; Sivonova, M.K.; Racay, P.; Lehotsky, J. Homocysteine and Mitochondria in Cardiovascular and Cere-brovascular Systems. Int. J. Mol. Sci. 2020, 21, 7698. [Google Scholar] [CrossRef] [PubMed]
- Richardson, M.L.; Bowron, J.M. The fate of pharmaceutical chemicals in the aquatic environment. J. Pharm. Pharmacol. 2011, 37, 1–12. [Google Scholar] [CrossRef] [PubMed]
- Kattoor, A.J.; Pothineni, N.V.K.; Palagiri, D.; Mehta, J.L. Oxidative Stress in Atherosclerosis. Curr. Atheroscler. Rep. 2017, 19, 42. [Google Scholar] [CrossRef] [PubMed]


| Phase I Detox Enzymes | ||
|---|---|---|
| CYP1A2 | ||
| Effect allele | Allele frequency | Effects on enzymatic function |
| rs762551-C Strength of evidence: Convincing (A). |  | C-allele carriers produce an enzyme variant with 62–70% lower activity and are less inducible by xenobiotics. Low CYP1A activity can result in decreased clearance of toxins, a lower 2/16-alpha hydroxyestrone ratio, and a higher risk of certain cancers. Consequently, lower production of reactive detoxification intermediates may reduce oxidative stress. |
| CYP1B1 | ||
| Effect allele | Allele frequency | Effects on enzymatic function |
| rs1056836-C Strength of evidence: Possible (C). |  | Individuals with the CC genotype tend to have higher enzymatic activity than G-allele carriers, which may result in greater activation of toxicants, greater production of 4-hydroxy estrogens, and greater oxidative damage. The effects of this SNP are affected by age, ethnicity, and menopausal status. |
| Phase II detox enzymes | ||
| GSTM1 | ||
| Effect allele | Allele frequency | Effects on enzymatic function |
| GSTM1 deletion GSTT1 deletion Strength of evidence: Probable (B). |  * -: deletion; +: present | Individuals carrying GSTM1 or GSTT1 double deletions (-/- genotype) may have a decreased ability to detoxify environmental toxicants, carcinogens, and products of oxidative stress. Gene deletions are more frequent among Caucasian and Asian populations and less frequent in African populations. Different segmental deletions have different frequencies in the population and between different ethnicities. |
| COMT | ||
| Effect allele | Allele frequency | Effects on enzymatic function |
| rs4680-A Strength of evidence: Probable (B). |  | The A allele (Met) produces an enzyme with 40 % lower activity than that encoded by the G allele (Val). A-allele carriers may have a decreased ability to degrade neurotransmitters, estrogen, and various xenobiotics. This may result in increased sensitivity to environmental toxicants, a higher risk of developing neuropsychiatric disorders, and impaired estrogen metabolism. |
| UGT1A1 | ||
| Effect allele | Allele frequency | Effects on enzymatic function |
| rs3064744-TA Strength of evidence: Possible (C). |  | Individuals carrying two insertion alleles (TA/TA genotype) may have a lower enzymatic activity than those carrying at most one copy of the deletion allele (-). This may result in increased toxicity in response to certain drugs (acetaminophen) and to a benign cardio-protective condition known as Gilbert syndrome, characterized by increased serum levels of total and unconjugated bilirubin. |
| Food/Nutrient | Gene | Effects on Enzymatic Function |
|---|---|---|
| Caffeine | CYP1A2 | Caffeine is an inducer and substrate of CYP1A2. rs762551-C allele carriers are “slow” caffeine metabolizers, and they should limit coffee consumption to <1 cup/day or caffeine from other drinks to <100 mg/day to avoid being at higher risks of hypertension and myocardial infarction. In contrast, those with the AA genotype are “rapid” caffeine metabolizers and may benefit from consuming 1–4 cups of coffee/day due to increased consumption of phytonutrients presumed to be protective against heart disease. |
| Cruciferous vegetables (broccoli, Brussels sprouts, cauliflower, watercress, and cabbage) | CYP1A2 | May increase CYP1A2 activity, but it is unclear whether the magnitude of this effect may depend on CYP1A genotype. |
| GSTM1, GSTT1 | Individuals carrying gene deletions in GSTM1 or GSTT1, especially those carrying deletions in both genes, may have a more rapid excretion of bioactive nutrients found in cruciferous vegetables such as isothiocyanates and sulforaphane. Consequently, they may need to consume greater amounts of cruciferous vegetables than those who carry at least one copy of either GSTM1 or GSTT1. On the other side, double-deletion carriers tend to experience a greater increase in GST activity and GST-mediated detoxification upon consumption of cruciferous vegetables or cruciferous-based supplements such as 2-phenethyl isothiocyanate (PEITC). The GST-inducing effects of cruciferous vegetables are more pronounced in females than in males. | |
| UGT1A1 | May decrease serum bilirubin levels in rs3064744-TA allele carriers with greater effects observed for TA/TA homozygous. | |
| Apiaceous vegetables (carrots, celery, dill, parsley, parsnips, etc.) | CYP1A2 | May decrease CYP1A2 activity, but it is unclear whether the magnitude of this effect may depend on CYP1A genotype. May exert inhibitory effects on GSTM-1 in men, not women, who carry at least one copy of the GSTM1 gene. |
| GSTM1, GSTT1 | May exert inhibitory effects on GSTM1 in men, not women, who carry at least one copy of the GSTM1 gene. | |
| UGTA1 | May decrease serum bilirubin levels in rs3064744-TA allele carriers with greater effects observed for TA/TA homozygous. | |
| Quercetin and antioxidant rich foods (citrus fruits, apples, onions, red wine, olive oil, dark berries, etc.) | CYP1B1 | Quercetin may reduce oxidative stress to a greater extent in rs1056836-G allele carriers than in those with the CC genotype. These findings were made with quercetin from fruit juices at doses significantly lower (~100 mg) than those typically used for supplementation (500–1000 mg). |
| GSTM1, GSTT1 | Quercetin and other antioxidants from blueberry, apples, and purple grapes may reduce oxidative stress to a greater extent in GST double deletion carriers than GST-positive individuals. Smokers who carry GST deletions may especially benefit from supplementation with antioxidants because carcinogens in cigarette smoke can overload their detox capacity and induce a higher production of ROS byproducts. However, quercetin and other antioxidants seem to improve certain oxidative stress markers such as glutathione levels and vitamin C to a greater extent in those with at least one copy of GSTM-1 or GSTT-1. | |
| Tea catechins | COMT | Individuals with the rs4680 AA genotype, who have slow COMT activity, may be slow catechin metabolizers and retain more catechins in the blood than those with the GG genotype. As a result, they may benefit from a lower intake of tea catechins. In contrast, those with the GG genotype, who have higher COMT activity, may be more sensitive to the short-term effects of tea catechins, such as an increase in insulin secretion and blood pressure (BP). |
| Olive oil, red wine | COMT | Individuals with the rs4680 GG genotype, who have higher COMT activity, may experience the health benefits of olive oil and red wine at lower intakes than those with the AA genotype. This is due to a greater ability to convert hydroxytyrosol, a phenolic compound in virgin olive oil and red wine, into its cardioprotective metabolite homovanillyl alcohol (HVAL). |
| Citrus fruit | UGT1A1 | May help lower serum bilirubin in women with the rs3064744 TA/TA genotype. These effects may be noticeable in all TA allele carriers. |
| Mean (SD) | |
|---|---|
| n = 157 | |
| Age, years | 43 (11) |
| Sex | |
| Female | 106 (68%) |
| Male | 51 (32%) |
| Ethnicity | |
| Caucasian | 77 (49%) |
| Asian | 20 (13%) |
| African American | 4 (2%) |
| Mediterranean | 5 (3%) |
| Northern European | 14 (9%) |
| Native American | 6 (4%) |
| Other | 19 (12%) |
| Homocysteine (µmol/L) | 9.1 (3) |
| Missing | 3 (2%) |
| oxLDL (U/L) | 44 (13.8) |
| Missing | 26 (16%) |
| GGT (U/L) | 22.5 (16.7) |
| Missing | 3 (2%) |
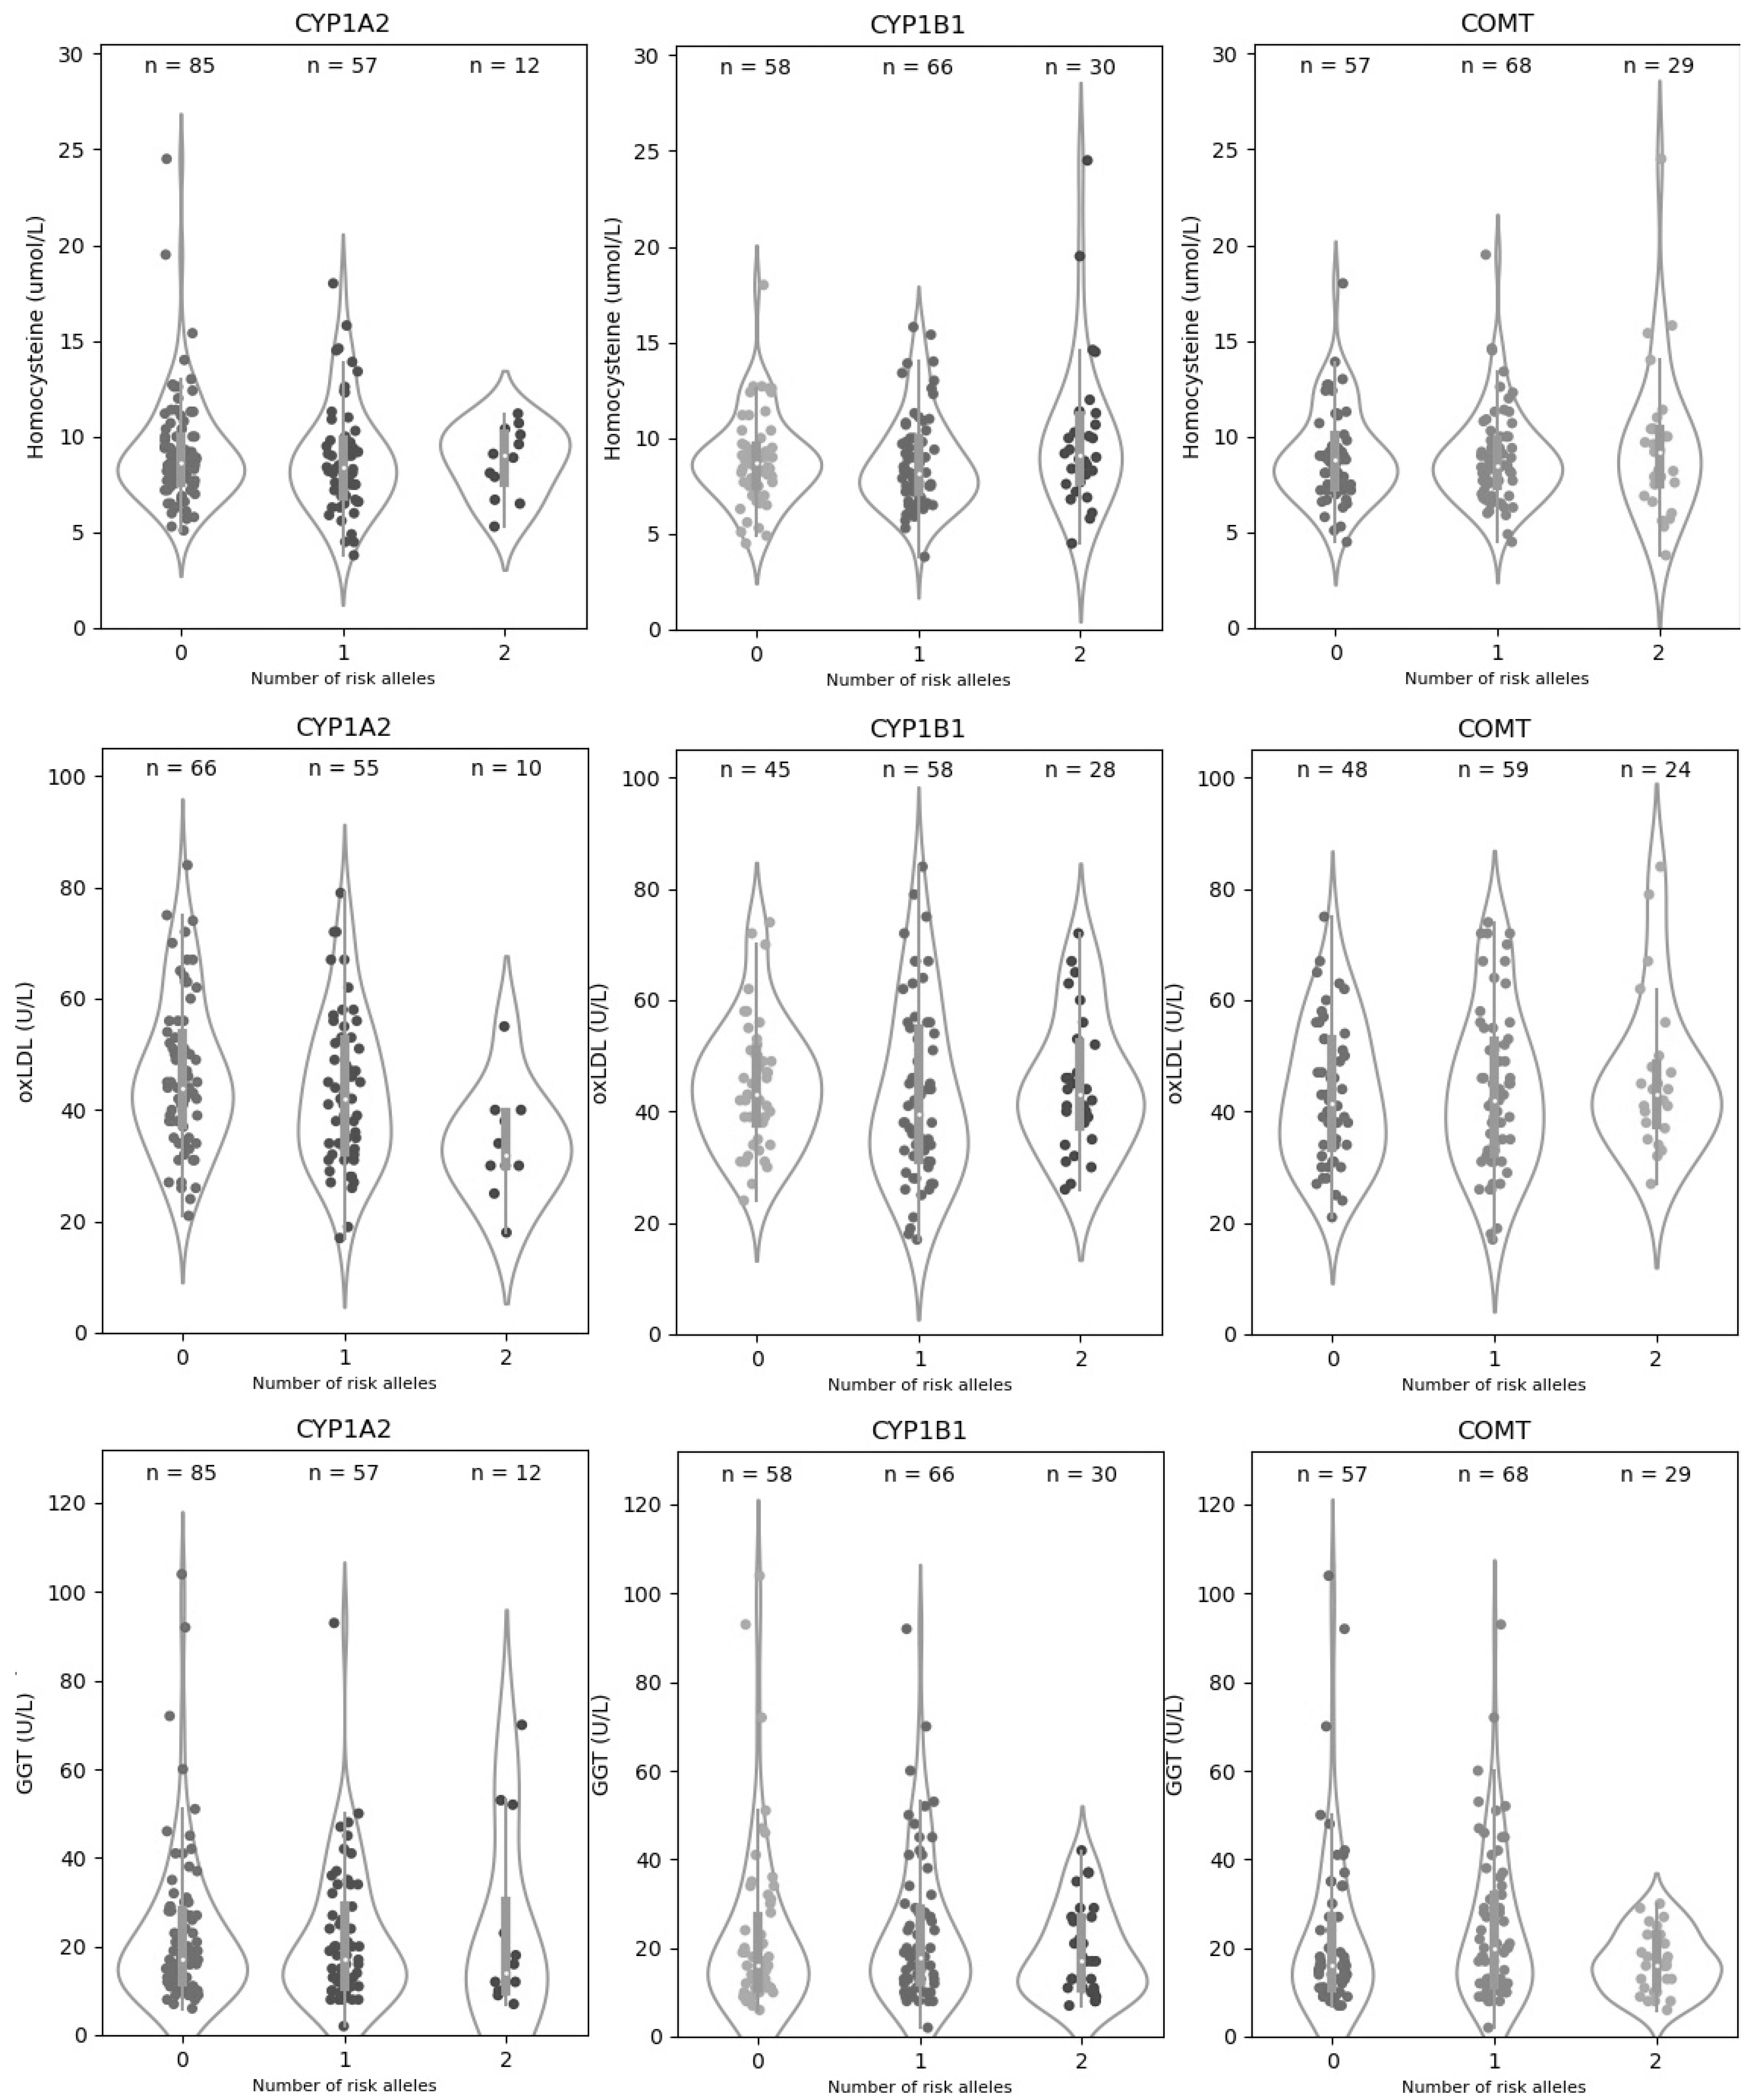
| CYP1A2|rs762551-C | CYP1B1|rs1056836-C | |||||||
|---|---|---|---|---|---|---|---|---|
| Genotype | Subjects (%) | Mean (SD) | p-Value | Genotype | Subjects (%) | Mean (SD) | p-Value | |
| Hcy | AA | 85 (55.2) | 9.21 (2.89) | 0.796 | GG | 58 (37.7) | 8.87 (2.34) | 0.232 |
| AC | 57 (37.0) | 8.91 (2.90) | CG | 66 (42.9) | 8.77 (2.46) | |||
| CC | 12 (7.8) | 8.71 (1.85) | CC | 30 (19.5) | 10.05 (4.02) | |||
| oxLDL | AA | 66 (50.4) | 46.21 (13.80) | 0.018 | GG | 45 (34.4) | 44.82 (11.52) | 0.459 |
| AC | 55 (42.0) | 43.23 (13.75) | CG | 58 (44.3) | 43.01 (16.12) | |||
| CC | 10 (7.6) | 34.00 (10.08) | CC | 28 (21.4) | 44.85 (12.29) | |||
| GGT | AA | 85 (55.2) | 22.58 (17.08) | 0.862 | GG | 58 (37.7) | 22.67 (19.29) | 0.555 |
| AC | 57 (37.0) | 21.86 (15.43) | CG | 66 (42.9) | 23.77 (16.82) | |||
| CC | 12 (7.8) | 24.33 (21.39) | CC | 30 (19.5) | 19.1 (9.95) | |||
| COMT|rs4680-A | Polygenic Risk Score | |||||||
| Genotype | Subjects (%) | Mean (SD) | p-Value | Genetic Risk | Subjects (%) | Mean (SD) | p-Value | |
| Hcy | GG | 57 (37.0) | 9.02 (2.49) | 0.853 | Low | 88 (57.14) | 8.79 (2.15) | 0.215 |
| AG | 68 (44.2) | 8.88 (2.46) | Medium | 45 (29.22) | 8.96 (2.84) | |||
| AA | 29 (18.8) | 9.54 (4.02) | High | 21 (13.64) | 10.40 (4.53) | |||
| oxLDL | GG | 48 (31.2) | 43.08 (12.81) | 0.728 | Low | 71 (54.20) | 45.92 (13.32) | 0.103 |
| AG | 59 (38.3) | 43.85 (14.59) | Medium | 40 (30.53) | 40.45 (13.72) | |||
| AA | 24 (15.6) | 46.38 (14.16) | High | 20 (15.27) | 44.50 (15.07) | |||
| GGT | GG | 57 (37.0) | 22.93 (19.36) | 0.23 | Low | 88 (57.14) | 24.00 (19.25) | 0.890 |
| AG | 68 (44.2) | 24.44 (17.04) | Medium | 45 (29.22) | 20.16 (12.15) | |||
| AA | 29 (18.8) | 16.83 (6.82) | High | 21 (13.64) | 20.86 (13.57) | |||
Publisher’s Note: MDPI stays neutral with regard to jurisdictional claims in published maps and institutional affiliations. |
© 2022 by the authors. Licensee MDPI, Basel, Switzerland. This article is an open access article distributed under the terms and conditions of the Creative Commons Attribution (CC BY) license (https://creativecommons.org/licenses/by/4.0/).
Share and Cite
Aronica, L.; Ordovas, J.M.; Volkov, A.; Lamb, J.J.; Stone, P.M.; Minich, D.; Leary, M.; Class, M.; Metti, D.; Larson, I.A.; et al. Genetic Biomarkers of Metabolic Detoxification for Personalized Lifestyle Medicine. Nutrients 2022, 14, 768. https://doi.org/10.3390/nu14040768
Aronica L, Ordovas JM, Volkov A, Lamb JJ, Stone PM, Minich D, Leary M, Class M, Metti D, Larson IA, et al. Genetic Biomarkers of Metabolic Detoxification for Personalized Lifestyle Medicine. Nutrients. 2022; 14(4):768. https://doi.org/10.3390/nu14040768
Chicago/Turabian StyleAronica, Lucia, Jose M. Ordovas, Andrey Volkov, Joseph J. Lamb, Peter Michael Stone, Deanna Minich, Michelle Leary, Monique Class, Dina Metti, Ilona A. Larson, and et al. 2022. "Genetic Biomarkers of Metabolic Detoxification for Personalized Lifestyle Medicine" Nutrients 14, no. 4: 768. https://doi.org/10.3390/nu14040768